Traffic Statistics Jan-Sep 2003 - Swiss
Traffic Statistics Jan-Sep 2003 - Swiss
Traffic Statistics Jan-Sep 2003 - Swiss

Create successful ePaper yourself
Turn your PDF publications into a flip-book with our unique Google optimized e-Paper software.
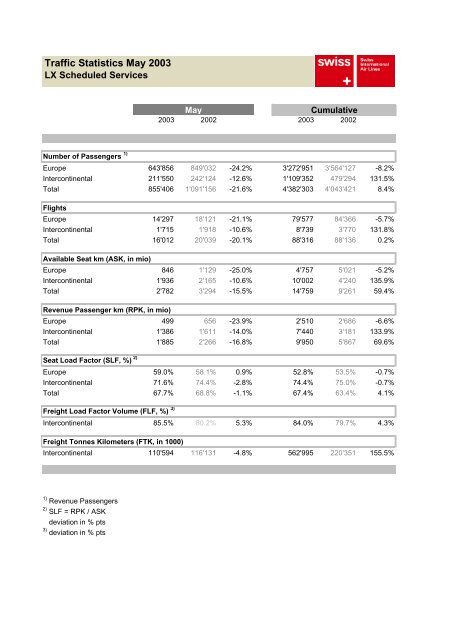
<strong>Traffic</strong> <strong>Statistics</strong> May <strong>2003</strong><br />
LX Scheduled Services<br />
May<br />
Cumulative<br />
<strong>2003</strong> 2002 <strong>2003</strong> 2002<br />
Number of Passengers 1)<br />
Europe 643'856 849'032 -24.2% 3'272'951 3'564'127 -8.2%<br />
Intercontinental 211'550 242'124 -12.6% 1'109'352 479'294 131.5%<br />
Total 855'406 1'091'156 -21.6% 4'382'303 4'043'421 8.4%<br />
Flights<br />
Europe 14'297 18'121 -21.1% 79'577 84'366 -5.7%<br />
Intercontinental 1'715 1'918 -10.6% 8'739 3'770 131.8%<br />
Total 16'012 20'039 -20.1% 88'316 88'136 0.2%<br />
Available Seat km (ASK, in mio)<br />
Europe 846 1'129 -25.0% 4'757 5'021 -5.2%<br />
Intercontinental 1'936 2'165 -10.6% 10'002 4'240 135.9%<br />
Total 2'782 3'294 -15.5% 14'759 9'261 59.4%<br />
Revenue Passenger km (RPK, in mio)<br />
Europe 499 656 -23.9% 2'510 2'686 -6.6%<br />
Intercontinental 1'386 1'611 -14.0% 7'440 3'181 133.9%<br />
Total 1'885 2'266 -16.8% 9'950 5'867 69.6%<br />
Seat Load Factor (SLF, %) 2)<br />
Europe 59.0% 58.1% 0.9% 52.8% 53.5% -0.7%<br />
Intercontinental 71.6% 74.4% -2.8% 74.4% 75.0% -0.7%<br />
Total 67.7% 68.8% -1.1% 67.4% 63.4% 4.1%<br />
Freight Load Factor Volume (FLF, %) 3)<br />
Intercontinental 85.5% 80.2% 5.3% 84.0% 79.7% 4.3%<br />
Freight Tonnes Kilometers (FTK, in 1000)<br />
Intercontinental 110'594 116'131 -4.8% 562'995 220'351 155.5%<br />
1) Revenue Passengers<br />
2) SLF = RPK / ASK<br />
deviation in % pts<br />
3) deviation in % pts