Traffic Statistics Jan-Sep 2003 - Swiss
Traffic Statistics Jan-Sep 2003 - Swiss
Traffic Statistics Jan-Sep 2003 - Swiss

Create successful ePaper yourself
Turn your PDF publications into a flip-book with our unique Google optimized e-Paper software.
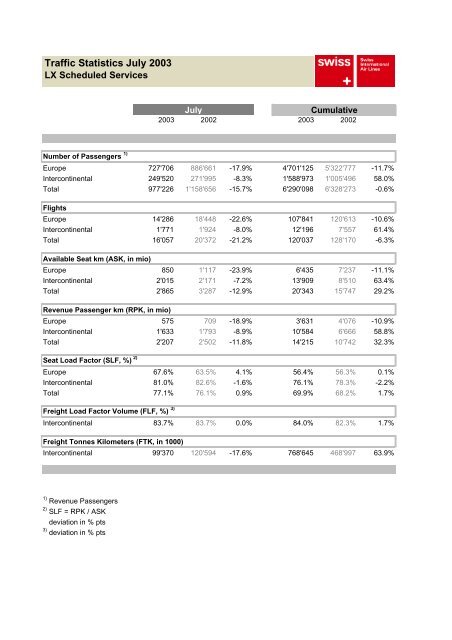
<strong>Traffic</strong> <strong>Statistics</strong> July <strong>2003</strong><br />
LX Scheduled Services<br />
July<br />
Cumulative<br />
<strong>2003</strong> 2002 <strong>2003</strong> 2002<br />
Number of Passengers 1)<br />
Europe 727'706 886'661 -17.9% 4'701'125 5'322'777 -11.7%<br />
Intercontinental 249'520 271'995 -8.3% 1'588'973 1'005'496 58.0%<br />
Total 977'226 1'158'656 -15.7% 6'290'098 6'328'273 -0.6%<br />
Flights<br />
Europe 14'286 18'448 -22.6% 107'841 120'613 -10.6%<br />
Intercontinental 1'771 1'924 -8.0% 12'196 7'557 61.4%<br />
Total 16'057 20'372 -21.2% 120'037 128'170 -6.3%<br />
Available Seat km (ASK, in mio)<br />
Europe 850 1'117 -23.9% 6'435 7'237 -11.1%<br />
Intercontinental 2'015 2'171 -7.2% 13'909 8'510 63.4%<br />
Total 2'865 3'287 -12.9% 20'343 15'747 29.2%<br />
Revenue Passenger km (RPK, in mio)<br />
Europe 575 709 -18.9% 3'631 4'076 -10.9%<br />
Intercontinental 1'633 1'793 -8.9% 10'584 6'666 58.8%<br />
Total 2'207 2'502 -11.8% 14'215 10'742 32.3%<br />
Seat Load Factor (SLF, %) 2)<br />
Europe 67.6% 63.5% 4.1% 56.4% 56.3% 0.1%<br />
Intercontinental 81.0% 82.6% -1.6% 76.1% 78.3% -2.2%<br />
Total 77.1% 76.1% 0.9% 69.9% 68.2% 1.7%<br />
Freight Load Factor Volume (FLF, %) 3)<br />
Intercontinental 83.7% 83.7% 0.0% 84.0% 82.3% 1.7%<br />
Freight Tonnes Kilometers (FTK, in 1000)<br />
Intercontinental 99'370 120'594 -17.6% 768'645 468'997 63.9%<br />
1) Revenue Passengers<br />
2) SLF = RPK / ASK<br />
deviation in % pts<br />
3) deviation in % pts