Traffic Statistics Jan-Sep 2003 - Swiss
Traffic Statistics Jan-Sep 2003 - Swiss
Traffic Statistics Jan-Sep 2003 - Swiss

You also want an ePaper? Increase the reach of your titles
YUMPU automatically turns print PDFs into web optimized ePapers that Google loves.
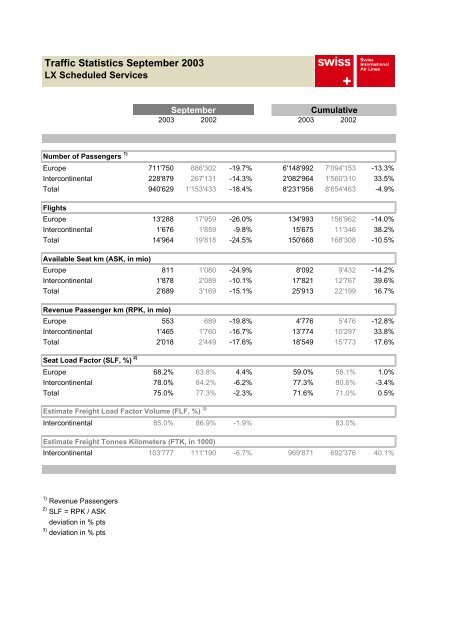
<strong>Traffic</strong> <strong>Statistics</strong> <strong>Sep</strong>tember <strong>2003</strong><br />
LX Scheduled Services<br />
<strong>Sep</strong>tember<br />
Cumulative<br />
<strong>2003</strong> 2002 <strong>2003</strong> 2002<br />
Number of Passengers 1)<br />
Europe 711'750 886'302 -19.7% 6'148'992 7'094'153 -13.3%<br />
Intercontinental 228'879 267'131 -14.3% 2'082'964 1'560'310 33.5%<br />
Total 940'629 1'153'433 -18.4% 8'231'956 8'654'463 -4.9%<br />
Flights<br />
Europe 13'288 17'959 -26.0% 134'993 156'962 -14.0%<br />
Intercontinental 1'676 1'859 -9.8% 15'675 11'346 38.2%<br />
Total 14'964 19'818 -24.5% 150'668 168'308 -10.5%<br />
Available Seat km (ASK, in mio)<br />
Europe 811 1'080 -24.9% 8'092 9'432 -14.2%<br />
Intercontinental 1'878 2'089 -10.1% 17'821 12'767 39.6%<br />
Total 2'689 3'169 -15.1% 25'913 22'199 16.7%<br />
Revenue Passenger km (RPK, in mio)<br />
Europe 553 689 -19.8% 4'776 5'476 -12.8%<br />
Intercontinental 1'465 1'760 -16.7% 13'774 10'297 33.8%<br />
Total 2'018 2'449 -17.6% 18'549 15'773 17.6%<br />
Seat Load Factor (SLF, %) 2)<br />
Europe 68.2% 63.8% 4.4% 59.0% 58.1% 1.0%<br />
Intercontinental 78.0% 84.2% -6.2% 77.3% 80.6% -3.4%<br />
Total 75.0% 77.3% -2.3% 71.6% 71.0% 0.5%<br />
Estimate Freight Load Factor Volume (FLF, %) 3)<br />
Intercontinental 85.0% 86.9% -1.9% 83.0%<br />
Estimate Freight Tonnes Kilometers (FTK, in 1000)<br />
Intercontinental 103'777 111'190 -6.7% 969'871 692'376 40.1%<br />
1) Revenue Passengers<br />
2) SLF = RPK / ASK<br />
deviation in % pts<br />
3) deviation in % pts