Traffic Statistics Jan-Sep 2003 - Swiss
Traffic Statistics Jan-Sep 2003 - Swiss
Traffic Statistics Jan-Sep 2003 - Swiss

Create successful ePaper yourself
Turn your PDF publications into a flip-book with our unique Google optimized e-Paper software.
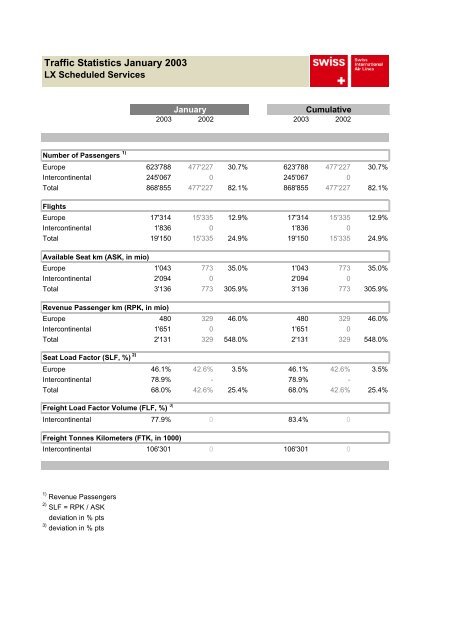
<strong>Traffic</strong> <strong>Statistics</strong> <strong>Jan</strong>uary <strong>Jan</strong>uary 2002 <strong>2003</strong><br />
LX Scheduled Services<br />
<strong>Jan</strong>uary<br />
Cumulative<br />
<strong>2003</strong> 2002 <strong>2003</strong> 2002<br />
Number of Passengers 1)<br />
Europe 623'788 477'227 30.7% 623'788 477'227 30.7%<br />
Intercontinental 245'067 0 245'067 0<br />
Total 868'855 477'227 82.1% 868'855 477'227 82.1%<br />
Flights<br />
Europe 17'314 15'335 12.9% 17'314 15'335 12.9%<br />
Intercontinental 1'836 0 1'836 0<br />
Total 19'150 15'335 24.9% 19'150 15'335 24.9%<br />
Available Seat km (ASK, in mio)<br />
Europe 1'043 773 35.0% 1'043 773 35.0%<br />
Intercontinental 2'094 0 2'094 0<br />
Total 3'136 773 305.9% 3'136 773 305.9%<br />
Revenue Passenger km (RPK, in mio)<br />
Europe 480 329 46.0% 480 329 46.0%<br />
Intercontinental 1'651 0 1'651 0<br />
Total 2'131 329 548.0% 2'131 329 548.0%<br />
Seat Load Factor (SLF, %) 2)<br />
Europe 46.1% 42.6% 3.5% 46.1% 42.6% 3.5%<br />
Intercontinental 78.9% - 78.9% -<br />
Total 68.0% 42.6% 25.4% 68.0% 42.6% 25.4%<br />
Freight Load Factor Volume (FLF, %) 3)<br />
Intercontinental 77.9% 0 83.4% 0<br />
Freight Tonnes Kilometers (FTK, in 1000)<br />
Intercontinental 106'301 0 106'301 0<br />
1) Revenue Passengers<br />
2) SLF = RPK / ASK<br />
deviation in % pts<br />
3) deviation in % pts