2009 Full Year & 2010 First Quarter Result Presentation - Access Bank
2009 Full Year & 2010 First Quarter Result Presentation - Access Bank
2009 Full Year & 2010 First Quarter Result Presentation - Access Bank

You also want an ePaper? Increase the reach of your titles
YUMPU automatically turns print PDFs into web optimized ePapers that Google loves.
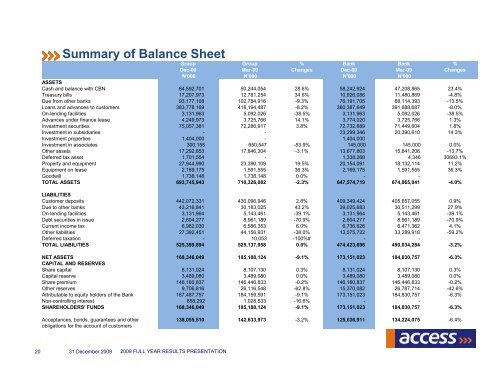
Summary of Balance Sheet<br />
Group Group % <strong>Bank</strong> <strong>Bank</strong> %<br />
Dec-09 Mar-09 Changes Dec-09 Mar-09 Changes<br />
N'000 N'000 N'000 N'000<br />
ASSETS<br />
Cash and balance with CBN 64,592,701 50,244,054 28.6% 58,242,924 47,208,865 23.4%<br />
Treasury bills 17,207,973 12,781,254 34.6% 10,926,086 11,480,869 -4.8%<br />
Due from other banks 93,177,108 102,784,916 -9.3% 76,191,705 88,114,393 -13.5%<br />
Loans and advances to customers 383,778,169 418,194,487 -8.2% 360,387,649 391,688,687 -8.0%<br />
On-lending facilities 3,131,963 5,092,026 -38.5% 3,131,963 5,092,026 -38.5%<br />
Advances under finance lease 4,249,973 3,725,766 14.1% 3,774,020 3,725,766 1.3%<br />
Investment securities 75,057,381 72,286,917 3.8% 72,732,689 71,449,604 1.8%<br />
Investment in subsidiaries - - 23,299,346 20,390,610 14.3%<br />
Investment properties 1,404,000 - 1,404,000 -<br />
Investment in associates 300,155 650,547 -53.9% 145,000 145,000 0.0%<br />
Other assets 17,292,653 17,846,304 -3.1% 13,677,803 15,841,206 -13.7%<br />
Deferred tax asset 1,701,554 - 1,338,268 4,346 30693.1%<br />
Property and equipment 27,944,990 23,390,109 19.5% 20,154,091 18,132,114 11.2%<br />
Equipment on lease 2,169,175 1,591,555 36.3% 2,169,175 1,591,555 36.3%<br />
Goodwill 1,738,148 1,738,148 0.0% - -<br />
TOTAL ASSETS 693,745,943 710,326,082 -2.3% 647,574,719 674,865,041 -4.0%<br />
LIABILITIES<br />
Customer deposits 442,072,331 430,096,946 2.8% 409,349,424 405,657,055 0.9%<br />
Due to other banks 43,216,841 30,183,025 43.2% 39,025,683 30,511,299 27.9%<br />
On-lending facilities 3,131,964 5,143,461 -39.1% 3,131,964 5,143,461 -39.1%<br />
Debt securities in issue 2,604,277 8,961,189 -70.9% 2,604,277 8,961,189 -70.9%<br />
Current income tax 6,982,030 6,586,353 6.0% 6,736,626 6,471,362 4.1%<br />
Other liabilities 27,392,451 44,156,931 -38.0% 13,575,722 33,289,918 -59.2%<br />
Deferred taxation - 10,053 -100%# - -<br />
TOTAL LIABILITIES 525,399,894 525,137,958 0.0% 474,423,696 490,034,284 -3.2%<br />
NET ASSETS 168,346,049 185,188,124 -9.1% 173,151,023 184,830,757 -6.3%<br />
CAPITAL AND RESERVES<br />
Share capital 8,131,024 8,107,130 0.3% 8,131,024 8,107,130 0.3%<br />
Capital reserve 3,489,080 3,489,080 0.0% 3,489,080 3,489,080 0.0%<br />
Share premium 146,160,837 146,446,833 -0.2% 146,160,837 146,446,833 -0.2%<br />
Other reserves 9,706,816 26,116,548 -62.8% 15,370,082 26,787,714 -42.6%<br />
Attributable to equity holders of the <strong>Bank</strong> 167,487,757 184,159,591 -9.1% 173,151,023 184,830,757 -6.3%<br />
Non-controlling interest 858,292 1,028,533 -16.6% - -<br />
SHAREHOLDERS' FUNDS 168,346,049 185,188,124 -9.1% 173,151,023 184,830,757 -6.3%<br />
Acceptances, bonds, guarantees and other<br />
obligations for the account of customers<br />
138,055,510 142,633,973 -3.2% 125,636,911 134,224,075 -6.4%<br />
20<br />
31 December <strong>2009</strong> <strong>2009</strong> FULL YEAR RESULTS PRESENTATION