
Create successful ePaper yourself
Turn your PDF publications into a flip-book with our unique Google optimized e-Paper software.
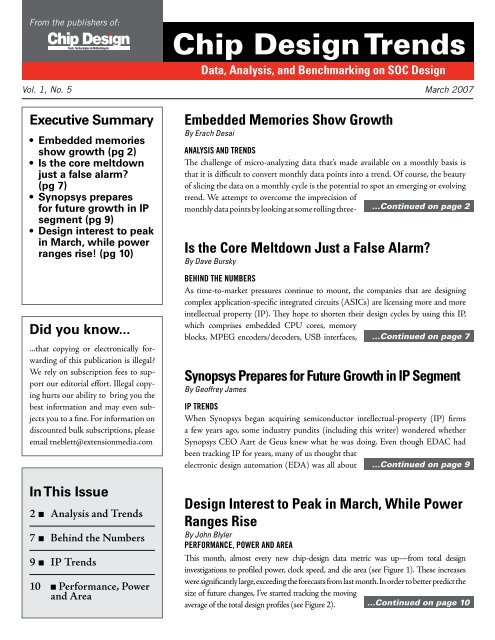
From the publishers of:<br />
<strong>Chip</strong> <strong>Design</strong> <strong>Trends</strong><br />
Data, Analysis, and Benchmarking on SOC <strong>Design</strong><br />
Vol. 1, No. 5 March 2007<br />
Executive Summary<br />
• Embedded memories<br />
show growth (pg 2)<br />
• Is the core meltdown<br />
just a false alarm?<br />
(pg 7)<br />
• <strong>Synopsys</strong> prepares<br />
for future growth in IP<br />
segment (pg 9)<br />
• <strong>Design</strong> interest to peak<br />
in March, while power<br />
ranges rise! (pg 10)<br />
Did you know...<br />
...that copying or electronically forwarding<br />
of this publication is illegal?<br />
We rely on subscription fees to support<br />
our editorial effort. Illegal copying<br />
hurts our ability to bring you the<br />
best information and may even subjects<br />
you to a fine. For information on<br />
discounted bulk subscriptions, please<br />
email tneblett@extensionmedia.<strong>com</strong><br />
In This Issue<br />
2 ■ Analysis and <strong>Trends</strong><br />
7 ■ Behind the Numbers<br />
9 ■ IP <strong>Trends</strong><br />
10 ■ Performance, Power<br />
and Area<br />
Embedded Memories Show Growth<br />
By Erach Desai<br />
Analysis and trends<br />
The challenge of micro-analyzing data that’s made available on a monthly basis is<br />
that it is difficult to convert monthly data points into a trend. Of course, the beauty<br />
of slicing the data on a monthly cycle is the potential to spot an emerging or evolving<br />
trend. We attempt to over<strong>com</strong>e the imprecision of<br />
monthly data points by looking at some rolling three- ...Continued on page 2<br />
Is the Core Meltdown Just a False Alarm?<br />
By Dave Bursky<br />
behind the numbers<br />
As time-to-market pressures continue to mount, the <strong>com</strong>panies that are designing<br />
<strong>com</strong>plex application-specific integrated circuits (ASICs) are licensing more and more<br />
intellectual property (IP). They hope to shorten their design cycles by using this IP,<br />
which <strong>com</strong>prises embedded CPU cores, memory<br />
blocks, MPEG encoders/decoders, USB interfaces, ...Continued on page 7<br />
<strong>Synopsys</strong> Prepares for Future Growth in IP Segment<br />
By Geoffrey James<br />
IP <strong>Trends</strong><br />
When <strong>Synopsys</strong> began acquiring semiconductor intellectual-property (IP) firms<br />
a few years ago, some industry pundits (including this writer) wondered whether<br />
<strong>Synopsys</strong> CEO Aart de Geus knew what he was doing. Even though EDAC had<br />
been tracking IP for years, many of us thought that<br />
electronic design automation (EDA) was all about ...Continued on page 9<br />
<strong>Design</strong> Interest to Peak in March, While Power<br />
Ranges Rise<br />
By John Blyler<br />
Performance, power and area<br />
This month, almost every new chip-design data metric was up—from total design<br />
investigations to profiled power, clock speed, and die area (see Figure 1). These increases<br />
were significantly large, exceeding the forecasts from last month. In order to better predict the<br />
size of future changes, I’ve started tracking the moving<br />
average of the total design profiles (see Figure 2).<br />
...Continued on page 10
© 2007 Extension Media. All rights reserved.<br />
Analysis and <strong>Trends</strong><br />
...Continued from page 1<br />
month data. <strong>Design</strong> activity has nicely<br />
bounced off some more-than-seasonally<br />
weak levels last fall. Yet the year-over-year<br />
trends are still negative (albeit less so).<br />
The current issue of <strong>Chip</strong> <strong>Design</strong> <strong>Trends</strong><br />
reflects data that has been accumulated<br />
through the month of January 2007. We’re<br />
now tracking more than 41,000 unique<br />
design investigations: system-on-a-chip<br />
(SoC) design experiments, but not actual<br />
design starts per se. We believe that the end<br />
product of this rich and unique set of data is<br />
a fairly accurate representation of how new,<br />
<strong>com</strong>plex, application-specific-integratedcircuit<br />
(ASIC) design starts are trending.<br />
In addition to tracking <strong>com</strong>plexity across<br />
a variety of metrics (as we have been<br />
for the past three months), the current<br />
issue of <strong>Chip</strong> <strong>Design</strong> <strong>Trends</strong> dives into<br />
data for random-logic gate count and<br />
embedded-memory megabits. Our goal<br />
is to ascertain whether there’s a bigger<br />
picture to be gleaned. In this issue, we also<br />
have continued to drill down on the usage<br />
of processor intellectual-property (IP)<br />
central-processing-unit (CPU) cores.<br />
First, let’s drill down into the overall and<br />
geographic data. Figure 1 summarizes<br />
the data and analysis for SoC designinvestigation<br />
activity by geography. Recall<br />
that we look at three-month rolling data<br />
to arrive at some more tangible yearover-year<br />
and sequential trends. The key<br />
observations based on Figure 1 are:<br />
• The rate of decline in total SoC<br />
design investigations was the best<br />
in five months. Nonetheless, design<br />
investigations for the three months<br />
ending in January 2007 declined<br />
by 18% <strong>com</strong>pared to a year ago. On<br />
Three Months Ending Oct. ' 05 Jan. '06 Oct. '06 Jan. '07<br />
N. America – <strong>Design</strong> Investigations 3,923 4,027 1,659 2,723<br />
Year-over-year change -58% -32%<br />
Sequential change +16% +3% -45% +64%<br />
Europe – <strong>Design</strong> Investigations 1,472 968 920 671<br />
Year-over-year change -38% -31%<br />
Sequential change +82% -34% -23% -27%<br />
Asia – <strong>Design</strong> Investigations 740 666 722 995<br />
Year-over-year change -2% +49%<br />
Sequential change -8% -10% -38% +38%<br />
RoW – <strong>Design</strong> Investigations 166 86 180 326<br />
Year-over-year change -45% +136%<br />
Sequential change -27% -48% +109% +81%<br />
Total – <strong>Design</strong> Investigations 6,301 5,747 3,481 4,715<br />
Year-over-year change -45% -18%<br />
Sequential change +20% -9% -36% +35%<br />
Figure 1: The rate of year-over-year declines is moderating.<br />
a sequential basis, however, SoC<br />
design activity was up sharply by<br />
35%. Keep in mind that this rise<br />
was off of very weak levels for the<br />
three months ending October 2006.<br />
• Not surprisingly, trends in North<br />
America continued to largely<br />
mirror the overall trends, with the<br />
actual percentage changes being<br />
worse than the overall numbers.<br />
Despite the nice sequential uptick,<br />
we continue to be baffled by the<br />
32% year-over-year decline.<br />
• With the January 2007 data, Europe<br />
and Asia went in different directions.<br />
European design activity got worse<br />
on both counts (sequential and year<br />
over year), while Asia swung back<br />
strongly on both counts.<br />
• <strong>Design</strong> activity in the rest-of-world<br />
(RoW) regions, as collected in our<br />
data-set, continued to grow on a<br />
gangbuster scale. However, the<br />
rest-of-world regions were about<br />
6% of overall design activity for<br />
January 2007 <strong>com</strong>pared to just<br />
under 8% for December 2006.<br />
• March 2007<br />
<strong>Chip</strong> <strong>Design</strong> <strong>Trends</strong>
© 2007 Extension Media. All rights reserved.<br />
Let’s score a point for the nice sequential<br />
turnaround in the rolling three-month<br />
data for January 2007. At the same time,<br />
though, we must continue to mentally<br />
note the year-over-year decline in overall<br />
activity, which remains problematic to<br />
explain away.<br />
At first blush, it appears that the sharp<br />
uptick in the under-50-mm2 die-size<br />
range largely contributed to bringing the<br />
average die size back toward 30 mm2.<br />
Recall that we were optimistic last month<br />
when there appeared to be a trend toward<br />
slightly higher average die sizes.<br />
Figure 2: Average die size is hovering around 35 mm2.<br />
After we take our customary look at the<br />
monthly cut of data by process technology<br />
node, we will digress (pertinently) and<br />
look at some die-size data by technology<br />
node. For now, Figure 2 doesn’t provide<br />
much weight in the case for more <strong>com</strong>plex<br />
designs.<br />
In Figure 3, we capture the monthly trends<br />
in SoC design experiments by process<br />
technology node layered with the weighted<br />
average of process node. After a solid four<br />
consecutive months of lower average<br />
process nodes (and headed toward 110<br />
nm), the trend was derailed by the spike in<br />
250-nm design activity. These intertwined<br />
developments don’t augur well for a move<br />
toward more <strong>com</strong>plex design activity.<br />
In recent months, we also have been<br />
collecting die-size data on a per-processnode<br />
basis. For this issue, we decided to<br />
take a further look under the hood (so to<br />
speak) to see if we could divine a deeper<br />
understanding.<br />
In Figure 4, we’ve juxtapositioned die-size<br />
trends for 130 and 90 nm going back about<br />
a year. For these sub-graphs, we <strong>com</strong>puted<br />
a “raw” average for die size. Although this<br />
is still a weighted average, it isn’t as finely<br />
calculated as the averages that we plot on<br />
Figure 3: The average process node was derailed by a spike in 250-nm activity.<br />
other graphs in our analysis. Curiously,<br />
the moving average trend lines for both<br />
process nodes seem to show similar<br />
characteristics. (The 130-nm node does,<br />
however, have a few more years of “learning<br />
curve” built into it.) At these leading-edge<br />
production nodes, it does seem that a<br />
50 mm2 of die size is the manufacturing<br />
“sweet spot.” Although the average die size<br />
in Figure 2 may be drifting around 30<br />
mm2, the leading-edge production nodes<br />
are behaving as one would expect.<br />
Figure 5 captures the frequency of design<br />
investigations by the targeted number of<br />
metal interconnect layers deployed for<br />
leading-edge SoC designs. To look past<br />
the gyrations in the weighted average,<br />
we focus our attention on the six-month<br />
trailing average. Consistent with the past<br />
few months, we observe that we’re hovering<br />
in the 6.3 to 6.4 layers-of-interconnect<br />
range.<br />
One interesting sub-plot is that the number<br />
of 6LM design experiments bounced back<br />
sequentially in January 2007. It exceeded<br />
the number of 8LM designs.<br />
Figure 6 graphs the average for the highest<br />
targeted clock speed for each SoC design<br />
experiment tracked by our data. The<br />
average had rebounded nicely for two<br />
consecutive months only to drop back to<br />
about 200 MHz for January 2007. Despite<br />
extending the trailing average from four<br />
www.chipdesignmag.<strong>com</strong>/trends<br />
March 2007 •
© 2007 Extension Media. All rights reserved.<br />
to six months, the trend line still doesn’t<br />
depict any specific pattern or anticipated<br />
behavior.<br />
Previously, we’ve observed that a trend<br />
line of modestly higher clock speeds<br />
would support a thesis of more <strong>com</strong>plex<br />
SoC designs—as long as the highest<br />
clock speeds don’t spike up too much.<br />
Unfortunately, neither the average nor<br />
the moving average line up to provide any<br />
credence to this thesis. One intriguing<br />
development, however, is that the 100-<br />
to-250-MHz clock-speed range narrowly<br />
edged out the
© 2007 Extension Media. All rights reserved.<br />
bits by month. Our key observations are<br />
pretty much analogous to what we saw for<br />
gate-count usage:<br />
1. The under-1.0-Mbit category<br />
is predominant by design<br />
experiments.<br />
2. The 1.0-to-2.5-Mbit and 2.5-to-<br />
5.0-Mbit ranges have been picking<br />
up steam in recent months.<br />
Furthermore, the weighted-average trend<br />
line for embedded-memory usage has<br />
pretty much flatlined around 2.0 Mbits.<br />
Again, one would think that rising<br />
<strong>com</strong>plexity would feature a slightly “up<br />
and to the right” trend line. We shall<br />
continue to monitor for any changes going<br />
forward.<br />
A Continuing Look at CPU<br />
Semiconductor IP<br />
Figure 10 captures the use of multiple<br />
semiconductor-IP cores (non-memory)<br />
on a monthly basis. Given macro trends<br />
and intuitive logic, one would expect the<br />
trend line for multiple semiconductor-IP<br />
cores to be steadily increasing over time.<br />
With a sharp rise in various multi-IP-core<br />
instances, though, the weighted average<br />
jumped sharply for January 2007. We<br />
trust that this is a directional sign that is<br />
sustained rather than some sort of “catch<br />
up” in our monthly aggregated data set.<br />
Figure 11 dives into a second layer of<br />
detail: the use of unique CPU-core<br />
instances on a monthly basis layered with<br />
our weighted average trend line. In recent<br />
months, the data continues to show a slow<br />
but steady move toward one unique CPU<br />
core instance per design. Yet the average<br />
seems to be slowly nudging higher, which<br />
is what we would like to see. The fact that<br />
the average in recent months is still well<br />
below year-ago levels remains somewhat<br />
inexplicable at this juncture. (See Dave<br />
Bursky's section for more details).<br />
Figure 6: There is a lack of any trend-line in the highest clock speed.<br />
Figure 7: Total I/O signals are settling around 300.<br />
Figure 8: The average gate count is hovering between 2 and 3 million gates.<br />
www.chipdesignmag.<strong>com</strong>/trends<br />
March 2007 •
© 2007 Extension Media. All rights reserved.<br />
Conclusion: Complexity Rising,<br />
but Activity Moderating<br />
Overall design activity for the month<br />
of January 2007 continued to show<br />
sequential improvement from the depths<br />
that were reached in the fall of 2006. It<br />
appears, however, that we had a surge in<br />
activity at the 250-nm node. This surge<br />
didn’t necessarily help our various metrics<br />
of design <strong>com</strong>plexity: die size, process<br />
node, interconnect layers, highest clock<br />
speed, and pin counts.<br />
In this issue, we introduced graphs that<br />
captured <strong>com</strong>plexity based on gatecount<br />
and embedded-memory usage. In<br />
isolation, both metrics were somewhat<br />
disappointing in that they depicted<br />
relatively flattish behavior for the averages.<br />
The one consolation factor, which adds<br />
some credibility to the <strong>com</strong>plexity<br />
equation, was the apparent surge in nonmemory<br />
semiconductor-IP instances.<br />
Specifically, this surge was in unique<br />
CPU-core instances.<br />
In summary, the monthly data continues<br />
to be engaging in that it is dynamic with<br />
many moving parts. At the same time, it’s<br />
hard to decipher meaningful trends from<br />
monthly data points. Clearly, we don’t<br />
have all of the answers or the relevant<br />
explanations for the fluctuations in various<br />
data points (and con<strong>com</strong>itant weighted<br />
average trend lines).<br />
Figure 9: Average embedded memory is currently in the 2.0-Mbit range.<br />
Figure 10: Is there a spike or “catch up” in the usage of multiple cores?<br />
Erach Desai, Chief Analyst, <strong>Chip</strong> <strong>Design</strong><br />
<strong>Trends</strong><br />
Figure 11: Is this the beginning of an uptrend in the number of CPU cores per design?<br />
• March 2007<br />
<strong>Chip</strong> <strong>Design</strong> <strong>Trends</strong>
© 2007 Extension Media. All rights reserved.<br />
Behind the Numbers<br />
...Continued from page 1<br />
Ethernet ports, and more. Yet in the<br />
consumer market in particular, products<br />
tend to have short lives. As a result, designers<br />
are looking for ways to extend the life of the<br />
ASIC solutions that they’re crafting.<br />
One approach that’s being adopted by many<br />
<strong>com</strong>panies is to embed programmable CPU<br />
cores, which can be programmed to handle<br />
specific tasks. In last month’s issue of <strong>Chip</strong><br />
<strong>Design</strong> <strong>Trends</strong>, Erach Dasai’s analysis<br />
did note a decline in the use of embedded<br />
processor cores. Yet that decline may be a<br />
temporary market condition. It also could<br />
be a conclusion based on an interpretation<br />
of the data with which the semiconductor<br />
intellectual-property vendors don’t agree. “It’s<br />
very hard to really calculate the use of CPU<br />
cores,” explains Richard Wawrzyniak, Senior<br />
Analyst for ASICs at Semico Research<br />
Corp., a market research <strong>com</strong>pany based<br />
in Phoenix, Ariz. “There are many ways of<br />
counting the cores and what, for example,<br />
constitutes a CPU versus a dedicated<br />
processor for audio or video.”<br />
That view is echoed by Steve Liebson, the<br />
Technology Evangelist at Tensilica Inc., a<br />
provider of CPU-core IP in Santa Clara,<br />
Calif. “Tensilica provides generic CPU cores<br />
that the customer can configure as well as a<br />
few application-optimized cores, which are<br />
dedicated to audio and video processing, in<br />
its recently released Diamond series. These<br />
application-optimized cores are based<br />
on the <strong>com</strong>pany’s Xtensa CPU core, but<br />
include application-specific instructions to<br />
handle specific audio or video operations.<br />
The question is, do these cores get counted<br />
as CPU cores or as function-specific blocks<br />
of IP?” There is no absolute answer and<br />
thus each analyst may interpret the data<br />
differently.<br />
Figure 1. ASIC designs are transitioning from the use of a single control processor (a la<br />
the 1990s) to the use of distributed processing power in today’s <strong>com</strong>plex SoC designs<br />
(source: Tensilica Inc.).<br />
The traditional view of the ASIC or systemon-a-chip<br />
approach has changed over the last<br />
decade, explains Steve Roddy, Tensilica’s Vice<br />
President of Marketing. In 1997, the <strong>com</strong>mon<br />
approach included a general control processor<br />
and dedicated hardwired logic to perform<br />
audio, video, and other support functions.<br />
In 2007, however, the small features used<br />
in today’s processes allow very area-efficient<br />
and high-performance CPU cores to be used<br />
to perform many tasks that were previously<br />
done by hardwired logic (see Figure 1).<br />
Each processing block can execute its own<br />
firmware, thereby allowing designers to<br />
change or enhance the functions in each block<br />
independently just by changing the firmware.<br />
This approach eliminates costly silicon respins<br />
and can even allow field upgrades.<br />
In another example of core counting,<br />
ARM Ltd. of Cambridge, England offers<br />
its AMR11MP core, explains Dave Steer,<br />
Director of Segment Marketing. “This core<br />
actually includes anywhere from one to four<br />
CPUs, but is treated as a single block of IP.<br />
But how does it get counted—as a single core<br />
or as multiple cores? The debate will continue<br />
for years as to how to count such blocks<br />
of IP.” While also looking at parallel CPU<br />
approaches, designers at ARC International<br />
have developed single-instruction/multipledata<br />
blocks of IP based on its ARC750<br />
processor core. The <strong>com</strong>pany also offers<br />
several application-optimized cores targeted<br />
at media-processing and audio applications.<br />
What ARM does see, though, is an increase in<br />
the number of instances of its processor being<br />
used on new ASIC designs. “The small size<br />
and low power of the latest cores in the Cortex<br />
family, for example, allow designers to use<br />
multiple cores—each tackling an independent<br />
task on the ASIC. By using programmable<br />
cores, designers can also ‘future-proof ’ their<br />
ASIC silicon since changes to the firmware<br />
that executes on these deeply embedded<br />
CPUs can be downloaded to upgrade the<br />
functionality or fix a bug.”<br />
ARM also has been enjoying an increase<br />
in the number of new licensees—although<br />
that rate of increase has slowed since the<br />
<strong>com</strong>pany already has licenses with most<br />
major <strong>com</strong>panies, said Steer. The quarterby-quarter<br />
results for the last three quarters<br />
of 2006, for example, show increases in the<br />
total number of licenses of 21, 14, and 15<br />
for Q2, Q3, and Q4, respectively (see Figure<br />
2). These licenses are split between new<br />
licenses, derivative licenses, and upgrades<br />
of existing licenses. ARM splits these<br />
numbers even finer by looking at multi-use,<br />
www.chipdesignmag.<strong>com</strong>/trends<br />
March 2007 •
© 2007 Extension Media. All rights reserved.<br />
Figure 2. The continuing growth in new-processor IP licenses<br />
at ARM Ltd. shows a decrease in new licenses in the last<br />
two quarters. But many customers are taking out additional<br />
licenses for the <strong>com</strong>pany’s next-generation cores.<br />
per-use, and term licenses (not shown).<br />
According to Steer, about one-third are<br />
new licensees. About one-quarter of all the<br />
new licenses are from customers upgrading<br />
their existing license arrangements to use<br />
some of the new-generation cores to either<br />
replace the older cores or to use them in<br />
conjunction with the older cores.<br />
Another IP provider experiencing an<br />
increase in licenses, MIPS Technologies<br />
Inc., has seen its licensing revenue increase<br />
about 13% quarter over quarter with nine<br />
new license agreements and seven new<br />
customers. The <strong>com</strong>pany’s totals are now 117<br />
licensed customers and almost 200 license<br />
agreements. In its fiscal second quarter of<br />
2007, the <strong>com</strong>pany recorded shipments of<br />
89 million units—up 36% year over year—<br />
with a total of 330 million units shipped in<br />
the prior four quarters. It also is seeing strong<br />
acceptance of the MIPS32 24K family cores,<br />
which now have 33 licensees.<br />
The use of multicore architectures also<br />
has exploded in the entertainment market.<br />
Each of the latest game consoles employs a<br />
multicore solution. Microsoft’s Xbox360<br />
and the Nintendo Wii both have processors<br />
with multiple PowerPC cores, while the<br />
Sony PS3 has a processor with up to nine<br />
cores (a Power processor and<br />
eight identical programmable<br />
single-instruction/multipledata<br />
processing engines).<br />
Cell phones also are moving<br />
to multiple-CPU-core<br />
solutions. ARM already<br />
estimates that on average,<br />
there are about 1.5 ARM<br />
processors in each cell phone.<br />
As the phones include more<br />
and more functionality,<br />
they’ll have to include more<br />
processors.<br />
In such handheld<br />
applications, power<br />
consumption is a major concern. <strong>Chip</strong> power<br />
is directly related to operating frequency. As<br />
a result, the lower the frequency, the lower<br />
the power consumption and thus the longer<br />
the battery life. One approach to adding<br />
more functionality leverages the fact that by<br />
running a processor faster, it can do more. In<br />
battery-powered systems, however, the result<br />
is diminishing returns. The higher speed<br />
translates into higher power consumption<br />
and thus shorter battery life. The solution<br />
<strong>com</strong>es from the old military tactic referred<br />
to as “divide and conquer:” Use multiple<br />
“slower” CPU cores to divide the <strong>com</strong>pute<br />
tasks into smaller blocks. Running the CPUs<br />
slower reduces the power consumption. For<br />
example, two cores running at 100 MHz<br />
use less power than one core running at 200<br />
MHz—even though more logic might be<br />
needed to implement the multiple cores.<br />
Software for all the embedded programmable<br />
engines is another major concern, notes<br />
Wawrzyniak. New software tools are<br />
needed to allow programmers to rapidly<br />
develop the programming for all of the onchip<br />
processors. In addition to the tools,<br />
such as <strong>com</strong>pilers and debuggers, operating<br />
systems must be designed to handle the high<br />
levels of parallelism. ASIC design teams<br />
are increasingly be<strong>com</strong>ing dominated by<br />
software engineers, observes Wawrzyniak.<br />
Already, many <strong>com</strong>panies report that more<br />
than half of their development teams consist<br />
of software engineers. These engineers<br />
must develop the firmware and application<br />
software needed to execute the intended<br />
applications—everything from soft codecs for<br />
audio to image processing and much more.<br />
In addition to the CPU cores used in SoC<br />
designs, there also is a growing market for<br />
embeddable CPUs in field-programmablegate-array<br />
(FPGA) fabrics. Although a<br />
few FPGA vendors have integrated “hard”<br />
CPU cores into the FPGA silicon, the most<br />
popular approach is to use “soft” cores. These<br />
register-transfer-level (RTL) descriptions<br />
of the processor are integrated into the rest<br />
of the logic and then synthesized with all<br />
the other logic. The resulting configuration<br />
can be downloaded into the FPGA<br />
configuration memory as a bitstream.<br />
FPGA vendors, such as Actel, Altera, and<br />
Xilinx, have developed their own softprocessor<br />
cores. They also have allowed<br />
third-party CPU IP to be incorporated<br />
into the logic configuration. The use of the<br />
FPGA vendor’s home-grown soft cores is<br />
hard to track, as there are no royalty fees<br />
and customers typically don’t tell the world<br />
what they’re doing inside the FPGAs. With<br />
that said, however, Altera has gathered<br />
some statistics. Many of its customers are<br />
using more than one instance of its Nios II<br />
family of embedded processor cores.<br />
Is there a slowdown in the use of embedded<br />
CPU cores? I don’t think so. Perhaps<br />
there’s a small lull as <strong>com</strong>panies transition<br />
from generation to generation of the cores.<br />
Overall, however, the momentum seems<br />
to be sustained.<br />
Dave Bursky is a Contributing Editor for <strong>Chip</strong><br />
<strong>Design</strong> and <strong>Chip</strong> <strong>Design</strong> <strong>Trends</strong>. Bursky also<br />
is the Technical Editorial Manager at Maxim<br />
Integrated Products Inc. in Sunnyvale, Calif.<br />
• March 2007<br />
<strong>Chip</strong> <strong>Design</strong> <strong>Trends</strong>
© 2007 Extension Media. All rights reserved.<br />
IP <strong>Trends</strong><br />
...Continued from page 1<br />
software and tools. IP was considered<br />
just a way for design firms to generate<br />
extra in<strong>com</strong>e. Although IP had value,<br />
it wasn’t a technology that justified the<br />
attention of a <strong>com</strong>pany that had mastered<br />
EDA—the world’s most <strong>com</strong>plex software<br />
application.<br />
Against expectations, though, IP has<br />
turned out to be an important and growing<br />
element of <strong>Synopsys</strong>’ business strategy.<br />
According to the <strong>com</strong>pany’s annual report,<br />
its IP business now accounts for $85<br />
million of <strong>Synopsys</strong>’ $1.1 billion yearly<br />
revenue. The <strong>com</strong>pany is heavily deployed<br />
in interface and I/O IP—a segment that<br />
continues to create new opportunity,<br />
says Semico Analyst Rich Wawrzyniak.<br />
“Evolving standards will continue to<br />
raise the bar, creating opportunity for<br />
<strong>com</strong>panies deployed in this segment,” he<br />
states. “Today’s <strong>com</strong>puting environments<br />
are all about <strong>com</strong>munications and as long<br />
as that remains true, we’re going to see<br />
continuing activity in this area.”<br />
<strong>Synopsys</strong>’ Group Director of IP and<br />
Services Marketing, John Koeter, agrees.<br />
“With wireless USB poised to take off<br />
and new protocols like PCI Express Plus<br />
and USB 3.0 around the corner, there’s<br />
going to be increased demand for this<br />
type of IP,” he says. Koeter notes that<br />
<strong>Synopsys</strong> employs about 400 people in its<br />
IP group—many of which are working on<br />
new protocols. “This represents a major<br />
R&D investment,” he emphasizes. “We’re<br />
obviously serious.” The importance of IP<br />
to <strong>Synopsys</strong> can also be gauged by the<br />
<strong>com</strong>pany’s investment in testing, states<br />
Navraj Nandra, <strong>Synopsys</strong>’ Director of<br />
Marketing for Mixed Signal IP. “Interface<br />
and I/O IP must undergo extensive<br />
testing to make sure that it <strong>com</strong>plies with<br />
IP INTEREST MAP<br />
Every month, we assess trends in the chip-design <strong>com</strong>munity based upon designer<br />
usage of a leading IP portal. Data from the last three months illustrates that onchip<br />
bus IP—the most important element of I/O and interface IP—remained<br />
second only to the ever-popular digital-core and analog/mixed-signal IP segments.<br />
With <strong>Synopsys</strong> moving heavily into mixed signal, the <strong>com</strong>pany will likely be<strong>com</strong>e<br />
a player in two of the three most important IP segments.<br />
standards, which is why we’ve now got<br />
hardware testing labs dotted around the<br />
U.S. and Canada,” he says.<br />
Yet not everyone agrees that the interface<br />
and I/O segment is that attractive. Former<br />
Dataquest Analyst Gary Smith, who is<br />
currently an independent consultant at<br />
Gary Smith EDA, notes that as each<br />
protocol <strong>com</strong>es out, there’s a limited<br />
amount of time that <strong>Synopsys</strong> can charge<br />
a premium for the related IP. “<strong>Synopsys</strong><br />
can offer it standalone as long as the<br />
market will bear. But usually by nine<br />
months, it has be<strong>com</strong>e a <strong>com</strong>modity. And<br />
then they move it into their IP Library<br />
offering, <strong>Design</strong>Ware,” he explains. For the<br />
<strong>com</strong>pany, this is certainly not a disaster.<br />
“These IP Libraries do make good money<br />
and are a major <strong>com</strong>petitive advantage for<br />
<strong>Synopsys</strong>,” says Smith. But the tendency<br />
to be<strong>com</strong>e <strong>com</strong>moditized makes this<br />
type of IP less attractive than other, more<br />
specialized segments like Digital Core. The<br />
specialized segments <strong>com</strong>mand premium<br />
royalties over a period of many years (see<br />
the Sidebar: “IP Interest Map”).<br />
<strong>Synopsys</strong> is already laying the groundwork<br />
to get into more resilient segments of<br />
the IP business, however. According to<br />
Nandra, over a third of the <strong>com</strong>pany’s<br />
IP engineers are working on numerous<br />
mixed-signal projects. In addition, the<br />
<strong>com</strong>pany is actively developing designs for<br />
new memory formats like double-data-rate<br />
DRAM (DDR2). While <strong>Synopsys</strong> has no<br />
declared plans to enter other segments of<br />
the IP business, such as Digital Core, the<br />
<strong>com</strong>pany’s long experience in acquiring<br />
technology firms leaves many options<br />
open.<br />
Geoffrey James, Contributing Editor, <strong>Chip</strong><br />
<strong>Design</strong> <strong>Trends</strong><br />
www.chipdesignmag.<strong>com</strong>/trends<br />
March 2007 •
Performance, Power,<br />
and Area<br />
...Continued from page 1<br />
© 2007 Extension Media. All rights reserved.<br />
Moving averages are a statistical means to<br />
track changes over a specified time period.<br />
They allow one to spot trends by flattening<br />
out large fluctuations. When used on a<br />
monthly basis, these moving averages will<br />
help to show whether the number of design<br />
profiles is increasing or decreasing. Each<br />
month’s numbers are added to the average<br />
and the oldest numbers are dropped, which<br />
causes the average to “move” over time. By<br />
way of a technical analogy, moving averages<br />
are similar to the lowpass filters used in<br />
signal processing. They help to eliminate<br />
the higher fluctuations.<br />
Figure 1<br />
No one method of forecasting is foolproof.<br />
Yet the upward trend in the moving average<br />
analysis in Figure 2—when <strong>com</strong>bined with<br />
the historical patterns in Figure 1—suggests<br />
a continuing upward tendency for near-term<br />
design-profile investigations. Historically,<br />
our data suggests that design-investigation<br />
activity peaks around the March timeframe.<br />
Naturally, we’ll examine this trend more<br />
closely in the <strong>com</strong>ing months.<br />
As mentioned earlier, all three key technical<br />
parameters—power below 0.11 W, clock<br />
speeds below 100 MHz, and die area smaller<br />
than 50 mm squared—showed a significant<br />
increase in interest. But one trend may be<br />
deceiving: While designers performed more<br />
tradeoffs at power levels at or below 0.11 W,<br />
a significant number of designers used power<br />
levels between 0.25 to 1 W (see Tables). In<br />
fact, the power range from 0.25 to 1.0 W<br />
saw a fourfold increase in interest—from<br />
279 in December 2006 to 1155 in January<br />
2007. This would suggest a rise in more<br />
power-intensive applications in both mobile<br />
and fixed devices. In future issues, this data<br />
will be correlated to technology nodes and<br />
other pertinent metrics.<br />
Figure 2<br />
When it’s added to our growing database<br />
of historical trends, this month’s data<br />
suggests that the months through March<br />
2007 will be very significant for the chip<br />
designers and managers who are exploring<br />
new product designs. Significant trends<br />
include a continuing interest in smaller<br />
die sizes (less than 50 mm sq.), a leveling<br />
off of clock speeds, and an unexpected<br />
increase in total power investigations to<br />
include the 0.25-to-1-W range.<br />
John Blyler, Editorial Director<br />
10 • March 2007 <strong>Chip</strong> <strong>Design</strong> <strong>Trends</strong>
© 2007 Extension Media. All rights reserved.<br />
Jan 06 Feb 06 Mar 06 April 06 May 06 June 06 July 06 Aug 06 Sept 06 Oct 06 Nov 06 Dec 06 Jan 07<br />
Total <strong>Design</strong> Profiles 1,248 1,254 1,927 1,162 1,574 1,901 2,113 1,496 951 1,571 812 1,439 2,658<br />
<strong>Chip</strong> Power ≤ 0.11 W (Equivalent) 288 379 493 280 223 272 798 505 300 829 280 462 619<br />
Avg CLK Speed ≤ 100 MHz (Equivalent)<br />
689 767 1,011 739 755 1,232 1,382 911 743 1215 565 612 1,808<br />
Die Area < 50 mm sq. (Equivalent) 974 1,108 1,598 890 839 1,431 1,668 1,194 771 1357 676 1,082 2,268<br />
Percent change from previous month<br />
Total <strong>Design</strong> Profiles -40% 0% 54% -40% 35% 21% 11% -29% -36% 65% -48% 77% 85%<br />
<strong>Chip</strong> Power ≤ 0.11 W -6% 33% 42% -15% -20% 22% 193% -37% -41% 176% -66% 65% 34%<br />
Avg CLK Speed ≤ 100 MHz -25% 11% 32% -27% 2% 63% 12% -34% -18% 64% -53% 8% 195%<br />
Die Area ≤ 50 mm sq. -26% 15% 57% -16% -5% 71% 17% -28% -35% 76% -50% 60% 110%<br />
By Total <strong>Chip</strong> Power<br />
<strong>Design</strong>s Tracked by Power 749 761 1,277 1,156 1,574 1,901 2,112 1,496 950 1,570 812 1,439 2,657<br />
≤ 0.11 W 173 230 327 279 223 272 798 505 300 829 280 462 619<br />
0.25 W to 1.00 W 298 361 530 207 477 649 631 396 371 318 245 279 1,155<br />
1.50 W to 4.00 W 181 103 227 466 308 639 478 406 218 304 276 428 679<br />
5.00 W to 15.00 W 89 58 175 167 216 244 174 156 53 104 11 100 174<br />
> 20.00 W 8 9 18 37 350 97 31 33 8 15 0 170 30<br />
≤ 0.11 W (Equivalent to total) 288 379 493 280 223 272 798 505 300 829 280 462 619<br />
<strong>Chip</strong> <strong>Design</strong> <strong>Trends</strong><br />
Data, Analysis, and Benchmarking on SOC <strong>Design</strong><br />
www.chipdesignmag.<strong>com</strong>/trends<br />
Copyright © 2006 by Extension Media LLC. All rights reserved. Reproduction in<br />
any form whatsoever is forbidden without express permission of copyright owner.<br />
Editorial Staff<br />
Editor-in-Chief<br />
John Blyler (503) 614-1082<br />
jblyler@extensionmedia.<strong>com</strong><br />
Erach Desai, Chief Analyst<br />
erach@desaisive.<strong>com</strong><br />
Dave Bursky, Contributing Editor<br />
dbursky@extensionmedia.<strong>com</strong><br />
Geoffrey James, Contributing Editor<br />
gjames@extensionmedia.<strong>com</strong><br />
Clive “Max” Maxfield, i<strong>Design</strong> Editor<br />
cmaxfield@extensionmedia.<strong>com</strong><br />
Editorial Board<br />
Tom Anderson, Consultant • Cheryl Ajluni, Technical Consultant, Custom<br />
Media Solutions • Karen Bartleson, Standards Program Manager,<br />
<strong>Synopsys</strong> • Chuck Byers, Director Communications, TSMC • Pallab<br />
Chatterjee, Consultant, Silicon Map • Rich Faris, Marketing Director, Real<br />
Intent • Kathryn Kranen, CEO, Jasper <strong>Design</strong> Automation • Barry Marsh,<br />
Vice President Marketing, Actel • Tom Moxon, Consultant, Moxon <strong>Design</strong><br />
• Walter Ng, Senior Director, <strong>Design</strong> Services, Chartered Semiconductor •<br />
Scott Sandler, CEO, Novas Software • Steve Schulz, President, SI2 • Adam<br />
Traidman, CEO, <strong>Chip</strong> Estimate<br />
Production Staff<br />
Director of Production<br />
Barney Lee (415) 255-0390 x13<br />
blee@extensionmedia.<strong>com</strong><br />
Print Production Specialist<br />
Kristine Reano • kreano@extensionmedia.<strong>com</strong><br />
subscriptions and customer service<br />
To start your subscription, please visit the website at: http://www.<br />
chipdesignmag.<strong>com</strong>/trends or call: 1-866-834-1248. Published 12 times<br />
per year on a monthly basis.<br />
Rates:<br />
• <strong>Chip</strong> <strong>Design</strong> <strong>Trends</strong> Newsletter: $695 per year<br />
• <strong>Chip</strong> <strong>Design</strong> <strong>Trends</strong> Newsletter and two special bi-annual<br />
reports: $1,950<br />
President and Publisher<br />
Vince Ridley (415) 255-0390 x18<br />
vridley@extensionmedia.<strong>com</strong><br />
Vice President, Marketing & Product Development<br />
Karen Murray • kmurray@extensionmedia.<strong>com</strong><br />
Vice President, Business Development<br />
Melissa Sterling • msterling@extensionmedia.<strong>com</strong><br />
Vice President, Sales<br />
Embedded Systems Media Group<br />
Clair Bright • cbright@extensionmedia.<strong>com</strong><br />
www.chipdesignmag.<strong>com</strong>/trends March 2007 • 11