Sentaurus Technology Template: CMOS ... - Synopsys.com
Sentaurus Technology Template: CMOS ... - Synopsys.com
Sentaurus Technology Template: CMOS ... - Synopsys.com

Create successful ePaper yourself
Turn your PDF publications into a flip-book with our unique Google optimized e-Paper software.
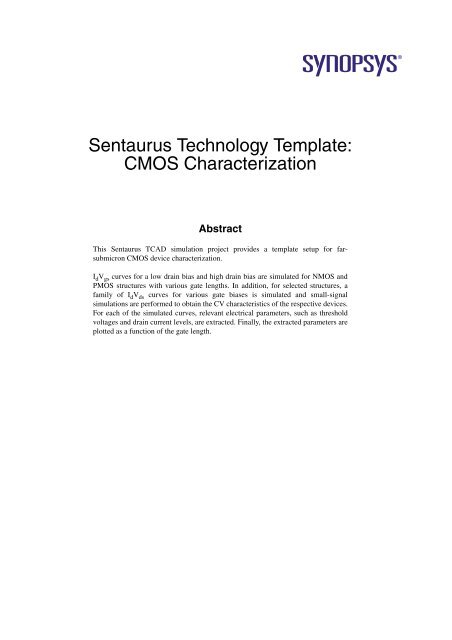
<strong>Sentaurus</strong> <strong>Technology</strong> <strong>Template</strong>:<br />
<strong>CMOS</strong> Characterization<br />
Abstract<br />
This <strong>Sentaurus</strong> TCAD simulation project provides a template setup for farsubmicron<br />
<strong>CMOS</strong> device characterization.<br />
I d V gs curves for a low drain bias and high drain bias are simulated for NMOS and<br />
PMOS structures with various gate lengths. In addition, for selected structures, a<br />
family of I d V ds curves for various gate biases is simulated and small-signal<br />
simulations are performed to obtain the CV characteristics of the respective devices.<br />
For each of the simulated curves, relevant electrical parameters, such as threshold<br />
voltages and drain current levels, are extracted. Finally, the extracted parameters are<br />
plotted as a function of the gate length.
<strong>Synopsys</strong> and the <strong>Synopsys</strong> logo are registered trademarks of <strong>Synopsys</strong>, Inc.<br />
Copyright © 2007 <strong>Synopsys</strong>, Inc. All rights reserved.
Introduction<br />
This project provides standard templates for the device<br />
simulator <strong>Sentaurus</strong> Device that can be used to perform the<br />
most <strong>com</strong>mon types of simulation used in <strong>CMOS</strong> device<br />
characterization and performance assessment. It contains<br />
device simulation setups for I d V gs simulation at a low drain<br />
bias and a high drain bias, setups for the simulation of a<br />
family of I d V ds curves, and setups for capacitance<br />
simulations.<br />
The setup of the <strong>Sentaurus</strong> Workbench (SWB) project<br />
supports NMOS and PMOS devices, and allows for the<br />
simulation of structures with different gate lengths. Other<br />
variations can be included by adjusting the template.<br />
The template provides a library for the visualization tool<br />
Inspect to extract the most <strong>com</strong>mon electrical parameters<br />
such as the threshold voltage, transconductance,<br />
subthreshold voltage swing, drain saturation current, drain<br />
leakage current, on-state resistance, and gate capacitance.<br />
Finally, the template supplies an Inspect library for plotting<br />
extracted electrical parameters as a function of SWB input<br />
parameters. A typical example is a V t roll-off curve.<br />
The NMOS and PMOS devices are defined by using a fully<br />
parameterized input file to the <strong>Sentaurus</strong> Structure Editor.<br />
The geometric dimensions, such as gate oxide thickness and<br />
spacer width, as well as doping profiles parameters, such as<br />
peak concentration and junction depth, can be easily<br />
adjusted to specific needs or can be<strong>com</strong>e SWB parameters<br />
to allow for the creation of new device families or the<br />
plotting of other characteristics, such as the dependence of<br />
the threshold voltage on the halo implant depth.<br />
The template setup can also be used to investigate the<br />
electrical properties of device structures created by the<br />
process simulator <strong>Sentaurus</strong> Process (or others). In this<br />
case, <strong>Sentaurus</strong> Process must be added to the tool flow and<br />
the input file of the <strong>Sentaurus</strong> Structure Editor would need<br />
to be adapted to remesh the simulated structure. An example<br />
of such a setup can be found in the SWB template project<br />
<strong>Sentaurus</strong> <strong>Technology</strong> <strong>Template</strong>: <strong>CMOS</strong> Processing.<br />
It is assumed that the user is familiar with the <strong>Sentaurus</strong> tool<br />
suite, in particular, <strong>Sentaurus</strong> Workbench, <strong>Sentaurus</strong><br />
Structure Editor, <strong>Sentaurus</strong> Device, and Inspect. For an<br />
introduction and tutorials, refer to the <strong>Sentaurus</strong> training<br />
material.<br />
The focus of this project is to provide a setup that can be<br />
used as is or adapted to specific needs. The documentation<br />
focuses on aspects of the setups. For details about tool uses<br />
and specific tool syntax, refer to the respective manuals.<br />
General simulation setup<br />
This section describes the tool flow of the <strong>Sentaurus</strong><br />
Workbench project. For each tool, the associated SWB input<br />
parameters and the extracted parameters are discussed.<br />
<strong>Sentaurus</strong> Structure Editor<br />
The analytic MOS structures are defined by <strong>Sentaurus</strong><br />
Structure Editor. Two SWB parameters are used by<br />
<strong>Sentaurus</strong> Structure Editor:<br />
• Type = nMOS|pMOS defines whether an NMOS or a<br />
PMOS device is created.<br />
• lgate [μm] defines the gate length for the MOS<br />
devices. Here, it assumes the values 0.045, 0.065,<br />
0.09, 0.13, 0.25, and 1.0. Users can add or<br />
remove values as required.<br />
<strong>Sentaurus</strong> Device: IdVg_lin<br />
The name of the first instance of <strong>Sentaurus</strong> Device is<br />
IdVg_lin. It performs a low drain bias I d V gs sweep for<br />
the given devices. The supply voltage V dd and the drain bias<br />
V ds are defined by the SWB parameters:<br />
• Vdd [V] defines the supply voltage. Here, it is set to<br />
1.2. (For the PMOS devices, the sign of the supply<br />
voltage is changed internally.)<br />
• Vdlin [V] defines the drain bias for the I d V gs sweep.<br />
Here, it is set to 0.05. (For the PMOS devices, the sign<br />
of the drain bias is changed internally.)<br />
• IdVg_lin = 0|1 is a logical flag. The I d V gs sweep<br />
is performed only if the flag is 1.<br />
Inspect: PlotIdVg_lin<br />
The name of the subsequent visualization tool Inspect is<br />
PlotIdVg_lin. It plots the low drain bias I d V gs<br />
characteristics and extracts:<br />
• Vtgm [V]: Threshold voltage defined as the<br />
intersection of the tangent at the maximum g m with the<br />
V gs axis.<br />
• VtiLin [V]: Threshold voltage defined as V gs at<br />
which I d = 100 nA/L g for V ds = Vdlin.<br />
• IdLin [A/μm]: I d at V ds = Vdlin and V gs = Vdd.<br />
• gmLin [S/μm]: Maximum transconductance at V ds =<br />
Vdlin.<br />
• SSlin [mV/dec]: Subthreshold swing at V ds =<br />
Vdlin.<br />
Copyright © 2007 <strong>Synopsys</strong>, Inc. All rights reserved. 3
<strong>Sentaurus</strong> Device: IdVg_sat<br />
The name of the next instance of <strong>Sentaurus</strong> Device is<br />
IdVg_sat. It performs a high drain bias I d V gs sweep. The<br />
drain bias V ds for this simulation is set to the supply voltage<br />
Vdd:<br />
• IdVg_sat = 0|1 is a logical flag. The I d V gs sweep<br />
is performed only if the flag is 1.<br />
Inspect: PlotIdVg_sat<br />
The name of the subsequent Inspect instance is<br />
PlotIdVg_sat. It plots the high drain bias I d V gs<br />
characteristics and extracts:<br />
• VtiSat [V]: Threshold voltage defined as V g at which<br />
I d =100nA/L g for V ds = Vdd.<br />
• IdSat [A/μm]: Saturation current I d at V ds =V gs<br />
= Vdd.<br />
• Ioff [A/μm]: Off-state (drain-leakage) current I d at<br />
V ds = Vdd and V gs =0 V.<br />
• gmSat [S/μm]: Maximum transconductance at<br />
V ds = Vdd.<br />
• SSsat [mV/dec]: Subthreshold swing at V ds = Vdd.<br />
<strong>Sentaurus</strong> Device: IdVd<br />
The name of the following instance of <strong>Sentaurus</strong> Device is<br />
IdVd. It simulates a family of I d V ds curves. The gate biases<br />
are defined by the SWB parameters:<br />
• Vgmin [V] defines the gate bias for the first drain<br />
voltage sweep. It is set to 0.3. (For the PMOS devices,<br />
the sign of the gate bias is changed internally.)<br />
• Vgmax [V] defines the gate bias for the last drain<br />
voltage sweep. It is set to 1.2. (For the PMOS devices,<br />
the sign of the gate bias is changed internally.)<br />
• NVg [1] defines the number of sweeps. It is set to 4.<br />
The gate biases are linearly distributed between the<br />
minimum and the maximum values.<br />
• IdVd = 0|1 is a logical flag. The I d V ds sweep is<br />
performed only if the flag is 1.<br />
Inspect: PlotIdVd<br />
The name of the subsequent Inspect instance is PlotIdVd.<br />
It plots the family of I d V ds curves and extracts:<br />
• Ron [Ωμm]: On-state output resistance at V gs = Vdd.<br />
<strong>Sentaurus</strong> Device: CV<br />
The name of the final instance of <strong>Sentaurus</strong> Device is CV. It<br />
performs a small-signal analysis at a fixed frequency during<br />
a gate sweep from V gs = –Vdd to V gs = +Vdd:<br />
• CV = 0|1 is a logical flag. The CV simulation is<br />
performed only if the flag is 1.<br />
Inspect: PlotCV<br />
The name of the subsequent Inspect instance is PlotCV. It<br />
plots the gate capacitance, the gate–source or gate–drain<br />
overlap capacitance, and the gate–body capacitance as a<br />
function of the gate voltage and extracts:<br />
• CgM [F/μm]: Gate capacitance at V gs = –Vdd.<br />
• Cg0 [F/μm]: Gate capacitance at V gs =0 V.<br />
• CgP [F/μm]: Gate capacitance at V gs = Vdd.<br />
Inspect: RollOff<br />
The name of the final Inspect instance is RollOff. It<br />
collects the extracted values for each device and plots<br />
Vtgm, VtiLin, VtiSat, IdLin, IdSat, Ioff,<br />
SSlin, SSsat, gmLin, and gmSat as a function of the<br />
gate length lgate (roll-off curves). In addition, the I on –I off<br />
characteristics are shown. The <strong>Sentaurus</strong> Workbench<br />
parameter:<br />
• RollOff = 0|1 is a logical flag. The roll-off curves<br />
are plotted only if the flag is 1. It is sufficient to set the<br />
flag to 1 for only a single device in each class. For<br />
example, for the NMOS and PMOS with lgate =<br />
1.0.<br />
The project has been structured to allow for flexibility. For<br />
example, new devices or experiments can be added by<br />
selecting Experiments > Add New Experiment from the<br />
menu bar of the SWB main window.<br />
An experiment can be edited by changing the values of the<br />
parameters. Furthermore, different experiments can be<br />
grouped into scenarios. In this project, the experiment for<br />
the NMOS and PMOS devices are grouped into scenarios<br />
named nMOS and pMOS to simplify management of the<br />
project.<br />
Tool-specific setups<br />
Device generation using <strong>Sentaurus</strong><br />
Structure Editor and Mesh<br />
The <strong>Sentaurus</strong> Structure Editor is used to define the NMOS<br />
and PMOS devices in a fully parameterized way.<br />
4 Copyright © 2007 <strong>Synopsys</strong>, Inc. All rights reserved.
Figure 1 shows the NMOS device with a 90 nm gate length.<br />
To adjust the details of the devices, users can modify the top<br />
section of the input file sde_dvs.cmd of <strong>Sentaurus</strong><br />
Structure Editor. For example, the substrate background<br />
doping level and the peak concentration of the halo implant<br />
are defined by setting the Scheme variables:<br />
(define SubDop 5e17) ; [1/cm3]<br />
(define HaloDop 1.5e18) ; [1/cm3]<br />
The junction depth for the halo, the extension, and the<br />
source/drain implants are defined by setting the Scheme<br />
variables:<br />
(define XjHalo 0.07) ; [um] Halo depth<br />
(define XjExt 0.026) ; [um] Extension depth<br />
(define XjSD 0.12) ; [um] SD Junction depth<br />
The extend of the nitride spacer and the gate oxide thickness<br />
are defined by setting the Scheme variables:<br />
(define Lsp 0.1)<br />
(define Tox 20e-4)<br />
-0.2<br />
-0.1<br />
0<br />
0.1<br />
0.2<br />
0.3<br />
Figure 1<br />
; [um] Spacer length<br />
; [um] Gate oxide thickness<br />
DopingConcentration<br />
1.1e+20<br />
1.2e+17<br />
1.2e+14<br />
-1.7e+12<br />
-1.8e+15<br />
-1.6e+18<br />
0.4<br />
-0.3 -0.2 -0.1 0 0.1 0.2 0.3<br />
The 90 nm gate length NMOS device generated by <strong>Sentaurus</strong><br />
Structure Editor and meshed with Mesh; concentrations of dopants<br />
in various regions are shown<br />
Several other geometric, doping, and meshing parameters<br />
are accessible in a similar way. The meshing strategy is<br />
designed to result in a high quality without excessive node<br />
counts for a large range of geometric parameters. <strong>Sentaurus</strong><br />
Structure Editor calls the meshing engine Mesh to generate<br />
the structure files for <strong>Sentaurus</strong> Device. Mesh is called from<br />
within <strong>Sentaurus</strong> Structure Editor with:<br />
(sde:build-mesh "mesh" "-F tdr" "n@node@_half_msh")<br />
The <strong>com</strong>mand-line option -F tdr instructs Mesh to use<br />
the file format TDR for the device structure file. (The TDR<br />
data format is used throughout the project.) It must be noted<br />
that only half of the <strong>CMOS</strong> structure is created by <strong>Sentaurus</strong><br />
Structure Editor and meshed with Mesh. It is subsequently<br />
reflected about the vertical axis to obtain the full device.<br />
The reflection is performed in the <strong>Sentaurus</strong> Structure<br />
Editor by a system call to the utility <strong>Sentaurus</strong> Data<br />
Explorer (tdx):<br />
(system:<strong>com</strong>mand "tdx -mtt -x -ren drain=source<br />
n@node@_half_msh n@node@_msh")<br />
The option -x instructs <strong>Sentaurus</strong> Data Explorer to reflect<br />
the device along an axis defined by x = x min<br />
. The given<br />
half-structure has three contacts: drain, gate, and<br />
substrate, which are defined in sde_dvs.cmd. Of<br />
these, the gate and substrate contacts touch the axis of<br />
reflection and, upon reflection, are extended and thereby<br />
preserve their names. However, the drain contact in the<br />
reflected half is named drainmirrored by default. This<br />
contact is explicitly renamed source with the <strong>com</strong>mandline<br />
option -ren of <strong>Sentaurus</strong> Data Explorer.<br />
Device simulation using <strong>Sentaurus</strong> Device<br />
<strong>Sentaurus</strong> Device is used to simulate the drain current as a<br />
function of the gate voltage at a low drain bias and a high<br />
drain bias (I d V gs ) as well as to simulate a family of drain<br />
current curves as a function of the drain voltage (I d V ds ) for<br />
different values of the gate bias. Furthermore, a small-signal<br />
AC analysis is performed to show the total gate, gate–<br />
contact, and gate–body capacitance as a function of the gate<br />
voltage (CV).<br />
All IV simulations are performed using the hydrodynamic<br />
transport model, where the carrier temperature equation for<br />
the dominant carriers – electrons for NMOS and holes for<br />
PMOS –is solved with the electrostatic Poisson equation<br />
and the carrier continuity equations. It is not necessary to<br />
solve the carrier temperature equation for the CV<br />
simulations. For the high drain bias I d V gs as well as the<br />
I d V ds simulations, lattice self-heating effects are included<br />
by also solving the lattice temperature equation.<br />
Size quantization effects are included in all simulations by<br />
using the density gradient model. For the IV simulations, it<br />
is sufficient to activate the density gradient model for the<br />
dominant carriers only, because it will be effective mainly in<br />
the inversion layer. For the CV simulations, however, the<br />
model must be activated for electrons and holes, because<br />
size quantization occurs in accumulation as well.<br />
For all simulations, the Lucent mobility model is used and<br />
high-field saturation effects are accounted for.<br />
The Tcl block preprocessing mode of <strong>Sentaurus</strong> Workbench<br />
is used to distinguish the <strong>Sentaurus</strong> Device input files for<br />
the NMOS and PMOS devices. In this mode, any text<br />
enclosed in:<br />
!( )!<br />
is treated as a Tcl script block, which is executed at<br />
preprocessing time. The text itself is removed during<br />
preprocessing, with the exception of the output of the Tcl<br />
Copyright © 2007 <strong>Synopsys</strong>, Inc. All rights reserved. 5
puts <strong>com</strong>mands. For example, to activate the appropriate<br />
high-field saturation model for the NMOS and PMOS<br />
devices, the following Tcl block is used:<br />
!(<br />
if { "@Type@" == "nMOS" } { ...<br />
set HFS1 "eHighFieldSaturation( CarrierTempDrive )"<br />
set HFS2 "hHighFieldSaturation( GradQuasiFermi )"<br />
} else {<br />
set HFS1 "hHighFieldSaturation( CarrierTempDrive )"<br />
set HFS2 "eHighFieldSaturation( GradQuasiFermi )"<br />
}<br />
)!<br />
...<br />
Physics(Material="Silicon"){ ...<br />
Mobility( ...<br />
!(puts $HFS1)!<br />
!(puts $HFS2)!<br />
)<br />
For the NMOS devices, this segment of the input file of<br />
<strong>Sentaurus</strong> Device is translated during <strong>Sentaurus</strong> Workbench<br />
preprocessing to:<br />
Physics(Material="Silicon"){ ...<br />
Mobility(<br />
eHighFieldSaturation( CarrierTempDrive )<br />
hHighFieldSaturation( GradQuasiFermi )<br />
)<br />
Figure 2 shows the I d V gs curves for the 90 nm PMOS and<br />
NMOS devices at V ds = 50 mV and V ds = 1.2 V.<br />
Drain Current [A/μm]<br />
Figure 2<br />
10 -3 NMOS V ds = 50 mV<br />
NMOS V ds = 1.2 V<br />
10 -4<br />
PMOS V ds = 50 mV<br />
PMOS V ds = 1.2 V<br />
10 -5<br />
10 -6<br />
10 -7<br />
10 -8<br />
10 -9<br />
10 -10<br />
-1 -0.5 0 0.5 1<br />
Gate Voltage [V]<br />
Drain current as a function of gate voltage for the 90 nm gate<br />
length PMOS (red) and NMOS (blue) devices simulated with<br />
<strong>Sentaurus</strong> Device; lower curves (solid lines) are for a drain bias of<br />
50 mV and upper curves (dashes) are for 1.2 V<br />
For the I d V ds simulation, the input of <strong>Sentaurus</strong> Device that<br />
defines the family of curves is created with the following<br />
Tcl blocks.<br />
The first Tcl block generates the Time string, which<br />
determines at which values of the gate voltage a solution is<br />
saved:<br />
Quasistationary( ...<br />
Goal { Name="gate" Voltage=@Vgmax@ }<br />
){ Coupled { Poisson ... }<br />
Save( FilePrefix="IdVd_n@node@" NoOverWrite<br />
!(<br />
set TIMES "Time=("<br />
for { set i 1 } { $i < @NVg@ } { incr i } {<br />
set dV [expr (@Vgmax@-@Vgmin@)/(@NVg@-1.0)]<br />
set Time [expr (@Vgmin@ + ($i-1)*$dV)/@Vgmax@]<br />
append TIMES "[format %.2f ${Time}];"<br />
}<br />
set Time 1.0<br />
append TIMES "[format %.2f ${Time}]) )"<br />
puts $TIMES<br />
)!<br />
}<br />
The <strong>Sentaurus</strong> Workbench parameters Vgmin and Vgmax<br />
define the first and last gate bias, and NVg defines the<br />
number of curves (gate biases) used in the family of I d V ds<br />
curves. The Tcl block of the input file given above is<br />
translated during <strong>Sentaurus</strong> Workbench preprocessing to:<br />
Quasistationary(<br />
Goal { Name="gate" Voltage=1.2 }<br />
){ Coupled { Poisson ... }<br />
Save( FilePrefix="IdVd_n162" NoOverWrite<br />
Time=(0.25;0.50;0.75;1.00))<br />
}<br />
The next Tcl block generates the input file segments, which<br />
reload the previously saved solution for a given gate bias<br />
and perform the drain voltage sweep:<br />
!(<br />
for { set i 0 } { $i < @NVg@ } { incr i } {<br />
set Number [format "%04d" $i]<br />
puts "<br />
NewCurrentFile=\"IdVd_${i}_\"<br />
Load(FilePrefix=\"IdVd_n@node@_$Number\")<br />
Quasistationary(<br />
DoZero<br />
InitialStep=1e-3 Increment=1.35<br />
MinStep=1e-5 MaxStep=0.05<br />
Goal \{ Name=\"drain\" Voltage=[expr $SIGN*@Vdd@]<br />
\}<br />
)\{ Coupled \{ $EQNS \}<br />
CurrentPlot( Time=(Range=(0 1) Intervals=20) )<br />
\}"<br />
}<br />
)!<br />
After preprocessing, the Tcl block is expanded to:<br />
NewCurrentFile="IdVd_0_"<br />
Load(FilePrefix="IdVd_n162_0000")<br />
Quasistationary(<br />
DoZero<br />
InitialStep=1e-3 Increment=1.35<br />
MinStep=1e-5 MaxStep=0.05<br />
Goal { Name="drain" Voltage=1.2 }<br />
){ Coupled { Poisson eQuantumPotential Electron<br />
6 Copyright © 2007 <strong>Synopsys</strong>, Inc. All rights reserved.
Temperature eTemperature }<br />
CurrentPlot( Time=(Range=(0 1) Intervals=20) )<br />
}<br />
...<br />
NewCurrentFile="IdVd_1_"<br />
Load(FilePrefix="IdVd_n162_0001")<br />
Quasistationary( ... )<br />
}<br />
Figure 3 shows the I d V ds curves for the 90 nm PMOS and<br />
NMOS devices at V gs = 0.6, 0.9, and 1.2 V.<br />
4.0e-04<br />
Extraction and visualization with Inspect<br />
In the <strong>Sentaurus</strong> Workbench tool flow, each instance of<br />
<strong>Sentaurus</strong> Device is followed by an instance of the<br />
visualization tool Inspect. This tool plots the corresponding<br />
IV or CV characteristics, and extracts relevant electrical<br />
parameters as discussed in General simulation setup on<br />
page 3.<br />
The extractions are performed with the help of the Inspect<br />
library EXTRACT. The extraction routines are activated<br />
with:<br />
load_library EXTRACT<br />
Drain Current [A/μm]<br />
3.5e-04<br />
3.0e-04<br />
2.5e-04<br />
2.0e-04<br />
1.5e-04<br />
1.0e-04<br />
5.0e-05<br />
(Refer to the Inspect User Guide for more information<br />
about this library.)<br />
The following routines of this library are used in this<br />
project.<br />
ExtractVtgm<br />
This routine extracts the threshold voltage using the<br />
maximum transconductance method. The routine is called<br />
with:<br />
ExtractVtgm <br />
Figure 3<br />
Drain current as a function of drain voltage for the 90 nm gate<br />
length PMOS (left) and NMOS (right) devices simulated with<br />
<strong>Sentaurus</strong> Device; gate bias for curves is 0.6 V (blue), 0.9 V<br />
(green), and 1.2 V (red)<br />
The AC analysis is performed at 1 MHz during a gate<br />
voltage sweep from – 1.5 ⋅ Vdd to + 1.5 ⋅ Vdd .<br />
Figure 4 shows the CV curves for the 1 μm NMOS device.<br />
Capacitance [F/μm]<br />
Figure 4<br />
0.0e+00<br />
1.4e-15<br />
1.2e-15<br />
1.0e-15<br />
8.0e-16<br />
6.0e-16<br />
4.0e-16<br />
2.0e-16<br />
0.0e+00<br />
-1 -0.5 0 0.5 1<br />
Drain Voltage [V]<br />
Cgg<br />
Ccg<br />
Cbg<br />
-1 0 1<br />
Gate Voltage [V]<br />
Total gate (Cgg, red), gate-contacts (Ccg, green), and gate-body<br />
(Cbg, blue) capacitance as a function of gate voltage for 90 nm<br />
gate length NMOS device simulated with <strong>Sentaurus</strong> Device<br />
where Name defines the name of the extracted parameter as<br />
it appears in the Variable Values column of <strong>Sentaurus</strong><br />
Workbench. Curve refers to the name of the Inspect I d V gs<br />
curve, and Type can be either nMOS or pMOS. The routine<br />
passes the extracted value to <strong>Sentaurus</strong> Workbench and<br />
prints it to the log file. It also returns the value to Inspect.<br />
For example, the call:<br />
set Vt [ExtractVtgm Vtgm IdVg nMOS]<br />
results in output such as:<br />
DOE: Vtgm 0.392<br />
Vt (Max gm method): 0.392 V<br />
ExtractVti<br />
This routine extracts the gate voltage at which the drain<br />
current exceeds a given current level. The routine is called<br />
with:<br />
ExtractVti <br />
where Name defines the name of the extracted parameter.<br />
Curve refers to the name of the Inspect I d V gs curve, and<br />
Ilevel defines the drain current level at which the gate<br />
voltage is extracted. For example, the call:<br />
set Vti [ExtractVti VtiLin IdVg 1e-7]<br />
Copyright © 2007 <strong>Synopsys</strong>, Inc. All rights reserved. 7
esults in output such as:<br />
DOE: VtiLin 0.385<br />
Vti (Vg at Io=1.111e-06): 0.385 V<br />
ExtractSS<br />
This routine extracts the subthreshold voltage swing. The<br />
routine is called with:<br />
ExtractSS <br />
where Name defines the name of the extracted parameter,<br />
Curve refers to the name of the Inspect I d V gs curve, and<br />
Vgo defines the gate voltage at which the slope is extracted.<br />
It should be a value well below the threshold voltage. Note<br />
that the slope may be noise at the beginning of the curve or<br />
at very low current levels, so better results are often<br />
obtained when setting Vgo > 0 V. For example, the call:<br />
set SS [ExtractSS SSlin IdVg($N) 0.01]<br />
results in output such as:<br />
DDOE: SSlin 79.758<br />
SS (subthreshold voltage swing): 79.758 mV/dec<br />
ExtractGm<br />
This routine extracts the maximum transconductance. The<br />
routine is called with:<br />
ExtractGm <br />
where Name defines the name of the extracted parameter,<br />
Curve refers to the name of the Inspect I d V gs curve, and<br />
Type can be either nMOS or pMOS. For example, the call:<br />
set gm [ExtractGm gmLin IdVg nMOS]<br />
results in output such as:<br />
DOE: gmLin 1.123e-04<br />
gm: 1.123e-04 S/um<br />
Max gm is at Vg= 0.540 V<br />
ExtractMax<br />
This routine extracts the maximum of a curve. The routine<br />
is called with:<br />
ExtractMax <br />
where Name defines the name of the extracted parameter,<br />
and Curve refers to the name of the Inspect curve. For<br />
example, the call:<br />
set IdSat [ExtractMax IdSat IdVg]<br />
results in output such as:<br />
DOE: IdSat 4.028e-04<br />
Max: 4.028e-04<br />
ExtractIoff<br />
This routine extracts the drain leakage current. The routine<br />
is called with:<br />
ExtractIoff <br />
where Name defines the name of the extracted parameter,<br />
Curve refers to the name of the Inspect I d V gs curve<br />
(<strong>com</strong>puted for a high drain bias), and Voff defines the gate<br />
voltage at which the drain leakage current is extracted,<br />
typically at a small nonzero value, to avoid noise. For<br />
example, the call:<br />
if { $Type == "nMOS" } { set SIGN 1.0 } \<br />
else { set SIGN -1.0 }<br />
set Ioff [ExtractIoff Ioff [expr $SIGN*1e-4]]<br />
results in output such as:<br />
DOE: Ioff 5.167e-11<br />
Ioff: 5.167e-11 A/um<br />
ExtractRon<br />
This routine extracts the on-state resistance. The routine is<br />
called with:<br />
ExtractRon <br />
where Name defines the name of the extracted parameter,<br />
Curve refers to the name of the Inspect I d V ds curve<br />
(<strong>com</strong>puted for a high gate bias), and Von defines the drain<br />
voltage at which the on-state resistance is extracted,<br />
typically well beyond saturation. For example, the call:<br />
set Ron [ExtractRon Ron IdVd 1.1]<br />
results in output such as:<br />
DOE: Ron 14909.555<br />
Ron: 14909.555 Ohm um<br />
ExtractValue<br />
This routine extracts the y-value at a given x-point. The<br />
routine is called with:<br />
ExtractValue <br />
where Name defines the name of the extracted parameter,<br />
Curve refers to the name of the Inspect curve, and Xo<br />
defines the x-point at which the value is extracted. For<br />
example, the call:<br />
set CggP [ExtractValue "CgP" Cgg 1.2]<br />
results in output such as:<br />
DOE: CgP 1.426e-15<br />
CgP: 1.426e-15<br />
Here, Cgg is the name of the Inspect total gate-capacitance<br />
versus the gate-voltage curve.<br />
8 Copyright © 2007 <strong>Synopsys</strong>, Inc. All rights reserved.
Plotting roll-off curves with Inspect<br />
The last instance of Inspect in the <strong>Sentaurus</strong> Workbench<br />
tool flow gathers the extracted values and plots them for<br />
each device as a function of the gate length. The scripts use<br />
the dynamic preprocessing feature of <strong>Sentaurus</strong> Workbench<br />
to access the table of input parameters and extracted values:<br />
set Types<br />
set Lgs<br />
set Vtgms<br />
set IdLins<br />
...<br />
[list @Type:all@]<br />
[list @lgate:all@]<br />
[list @Vtgm:all@]<br />
[list @IdLin:all@]<br />
The roll-off curves are generated with the help of the<br />
Inspect library FILTER_TABLE_ins.lib. This file is<br />
located in the project directory. The routines are activated<br />
with:<br />
source FILTER_TABLE_ins.lib<br />
The library maintains the global Tcl list CURVES, which<br />
contains the names of current Inspect curves. The list is<br />
used to delete all curves before displaying the next frame<br />
with the library routine NEXT (see below). In the input file<br />
RollOff_ins.cmd, this global Tcl list is declared and<br />
initialized with:<br />
global CURVES<br />
set CURVES [list]<br />
The library uses the character x as a marker, which<br />
identifies that a certain electrical parameter was not, or<br />
could not be, extracted. The library will remove those<br />
entries automatically. In the Inspect plotting and extraction<br />
input files (Plot*_ins.cmd), each extracted variable is<br />
initialized with the <strong>Sentaurus</strong> Workbench preprocessor<br />
directive #set to the ‘remove’ character. For example, at<br />
the beginning of PlotIdVg_lin_ins.cmd are the<br />
following lines:<br />
#set Vtgm x<br />
#set VtiLin x<br />
#set IdLin x<br />
#set SSlin x<br />
#set gmLin x<br />
The extraction of Vti will fail if the minimum drain current<br />
is lower than the requested Ilevel (see ExtractVti on<br />
page 7). In this case, the extraction routine will write:<br />
DOE: VtiLin x<br />
Vti (Vg at Io=1.111e-06):leakage current higher than<br />
Io!<br />
The plots are generated with the library routine CallPlot:<br />
CallPlot <br />
[ <br />
[ ] ...]<br />
<br />
The argument Name defines the name of the Inspect curve;<br />
Label defines the string that will be used as the curve<br />
label. XList and YList contain the list of <strong>Sentaurus</strong><br />
Workbench input parameters or extracted values, which are<br />
plotted on the x-axis and y-axis, respectively.<br />
The following set of Target/ParamList pairs is used to<br />
define conditions of the input parameters of <strong>Sentaurus</strong><br />
Workbench. For example, to plot the threshold voltage as a<br />
function of the gate length for the NMOS devices, use:<br />
set TargetType "nMOS"<br />
set NAME "Vtgm"<br />
set LABEL "$TargetType"<br />
CallPlot $NAME $LABEL $Lgs $Vtgms \<br />
$TargetType $Types blue solid<br />
...<br />
NEXT<br />
The library procedure NEXT pauses the execution of the<br />
Inspect script until the user uses the shortcut keys Ctrl+C.<br />
Then, the latest curves are deleted and the script proceeds to<br />
the next set of curves. In this manner, the script displays the<br />
roll-off curves for all extracted parameters.<br />
Threshold Votage [V]<br />
0.4<br />
0.2<br />
Figure 5<br />
0<br />
-0.2<br />
-0.4<br />
NMOS<br />
PMOS<br />
0.2 0.4 0.6 0.8 1<br />
Gate Length [μm]<br />
Threshold voltage as function of gate voltage for NMOS (red) and<br />
PMOS (blue) devices<br />
In addition, if an IV or a CV simulation is suppressed by<br />
setting the corresponding <strong>Sentaurus</strong> Workbench logical flag<br />
to 0, for example IdVd=0 (see General simulation setup on<br />
page 3), the values of the corresponding extracted<br />
parameters remain at their initialization value x.<br />
Copyright © 2007 <strong>Synopsys</strong>, Inc. All rights reserved. 9