JSB Market Research: Global Smart Wearable Market Forecast and Opportunities, 2019
Smart wearable products or devices are a relatively new concept in the global market. Global smart wearable market can be categorized into smartwatch, smartband, smart glasses and smart clothing. Increasing demand for high-end smartphone accessories, rising health awareness among consumers and growing adoption of smart technologies are benefitting the market for smart wearables across the globe. See Full Report @ bit.ly/1s0wN6N
Smart wearable products or devices are a relatively new concept in the global market. Global smart wearable market can be categorized into smartwatch, smartband, smart glasses and smart clothing. Increasing demand for high-end smartphone accessories, rising health awareness among consumers and growing adoption of smart technologies are benefitting the market for smart wearables across the globe.
See Full Report @ bit.ly/1s0wN6N

Create successful ePaper yourself
Turn your PDF publications into a flip-book with our unique Google optimized e-Paper software.
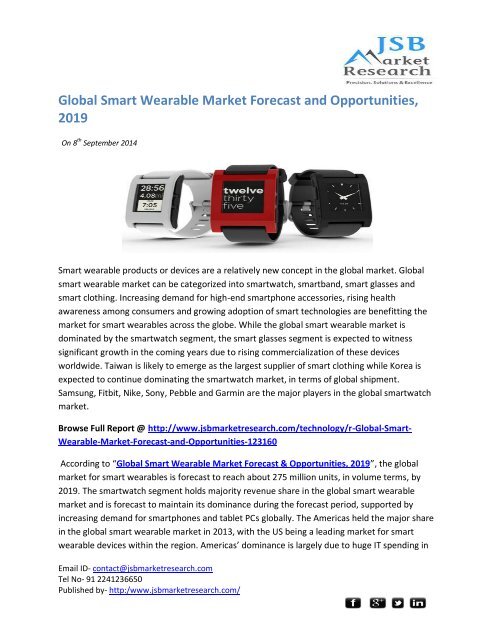
<strong>Global</strong> <strong>Smart</strong> <strong>Wearable</strong> <strong>Market</strong> <strong>Forecast</strong> <strong>and</strong> <strong>Opportunities</strong>,<br />
<strong>2019</strong><br />
On 8 th September 2014<br />
<strong>Smart</strong> wearable products or devices are a relatively new concept in the global market. <strong>Global</strong><br />
smart wearable market can be categorized into smartwatch, smartb<strong>and</strong>, smart glasses <strong>and</strong><br />
smart clothing. Increasing dem<strong>and</strong> for high-end smartphone accessories, rising health<br />
awareness among consumers <strong>and</strong> growing adoption of smart technologies are benefitting the<br />
market for smart wearables across the globe. While the global smart wearable market is<br />
dominated by the smartwatch segment, the smart glasses segment is expected to witness<br />
significant growth in the coming years due to rising commercialization of these devices<br />
worldwide. Taiwan is likely to emerge as the largest supplier of smart clothing while Korea is<br />
expected to continue dominating the smartwatch market, in terms of global shipment.<br />
Samsung, Fitbit, Nike, Sony, Pebble <strong>and</strong> Garmin are the major players in the global smartwatch<br />
market.<br />
Browse Full Report @ http://www.jsbmarketresearch.com/technology/r-<strong>Global</strong>-<strong>Smart</strong>-<br />
<strong>Wearable</strong>-<strong>Market</strong>-<strong>Forecast</strong>-<strong>and</strong>-<strong>Opportunities</strong>-123160<br />
According to “<strong>Global</strong> <strong>Smart</strong> <strong>Wearable</strong> <strong>Market</strong> <strong>Forecast</strong> & <strong>Opportunities</strong>, <strong>2019</strong>”, the global<br />
market for smart wearables is forecast to reach about 275 million units, in volume terms, by<br />
<strong>2019</strong>. The smartwatch segment holds majority revenue share in the global smart wearable<br />
market <strong>and</strong> is forecast to maintain its dominance during the forecast period, supported by<br />
increasing dem<strong>and</strong> for smartphones <strong>and</strong> tablet PCs globally. The Americas held the major share<br />
in the global smart wearable market in 2013, with the US being a leading market for smart<br />
wearable devices within the region. Americas’ dominance is largely due to huge IT spending in<br />
Email ID- contact@jsbmarketresearch.com<br />
Tel No- 91 2241236650<br />
Published by- http:/www.jsbmarketresearch.com/
the region, where North America contributes to around 75% of the region’s total spending. The<br />
smart wearable market in EMEA <strong>and</strong> Asia-Pacific is dominated by Germany <strong>and</strong> Korea,<br />
respectively. “<strong>Global</strong> <strong>Smart</strong> <strong>Wearable</strong> <strong>Market</strong> <strong>Forecast</strong> & <strong>Opportunities</strong>, <strong>2019</strong>” discusses the<br />
following aspects:<br />
• <strong>Global</strong> <strong>Smart</strong> <strong>Wearable</strong> <strong>Market</strong> Size, Share & <strong>Forecast</strong><br />
• Segmental Analysis - <strong>Smart</strong>watch, <strong>Smart</strong>b<strong>and</strong>, <strong>Smart</strong> Glasses <strong>and</strong> <strong>Smart</strong> Clothing<br />
• Regional & Application Wise <strong>Market</strong> Analysis<br />
• Changing <strong>Market</strong> Trends & Emerging <strong>Opportunities</strong><br />
• Competitive L<strong>and</strong>scape & Strategic Recommendations<br />
Why You Should Buy This Report?<br />
• To gain an in-depth underst<strong>and</strong>ing of the smart wearable’s market globally<br />
• To identify the on-going trends, <strong>and</strong> anticipated growth in the next five years<br />
• To help industry consultants <strong>and</strong> smart wearable manufacturers align their market-centric<br />
strategies<br />
• To obtain research based business decisions <strong>and</strong> add weight to presentations <strong>and</strong> marketing<br />
materials<br />
• To avail 10% customization in the report without any extra charges <strong>and</strong> get the research data<br />
or trends added in the report as per the buyer’s specific needs<br />
Report Methodology<br />
The information contained in this report is based upon both primary <strong>and</strong> secondary sources.<br />
Primary research included interviews with smart wearable vendors <strong>and</strong> channel partners<br />
globally. Secondary research included an exhaustive search of relevant publications such as<br />
company annual reports, financial reports <strong>and</strong> proprietary databases.<br />
Other industries we cover:<br />
<br />
<br />
<br />
<br />
Advertising <strong>and</strong> Media<br />
Automotive <strong>and</strong> Parts<br />
Consumer Goods<br />
Healthcare <strong>and</strong> Medical<br />
Email ID- contact@jsbmarketresearch.com<br />
Tel No- 91 2241236650<br />
Published by- http:/www.jsbmarketresearch.com/
Finance <strong>and</strong> Banking<br />
Food <strong>and</strong> Beverages<br />
Travel <strong>and</strong> Tourism<br />
Textiles <strong>and</strong> Clothing<br />
SWOT Analysis<br />
Table of Content<br />
1. <strong>Research</strong> Methodology<br />
2. Analyst View<br />
3. <strong>Global</strong> <strong>Smart</strong> <strong>Wearable</strong> <strong>Market</strong> Overview<br />
4. <strong>Global</strong> <strong>Smart</strong> <strong>Wearable</strong> <strong>Market</strong> Outlook<br />
4.1. <strong>Market</strong> Size & <strong>Forecast</strong><br />
4.1.1. By Value<br />
4.1.2. By Volume<br />
4.2. <strong>Market</strong> Share & <strong>Forecast</strong><br />
4.2.1. By Type<br />
4.2.2. By Application<br />
5. <strong>Global</strong> <strong>Smart</strong> <strong>Wearable</strong> <strong>Market</strong> Analysis, By Type<br />
5.1. <strong>Global</strong> <strong>Smart</strong>watch <strong>Market</strong> Outlook<br />
5.1.1. <strong>Market</strong> Size & <strong>Forecast</strong><br />
5.1.1.1. By Value<br />
5.1.1.2. By Volume<br />
5.1.2. <strong>Market</strong> Share & <strong>Forecast</strong><br />
5.1.2.1. By Company<br />
5.1.3. <strong>Global</strong> <strong>Smart</strong>watch <strong>Market</strong> Dynamics<br />
5.1.3.1. <strong>Market</strong> Drivers & Restraints<br />
5.1.4. Price Point Analysis<br />
5.2. <strong>Global</strong> <strong>Smart</strong>b<strong>and</strong>/Fitness B<strong>and</strong> <strong>Market</strong> Outlook<br />
5.2.1. <strong>Market</strong> Size & <strong>Forecast</strong><br />
5.2.1.1. By Value<br />
5.2.1.2. By Volume<br />
5.2.2. <strong>Market</strong> Share & <strong>Forecast</strong><br />
5.2.2.1. By Company<br />
5.2.3. <strong>Global</strong> <strong>Smart</strong>b<strong>and</strong> <strong>Market</strong> Dynamics<br />
5.2.3.1. <strong>Market</strong> Drivers & Restraints<br />
5.2.4. Price Point Analysis<br />
5.3. <strong>Global</strong> <strong>Smart</strong> Glasses <strong>Market</strong> Outlook<br />
5.3.1. <strong>Market</strong> Size & <strong>Forecast</strong><br />
Email ID- contact@jsbmarketresearch.com<br />
Tel No- 91 2241236650<br />
Published by- http:/www.jsbmarketresearch.com/
5.3.1.1. By Value<br />
5.3.1.2. By Volume<br />
5.3.2. <strong>Market</strong> Share & <strong>Forecast</strong><br />
5.3.2.1. By Company<br />
5.3.3. <strong>Global</strong> <strong>Smart</strong> Glasses <strong>Market</strong> Dynamics<br />
5.3.3.1. <strong>Market</strong> Drivers & Restraints<br />
5.3.4. Price Point Analysis<br />
5.4. <strong>Global</strong> <strong>Smart</strong> Clothing <strong>Market</strong> Outlook<br />
5.4.1. <strong>Market</strong> Size & <strong>Forecast</strong><br />
5.4.1.1. By Value<br />
5.4.1.2. By Volume<br />
5.4.2. <strong>Global</strong> <strong>Smart</strong> Clothing <strong>Market</strong> Dynamics<br />
5.4.2.1. <strong>Market</strong> Drivers & Restraints<br />
5.4.3. Price Point Analysis<br />
6. <strong>Global</strong> <strong>Smart</strong> <strong>Wearable</strong> <strong>Market</strong> Regional Analysis<br />
6.1. Americas <strong>Smart</strong> <strong>Wearable</strong> <strong>Market</strong> Outlook<br />
6.1.1. <strong>Market</strong> Size & <strong>Forecast</strong><br />
6.1.1.1. By Value<br />
6.1.2. <strong>Market</strong> Share & <strong>Forecast</strong><br />
6.1.2.1. By Application<br />
6.1.3. Americas <strong>Smart</strong> <strong>Wearable</strong> <strong>Market</strong> Outlook, By Country<br />
6.2. EMEA <strong>Smart</strong> <strong>Wearable</strong> <strong>Market</strong> Outlook<br />
6.2.1. <strong>Market</strong> Size & <strong>Forecast</strong><br />
6.2.1.1. By Value<br />
6.2.2. <strong>Market</strong> Share & <strong>Forecast</strong><br />
6.2.2.1. By Application<br />
6.2.3. EMEA <strong>Smart</strong> <strong>Wearable</strong> <strong>Market</strong> Outlook, By Country<br />
6.3. Asia-Pacific <strong>Smart</strong> <strong>Wearable</strong> <strong>Market</strong> Outlook<br />
6.3.1. <strong>Market</strong> Size & <strong>Forecast</strong><br />
6.3.1.1. By Value<br />
6.3.2. <strong>Market</strong> Share & <strong>Forecast</strong><br />
6.3.2.1. By Application<br />
6.3.3. Asia-Pacific <strong>Smart</strong> <strong>Wearable</strong> <strong>Market</strong> Outlook, By Country<br />
7. <strong>Global</strong> <strong>Smart</strong> <strong>Wearable</strong> <strong>Market</strong> Trends & Developments<br />
7.1. Growing Adoption of Pico Projectors in <strong>Smart</strong>watches<br />
7.2. Curved <strong>Smart</strong>watches<br />
7.3. <strong>Smart</strong> Socks for Diabetes Patients<br />
7.4. <strong>Smart</strong> Innerwear<br />
7.5. Hologram Projection based <strong>Smart</strong> <strong>Wearable</strong> Technology<br />
Email ID- contact@jsbmarketresearch.com<br />
Tel No- 91 2241236650<br />
Published by- http:/www.jsbmarketresearch.com/
7.6. <strong>Smart</strong> Contact Lenses<br />
8. Competitive L<strong>and</strong>scape<br />
8.1. Company Profiles<br />
8.1.1. Samsung Electronics Co. Ltd.<br />
8.1.2. Fitbit Inc.<br />
8.1.3. Nike, Inc.<br />
8.1.4. Sony Corporation<br />
8.1.5. Garmin Ltd.<br />
8.1.6. Pebble Technology Corp.<br />
8.1.7. Google Inc.<br />
8.1.8. Misfit <strong>Wearable</strong> Corp.<br />
8.1.9. Jawbone<br />
8.1.10. Shanghai Nutshell Electronic Co., Ltd. (iGeak)<br />
8.1.11. Casio Computer Co., Ltd.<br />
8.1.12. Tex-Ray Industrial Co., Ltd.<br />
8.1.13. Recon Instruments, Inc.<br />
8.1.14. Vuzix Corporation<br />
9. Strategic Recommendations<br />
List Of Tables<br />
Table 1: US <strong>Smart</strong> <strong>Wearable</strong> <strong>Market</strong> Size & Growth Rate, By Value, 2012 – <strong>2019</strong>F (USD Billion)<br />
Table 2: Canada <strong>Smart</strong> <strong>Wearable</strong> <strong>Market</strong> Size & Growth Rate, By Value, 2012 – <strong>2019</strong>F (USD<br />
Billion)<br />
Table 3: Brazil <strong>Smart</strong> <strong>Wearable</strong> <strong>Market</strong> Size & Growth Rate, By Value, 2012 – <strong>2019</strong>F (USD<br />
Billion)<br />
Table 4: Other Countries <strong>Smart</strong> <strong>Wearable</strong> <strong>Market</strong> Size & Growth Rate, By Value, 2012 – <strong>2019</strong>F<br />
(USD Billion)<br />
Table 5: Germany <strong>Smart</strong> <strong>Wearable</strong> <strong>Market</strong> Size & Growth Rate, By Value, 2012 – <strong>2019</strong>F (USD<br />
Billion)<br />
Table 6: UK <strong>Smart</strong> <strong>Wearable</strong> <strong>Market</strong> Size & Growth Rate, By Value, 2012 – <strong>2019</strong>F (USD Billion)<br />
Table 7: France <strong>Smart</strong> <strong>Wearable</strong> <strong>Market</strong> Size & Growth Rate, By Value, 2012 – <strong>2019</strong>F (USD<br />
Billion)<br />
Table 8: Other Countries <strong>Smart</strong> <strong>Wearable</strong> <strong>Market</strong> Size & Growth Rate, By Value, 2012 – <strong>2019</strong>F<br />
(USD Billion)<br />
Table 9: Korea <strong>Smart</strong> <strong>Wearable</strong> <strong>Market</strong> Size & Growth Rate, By Value, 2012 – <strong>2019</strong>F (USD<br />
Billion)<br />
Table 10: China <strong>Smart</strong> <strong>Wearable</strong> <strong>Market</strong> Size & Growth Rate, By Value, 2012 – <strong>2019</strong>F (USD<br />
Billion)<br />
Email ID- contact@jsbmarketresearch.com<br />
Tel No- 91 2241236650<br />
Published by- http:/www.jsbmarketresearch.com/
Table 11: Other Countries <strong>Smart</strong> <strong>Wearable</strong> <strong>Market</strong> Size & Growth Rate, By Value, 2012 – <strong>2019</strong>F<br />
(USD Billion)<br />
Table 12: Samsung Electronics Financial Details, 2010 – 2013 (USD Billion)<br />
Table 13: Nike Inc. Financial Details, 2011 – 2014 (USD Billion)<br />
Table 14: Sony Corporation Financial Details, 2011 – 2014 (USD Billion)<br />
Table 15: Garmin Ltd. Financial Details, 2010 – 2013 (USD Billion)<br />
Table 16: Google Inc. Financial Details, 2010 – 2013 (USD Billion)<br />
Table 17: Casio Computer Co., Ltd. Financial Details, 2011 – 2014 (USD Billion)<br />
Table 18: Tex-Ray Industrial Co., Ltd. Financial Details, 2010 – 2013 (USD Million)<br />
Table 19: Vuzix Corporation Financial Details, 2010 – 2013 (USD Million)<br />
List Of Figures<br />
Figure 1: <strong>Global</strong> <strong>Smart</strong> <strong>Wearable</strong> <strong>Market</strong> Size, By Value, 2012 – 2013 (USD Billion)<br />
Figure 2: <strong>Global</strong> <strong>Smart</strong> <strong>Wearable</strong> <strong>Market</strong> Size, By Value, 2014E – <strong>2019</strong>F (USD Billion)<br />
Figure 3: <strong>Global</strong> <strong>Smart</strong> <strong>Wearable</strong> <strong>Market</strong> Size, By Volume, 2012 – 2013 (Million Units)<br />
Figure 4: <strong>Global</strong> <strong>Smart</strong> <strong>Wearable</strong> <strong>Market</strong> Size, By Volume, 2014E – <strong>2019</strong>F (Million Units)<br />
Figure 5: <strong>Global</strong> <strong>Smart</strong> <strong>Wearable</strong> <strong>Market</strong> Share, By Type, By Value, 2013<br />
Figure 6: <strong>Global</strong> <strong>Smart</strong> <strong>Wearable</strong> <strong>Market</strong> Share, By Type, By Value, <strong>2019</strong>F<br />
Figure 7: <strong>Global</strong> <strong>Smart</strong> <strong>Wearable</strong> <strong>Market</strong> Share, By Application, By Value, 2013<br />
Figure 8: <strong>Global</strong> <strong>Smart</strong> <strong>Wearable</strong> <strong>Market</strong> Share, By Application, By Value, <strong>2019</strong>F<br />
Figure 9: <strong>Global</strong> Healthcare <strong>Market</strong> Size & Growth Rate, By Value, 2013 – <strong>2019</strong>F (USD Billion)<br />
Figure 10: <strong>Global</strong> Consumer Electronics <strong>Market</strong> Size & Growth Rate, By Value, 2013 – <strong>2019</strong>F<br />
(USD Billion)<br />
Figure 11: <strong>Global</strong> <strong>Smart</strong>phones <strong>Market</strong> Size & Growth Rate, By Volume, 2013 – <strong>2019</strong>F (Million<br />
Units)<br />
Figure 12: <strong>Global</strong> Military Spending <strong>Market</strong> Size, By Value, 2010 – <strong>2019</strong>F (USD Billion)<br />
Figure 13: <strong>Global</strong> Apparel <strong>Market</strong> Size & Growth Rate, By Value, 2013 – <strong>2019</strong>F (USD Billion)<br />
Figure 14: <strong>Global</strong> <strong>Smart</strong>watch <strong>Market</strong> Size, By Value, 2012 – 2013 (USD Billion)<br />
Figure 15: <strong>Global</strong> <strong>Smart</strong>watch <strong>Market</strong> Size, By Value, 2014E – <strong>2019</strong>F (USD Billion)<br />
Figure 16: <strong>Global</strong> <strong>Smart</strong>watch <strong>Market</strong> Size, By Volume, 2012 – 2013 (Million Units)<br />
Figure 17: <strong>Global</strong> <strong>Smart</strong>watch <strong>Market</strong> Size, By Volume, 2014E – <strong>2019</strong>F (Million Units)<br />
Figure 18: <strong>Global</strong> <strong>Smart</strong>watch <strong>Market</strong> Share, By Company, By Value, 2013<br />
Figure 19: <strong>Global</strong> <strong>Smart</strong>watch <strong>Market</strong> Share, By Company, By Value, <strong>2019</strong>F<br />
Figure 20: <strong>Global</strong> <strong>Smart</strong>watch Average Selling Price, 2012 – <strong>2019</strong>F (USD per Unit)<br />
Figure 21: <strong>Global</strong> <strong>Smart</strong>b<strong>and</strong> <strong>Market</strong> Size, By Value, 2012 – 2013 (USD Billion)<br />
Figure 22: <strong>Global</strong> <strong>Smart</strong>b<strong>and</strong> <strong>Market</strong> Size, By Value, 2014E – <strong>2019</strong>F (USD Billion)<br />
Figure 23: <strong>Global</strong> <strong>Smart</strong>b<strong>and</strong> <strong>Market</strong> Size, By Volume, 2012 – 2013 (Million Units)<br />
Email ID- contact@jsbmarketresearch.com<br />
Tel No- 91 2241236650<br />
Published by- http:/www.jsbmarketresearch.com/
Figure 24: <strong>Global</strong> <strong>Smart</strong>b<strong>and</strong> <strong>Market</strong> Size, By Volume, 2014E – <strong>2019</strong>F (Million Units)<br />
Figure 25: <strong>Global</strong> <strong>Smart</strong>b<strong>and</strong> <strong>Market</strong> Share, By Company, By Value, 2013<br />
Figure 26: <strong>Global</strong> <strong>Smart</strong>b<strong>and</strong> <strong>Market</strong> Share, By Company, By Value, <strong>2019</strong>F<br />
Figure 27: <strong>Global</strong> <strong>Smart</strong>b<strong>and</strong> Average Selling Price, 2012 – <strong>2019</strong>F (USD per Unit)<br />
Figure 28: <strong>Global</strong> <strong>Smart</strong> Glasses <strong>Market</strong> Size, By Value, 2012 – 2013 (USD Billion)<br />
Figure 29: <strong>Global</strong> <strong>Smart</strong> Glasses <strong>Market</strong> Size, By Value, 2014E – <strong>2019</strong>F (USD Billion)<br />
Figure 30: <strong>Global</strong> <strong>Smart</strong> Glasses <strong>Market</strong> Size, By Volume, 2012 – 2013 (Million Units)<br />
Figure 31: <strong>Global</strong> <strong>Smart</strong> Glasses <strong>Market</strong> Size, By Volume, 2014E – <strong>2019</strong>F (Million Units)<br />
Figure 32: <strong>Global</strong> <strong>Smart</strong> Glasses <strong>Market</strong> Share, By Company, By Value, 2013<br />
Figure 33: <strong>Global</strong> <strong>Smart</strong> Glasses Average Selling Price, 2012 – <strong>2019</strong>F (USD per Unit)<br />
Figure 34: <strong>Global</strong> <strong>Smart</strong> Clothing <strong>Market</strong> Size, By Value, 2013 – <strong>2019</strong>F (USD Million)<br />
Figure 35: <strong>Global</strong> <strong>Smart</strong> Clothing <strong>Market</strong> Size, By Volume, 2013 – <strong>2019</strong>F (Thous<strong>and</strong> Units)<br />
Figure 36: <strong>Global</strong> <strong>Smart</strong> Clothing Average Selling Price, 2013 – <strong>2019</strong>F (USD per Unit)<br />
Figure 37: Americas <strong>Smart</strong> <strong>Wearable</strong> <strong>Market</strong> Size, By Value, 2012 – 2013 (USD Billion)<br />
Figure 38: Americas <strong>Smart</strong> <strong>Wearable</strong> <strong>Market</strong> Size, By Value, 2014E – <strong>2019</strong>F (USD Billion)<br />
Figure 39: Americas <strong>Smart</strong> <strong>Wearable</strong> <strong>Market</strong> Share, By Application, By Value, 2013<br />
Figure 40: Americas <strong>Smart</strong> <strong>Wearable</strong> <strong>Market</strong> Share, By Application, By Value, <strong>2019</strong>F<br />
Figure 41: Americas Healthcare <strong>Market</strong> Size & Growth Rate, By Value, 2013 – <strong>2019</strong>F (USD<br />
Billion)<br />
Figure 42: Americas Consumer Electronics <strong>Market</strong> Size & Growth Rate, By Value, 2013 – <strong>2019</strong>F<br />
(USD Billion)<br />
Figure 43: Americas <strong>Smart</strong>phone <strong>Market</strong> Size & Growth Rate, By Volume, 2013 – <strong>2019</strong>F (Million<br />
Units)<br />
Figure 44: Americas Military Spending <strong>Market</strong> Size, By Value, 2010 – <strong>2019</strong>F (USD Billion)<br />
Figure 45: Americas Apparel <strong>Market</strong> Size & Growth Rate, By Value, 2013 – <strong>2019</strong>F (USD Billion)<br />
Figure 46: US <strong>Smart</strong> <strong>Wearable</strong> <strong>Market</strong> Share, By Region, By Value, 2013 & <strong>2019</strong>F<br />
Figure 47: Canada <strong>Smart</strong> <strong>Wearable</strong> <strong>Market</strong> Share, By Region, By Value, 2013 & <strong>2019</strong>F<br />
Figure 48: Brazil <strong>Smart</strong> <strong>Wearable</strong> <strong>Market</strong> Share, By Region, By Value, 2013 & <strong>2019</strong>F<br />
Figure 49: Other Countries <strong>Smart</strong> <strong>Wearable</strong> <strong>Market</strong> Share, By Region, By Value, 2013 & <strong>2019</strong>F<br />
Figure 50: EMEA <strong>Smart</strong> <strong>Wearable</strong> <strong>Market</strong> Size, By Value, 2012 – 2013 (USD Billion)<br />
Figure 51: EMEA <strong>Smart</strong> <strong>Wearable</strong> <strong>Market</strong> Size, By Value, 2014E – <strong>2019</strong>F (USD Billion)<br />
Figure 52: EMEA <strong>Smart</strong> <strong>Wearable</strong> <strong>Market</strong> Share, By Application, By Value, 2013<br />
Figure 53: EMEA <strong>Smart</strong> <strong>Wearable</strong> <strong>Market</strong> Share, By Application, By Value, <strong>2019</strong>F<br />
Figure 54: EMEA Healthcare <strong>Market</strong> Size & Growth Rate, By Value, 2013 – <strong>2019</strong>F (USD Billion)<br />
Figure 55: EMEA Consumer Electronics <strong>Market</strong> Size & Growth Rate, By Value, 2013 – <strong>2019</strong>F<br />
(USD Billion)<br />
Figure 56: EMEA <strong>Smart</strong>phone <strong>Market</strong> Size & Growth Rate, By Volume, 2013 – <strong>2019</strong>F (Million<br />
Units)<br />
Figure 57: EMEA Military Spending <strong>Market</strong> Size, By Value, 2010 – <strong>2019</strong>F (USD Billion)<br />
Email ID- contact@jsbmarketresearch.com<br />
Tel No- 91 2241236650<br />
Published by- http:/www.jsbmarketresearch.com/
Figure 58: EMEA Apparel <strong>Market</strong> Size & Growth Rate, By Value, 2013 – <strong>2019</strong>F (USD Billion)<br />
Figure 59: Germany <strong>Smart</strong> <strong>Wearable</strong> <strong>Market</strong> Share, By Region, By Value, 2013 & <strong>2019</strong>F<br />
Figure 60: UK <strong>Smart</strong> <strong>Wearable</strong> <strong>Market</strong> Share, By Region, By Value, 2013 & <strong>2019</strong>F<br />
Figure 61: France <strong>Smart</strong> <strong>Wearable</strong> <strong>Market</strong> Share, By Region, By Value, 2013 & <strong>2019</strong>F<br />
Figure 62: Other Countries <strong>Smart</strong> <strong>Wearable</strong> <strong>Market</strong> Share, By Region, 2013 & <strong>2019</strong>F<br />
Figure 63: Asia-Pacific <strong>Smart</strong> <strong>Wearable</strong> <strong>Market</strong> Size, By Value, 2012 – 2013 (USD Billion)<br />
Figure 64: Asia-Pacific <strong>Smart</strong> <strong>Wearable</strong> <strong>Market</strong> Size, By Value, 2014E – <strong>2019</strong>F (USD Billion)<br />
Figure 65: Asia-Pacific <strong>Smart</strong> <strong>Wearable</strong> <strong>Market</strong> Share, By Application, By Value, 2013<br />
Figure 66: Asia-Pacific <strong>Smart</strong> <strong>Wearable</strong> <strong>Market</strong> Share, By Application, By Value, <strong>2019</strong>F<br />
Figure 67: Asia-Pacific Consumer Electronics <strong>Market</strong> Size & Growth Rate, By Value, 2013 –<br />
<strong>2019</strong>F (USD Billion)<br />
Figure 68: Asia-Pacific <strong>Smart</strong>phone <strong>Market</strong> Size & Growth Rate, By Volume, 2013 – <strong>2019</strong>F<br />
(Million Units)<br />
Figure 69: Asia-Pacific Healthcare <strong>Market</strong> Size & Growth Rate, By Value, 2013 – <strong>2019</strong>F (USD<br />
Billion)<br />
Figure 70: Asia-Pacific Military Spending <strong>Market</strong> Size, By Value, 2010 – <strong>2019</strong>F (USD Billion)<br />
Figure 71: Asia-Pacific Apparel <strong>Market</strong> Size & Growth Rate, By Value, 2013 – <strong>2019</strong>F (USD<br />
Billion)<br />
Figure 72: Korea <strong>Smart</strong> <strong>Wearable</strong> <strong>Market</strong> Share, By Region, By Value, 2013 & <strong>2019</strong>F<br />
Figure 73: China <strong>Smart</strong> <strong>Wearable</strong> <strong>Market</strong> Share, By Region, By Value, 2013 & <strong>2019</strong>F<br />
Figure 74: Other Countries <strong>Smart</strong> <strong>Wearable</strong> <strong>Market</strong> Share, By Region, 2013 & <strong>2019</strong>F<br />
Figure 75: <strong>Global</strong> Pico Projector <strong>Market</strong> Size, By Volume, 2010 – 2013 (Million Units)<br />
Figure 76: <strong>Global</strong> Pico Projector <strong>Market</strong> Size, By Volume, 2014E – <strong>2019</strong>F (Million Units)<br />
Figure 77: <strong>Global</strong> Holographic Display Industrial Applications <strong>Market</strong> Size, By Value, 2010 –<br />
2013 (USD Billion)<br />
Figure 78: <strong>Global</strong> Holographic Display Industrial Applications <strong>Market</strong> Size, By Value, 2014E –<br />
<strong>2019</strong>F (USD Billion)<br />
Related reports:<br />
Strategic Focus Report - Enterprise Applications: Technology <strong>and</strong> market trends<br />
Optical Imaging <strong>Market</strong> Technology Trends And Applications (customer Report)<br />
Technology <strong>Market</strong> <strong>Research</strong><br />
Email ID- contact@jsbmarketresearch.com<br />
Tel No- 91 2241236650<br />
Published by- http:/www.jsbmarketresearch.com/
About <strong>JSB</strong> <strong>Market</strong> <strong>Research</strong>:-<br />
<strong>JSB</strong> market research is a leading player in the market of research report distribution. It is<br />
one-stop-shop for all information related to market research for any sector of the industry.<br />
Along with providing in-depth analysis though reports, <strong>JSB</strong> market research also provides<br />
regular updates of the market though newsletters. Our reports are a well-researched work of<br />
market researchers with an extensive knowledge <strong>and</strong> a good level of market experience.<br />
To know more on <strong>Global</strong> <strong>Smart</strong> <strong>Wearable</strong> <strong>Market</strong> <strong>Forecast</strong> <strong>and</strong> <strong>Opportunities</strong>, <strong>2019</strong><br />
http://www.jsbmarketresearch.com/technology/r-<strong>Global</strong>-<strong>Smart</strong>-<strong>Wearable</strong>-<strong>Market</strong>-<strong>Forecast</strong><strong>and</strong>-<strong>Opportunities</strong>-123160<br />
Email ID- contact@jsbmarketresearch.com<br />
Tel No- 91 2241236650<br />
Published by- http:/www.jsbmarketresearch.com/