clicking here - TBM Consulting Group
clicking here - TBM Consulting Group
clicking here - TBM Consulting Group

Create successful ePaper yourself
Turn your PDF publications into a flip-book with our unique Google optimized e-Paper software.
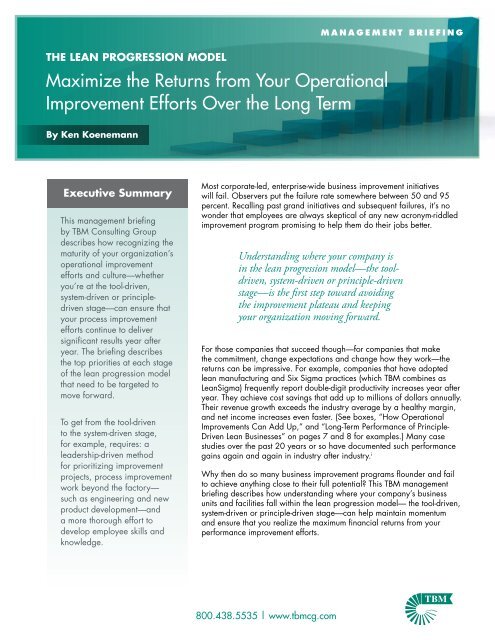
M A N A G E M E N T B R I E F I N G<br />
THE LEAN PROGRESSION MODEL<br />
Maximize the Returns from Your Operational<br />
Improvement Efforts Over the Long Term<br />
By Ken Koenemann<br />
Executive Summary<br />
This management briefing<br />
by <strong>TBM</strong> <strong>Consulting</strong> <strong>Group</strong><br />
describes how recognizing the<br />
maturity of your organization’s<br />
operational improvement<br />
efforts and culture—whether<br />
you’re at the tool-driven,<br />
system-driven or principledriven<br />
stage—can ensure that<br />
your process improvement<br />
efforts continue to deliver<br />
significant results year after<br />
year. The briefing describes<br />
the top priorities at each stage<br />
of the lean progression model<br />
that need to be targeted to<br />
move forward.<br />
To get from the tool-driven<br />
to the system-driven stage,<br />
for example, requires: a<br />
leadership-driven method<br />
for prioritizing improvement<br />
projects, process improvement<br />
work beyond the factory—<br />
such as engineering and new<br />
product development—and<br />
a more thorough effort to<br />
develop employee skills and<br />
knowledge.<br />
Most corporate-led, enterprise-wide business improvement initiatives<br />
will fail. Observers put the failure rate somew<strong>here</strong> between 50 and 95<br />
percent. Recalling past grand initiatives and subsequent failures, it’s no<br />
wonder that employees are always skeptical of any new acronym-riddled<br />
improvement program promising to help them do their jobs better.<br />
Understanding w<strong>here</strong> your company is<br />
in the lean progression model—the tooldriven,<br />
system-driven or principle-driven<br />
stage—is the first step toward avoiding<br />
the improvement plateau and keeping<br />
your organization moving forward.<br />
For those companies that succeed though—for companies that make<br />
the commitment, change expectations and change how they work—the<br />
returns can be impressive. For example, companies that have adopted<br />
lean manufacturing and Six Sigma practices (which <strong>TBM</strong> combines as<br />
LeanSigma) frequently report double-digit productivity increases year after<br />
year. They achieve cost savings that add up to millions of dollars annually.<br />
Their revenue growth exceeds the industry average by a healthy margin,<br />
and net income increases even faster. (See boxes, “How Operational<br />
Improvements Can Add Up,” and “Long-Term Performance of Principle-<br />
Driven Lean Businesses” on pages 7 and 8 for examples.) Many case<br />
studies over the past 20 years or so have documented such performance<br />
gains again and again in industry after industry. i<br />
Why then do so many business improvement programs flounder and fail<br />
to achieve anything close to their full potential? This <strong>TBM</strong> management<br />
briefing describes how understanding w<strong>here</strong> your company’s business<br />
units and facilities fall within the lean progression model— the tool-driven,<br />
system-driven or principle-driven stage—can help maintain momentum<br />
and ensure that you realize the maximum financial returns from your<br />
performance improvement efforts.<br />
800.438.5535 | www.tbmcg.com
P G . 2<br />
Fountains of Inspiration<br />
Two primary schools of thought have influenced today’s<br />
management parlance and business improvement<br />
activities. Lean manufacturing grew out of the processexcellence<br />
practices of the Toyota Production System,<br />
which was inspired by Ford and evolved from the<br />
material and capacity constraints that Toyota had to<br />
contend with in the aftermath of World War II. Six<br />
Sigma emerged from an engineering program that<br />
Motorola launched in 1986 that unified decades of<br />
quality improvement practices to eliminate product<br />
defects by reducing process variations.<br />
A long list of popular concepts, methodologies,<br />
and well-known tools emerged from these two<br />
complementary approaches: kaizen events,<br />
spaghetti diagrams, DMAIC, rapid problem solving,<br />
Pareto analysis, value stream mapping, policy<br />
deployment, cause-and-effect diagrams, mistake<br />
proofing, standard work, SMED, 5S, TPM, voice<br />
of the customer, 5 Whys, and many others. These<br />
process improvement tactics have been adopted<br />
by two-thirds of manufacturing companies II , not to<br />
mention many financial firms, state and federal<br />
government organizations, and hospitals.<br />
Over the years many of these tools have captured<br />
popular attention and been promoted as the magic<br />
bullet that would give companies a clear and<br />
sustained competitive edge. Then, when the results<br />
didn’t meet the heightened expectations, the tools<br />
were discredited and leaders moved on to the next<br />
hot tool.<br />
“Companies start using a tool because their<br />
competitors are using it, or because it’s the hot topic in<br />
the business press, but if they do not fully understand<br />
how and why to use it, the experience ends up in<br />
failure,” confirm Darrell Rigby and Barbara Bilodeau<br />
in Bain & Company’s annual study of management<br />
tools and trends. iii<br />
The fault isn’t with the tools themselves. An<br />
increasing number of company leaders today<br />
RATE OF CHANGE<br />
recognize that such process- and qualityimprovement<br />
methods are elements of a culture that<br />
fosters superior execution and ongoing performance<br />
improvement. Make no mistake. It’s still essential for<br />
employees to know about and be proficient in these<br />
practices, but the systems and culture that surround<br />
and nurture them are more important for making<br />
steady and sustainable progress. The following lean<br />
progression model describes the evolutionary path<br />
that leading companies have followed to move from<br />
a tool focus to an embedded culture of operational<br />
excellence.<br />
The Lean Progression Model<br />
1 TOOL DRIVEN 2 SYSTEM DRIVEN 3 PRINCIPLE DRIVEN<br />
TIME<br />
Year 1 Year 2 Year 3 Year 4 Year 5<br />
After several years the outward rate of business improvement<br />
often slows down because the easy wins have been captured.<br />
But if the progress is sustained, the second and third years<br />
are when accumulated financial gains (net income and cash<br />
flow) really begin to kick in. Sustained focus creates a longterm<br />
continuous improvement culture that constantly strives<br />
to increase customer value, which drives industry-leading<br />
revenue growth. Today, many organizations with experienced<br />
leaders are striving for a rapid transformation in 24-36<br />
months instead of the more traditional five-year period.<br />
800.438.5535 | www.tbmcg.com
P G . 3<br />
The Three Stages of a Lasting<br />
Business Transformation, and<br />
How To Keep Moving Forward<br />
The Tool-Driven Stage<br />
1 TOOL DRIVEN 2 SYSTEM DRIVEN 3 PRINCIPLE DRIVEN<br />
Although the process improvements are obvious if<br />
you walk through the factory—they include dramatic<br />
inventory reductions and productivity improvements,<br />
and cleanliness if 5S is emphasized—these efforts<br />
may not have made a significant impact on the P&L<br />
statements, at least not yet. Costs have certainly been<br />
reduced, margins have been improved, and inventory<br />
reductions have reduced working capital requirements.<br />
But major financial benefits haven’t been fully captured<br />
because the emphasis is still on operational issues.<br />
To move to the system-driven stage, business<br />
leaders should:<br />
RATE OF CHANGE<br />
TIME<br />
Year 1 Year 2 Year 3 Year 4 Year 5<br />
The initial tool-driven stage of an operationalexcellence<br />
program is characterized by a<br />
departmental emphasis on reducing costs. For<br />
manufacturing companies this usually starts in the<br />
factory. After some documented successes on the<br />
plant floor, efforts move into office, engineering and<br />
administrative areas.<br />
People have learned about the process-improvement<br />
tools by transforming batch operations into work cells<br />
w<strong>here</strong> work (i.e., material, information, procedures)<br />
flows one piece at a time. Teams have developed<br />
standard-work descriptions, implemented visual flow<br />
systems and status indicators, and reduced work<br />
changeover times.<br />
At the tool-driven stage, problem-solving capabilities<br />
are just beginning to be developed. A habitual<br />
obsession with root causes and countermeasures has<br />
not yet taken hold.<br />
1. Establish a continuous improvement (CI) office and<br />
a CI steering committee—made up of P&L owners,<br />
the CFO, and operations leaders—who help<br />
remove functional barriers and prioritize projects.<br />
2. Deepen leadership’s commitment to strategy<br />
deployment, which should begin to instill more<br />
disciplined management processes and help the<br />
organization focus on growth opportunities in<br />
addition to the current emphasis on cost cutting.<br />
3. Complete a thorough operational assessment<br />
to identify high-potential areas of improvement,<br />
leading to the creation of a continuous improvement<br />
(CI) roadmap clearly aligned with business<br />
objectives based on customer needs, such as<br />
enhanced responsiveness and flexibility contributing<br />
to superior service.<br />
4. Capture cost savings through attrition, closing of<br />
redundant facilities and warehouses, in-source<br />
work, and leverage newly released capacity to<br />
boost sales.<br />
5. To speed deployment, expand associate awareness<br />
training and skill development at all levels.<br />
6. Begin to look at other areas of the business, such<br />
as the new product development process, mapping<br />
customer needs and expectations to deliver distinct<br />
product offerings and services.<br />
800.438.5535 | www.tbmcg.com
P G . 4<br />
The System-Driven Stage<br />
RATE OF CHANGE<br />
1 TOOL DRIVEN 2 SYSTEM DRIVEN 3 PRINCIPLE DRIVEN<br />
TIME<br />
Year 1 Year 2 Year 3 Year 4 Year 5<br />
With over half of managers and employees<br />
participating on improvement teams and projects,<br />
organizations in the system-driven stage have a<br />
deeper understanding of the process-improvement<br />
tools. A systematic approach to problem solving<br />
and implementing changes has been adopted<br />
in functional areas beyond the factory, including<br />
shipping, administration, supply chain and<br />
engineering. Based on project involvement and<br />
results, people are beginning to understand and<br />
accept that process improvement is a central part<br />
of the company culture. Measureable improvements<br />
include significant cost reductions, shorter lead<br />
times, cumulative productivity gains of five percent<br />
or more per year, better asset utilization and cash<br />
generation. But significant opportunities remain.<br />
At the leadership level strategy deployment efforts<br />
should have a shorter list of critical objectives that<br />
can be adequately resourced, and the company<br />
is becoming more successful at hitting its strategic<br />
breakthroughs. Monthly business review meetings<br />
are driving corrective actions, which in turn is<br />
dramatically improving results. Overall, improvement<br />
efforts are beginning to have a noticeable impact on<br />
overall financial results.<br />
To move to the principle-driven stage—and make<br />
faster progress—business leaders should:<br />
1. Expand the focus of process improvement efforts<br />
to product and service design, as well as sales<br />
and marketing activities. If the bottom line isn’t<br />
growing at least two times faster than the top<br />
line, opportunities may exist in such areas w<strong>here</strong><br />
it is more difficult to “see” the waste.<br />
2. Work on the extended value stream, enhancing<br />
relationships and information connections to<br />
retailers, customers, distributors, and back up<br />
the supply chain.<br />
3. Develop a strategic focus on supplier<br />
management, with key performance metrics<br />
and partner-like relationships with suppliers.<br />
4. Explore a value stream business management<br />
approach, including demand segmentation<br />
analysis, that drives service and fulfillment<br />
process design strategies that maximize margins<br />
and reduce working capital requirements, while<br />
enhancing value for your customers.<br />
At this stage the immense opportunities for<br />
responsiveness improvements and cost reductions<br />
deeper in the value chain become apparent. For<br />
manufacturing operations, one-piece flow has been<br />
widely implemented internally, but not in the supply<br />
base. While work-in-process and finished goods<br />
inventory turns have dramatically improved, many<br />
raw materials are still purchased in bulk with long<br />
lead times.<br />
800.438.5535 | www.tbmcg.com
P G . 5<br />
The Principle-Driven Stage<br />
RATE OF CHANGE<br />
1 TOOL DRIVEN 2 SYSTEM DRIVEN 3 PRINCIPLE DRIVEN<br />
TIME<br />
Year 1 Year 2 Year 3 Year 4 Year 5<br />
For companies in the principle-driven stage<br />
process-improvement concepts are thoroughly<br />
embedded in a comprehensive business<br />
management and performance system. Cost<br />
reductions and productivity gains remain<br />
important, but many improvement initiatives<br />
directly support revenue growth.<br />
Companies in this stage are able to leverage<br />
their operational advantages—such as fast<br />
order-to-delivery times (often 50 percent faster<br />
than the industry average), responsiveness<br />
to customer inquiries and superior product<br />
reliability—to increase market share. An intense<br />
focus on customers drives end-to-end value chain<br />
alignment characterized by strong supplier<br />
relationships and customer linkages.<br />
These connections should boost new product<br />
introductions as indicated by “product vitality,”<br />
the percent of revenue coming from new product<br />
sales over a 12- to 36-month period depending<br />
upon the typical product lifecycle. In the high<br />
tech or fashion sectors, for example, a product<br />
vitality objective might be to have 30-50 percent<br />
of revenue coming from products introduced in<br />
the past 6-12 months.<br />
Strong customer relationships also enable quick<br />
responses to supply or demand disruptions, and<br />
enhance the ability to capitalize on new market<br />
openings. When such a culture is embedded<br />
across the enterprise, individual leadership<br />
changes do not affect the underlying culture or<br />
performance trajectory.<br />
At this stage, the process-improvement<br />
knowledge and expertise of the organization can<br />
drive acquisition opportunities. Management’s<br />
intimate understanding of the potential for<br />
operational improvement—coupled with strong<br />
cash flow and enhanced margins—guides due<br />
diligence, rapid integration of acquisitions and<br />
post-integration activities.<br />
Ongoing areas of focus for process improvement<br />
efforts include:<br />
1. Use of free cash to buy competitors or to acquire<br />
businesses or technology in new markets.<br />
2. A leadership development process provides<br />
opportunities for talented people to learn and<br />
gain responsibility quickly, often in newly<br />
acquired businesses.<br />
3. A core focus on innovation processes, starting<br />
with the ability to clearly understand voice<br />
of customer (VOC), translate needs into<br />
meaningful product innovations, effective<br />
process to design for manufacturability and<br />
profitability, and an ability to improve speed<br />
to market.<br />
4. Support functions—maintenance, accounting,<br />
customer service, and suppliers—are fully<br />
integrated into the continuous improvement<br />
mindset.<br />
800.438.5535 | www.tbmcg.com
P G . 6<br />
Maturity and Beyond<br />
Regardless of the success that’s achieved, the<br />
process and organizational changes required to<br />
keep moving forward will always challenge the<br />
beliefs, traditions, habits, customs, policies and<br />
attitudes—the culture—that may have contributed<br />
to a company’s present success. Researchers<br />
have found that top performing firms—as defined<br />
by superior sales growth, ROIC, shareholder<br />
returns, innovation, customer satisfaction, quality<br />
and other measures—tend to exhibit “high<br />
performance cultures.” v<br />
“I always viewed culture as one of those things<br />
you talked about, like marketing and advertising.<br />
It was one of the tools that a manager had at<br />
his or her disposal when you think about an<br />
enterprise,” Louis Gerstner, the former CEO of<br />
IBM, once said. “The thing I have learned at IBM<br />
is that culture is everything.” vi<br />
Relatively few organizations manage to<br />
become-principle driven. Fewer still maintain the<br />
knowledge and management behavior needed<br />
to keep such an advantage for five years or<br />
longer, which by no coincidence is around<br />
the average tenure of a CEO and leadership<br />
team. vii <strong>TBM</strong> believes that fostering a deeper<br />
understanding of the lean progression model—<br />
looking beyond the current month’s projects and<br />
priorities—will help more company leadership<br />
foster a superior culture that allows employees<br />
to serve customers better and leads to superior<br />
financial performance.<br />
How Operational Improvements Can Add Up<br />
Jumping Off<br />
Point<br />
24-36 Months<br />
Into Lean<br />
Implementation<br />
Improvement<br />
vs. Jumping<br />
Off Point<br />
Sales $1,000,000,000 $1,150,000,000 15.0%<br />
EBIT $70,000,000 7.0% $91,700,000 8.0% 31.0%<br />
Inventory $200,000,000 20.0% $138,000,000 12.0% -31.0%<br />
Fixed Capital $200,000,000 20.0% $180,000,000 15.7% -10.0%<br />
Return on<br />
Invested Capital<br />
17.5% 28.8%<br />
Total Debt $100,000,000 $40,000,000 -60.0%<br />
Wealth Creation $665,000,000 $924,350,000 39.0%<br />
Share Price $67 $103.18 54.0%<br />
Key benchmarks for best-in-class operational excellence include 1) superior return on invested capital (ROIC), 2) revenue growth at<br />
least 2X the nearest competitors, and 3) operating income growing at twice the rate of your top line. The sample financial summary<br />
above shows how a 24-36 month investment in operational excellence can yield a 31 percent EBIT improvement, a 31 percent<br />
reduction in inventory and a 10 percent reduction in fixed capital. The ROIC improves from 17.5 percent to 28.8 percent resulting<br />
in a 54 percent increase in share price and significant wealth creation for the organization and its key stakeholders.<br />
800.438.5535 | www.tbmcg.com
P G . 7<br />
Long-Term Performance of Principle-Driven Lean Businesses<br />
Danaher Business System Drives Value Creation<br />
Revenue EPS Free Cash Flow<br />
2002 2010 2002 2010 2002 2010<br />
Danaher Corp., a $16 billion conglomerate based in Washington, D.C., is the pre-eminent U.S. practitioner of lean business<br />
practices. The company has reported a five-year annual growth rate of 10 percent or more, and dividend growth of 18 percent. Today<br />
more than half of the company’s revenues come from outside of its home country. The company has delivered a 25 percent annual return<br />
to shareholder over the past 20 years, better than GE (16 percent), Berkshire Hathaway (21 percent) and the S&P 500 (12 percent).<br />
Hubbell Performance Transformation<br />
Revenue Net Income Inventory Days<br />
Lean Launch<br />
Lean Launch<br />
Lean Launch<br />
1996 2010 1996 2010 1996<br />
2010<br />
Hubbell Inc., a global manufacturer of electrical products for construction and utility applications based in Shelton, Conn.,<br />
reported 2011 revenues of $2.9 billion. After company leaders made a commitment to lean, establishing a lean steering<br />
committee to align improvement priorities, the company doubled sales over a seven-year period, and quadrupled net income<br />
and EPS. Reductions in inventory and other assets generated over $240 million in cash over the first five years of the initiative.<br />
WIKA Leverages Lean for Competitiveness & Growth<br />
Revenue Operating Income Inventory Per Day<br />
Lean Launch<br />
Began inventory<br />
reduction work<br />
Lean Launch<br />
2000 2010 2000 2010 2000<br />
2010<br />
WIKA Alexander Wiegand SE, (Klingenberg, Germany) sells over 40 million gauges, thermometers and other measurement<br />
instruments annually. Over 10 years the 60-year-old, family-owned company has slashed manufacturing lead times and delivery times. It<br />
now ships high-quality, customized products in just three to five days. Sales have doubled over the period, and earnings have quadrupled.<br />
800.438.5535 | www.tbmcg.com
P G . 8<br />
Acknowledgements<br />
The author wishes to express his<br />
appreciation to the insights of <strong>TBM</strong><br />
staff members and the experience<br />
of many of our clients who have<br />
contributed to the lean progression<br />
model. Specifically, he would like<br />
to acknowledge the contributions of<br />
Bill Remy, Anand Sharma, Angela<br />
Scenna, Gary Rascoe, Carl Deeley<br />
and David Beal.<br />
About the Author<br />
Ken Koenemann, a Vice President<br />
at <strong>TBM</strong> <strong>Consulting</strong> <strong>Group</strong>, has over<br />
20 years of leadership experience<br />
in manufacturing and supply chain<br />
operations. He concentrates on<br />
operational performance improvement<br />
through LeanSigma ® deployment in<br />
manufacturing, supply chain and<br />
project management across various<br />
industries. He also specializes in rapid<br />
deployment of improvement initiatives<br />
in private equity and public owned<br />
companies. He publishes articles<br />
regularly, is quoted in the national<br />
media, and speaks at industry and<br />
supply chain conferences.<br />
Lean Progress Assessment Scores Businesses<br />
in Four Key Areas: Culture, Tool Mastery,<br />
Partner Alignment and Revenue Generation<br />
A new online assessment tool based on the lean progression model from <strong>TBM</strong><br />
<strong>Consulting</strong> <strong>Group</strong> helps organizations understand how to better leverage<br />
continuous improvement initiatives for growth and improved financial results. It<br />
scores organizations on their cultural attributes, management knowledge of which<br />
tools to use and when to use them, how well the companies use lean tools to serve<br />
customers and suppliers, and their ability to leverage improvements to achieve and<br />
support growth initiatives. Such characteristics are then be plotted against revenue<br />
growth, operating income and cash flow to determine if financial results are<br />
aligned with their performance improvement efforts. To participate and receive your<br />
customized lean progress assessment report, visit www.tbmleanassessment.com.<br />
About <strong>TBM</strong> <strong>Consulting</strong> <strong>Group</strong><br />
<strong>TBM</strong> is a global operations management consulting firm that maximizes enterprise<br />
value and accelerates growth by working with clients to leverage operational<br />
excellence. We work side-by-side with our clients to immediately improve<br />
EBITDA, accelerate organic growth, integrate newly acquired businesses, and<br />
generate immediate and long-term balance sheet improvements. Our subjectmatter<br />
professionals average 15-25 years of operational, management and<br />
executive experience, and none of them are career consultants. We leave behind<br />
a customized framework and structure for lasting change using our proprietary<br />
LeanSigma ® approach, which has been continuously improved since its introduction<br />
over 20 years ago.<br />
i. For specific examples see IndustryWeek magazine’s Best Plants winners (going back to 1990), and Shingo Prize winners (going back to 1988).<br />
ii. 2010 Manufacturing and Wholesale Distribution National Survey (RSM McGladrey, June 7, 2010).<br />
iii. Rigby, Darrell and Bilodeau, Barbara, Management Tools &Trends 2011, (Bain & Company, December 13, 2010).<br />
iv. Henderson, Bruce D., The Boston <strong>Consulting</strong> <strong>Group</strong>, Inc., 1968.<br />
v. Denison, Daniel R., Corporate Culture and Organizational Effectiveness (John Wiley, 1990).<br />
vi. Lagace, Martha, “Gerstner: Changing Culture at IBM,” Harvard Business School (HBS) Working Knowledge (2002).<br />
vii. Kaplan, Steven N., and Minton, Bernadette A. , “How Has CEO Turnover Changed?” (International Review of Finance, Sept. 2011)<br />
Our<br />
Blog<br />
Join us on<br />
LeanSigma ® and the <strong>TBM</strong> logo are registered trademarks of <strong>TBM</strong> <strong>Consulting</strong> <strong>Group</strong>, Inc.<br />
© 2012 <strong>TBM</strong> <strong>Consulting</strong> <strong>Group</strong>, Inc.<br />
<strong>TBM</strong> <strong>Consulting</strong> <strong>Group</strong>, Inc.<br />
4400 Ben Franklin Blvd.<br />
Durham, NC 27704<br />
800.438.5535<br />
www.tbmcg.com<br />
04/2012