and Back. 2D Fourier Transform applied on Music Piano Roll Plots
and Back. 2D Fourier Transform applied on Music Piano Roll Plots
and Back. 2D Fourier Transform applied on Music Piano Roll Plots

Create successful ePaper yourself
Turn your PDF publications into a flip-book with our unique Google optimized e-Paper software.
From <strong>Music</strong> to Visuals – <str<strong>on</strong>g>and</str<strong>on</strong>g> <str<strong>on</strong>g>Back</str<strong>on</strong>g><br />
<str<strong>on</strong>g>2D</str<strong>on</strong>g> <str<strong>on</strong>g>Fourier</str<strong>on</strong>g> <str<strong>on</strong>g>Transform</str<strong>on</strong>g> <str<strong>on</strong>g>applied</str<strong>on</strong>g> <strong>on</strong> <strong>Music</strong> <strong>Piano</strong> <strong>Roll</strong> <strong>Plots</strong><br />
Reinhold Behringer<br />
School of Computing <str<strong>on</strong>g>and</str<strong>on</strong>g> Creative Technology<br />
Leeds Metropolitan University<br />
Leeds, United Kingdom<br />
r.behringer@leedsmet.ac.uk<br />
Abstract—When a <str<strong>on</strong>g>2D</str<strong>on</strong>g> <str<strong>on</strong>g>Fourier</str<strong>on</strong>g> <str<strong>on</strong>g>Transform</str<strong>on</strong>g> is <str<strong>on</strong>g>applied</str<strong>on</strong>g> to piano roll<br />
plots which are often used in sequencer software, the resulting <str<strong>on</strong>g>2D</str<strong>on</strong>g><br />
graphic is a novel music visualizati<strong>on</strong> which reveals internal<br />
musical structure. This visualizati<strong>on</strong> c<strong>on</strong>verts the set of musical<br />
notes from the notati<strong>on</strong> display in the piano roll plot to a display<br />
which shows structure over time <str<strong>on</strong>g>and</str<strong>on</strong>g> spectrum within a set<br />
musical time period. The transformati<strong>on</strong> is reversible, which<br />
means that it also can be used as a novel interface for editing<br />
music. The c<strong>on</strong>cept of this visualizati<strong>on</strong> is dem<strong>on</strong>strated by<br />
software which was written for using MIDI files <str<strong>on</strong>g>and</str<strong>on</strong>g> creating the<br />
visualizati<strong>on</strong> with the Fast <str<strong>on</strong>g>Fourier</str<strong>on</strong>g> <str<strong>on</strong>g>Transform</str<strong>on</strong>g> (FFT) algorithm.<br />
This software dem<strong>on</strong>strates the live real-time display of this<br />
visualizati<strong>on</strong> in replay of MIDI files or by music input through a<br />
c<strong>on</strong>nected MIDI keyboard. The resulting display is independent<br />
of pitch transformati<strong>on</strong> or tempo. This visualizati<strong>on</strong> approach<br />
can be used for musicology studies, for music fingerprinting,<br />
comparing compositi<strong>on</strong> styles, <str<strong>on</strong>g>and</str<strong>on</strong>g> for a new creative compositi<strong>on</strong><br />
method.<br />
Keywords-comp<strong>on</strong>ent; MIDI; music; visualisati<strong>on</strong>; FFT; <str<strong>on</strong>g>2D</str<strong>on</strong>g><br />
<str<strong>on</strong>g>Fourier</str<strong>on</strong>g> <str<strong>on</strong>g>Transform</str<strong>on</strong>g>;<br />
I. INTRODUCTION<br />
One of the interesting challenges in the creative realm is to<br />
explore the relati<strong>on</strong>ship between music <str<strong>on</strong>g>and</str<strong>on</strong>g> visuals. There have<br />
been many approaches for “transforming” music into 2-<br />
dimensi<strong>on</strong>al (<str<strong>on</strong>g>2D</str<strong>on</strong>g>) visuals (images, videos), <str<strong>on</strong>g>and</str<strong>on</strong>g> while they<br />
started out with manual transformati<strong>on</strong>s (e.g. [1] ), there are<br />
now many approaches for automatic transformati<strong>on</strong> (e.g. [2]).<br />
There are fewer approaches for the reverse transformati<strong>on</strong><br />
(from visuals to music), mostly involving s<strong>on</strong>ificati<strong>on</strong> rather<br />
than outputting music (e.g. [3]). Also many of the prevalent<br />
visualizati<strong>on</strong> tools use sound rather than music as input (e.g.<br />
media players), <str<strong>on</strong>g>and</str<strong>on</strong>g> therefore, such visualizati<strong>on</strong>s are<br />
influenced by instrument timbre <str<strong>on</strong>g>and</str<strong>on</strong>g> human performance in<br />
additi<strong>on</strong> to the music itself. A visualizati<strong>on</strong> which would solely<br />
take into account the abstract music notati<strong>on</strong> as its input would<br />
provide insight into the general character of music structures<br />
rather than of a particular music recording.<br />
The <str<strong>on</strong>g>Fourier</str<strong>on</strong>g> <str<strong>on</strong>g>Transform</str<strong>on</strong>g>ati<strong>on</strong> [4] is a tool which detects<br />
periodicity in signals. It is of great use in analyzing audio <str<strong>on</strong>g>and</str<strong>on</strong>g><br />
sound, as it provides the frequency spectrum of a sound during<br />
a short period (typically 100ms). If a set of these spectra is<br />
plotted vertically (low frequencies at bottom, high at top) over<br />
a horiz<strong>on</strong>tal time line, <strong>on</strong>e obtains a <str<strong>on</strong>g>2D</str<strong>on</strong>g> spectrogram. Such a<br />
spectrogram shows the frequencies (notes) <str<strong>on</strong>g>and</str<strong>on</strong>g> harm<strong>on</strong>ics over<br />
time, equivalent to a piano roll plot used in computer music<br />
sequencer software, but it does not show or encode higher-level<br />
internal musical structure <str<strong>on</strong>g>and</str<strong>on</strong>g> l<strong>on</strong>ger-term periodicity.<br />
A <str<strong>on</strong>g>Fourier</str<strong>on</strong>g> <str<strong>on</strong>g>Transform</str<strong>on</strong>g>ati<strong>on</strong> (FT) in general reveals<br />
periodicities in signals, but can also be used to transform a<br />
general n<strong>on</strong>-periodic signal into its <str<strong>on</strong>g>Fourier</str<strong>on</strong>g> comp<strong>on</strong>ents. This<br />
leads to the idea that an FT approach also could be <str<strong>on</strong>g>applied</str<strong>on</strong>g> to<br />
musical structure itself, in which case a l<strong>on</strong>ger time period<br />
would have to be covered than with the FT of a typical<br />
spectrum computati<strong>on</strong>. The input signal for such a l<strong>on</strong>ger timewindow<br />
(1-dimensi<strong>on</strong>al) FT could be the audio signal itself.<br />
Such an FT spectrum would show the classical FT spectrum for<br />
high frequency comp<strong>on</strong>ents (which are equivalent to music<br />
notes themselves), but is also expected to show low-frequency<br />
structure (< 10 Hz) of the change of such notes. The<br />
computati<strong>on</strong>al requirements for this are relatively high, due to<br />
the l<strong>on</strong>g time window that would need to be covered (>0.5 sec)<br />
for the computati<strong>on</strong> of the FT. A much simpler approach would<br />
be to solely c<strong>on</strong>sider musical events over time as an input for<br />
this “slow” FT, instead of computing the full frequency spectra.<br />
This leads to the idea of using <str<strong>on</strong>g>2D</str<strong>on</strong>g> piano roll plots as input: they<br />
are basically <str<strong>on</strong>g>2D</str<strong>on</strong>g> spectrograms, showing the distributi<strong>on</strong> of<br />
musical notes over time within a set time window. If a <str<strong>on</strong>g>2D</str<strong>on</strong>g> FT<br />
algorithm is <str<strong>on</strong>g>applied</str<strong>on</strong>g> <strong>on</strong>to this plot, then the resulting <str<strong>on</strong>g>2D</str<strong>on</strong>g> FT<br />
would show features related to both the distributi<strong>on</strong> of notes<br />
over time <str<strong>on</strong>g>and</str<strong>on</strong>g> over pitch. In effect, this is a <str<strong>on</strong>g>2D</str<strong>on</strong>g> FT <str<strong>on</strong>g>applied</str<strong>on</strong>g> <strong>on</strong> a<br />
time-plot of 1D FTs (the spectra).<br />
This approach of computing an FT of (the logarithm of) an<br />
FT has been already developed in the 1960s [5], introducing<br />
the terms alanysis (sic), cepstrum (sic), <str<strong>on</strong>g>and</str<strong>on</strong>g> quefrency (sic).<br />
This technique has been used in signal processing applicati<strong>on</strong>s<br />
such as speech recogniti<strong>on</strong>, but has not been <str<strong>on</strong>g>applied</str<strong>on</strong>g> to music.<br />
We have begun an explorative research <str<strong>on</strong>g>and</str<strong>on</strong>g> development to<br />
investigate the use of this <str<strong>on</strong>g>2D</str<strong>on</strong>g> FT in visualizing music. Hereby<br />
we are limiting our efforts to the input of abstract music<br />
notati<strong>on</strong> such as MIDI files instead of audio – this avoids the<br />
need to also compute the spectrograms. We have begun to<br />
develop software for automatic real-time computati<strong>on</strong> of the<br />
<str<strong>on</strong>g>2D</str<strong>on</strong>g> FT <strong>on</strong> piano roll plots, obtained from MIDI files <str<strong>on</strong>g>and</str<strong>on</strong>g> from<br />
live play through a keyboard. In this paper we describe our<br />
first experiments with the <str<strong>on</strong>g>2D</str<strong>on</strong>g> FT, show some early results, <str<strong>on</strong>g>and</str<strong>on</strong>g><br />
present an outlook <strong>on</strong> the possible use of this approach.
II.<br />
THE FOURIER TRANSFORM (FT)<br />
A. Theoretical <str<strong>on</strong>g>Back</str<strong>on</strong>g>ground<br />
The basic equati<strong>on</strong> for the <strong>on</strong>e-dimensi<strong>on</strong>al discrete FT,<br />
using complex notati<strong>on</strong>, is given in equati<strong>on</strong> (1). Herby, x n is<br />
the discretely sampled wave input. The equati<strong>on</strong>s are written<br />
here in the complex form.<br />
For the <str<strong>on</strong>g>2D</str<strong>on</strong>g> discrete FT, the summati<strong>on</strong> has to be performed<br />
across the two axis of the input array. <str<strong>on</strong>g>2D</str<strong>on</strong>g> FT is comm<strong>on</strong>ly<br />
used in image processing, for image analysis, compressi<strong>on</strong>,<br />
<str<strong>on</strong>g>and</str<strong>on</strong>g> filtering. The equati<strong>on</strong> for computing the resulting FT <strong>on</strong><br />
an array with points x m,n is given in equati<strong>on</strong> (2).<br />
(1)<br />
III.<br />
EXPERIMENTS WITH <str<strong>on</strong>g>2D</str<strong>on</strong>g> FT ON PIANO PLOT ROLLS<br />
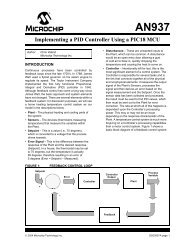
Before our own software development process began, we<br />
did a few experiments, using existing software for computing<br />
the <str<strong>on</strong>g>2D</str<strong>on</strong>g> FT <strong>on</strong> images. For this, an existing software code [7]<br />
was chosen, because it provided the necessary capabilities <str<strong>on</strong>g>and</str<strong>on</strong>g><br />
the code base for our own customizati<strong>on</strong>.<br />
In order to explore the feasibility of using the <str<strong>on</strong>g>2D</str<strong>on</strong>g> FT<br />
approach for music visualizati<strong>on</strong>, a few initial experiments<br />
were c<strong>on</strong>ducted: a music renditi<strong>on</strong> of Gustav Mahler’s<br />
“Urlicht” (digitized by the author from score [8]) was loaded<br />
into the sequencer software Cakewalk® S<strong>on</strong>ar (v.8.52), <str<strong>on</strong>g>and</str<strong>on</strong>g> a<br />
screenshot of an excerpt of the piano roll plot was produced<br />
(see Figure 1), with distracting features (guide lines) being<br />
removed from the original input plot. The color of the note<br />
bars indicates different instruments, the intensity (darkness) of<br />
the color signifies note velocity (a measure of note attack,<br />
which can here be taken for note loudness/intensity).<br />
(2)<br />
While the input of the FT can be just an array of real<br />
numbers with zero imaginary part, the resulting FT is in<br />
general an array of complex numbers, each of which also can<br />
be shown as an array with magnitude <str<strong>on</strong>g>and</str<strong>on</strong>g> phase. For<br />
visualisati<strong>on</strong>, usually the magnitude is the meaningful variable,<br />
but in order to keep the proper time line relati<strong>on</strong>ship of the<br />
input features, the phase is also essential.<br />
A fast algorithm for computing FTs is the Fast <str<strong>on</strong>g>Fourier</str<strong>on</strong>g><br />
<str<strong>on</strong>g>Transform</str<strong>on</strong>g> (FFT) algorithm developed in the 1960s [6]. It<br />
reduces the N 2 complexity for the computati<strong>on</strong> of a <str<strong>on</strong>g>2D</str<strong>on</strong>g> FT to<br />
N•logN complexity. This algorithm is used in many<br />
applicati<strong>on</strong>s where spectra are computed, <str<strong>on</strong>g>and</str<strong>on</strong>g> we use it in our<br />
software for computing the <str<strong>on</strong>g>2D</str<strong>on</strong>g> FT plot of the piano roll plots.<br />
B. Interpretati<strong>on</strong> of <str<strong>on</strong>g>2D</str<strong>on</strong>g> FT <strong>on</strong> <strong>Piano</strong> Plot <strong>Roll</strong>s<br />
When <str<strong>on</strong>g>applied</str<strong>on</strong>g> to a <str<strong>on</strong>g>2D</str<strong>on</strong>g> piano roll plot, the input of the <str<strong>on</strong>g>2D</str<strong>on</strong>g><br />
FT is the quantized grid (time, pitch) of the roll plot image.<br />
Where in a c<strong>on</strong>venti<strong>on</strong>al FT <str<strong>on</strong>g>applied</str<strong>on</strong>g> to the sound wave, the<br />
input values are the values of the sampled signal, <str<strong>on</strong>g>and</str<strong>on</strong>g> in the<br />
case of <str<strong>on</strong>g>2D</str<strong>on</strong>g> FT the input values are the loudness values of the<br />
notes in the quantized <str<strong>on</strong>g>2D</str<strong>on</strong>g> grid. The two axes of the resulting<br />
<str<strong>on</strong>g>2D</str<strong>on</strong>g> FT plot have the following meaning: the horiz<strong>on</strong>tal axis<br />
represents the rhythmic structure of the music, given in 1/time<br />
units as “low frequencies”. Small values of the horiz<strong>on</strong>tal axis<br />
represent “l<strong>on</strong>g” notes <str<strong>on</strong>g>and</str<strong>on</strong>g>/or pauses, indicating low degree of<br />
change in the timeline structure of the music, whereas a higher<br />
value of the horiz<strong>on</strong>tal axis describes a faster changing pace of<br />
the notes. The maximum value of the horiz<strong>on</strong>tal axes describes<br />
the highest possible time resoluti<strong>on</strong> of the input plot. The<br />
vertical axis of the <str<strong>on</strong>g>2D</str<strong>on</strong>g> FT plot refers to the chord structure of<br />
the music <str<strong>on</strong>g>and</str<strong>on</strong>g> the music intervals. A high value <strong>on</strong> this axis<br />
means that note intervals are small <str<strong>on</strong>g>and</str<strong>on</strong>g> possibly densely<br />
clustered. Low values <strong>on</strong> this axis mean larger intervals. In our<br />
approach for the piano roll plot, the input resoluti<strong>on</strong> of the<br />
frequency axis is <strong>on</strong>e semit<strong>on</strong>e, but this can also be generalized<br />
<str<strong>on</strong>g>and</str<strong>on</strong>g> extended to microt<strong>on</strong>es, simply by setting a finer<br />
quantisati<strong>on</strong> of the vertical axis of the piano roll plot.<br />
Figure 1.Screenshot of sequencer piano roll plot of Gustav Mahler’s “Urlicht”.<br />
The <str<strong>on</strong>g>2D</str<strong>on</strong>g> FT was then computed <strong>on</strong> this image by the FFT<br />
algorithm, <str<strong>on</strong>g>and</str<strong>on</strong>g> the magnitude plot was displayed (see Figure 2,<br />
left).<br />
Figure 2. Left: FT magnitude of piano roll plot of Gustav Mahler’s “Urlicht”.<br />
Right: the same plot with logarithmic scaling of intensities.<br />
In order to see more directly the point symmetry around the<br />
origin (0;0), the <str<strong>on</strong>g>2D</str<strong>on</strong>g> FT plot is shown shifted by ½ of its<br />
dimensi<strong>on</strong>s, so that the origin appears in the image center. This<br />
<str<strong>on</strong>g>2D</str<strong>on</strong>g> FT plot, normalized to intensity values between 0 <str<strong>on</strong>g>and</str<strong>on</strong>g> 255,<br />
shows several clearly visible structures around the central<br />
vertical axis, which indicate the use of certain intervals.<br />
Besides these main features, there are also more features which<br />
are more clearly visible in a logarithmic plot of the <str<strong>on</strong>g>2D</str<strong>on</strong>g> FT<br />
intensities (see Figure 2, right).
In additi<strong>on</strong> to magnitude, the FT also produces a phase plot<br />
(see Figure 3). This phase determines the spatial relati<strong>on</strong>ship of<br />
each point in the image. It appears to show no discernible<br />
structure, but it is essential for the inversi<strong>on</strong> of the<br />
transformati<strong>on</strong>: together with phase <str<strong>on</strong>g>and</str<strong>on</strong>g> magnitude of the FT<br />
plots, the original image (piano roll plot) can be reproduced<br />
identically without any visual loss of visual features.<br />
Figure 3. Phase plot of FT of Mahler's “Urlicht”.<br />
Inverting the FT re-creates the original image of the piano<br />
roll plot. This property of being invertible is used in image<br />
processing applicati<strong>on</strong>s where editing operati<strong>on</strong>s can be <str<strong>on</strong>g>applied</str<strong>on</strong>g><br />
in the <str<strong>on</strong>g>2D</str<strong>on</strong>g> FT domain. For the applicati<strong>on</strong> in the music realm, it<br />
is noteworthy that the <str<strong>on</strong>g>2D</str<strong>on</strong>g> FT c<strong>on</strong>tains all music features from<br />
the original input. This makes it possible that the <str<strong>on</strong>g>2D</str<strong>on</strong>g> FT plane<br />
can be used for editing <str<strong>on</strong>g>and</str<strong>on</strong>g> modifying its data – which then can<br />
lead to new music results when being inverted back.<br />
Problematic is the fact that the phase plot needs to be<br />
preserved in order to re-compute the correct original input. In<br />
an experiment, we set the imaginary parts of the complex <str<strong>on</strong>g>2D</str<strong>on</strong>g><br />
FT plot to zero <str<strong>on</strong>g>and</str<strong>on</strong>g> <strong>on</strong>ly kept the real part of the FT, before<br />
then inverting it back. The result was that the inverted plot<br />
showed the original piano roll plot, overlaid by a spatially<br />
reflected plot versi<strong>on</strong> (Figure 4, left). When removing the<br />
phase by assigning the full magnitude to the real part <str<strong>on</strong>g>and</str<strong>on</strong>g><br />
setting the imaginary part to 0, the resulting inversi<strong>on</strong> of the <str<strong>on</strong>g>2D</str<strong>on</strong>g><br />
FT shows no resemblance to the original piano roll plot (see<br />
Figure 4, right). Therefore, the phase needs to be included<br />
properly.<br />
Figure 4. Left: inverse <str<strong>on</strong>g>2D</str<strong>on</strong>g> FT with imaginary part set to zero. Right: inverse<br />
<str<strong>on</strong>g>2D</str<strong>on</strong>g> FT with phase set to zero.<br />
These initial experiments with the applicati<strong>on</strong> of the <str<strong>on</strong>g>2D</str<strong>on</strong>g> FT<br />
directly <strong>on</strong> images of the piano roll plots have been d<strong>on</strong>e with<br />
color images. In the original sequencer, the different colors of<br />
the note bars indicate different instruments, of which there are<br />
33 in individual tracks. The <str<strong>on</strong>g>2D</str<strong>on</strong>g> FT algorithm, however, <strong>on</strong>ly<br />
separates the three basic colors (red, green, blue) in the RGB<br />
encoded images. Therefore, the instruments are not treated<br />
individually but “mixed” together, <str<strong>on</strong>g>and</str<strong>on</strong>g> as a result there is no<br />
clear color distincti<strong>on</strong> in the <str<strong>on</strong>g>2D</str<strong>on</strong>g> FT plots. In principle, the <str<strong>on</strong>g>2D</str<strong>on</strong>g><br />
FT would need to be <str<strong>on</strong>g>applied</str<strong>on</strong>g> to each instrument separately in<br />
order to properly reflect all the features c<strong>on</strong>tributed by each<br />
instrument. This can be achieved if a different input data<br />
structure would be used: instead of an RGB image, an array<br />
with a set of subfields should be employed, <strong>on</strong>e field for each<br />
instrument. Despite these limitati<strong>on</strong>s, these initial experiments<br />
with the image-based FT were encouraging to further<br />
explorati<strong>on</strong> of this <str<strong>on</strong>g>2D</str<strong>on</strong>g> FT approach in music.<br />
IV.<br />
THE CUSTOM SOFTWARE FOR <str<strong>on</strong>g>2D</str<strong>on</strong>g> FT<br />
Based <strong>on</strong> the existing FFT implementati<strong>on</strong> [7], we wrote<br />
further software which would allow to directly create a piano<br />
roll plot <str<strong>on</strong>g>and</str<strong>on</strong>g> create the <str<strong>on</strong>g>2D</str<strong>on</strong>g> FT in real-time c<strong>on</strong>tinuously. The<br />
piano roll plot would <strong>on</strong>ly provide the essential visual elements<br />
<str<strong>on</strong>g>and</str<strong>on</strong>g> would enable the creati<strong>on</strong> of a freely c<strong>on</strong>figurable <str<strong>on</strong>g>and</str<strong>on</strong>g><br />
extendible format for storing the data. The selected<br />
development platform is Microsoft’s Visual Studio®, the code<br />
is written in C# <str<strong>on</strong>g>and</str<strong>on</strong>g> uses .NET functi<strong>on</strong>ality. The MIDI<br />
functi<strong>on</strong>ality is embedded by using Leslie Sanford’s C# MIDI<br />
toolkit [9], which provides functi<strong>on</strong>ality for reading <str<strong>on</strong>g>and</str<strong>on</strong>g><br />
playing MIDI sequences <str<strong>on</strong>g>and</str<strong>on</strong>g> for c<strong>on</strong>necting MIDI devices. The<br />
software allows loading a MIDI file, which can then be played<br />
through the built-in MS software synthesizer (“Microsoft GS<br />
Wavetable Synth”.). Furthermore, the software allows manual<br />
live play through an external keyboard.<br />
For creating the piano roll plot, an internal 128x128 array<br />
of INT values stores the piano roll plot. The vertical axes is<br />
directly the pitch value of the MIDI note (with 64 = C). The<br />
values in each array element are the MIDI velocity values. At a<br />
later stage of the development, these values will be computed<br />
from volume (MIDI #7) <str<strong>on</strong>g>and</str<strong>on</strong>g> expressi<strong>on</strong> (MIDI #11) values,<br />
which more properly reflect the changing loudness of a MIDI<br />
sound. In the current software versi<strong>on</strong>, the decisi<strong>on</strong> was made<br />
to interpret the time axis as “musical time”, that is in relati<strong>on</strong> to<br />
musical measures <str<strong>on</strong>g>and</str<strong>on</strong>g> tempo. This allows a tempo-invariant<br />
computati<strong>on</strong> of the FT. The user can choose what the overall<br />
range of the visible piano roll plot should be: 1 bar, 2 bars, or 4<br />
bars. The tempo determines the speed with which the piano roll<br />
is scrolled. It is set from the MIDI file, but also can be scaled.<br />
New note events are added into the array at the right end of the<br />
plot, <str<strong>on</strong>g>and</str<strong>on</strong>g> with the scrolling of the roll plot to the left, parts <strong>on</strong><br />
the left end are removed. This occurs at every new note event<br />
<str<strong>on</strong>g>and</str<strong>on</strong>g> at pre-determined times triggered by a timer, which can be<br />
set to every 1/4, 1/8, 1/16, or 1/32 note. This trigger also causes<br />
the FT to be computed <strong>on</strong> the current state of the piano roll<br />
plot.<br />
The graphics of the piano roll plot <str<strong>on</strong>g>and</str<strong>on</strong>g> the magnitude of the<br />
<str<strong>on</strong>g>2D</str<strong>on</strong>g> FT are shown enlarged as 256x256 graphics. For greater<br />
detail, they can be “zoomed” in at the centre by a factor of 2.<br />
Furthermore, the FT can be shown in shifted view with the<br />
origin at the centre instead of the bottom left.<br />
The user can also play live through either an <strong>on</strong>-screen<br />
keyboard or an external MIDI (USB) keyboard. The tempo for<br />
the plot creati<strong>on</strong> can be set (default is 120 bpm), <str<strong>on</strong>g>and</str<strong>on</strong>g> a click is
played at each beat, so that the user can play in sync with the<br />
beat.<br />
in Figure 9, where a simple up-<str<strong>on</strong>g>and</str<strong>on</strong>g>-down-sweep causes a<br />
complex structure.<br />
V. SYSTEMATIC EXPERIMENTS<br />
With our custom software, it is possible to study some of<br />
the features of the <str<strong>on</strong>g>2D</str<strong>on</strong>g> FT in more detail, by playing live <strong>on</strong> the<br />
keyboard certain music input patterns. The following figures<br />
are screenshots of the software <str<strong>on</strong>g>and</str<strong>on</strong>g> show both the piano roll<br />
plot (left) <str<strong>on</strong>g>and</str<strong>on</strong>g> the <str<strong>on</strong>g>2D</str<strong>on</strong>g> FT plot (right). Figure 5 shows the <str<strong>on</strong>g>2D</str<strong>on</strong>g> FT<br />
of a single note: multiple vertical lines. This is caused by the<br />
step at the beginning of the note, equivalent to the multiple<br />
<str<strong>on</strong>g>Fourier</str<strong>on</strong>g> comp<strong>on</strong>ents of a rectangular signal. These multiple<br />
comp<strong>on</strong>ents disappear, <strong>on</strong>ce the step disappears <str<strong>on</strong>g>and</str<strong>on</strong>g> the note is<br />
shown solid (Figure 6).<br />
Figure 8. Alternating t<strong>on</strong>es every quarter, a fifth apart. This causes vertical<br />
lines <str<strong>on</strong>g>and</str<strong>on</strong>g> shifted line segments in the <str<strong>on</strong>g>2D</str<strong>on</strong>g> FT.<br />
Figure 5. Beginning of single l<strong>on</strong>g note. The sudden jump of the volume<br />
causes the multiple comp<strong>on</strong>ents in the <str<strong>on</strong>g>2D</str<strong>on</strong>g> FT.<br />
Figure 9. Up-<str<strong>on</strong>g>and</str<strong>on</strong>g>-down-sweep with regular note durati<strong>on</strong>.<br />
Figure 6. Single l<strong>on</strong>g note with indefinite durati<strong>on</strong> causes straight vertical line<br />
in center of <str<strong>on</strong>g>2D</str<strong>on</strong>g> FT.<br />
If the note is played in a rhythm, the line pattern in the <str<strong>on</strong>g>2D</str<strong>on</strong>g><br />
FT indicates the rhythmic properties (Figure 7). This takes<br />
also into account emphasis <strong>on</strong> individual notes.<br />
Figure 7. Short note with quarter beat causes set of equidistant lines in <str<strong>on</strong>g>2D</str<strong>on</strong>g> FT,<br />
indicating a fixed rhythm.<br />
Notes played at intervals cause a structure al<strong>on</strong>g the<br />
vertical axis of the <str<strong>on</strong>g>2D</str<strong>on</strong>g> FT (see Figure 8). Note here also the<br />
alternating play of the notes, which results in the shifted<br />
dashing of the vertical lines. Interesting is the <str<strong>on</strong>g>2D</str<strong>on</strong>g> FT structure<br />
VI.<br />
CONCLUSIONS AND OUTLOOK<br />
We believe that the <str<strong>on</strong>g>2D</str<strong>on</strong>g> FT presented in this paper can be<br />
used in music for various purposes: it provides a reversible way<br />
of detecting features <str<strong>on</strong>g>and</str<strong>on</strong>g> structure in music, allowing new ways<br />
of visualizati<strong>on</strong> <str<strong>on</strong>g>and</str<strong>on</strong>g> compositi<strong>on</strong> of music. Also, the <str<strong>on</strong>g>2D</str<strong>on</strong>g> FT<br />
provides a unique fingerprint of music, based <strong>on</strong> the music<br />
al<strong>on</strong>e (tempo <str<strong>on</strong>g>and</str<strong>on</strong>g> pitch invariant), <str<strong>on</strong>g>and</str<strong>on</strong>g> this is also suitable for<br />
further musicological analysis. More work needs to be d<strong>on</strong>e in<br />
creating intuitive tools for interacting with this <str<strong>on</strong>g>2D</str<strong>on</strong>g> FT <str<strong>on</strong>g>and</str<strong>on</strong>g><br />
allowing to harness <str<strong>on</strong>g>and</str<strong>on</strong>g> comprehend all its features.<br />
REFERENCES<br />
[1] Oskar Fischinger, Oskar Fischinger Archive. www.oskarfischinger.org<br />
[2] Stephen Malinowski, “The music animati<strong>on</strong> machine”,<br />
www.musanim.com, 2006.<br />
[3] Peter B.L. Meijer, “The vOICe”, 2012, http://bit.ly/43xnsk<br />
[4] Jean Baptiste Joseph <str<strong>on</strong>g>Fourier</str<strong>on</strong>g>, J.B.J., Théorie Analytique de la Chaleur,<br />
Paris, 1822.<br />
[5] B.P.Bogert, M.J.R.Healy, <str<strong>on</strong>g>and</str<strong>on</strong>g> John Wilder Tukey: “The Quefrency<br />
Alanysis of Time Series for Echoes: Cepstrum, Pseudo Autocovariance,<br />
Cross-Cepstrum <str<strong>on</strong>g>and</str<strong>on</strong>g> Saphe Cracking”. Proceedings of the Symposium<br />
<strong>on</strong> Time Series Analysis (M. Rosenblatt, Ed) Chapter 15, 209-243. New<br />
York: Wiley, 1963<br />
[6] James W.Cooley <str<strong>on</strong>g>and</str<strong>on</strong>g> John W. Tukey, ”An algorithm for the machine<br />
calculati<strong>on</strong> of complex <str<strong>on</strong>g>Fourier</str<strong>on</strong>g> series,” Math. Comput. 19, 297-301,<br />
1965.<br />
[7] V.A.Bharadi, “<str<strong>on</strong>g>2D</str<strong>on</strong>g> FFT of an image in C#”. The CODE Project. 2009<br />
http://bit.ly/yHGkVt<br />
[8] Gustav Mahler. “Symph<strong>on</strong>y No.2”. Philharm<strong>on</strong>ia Scores, PH395<br />
[9] Sanford, L. “C# MIDI Toolkit”. The CODE Project. 2007.<br />
http://bit.ly/wI3tst