2001 - Volume 2 - Journal of Engineered Fibers and Fabrics
2001 - Volume 2 - Journal of Engineered Fibers and Fabrics
2001 - Volume 2 - Journal of Engineered Fibers and Fabrics

Create successful ePaper yourself
Turn your PDF publications into a flip-book with our unique Google optimized e-Paper software.
thickness <strong>and</strong> number <strong>of</strong> the fibers.<br />
The results <strong>of</strong> the test samples show that our FFT (Fast<br />
Fourier Transform) <strong>and</strong> post-processing method is able to<br />
identify the fiber orientation distribution. The Hough transform<br />
results <strong>of</strong> the test samples prove the validity <strong>of</strong> the<br />
method in estimation <strong>of</strong> the length <strong>of</strong> the lines.<br />
Test Results & Discussion<br />
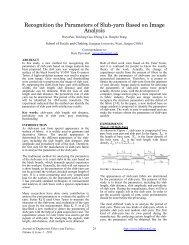
Figure 2a<br />
Figure 2b<br />
A SAMPLE OF BINARISED IMAGE AND<br />
ITS HOUGH TRANSFORM SPACE<br />
tinuous Hough space to a rectangular structure <strong>of</strong> cells called<br />
accumulator array. Lines <strong>of</strong> fibers detected in the image cause<br />
a high value <strong>of</strong> the corresponding cell in the accumulator<br />
array. The cell values depend on the number <strong>of</strong> pixels or the<br />
length <strong>of</strong> the line <strong>of</strong> fiber that relates to that cell. Therefore,<br />
the line <strong>of</strong> the image can be detected by finding the maxima<br />
in the accumulator space. The values <strong>of</strong> the cells can be correlated<br />
to the length <strong>of</strong> the fibers. The number <strong>of</strong> the fibers in<br />
the same range <strong>of</strong> length is counted <strong>and</strong> a histogram <strong>of</strong> the<br />
fiber length distribution is obtained. The resultant Hough<br />
transform analysis is presented in Figure 2b.<br />
The main advantage <strong>of</strong> the Hough transform is that it is tolerant<br />
<strong>of</strong> gaps in feature boundary descriptions <strong>and</strong> is relatively<br />
unaffected by image noise.<br />
Validation <strong>of</strong> the Method<br />
In order to validate the developed method <strong>of</strong> estimating<br />
fiber orientation distribution using Fast Fourier Transforms,<br />
we have made some test samples. The test samples are images<br />
made from simple lines with one <strong>of</strong> the graphic packages. In<br />
these tests we investigated the effect <strong>of</strong> the orientation, length,<br />
Tests On Image Formation <strong>and</strong> Pre-processing<br />
The scanning electron microscope is used to make images <strong>of</strong><br />
the microstructure <strong>of</strong> the fabrics. The advantage <strong>of</strong> using SEM<br />
in making the images is that SEM has a high depth <strong>of</strong> field<br />
even at higher magnification. In some cases the depth <strong>of</strong> field<br />
<strong>of</strong> the SEM can be considerably higher than an optical microscope.<br />
Therefore, applying SEM has the advantage <strong>of</strong> bringing<br />
more fibers in the fabric in focus. This results in including<br />
more fibers <strong>of</strong> the depth <strong>of</strong> the fabric in the primary image. [2]<br />
Different processing stages were tested to prepare the<br />
images obtained from SEM for the FFT <strong>and</strong> Hough transform<br />
analysis.<br />
Several parameters in making the images at the stage <strong>of</strong><br />
using electron microscope <strong>and</strong> afterwards affect the image<br />
processing analysis. Magnification <strong>and</strong> brightness are the<br />
most important factors that are decided at the stage <strong>of</strong> making<br />
SEM images. The frame shape, dimension <strong>and</strong> the format <strong>of</strong><br />
the image are factors that should be carefully chosen before<br />
the transfer <strong>of</strong> the image to the processing stage. Each <strong>of</strong> these<br />
parameters is studied <strong>and</strong> optimized through several tests.<br />
The main parameters are described briefly as follows:<br />
• Magnification-Sampling<br />
The magnification <strong>and</strong> area covered in an image is an<br />
important factor that can affect the results. These parameters<br />
should be optimized to get an image which is representative<br />
<strong>of</strong> the whole fabric <strong>and</strong> at the same time is recognizable to the<br />
image processing methods. In our research we have tried to<br />
use comparatively high magnification <strong>and</strong> for each fabric<br />
more sample images have to be made <strong>and</strong> processed. The final<br />
orientation distribution for each fabric is evaluated by summing<br />
<strong>and</strong> averaging all the samples. In this practice each sample<br />
result needs to be evaluated. The samples significantly different<br />
from the average should be discarded.<br />
• Image brightness<br />
Our tests show whenever the brightness <strong>of</strong> the image is not<br />
uniform, there is considerable error in the outcome <strong>of</strong> the processing.<br />
Uneven brightness <strong>of</strong> the original image made by<br />
SEM can occur because <strong>of</strong> overcharging <strong>of</strong> some parts <strong>of</strong> the<br />
samples by long exposure to electron impact or by nonuniform<br />
coating <strong>of</strong> the samples. A nonuniform brightness <strong>of</strong> the<br />
image results in unequal contribution <strong>of</strong> different part <strong>of</strong> the<br />
image in the image processing outcome. Therefore it is essential<br />
to make the SEM images with uniform brightness.<br />
• The image dimension <strong>and</strong> frame<br />
The dimension <strong>of</strong> the image sent to the image analysis pro-<br />
28 INJ Summer <strong>2001</strong>