The ARTA Years 2004 â 2010 - Auckland Transport
The ARTA Years 2004 â 2010 - Auckland Transport
The ARTA Years 2004 â 2010 - Auckland Transport

Create successful ePaper yourself
Turn your PDF publications into a flip-book with our unique Google optimized e-Paper software.
<strong>The</strong> <strong>ARTA</strong> <strong>Years</strong> <strong>2004</strong> – <strong>2010</strong><br />
<strong>Auckland</strong> Regional <strong>Transport</strong> Authority (<strong>ARTA</strong>):<br />
1 December <strong>2004</strong> – 31 October <strong>2010</strong>
Contents<br />
How <strong>ARTA</strong> came into existence 2<br />
Growing supply and demand 10<br />
Case study 2005: Double tracking the Western Line 17<br />
Case study 2006: Northern Express service 31<br />
Case study 2007: Electrification of the rail network 34<br />
Challenges and opportunities 36<br />
Case study 2008: Northern Busway opens 37<br />
Case study 2009: A single integrated ticket for <strong>Auckland</strong> 38<br />
Case study <strong>2010</strong>: Newmarket Station opens 40<br />
Our people 42<br />
<strong>The</strong> journey ahead for transport 46<br />
Appendices 48<br />
Appendix A: Summary of capital works expenditure/assets and sources of funding 48<br />
Appendix B: Indicative capital expenditure to 2019 49<br />
Appendix C: <strong>ARTA</strong>’s stakeholders and project partners 49<br />
<strong>The</strong> vision for transport in <strong>Auckland</strong> 52<br />
1
In <strong>2004</strong>, <strong>ARTA</strong> was formed as the country’s first stand alone regional transport authority, with a<br />
mandate to solve <strong>Auckland</strong>’s transport challenges. We were given the lead role in planning, funding and<br />
developing the region’s public transport system of rail, buses and ferries in order to decongest our roads<br />
and deliver the maximum economic and social benefits.<br />
This booklet demonstrates the step change we have achieved over the past six years in patronage of<br />
public transport. A better rail network, more frequent services, simpler routes on buses, infrastructure<br />
improvements that are up to international standards, and community education programmes are all part<br />
of the <strong>ARTA</strong> story.<br />
How <strong>ARTA</strong> came into existence<br />
In 2003, 18 different bodies were involved with planning, financing and implementing transport in <strong>Auckland</strong>.<br />
<strong>The</strong>y included the <strong>Auckland</strong> Regional Council (devising strategy), Infrastructure <strong>Auckland</strong> (allocating grants for projects),<br />
Transfund (funding assistance for passenger transport) and <strong>Auckland</strong> Regional <strong>Transport</strong> Network Limited (rail<br />
infrastructure).<br />
<strong>Transport</strong> governance had been the subject of continual review for three years, with all parties accepting the need for<br />
urgent action but not able to reach a consensus on a preferred model. In December 2003, the Government made a rare<br />
move to intervene in the city’s affairs, offering <strong>Auckland</strong> additional funding of $1.62 billion over ten years for transport in<br />
exchange for changes to the way transport was governed and funded. <strong>The</strong>se changes were accepted in general by the<br />
region’s territorial authorities and enacted in the Local Government (<strong>Auckland</strong>) Amendment Act <strong>2004</strong>.<br />
<strong>The</strong> Act introduced a balance of political oversight by the ARC and stand-alone operational governance. Two new bodies<br />
were set up as separate legal entities: the <strong>Auckland</strong> Regional <strong>Transport</strong> Authority (<strong>ARTA</strong>) and <strong>Auckland</strong> Regional Holdings<br />
(ARH), governed by their own board of directors while also being subsidiary organisations of the ARC. <strong>The</strong> ARH would<br />
own and manage transport and other assets. Over half the regional rates collected by the ARC and revenue from the<br />
ARH would go towards funding <strong>Auckland</strong>’s network of rail, bus and ferry services. <strong>ARTA</strong>’s role was to take a region-wide<br />
approach to planning, funding and developing the land transport system in <strong>Auckland</strong> and contributing to the overall<br />
vision for the country’s largest city, as outlined in the Regional Growth Strategy. <strong>The</strong> ARC would act as both a funding<br />
and strategic body for <strong>ARTA</strong>, with constrained powers of control, working in a partnership of mutual reliance to achieve<br />
significant improvements to <strong>Auckland</strong>’s transport system and traffic congestion problems.<br />
<strong>ARTA</strong> gets moving<br />
<strong>ARTA</strong> was established on 1 July <strong>2004</strong> as a council-controlled organisation, a subsidiary of the ARC, and began<br />
operating on 1 December <strong>2004</strong>. It was launched by Prime Minister Helen Clark in February 2005. Staff transferred from<br />
the ARC to <strong>ARTA</strong> and the initial team of 40 has grown to 115.<br />
<strong>The</strong> ARC has committed bulk funding to <strong>ARTA</strong> on a year-by-year basis. <strong>ARTA</strong>’s responsibilities to the ARC were to provide<br />
an annual statement of intent; half yearly and annual reports; and allow the ARC to regularly undertake performance<br />
monitoring.<br />
2
<strong>Auckland</strong> ferries have been an integral part of public transport since the Devonport ferry service was established in 1860.<strong>The</strong> SuperGold Card,<br />
offering free travel for seniors at off-peak times, has played a key role in reviving ferry patronage since it was introduced in 2008.<br />
3
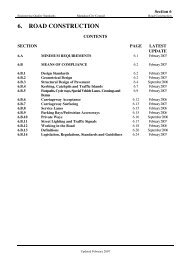
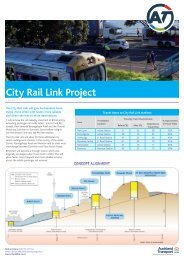
Dedicated busways carry 12,000 people an hour while a single lane of motorway carries only 2,400 people. <strong>The</strong> Northern Busway’s capacity and reliability<br />
is playing a key role in addressing traffic congestion over the Harbour Bridge by taking 5,100 cars off the road in morning peak times.<br />
4
<strong>ARTA</strong>’s vision<br />
One of the first tasks for the new Board of Directors was to develop a vision and regional strategies for achieving<br />
that vision.<br />
Vision: A world-class transport system that makes <strong>Auckland</strong> an even better place to live, work and play.<br />
Strategies:<br />
Growing <strong>Auckland</strong><br />
<strong>The</strong> transport system will support regional growth and economic development strategies by linking <strong>Auckland</strong>’s main urban<br />
centres with a fast, frequent and reliable Rapid Transit Network, comprising an electrified rail system and the Northern<br />
Busway.<br />
Moving <strong>Auckland</strong>ers<br />
One ticket will take you anywhere in <strong>Auckland</strong>, on a seamless network of bus, train and ferry services. <strong>Auckland</strong>ers will be<br />
in the habit of quickly checking the options for their trip before leaving home, and will be able to choose between a quality<br />
public transport service, safe walking and cycling routes, and predictable car journey times.<br />
Sustaining Communities<br />
<strong>Auckland</strong>ers will make safe, healthy and sustainable travel choices. People who do not have access to a car will still have<br />
access to employment, education, health, commercial and recreational opportunities.<br />
<strong>The</strong> first comprehensive 10-year plan<br />
In 2005 1 , the ARC published the Regional Land <strong>Transport</strong> Strategy (RLTS), which set the expected transport<br />
outcomes for 2016 and required <strong>ARTA</strong> to prepare an <strong>Auckland</strong> Passenger <strong>Transport</strong> Network Plan (PTNP). <strong>The</strong> plan,<br />
published in 2006, identified the strengths and weaknesses of the transport system, the lessons <strong>Auckland</strong> could learn<br />
from other cities internationally, and set a 10-year plan of action to 2016 to get the region moving.<br />
Analysis of <strong>Auckland</strong>’s transport network<br />
An analysis of the public transport network showed that it had world-class elements but had suffered from chronic<br />
under-investment and lack of an overarching planning framework. <strong>Auckland</strong> had been growing rapidly in a sprawling<br />
fashion. By <strong>2004</strong>, the city was absorbing an extra 50 people each day and hence potentially an extra 35 cars. By 2040, the<br />
region’s population is predicted to reach two million. While roads will remain important for moving freight, it had become<br />
impossible to build our way out of congestion by providing more road capacity. <strong>The</strong> region was coming to a congested<br />
standstill, as a recurring consequence of growth, impacting on the economy, the environment and public health. It was<br />
estimated in 2006 that congestion in <strong>Auckland</strong> was costing the country $1 billion a year, just under 1% of the GDP.<br />
Wellington was moving proportionately 75% more people by public transport than <strong>Auckland</strong>, where 25,000 homes<br />
had more private vehicles than people. Already, <strong>Auckland</strong> had outgrown the structure of the public transport system,<br />
which could be broadly described as multiple private operators operating peak-time-only services to and from the<br />
CBD. Metropolitan centres such as Manukau had grown considerably. <strong>The</strong> populations of peripheries such as Flatbush<br />
(near Manukau) had shot up and rising inner city property values was one driving factor in the development of non-CBD<br />
employment areas such as Westgate, Albany and the airport. People were no longer travelling from the suburbs into one<br />
central location for work and play. <strong>The</strong>y had needs to travel within and between these mushrooming centres at all times<br />
of the day and night.<br />
1. Dates refer to calendar rather than financial years unless otherwise stated.<br />
5
Some marked improvements were under way: the opening of Britomart in 2003 and investment in rail infrastructure<br />
and services, upgrading ferry services and terminals, the early stages of the Northern Busway project and increased<br />
frequencies of bus services. <strong>The</strong>se had led to an increase of 15% in the use of public transport between 2001 and 2005.<br />
<strong>The</strong> main limitations of the transport network were:<br />
q<br />
q<br />
q<br />
q<br />
q<br />
q<br />
Lack of integration between the three modes of transport, bus, rail and ferry, resulting in duplicated services<br />
While bus coverage appeared extensive it was focused on travel to the CBD and services were infrequent,<br />
with 75% operating fewer than three buses per hour. <strong>The</strong>re were over 450 routes but around 90% of them<br />
were peak-time only. <strong>The</strong> emphasis on direct services resulted in long, inefficient bus routes rather than<br />
efficient transfers. Bus services didn’t match the public’s needs and often they were in direct competition with<br />
train services<br />
While the rail network had improved with refurbished trains and higher frequency, rail had limited coverage<br />
with less than 15% of <strong>Auckland</strong>’s population living within 800m of a train station<br />
Too many competing fares. Users of the transport system had over 100 fare products to choose from,<br />
with different fares for bus and train journeys and fare stages every three to five kms. Services and<br />
timetables were generally planned separately, with competition between private operators discouraging<br />
integrated services.<br />
<strong>The</strong> development of unsustainable features such as diesel powered trains<br />
Lack of supporting facilities such as transport interchanges, high-quality stations, information and bus priority<br />
measures.<br />
Less than 15% of <strong>Auckland</strong>’s population lived within 800m of a train station in 2006. <strong>The</strong> new Grafton Station was moved to a more convenient<br />
location and since it opened earlier this year has already attracted 45% more patronage than the Boston Road Station that it replaced.<br />
6
Lessons learned from other cities<br />
<strong>The</strong> key success factors in the transport networks of five international cities were identified. <strong>The</strong> cities were<br />
Brisbane, Perth, Ottawa, Vancouver and Portland. <strong>The</strong>y were chosen for their similarities in population size and land use<br />
density.<br />
<strong>The</strong> core factors were:<br />
q<br />
q<br />
q<br />
q<br />
q<br />
q<br />
Strong institutional structures supporting integrated land use and transport planning<br />
A layered arrangement of transport services with an RTN forming the backbone; a high-frequency branded<br />
express bus and a network of support/feeder services giving good geographic coverage<br />
Targeted services to fill particular market niches<br />
High-quality transport systems on a dedicated right of way to ensure high reliability<br />
High frequency and reliability of transport services — the greatest patronage gains can come from transforming<br />
existing networks rather than introducing new services<br />
Investing in transport interchange and Park-and-Ride facilities, enhancing customer information; improving<br />
comfort, safety and security; and providing integrated ticketing systems.<br />
Moving forward in <strong>Auckland</strong><br />
In short, lessons from overseas showed that people wanted services that ran on time, services they didn’t have<br />
to travel too far to get to or wait too long for. <strong>The</strong> dispersed nature of both population and employment centres in<br />
<strong>Auckland</strong> meant it wasn’t an efficient use of scarce resources to provide direct services for all trips to all destinations. A<br />
trade-off between service coverage and frequency would have to be made, targeting funding to where it would give best<br />
results. People would get more frequent, faster and reliable services but perhaps have to walk a little further to access<br />
them or make an easy transfer between services. Planning to double the amount of trips that required a transfer (from<br />
15% to 30%) made it even more imperative to provide an integrated ticket and fare system that was simple and easy to<br />
understand. A seamless system was integral to achieving the RLTS goal of 100 million passenger boardings by 2016.<br />
<strong>ARTA</strong>’s gap analysis in <strong>Auckland</strong>’s transport network and research into overseas experience identified three essential<br />
components of a world-class system: rapid, quality and integrated. All three needed further development in order for the<br />
transport system to meet both the present and future needs of the region.<br />
<strong>The</strong> Rapid Transit Network (RTN) was planned as a number of spines running through the region, along which high-quality<br />
(direct, fast, reliable), high-frequency services would run. <strong>The</strong> aim was to get people to their destinations quicker, ensuring<br />
the services didn’t get held up in road traffic congestion. <strong>The</strong> RTN should be able to compete with the convenience and<br />
speed of car travel. Its two main components were a modern electrified rail system and an expanded busway system. <strong>The</strong><br />
RTN supports <strong>Auckland</strong>’s growth strategy of intensified land use and is likely to carry around 40% of all public transport<br />
trips, around 80 million a year by 2050. <strong>The</strong> RTN also makes the biggest contribution to decongesting <strong>Auckland</strong>’s roads,<br />
with an annual benefit of $25,000 for each additional user. On a cost/benefit ratio, investing in the RTN makes good<br />
economic sense (see the graph on page 8).<br />
7
<strong>The</strong> Quality Transit Network (QTN) would become the veins and arteries of the city’s transport system. <strong>The</strong> QTN was<br />
designed to transport people cross-town, linking key population and employment centres mainly on bus corridors where<br />
the buses had priority. <strong>The</strong> QTN delivers only roughly half the benefit of the investment in the RTN, i.e. $12,000 annually<br />
for each additional user.<br />
An integrated network would deliver:<br />
q<br />
q<br />
q<br />
q<br />
Interconnecting train, bus and ferry services at transport interchanges such as Britomart<br />
Integrated ticketing and a simplified fare structure<br />
Local Connector services into the RTN and QTN networks<br />
Targeted services for groups whose needs were not met by regular services, such as Total Mobility for people<br />
with disabilities and fare concession schemes.<br />
<strong>The</strong> other key elements in a shift towards increased use of public transport were:<br />
q<br />
q<br />
q<br />
Changing attitudes and behaviours through education such as travel plans<br />
Developing more sustainable forms of travel such as walking and cycling<br />
Integrating land use and urban design with transport.<br />
Annual decongestion benefit of each additional user of the RTN, QTN, and LCN networks<br />
$25,000<br />
Decongestion benefits ($ p.a.)<br />
$15,000<br />
$15,000<br />
$10,000<br />
$5,000<br />
Northern Busway and rail<br />
Key bus and ferry<br />
routes<br />
Local bus and ferry<br />
routes<br />
0<br />
Rapid Transit Network<br />
Quality Transit Network<br />
Local Connector Network<br />
8
Benefits and net cost of 10 minutes electric compared to the status quo<br />
1400<br />
Annual uplifted<br />
benefit ($m)<br />
Net costs (Opex<br />
plus capex minus<br />
revenue) ($m)<br />
$m<br />
1200<br />
1000<br />
800<br />
600<br />
400<br />
200<br />
0<br />
-200<br />
-400<br />
2008-10 2011-15 2016-20 2021-25 2026-30 2031-35 2036-40 2041-45<br />
Rapid Transit Network<br />
Capacity per hour/person<br />
A single lane of motorway 2,400<br />
Bus lanes 7,500<br />
Dedicated busway 12,000<br />
Rail corridors 20,000 – 25,000<br />
9
Growing supply and demand<br />
Comparing progress<br />
<strong>The</strong> <strong>Auckland</strong> Passenger <strong>Transport</strong> Network Plan 2006–2016 predicted more progress in 10 years than in the past 50 years<br />
<strong>The</strong> table below summarises progress from 1954 to <strong>2004</strong>, against achievements of the past six years.<br />
<strong>Transport</strong> in <strong>Auckland</strong> 1954 – <strong>2004</strong><br />
(50 years)<br />
1955 Master <strong>Transport</strong>ation Plan concludes: “motorways<br />
should be constructed in priority to the underground<br />
(CBD) railway project”.<br />
1959 <strong>Auckland</strong> Harbour Bridge opened<br />
1960 Car ownership had reduced public transport<br />
patronage by 42%<br />
1966 First section of Western Line double tracked<br />
1993 19 second-hand diesel trains purchased<br />
1996 Link bus service introduced in CBD<br />
1998 First dedicated bus lanes in Sandringham and<br />
New North roads<br />
2000 Suburban rail to Pukekohe was first extension of<br />
coverage in more than 70 years<br />
2001 New Zealand cities had one of the lowest rates of<br />
public transport use in the world<br />
2002 Government and ARC buy back <strong>Auckland</strong> rail assets<br />
from private operator Tranz Rail, which had<br />
underinvested since taking ownership in 1993<br />
2003 Britomart Station opens, first refurbished trains<br />
in service<br />
<strong>2004</strong> North-western cycleway opened<br />
2005 Use of public transport increased 15% between<br />
2001-2005<br />
Progress on transport 2005 – <strong>2010</strong><br />
(5 years)<br />
2005 Northern Express bus services launched and North Shore<br />
bus services redesigned<br />
2006 <strong>ARTA</strong> launches first comprehensive plans for <strong>Auckland</strong>’s<br />
public transport network<br />
2006 Central Motorway Junction completed<br />
2007 First integrated <strong>Auckland</strong> <strong>Transport</strong> Plan launched<br />
2007 Planning for electrification gets under way<br />
2008 Northern Busway opens and Northern Express service<br />
takes 5,100 cars off morning peak-time roads<br />
2008 Real time passenger info (VPIDs) installed at all highpriority<br />
bus stops, and more bus lanes<br />
2008 40% tertiary discount fares and SuperGold Card for free<br />
senior travel introduced<br />
2008 Free public transport integrated into sports events and<br />
concert tickets<br />
2009 Contract for integrated ticketing system signed<br />
2009 Central Connector completed<br />
2009 SH20 extension through Mt Roskill completed<br />
2009 Downtown Ferry Terminal improvements completed and<br />
substantial rebuilding of piers 1-4 started<br />
<strong>2010</strong> New rail stations at Newmarket, New Lynn and Grafton<br />
completed, and Onehunga Branch Line reopens<br />
<strong>2010</strong> New rail link to Manukau City Centre well under way<br />
(complete mid 2011) and Western Line fully double tracked<br />
<strong>2010</strong> 20 existing rail stations upgraded and 10 new stations built<br />
since 2003. VPIDs at three rail stations<br />
<strong>2010</strong> CBD Rail Loop preferred route chosen and protected<br />
<strong>2010</strong> Extra Manukau Harbour Crossing completed<br />
<strong>2010</strong> TravelWise programme is taking 9,619 car trips off the<br />
road each morning peak<br />
<strong>2010</strong> 60.6m trips taken on public transport. Use of public<br />
transport increased 13.9% from March 2005 to March <strong>2010</strong><br />
10
Record numbers of <strong>Auckland</strong>ers are getting on board public transport. Patronage is higher than in any year since 1984 and rail usage has risen by 97%<br />
over the past five years. In <strong>2010</strong>, with completion of some major rail infrastructure projects, customer satisfaction with public transport has risen to 87%.<br />
11
Traffic congestion is costing the economy an estimated $1 billion a year. Revitalising <strong>Auckland</strong>’s rail assets to provide high-quality, high-frequency services has been<br />
the only way to achieve the objective of freeing up motorways and intensifying urban development.<br />
12
Priority projects<br />
<strong>The</strong>se projects were identified in the 10-year <strong>Auckland</strong> Passenger <strong>Transport</strong> Network Plan 2006-2016<br />
as the major components. <strong>The</strong> table below gives the background work undertaken to achieve the results<br />
listed in the comparison table on page 10.<br />
Project<br />
Rail<br />
Electrifying the rail network<br />
Complete double tracking the<br />
Western Line<br />
New rail station for Newmarket<br />
New rail station for New Lynn<br />
New rail connection to Manukau City<br />
Centre<br />
Reopening Onehunga Branch Line<br />
Upgraded train stations<br />
New rolling stock (trains)<br />
Buses<br />
Completing the Northern Busway and<br />
expanding the service to Orewa<br />
Work undertaken<br />
Detailed planning began in 2005 with an in-depth electric traction technical evaluation<br />
study and cost/benefit analysis of electric vs diesel trains. Further planning, and funding<br />
go-ahead in 2007, led to a call for EOIs. Funding shifted to KiwiRail in March 2009<br />
(following cancellation of regional fuel tax). In November 2009, $500m was approved<br />
for electrical multiple units. In January <strong>2010</strong>, a contract was signed for the infrastructure<br />
required. A supplier for the electric trains is expected to be contracted early 2011. See the<br />
case study on page 34 for details.<br />
<strong>2004</strong>/05 Swanson to Waitakere<br />
2005 Boston Rd to Morningside<br />
2007 New Lynn to Henderson<br />
2008 Henderson to Swanson<br />
<strong>2010</strong> last sections completed from Britomart through Newmarket Viaduct to Boston<br />
Road, and Morningside to New Lynn.<br />
New Remuera Link Road bridge constructed to access Remuera Road station entrance.<br />
Station concourse with floating roof canopy built above four platforms.<br />
Opened January <strong>2010</strong>.<br />
Integrated into double tracking from Avondale to Titirangi Road and with a bus transport<br />
interchange. Trench work complete, station opened in September <strong>2010</strong>.<br />
2km of new rail line is being constructed linking Manukau City Centre with the Southern<br />
Line at Puhinui. New rail station and platforms, plus bus transport interchange are being<br />
constructed, to open mid-2011.<br />
Work on three new stations began August 2009 — at Onehunga Town, Penrose and Te<br />
Papapa. Opened in September <strong>2010</strong>.<br />
Upgrading work began in 2005 to accommodate longer trains and greater passenger<br />
numbers, improve security and information, and to meet disability access standards. All<br />
existing stations are expected to be upgraded by 2013.<br />
<strong>The</strong>re are now 135 trains in services, as opposed to 46 in 2003/04. <strong>The</strong>se trains were<br />
integral to delivering 10-minute frequencies on the three branch lines.<br />
Albany and Constellation stations and Park-and-Ride facilities were commissioned<br />
in November 2005 and three further stations the following year. <strong>The</strong> 8.4km Northern<br />
Busway opened in February 2008, allowing buses to travel at high frequencies both north<br />
and south unaffected by traffic congestion. See case study on page 37 for more details.<br />
Plans to extend the busway through Silverdale and on to Orewa are under way.<br />
13
Project cont...<br />
Completing the Central Connector<br />
Improved feeder services to the RTN<br />
New QTN services between key<br />
destinations including Botany, Manukau<br />
and <strong>Auckland</strong> Airport<br />
New bus services to growth areas<br />
New cross-town QTN bus services<br />
serving major movements, e.g. <strong>Auckland</strong><br />
isthmus to Tamaki fringe<br />
Ferries<br />
Upgrade terminals at Bayswater, Beach<br />
Haven and Half Moon Bay<br />
Investigate new ferry terminals at Browns<br />
Bay, Takapuna, Te Atatu, Hobsonville and<br />
Island Bay and introduce services<br />
Improve services at new and upgraded<br />
terminals<br />
<strong>Transport</strong> system<br />
improvements<br />
Continue to implement real time<br />
information<br />
Single integrated ticket system<br />
A simpler, integrated fare structure<br />
Work undertaken cont...<br />
Work began in 2008 on the 4km bus priority project connecting Britomart with<br />
Newmarket. Includes 24-hour bus lanes, new bus stops and shelters, improved traffic<br />
signals, safety, walking and cycling amenities.<br />
In 2005, there was a 28% increase in overall bus services across the North Shore. Albany<br />
and Constellation feeder bus services grew by 41% to June 2008.<br />
In 2007, routes in the Panmure to Botany corridor and in Manurewa were changed to<br />
coincide with the opening of the rail/bus transport interchanges, resulting in 19% growth.<br />
In 2007, more frequent peak-time services were added between Botany and downtown<br />
<strong>Auckland</strong>, growing patronage by 30% in one year.<br />
In June 2008, the Airbus Express to the Airport was relaunched with an increased<br />
frequency and more direct route. A new service from Manukau to the Airport was also<br />
launched, together increasing patronage by 13.5% to June 2009.<br />
New bus services to Sylvia Park led to patronage increase of 31%. New services for<br />
Flatbush and Mission Heights were designed in 2008.<br />
Botany, Manukau and Howick services were redesigned and introduced in February<br />
2009. Simplified routes within these areas and to the CBD resulted in a 65% increase to<br />
March <strong>2010</strong> for just 1.4% higher subsidy.<br />
Bayswater and Beachhaven upgrades planned 2007 but deferred.<br />
Half Moon Bay upgraded 2008. Birkenhead upgraded <strong>2010</strong>.<br />
<strong>The</strong> success of the Northern Busway, fare increases and parking charges at ferry<br />
terminals are impacting on efforts to increase ferry patronage. <strong>ARTA</strong>’s focus is on building<br />
a new terminal at Hobsonville, a high population growth area. Detailed design work has<br />
begun, with construction to be complete by July 2011.<br />
More frequent services from Pine Harbour and West Harbour have been enabled by<br />
subsidies to operators to purchase new vessels. In 2009, patronage on these services<br />
increased by 20% and 24% respectively.<br />
In 2009, 146 variable passenger information displays (VPIDs) were installed at high-use<br />
bus stops. 173 solar powered information displays were installed at lower-use bus stops.<br />
In <strong>2010</strong>, VPIDs were installed at three major rail stations and three ferry terminals. New<br />
Lynn and Manukau interchanges will incorporate VPIDs, and 20 other upgraded stations<br />
will get VPIDs in advance of the RWC 2011.<br />
A contract to develop and implement a smartcard integrated ticket system was signed in<br />
November 2009.<br />
A fully contracted system of bus services was introduced in 2008 through legislative<br />
changes advocated by <strong>ARTA</strong>. A new fares policy to form the basis for integrated ticketing<br />
was developed in 2006 to create uniformity across all operators and clarity for customers.<br />
14
Rebuilding the rail network<br />
In 2005, the Government allocated $600 million to rebuild <strong>Auckland</strong>’s rail assets. Project DART (Developing<br />
<strong>Auckland</strong>’s Rail <strong>Transport</strong>) as it became known was assigned to KiwiRail, with responsibility for all the below ground<br />
works. This included double tracking the Western Line, Newmarket redevelopment and the Manukau Rail Link. All the<br />
above ground upgrades to rail stations and rolling stock were to be funded and managed by <strong>ARTA</strong>, paid for by regional<br />
rates and from the Land <strong>Transport</strong> New Zealand (later NZ <strong>Transport</strong> Agency) budget.<br />
Upgrading and building new rail stations<br />
30 out of the 40 rail stations on the four branch lines in the region are either new or have been upgraded in<br />
the past six years. <strong>The</strong> remaining 10 are planned for upgrade by 2013 and a new branch line to Manukau City Centre<br />
is due to open in 2011. <strong>The</strong> stations accommodate longer trains and<br />
greater passenger numbers, improve security and information, and<br />
meet modern disability access standards. <strong>The</strong>y all have modern<br />
shelters and seating, CCTV security monitoring, emergency help<br />
points, improved lighting, safety markings including yellow tactile<br />
strips strategically placed on platform for the visually impaired, public<br />
address systems, information display boards showing timetable<br />
information and way-finding signage/maps. A programme is under<br />
way for real time information displays to be installed at stations.<br />
Upgraded stations, in the same location:<br />
<strong>2004</strong>: Glen Innes<br />
2005: Papatoetoe, Ranui<br />
2006: Henderson, Homai, Meadowbank, Orakei, Puhinui<br />
2007: Glen Eden, Fruitvale, Manurewa, Middlemore, Sunnyvale<br />
2008: Ellerslie, Mt Eden, Papakura, Ranui (stage 2),<br />
Sturges Road, Swanson<br />
2009: Morningside<br />
<strong>2010</strong>: Kingsland.<br />
New stations, including new location:<br />
2003: Britomart<br />
2007: Panmure, Sylvia Park<br />
<strong>2010</strong>: Avondale, Grafton, New Lynn, Newmarket,<br />
Onehunga, Penrose, Te Papapa<br />
2011: Manukau.<br />
Stations yet to be upgraded, renewed or built:<br />
Baldwin Ave, Mt Albert, Remuera, Greenlane, Penrose Main Line,<br />
Westfield, Otahuhu, Te Mahia, Takinini, Pukekohe, Waitakere and<br />
Strand Emergency Station. <strong>The</strong>re is also potential for two new stations<br />
at Parnell and Drury.<br />
With major infrastructure works completed this year and the<br />
reopening of the Onehunga Branch Line, 400 extra train trips<br />
are now running <strong>Auckland</strong>-wide each week, which is a 25%<br />
increase in services.<br />
15
<strong>Auckland</strong> patronage growth versus population growth<br />
Patronage<br />
Population<br />
62,000,000<br />
60,000,000<br />
58,000,000<br />
1,460,000<br />
1,440,000<br />
1,420,000<br />
1,400,000<br />
Patronage<br />
56,000,000<br />
54,000,000<br />
52,000,000<br />
50,000,000<br />
2006 2007 2008 2009 <strong>2010</strong> 2011<br />
Patronage on <strong>Auckland</strong>’s public transport 1960 - <strong>2010</strong><br />
70,000,000<br />
60,000,000<br />
50,000,000<br />
40,000,000<br />
30,000,000<br />
20,000,000<br />
10,000,000<br />
1960<br />
1962<br />
1964<br />
1966<br />
1968<br />
1970<br />
1972<br />
1974<br />
1976<br />
1978<br />
1980<br />
1982<br />
1984<br />
1986<br />
1988<br />
1990<br />
1992<br />
1994<br />
1996<br />
1998<br />
2000<br />
2002<br />
<strong>2004</strong><br />
2006<br />
2008<br />
<strong>2010</strong><br />
1,380,000<br />
1,360,000<br />
1,340,000<br />
1,320,000<br />
1,300,000<br />
Population<br />
48,000,000<br />
1,280,000<br />
In 30 years’ time, <strong>Auckland</strong>’s population is predicted to reach two million. A world-class transport system will need to carry at least 200 million public<br />
transport trips a year if we are to improve journey times across the region. <strong>ARTA</strong>’s strategic goal has been to double the number of public transport<br />
journeys by 2016, in order to keep pace with population growth. <strong>The</strong> graph above shows that the consistent increase in patronage levels since 2006<br />
is tracking with our expanding population.<br />
Increase in rail services<br />
June<br />
2007<br />
June<br />
2008<br />
June<br />
2009<br />
June<br />
<strong>2010</strong><br />
September<br />
<strong>2010</strong><br />
Services (per week) 1,301 1,382 1,475 1,529 1,951<br />
% Increase from previous year 9.1% 6.2% 6.7% 3.7% 25%<br />
16
ANNUAL HIGHLIGHTS – CASE STUDY<br />
2005: Double tracking the Western Line (Project DART)<br />
<strong>Auckland</strong> has had four rail lines, built between 1873 and 1930. By 1939, both the Eastern and Southern rail lines<br />
were fully double tracked. <strong>The</strong> first section of the Western Line to be double tracked was Morningside to Avondale in<br />
1966. No further progress was made until 2005, when ONTRACK (later KiwiRail) began works for stage one of what was<br />
then known as Project Boston and is now Project DART. <strong>The</strong> section of track from Boston Road to Morningside was<br />
completed in 2005 and integrated with construction that same year of a new station at Kingsland. Double tracking of the<br />
entire line from Britomart through to Waitakere was completed mid-<strong>2010</strong>.<br />
Double tracking work and extra carriages allowed the services in peak times to run every 15 minutes from July 2008,<br />
which contributed over half of the 12.6% patronage growth on trains in the following year. Peak time services on the<br />
Western Line now run every ten minutes.<br />
Partners: KiwiRail, <strong>ARTA</strong><br />
A crew of more than 600 worked around the clock over Christmas 2008/9 on rail infrastructure projects. <strong>The</strong>y laid 7km of new track and excavated over<br />
50,000m 3 of dirt in less than a week.<br />
17
Increasing rolling stock and refurbishing trains<br />
Over half of <strong>Auckland</strong>’s train fleet was more than 25 years old at the time <strong>ARTA</strong> launched the first Rail Development<br />
Plan for <strong>Auckland</strong> in 2006. <strong>The</strong> oldest had been in service nearly 40 years. <strong>The</strong> plan was to have 28 new trains in service<br />
by 2009 and 35 trains in service by 2011, in order to deliver 10-minute frequency of services. Peak period trains would<br />
have four to six carriages. That level of expansion has been exceeded with a total additional 89 trains in service across all<br />
classes.<br />
<strong>The</strong> first high-frequency bus corridors<br />
In June <strong>2010</strong>, the first QTN high-frequency bus corridors started operating along Mt Eden Road and Dominion<br />
Road. <strong>The</strong> b.line buses run every one to 15 minutes from 7am to 7pm on weekdays. Like the Northern Express on the<br />
RTN, the service is designed to be ‘turn-up-and-go’. No timetables needed. As part of the process of developing b.line,<br />
<strong>ARTA</strong> asked its online consumer panel to rate the service’s potential to move <strong>Auckland</strong> forward. Along with integrated<br />
ticketing, b.line scored highly on a range of factors, including being world-class, vibrant, simple and easy and meeting<br />
customers’ needs.<br />
Downtown Ferry Terminal repairs<br />
<strong>The</strong> Downtown Ferry Terminal is the hub of <strong>Auckland</strong> region’s passenger ferry services. <strong>The</strong> terminal was built on<br />
top of wharves that are over 100 years old. <strong>The</strong> undersides of these historic piers have become corroded by a combination<br />
of environmental toxins such as chlorides and sewage leaks, structural overloads and through design and construction<br />
flaws. <strong>The</strong> piers required substantial repairs to their structural fabric. <strong>ARTA</strong> took over responsibility for the Downtown<br />
Ferry Terminal infrastructure in October 2007, when it absorbed ARTNL, and funded substantial partial rebuilds. Work on<br />
piers 1 and 2 was completed in mid <strong>2010</strong>. Investigation and design is complete for piers 3 and 4 but the physical works<br />
programme is yet to be confirmed.<br />
Several improvements to passenger facilities at the Downtown Ferry Terminal were also completed in 2008, including a<br />
glass wall enclosure and ports operations office on pier 1, a canopy on pier 2 and construction of a link bridge between<br />
the two piers.<br />
Encouraging more sustainable travel<br />
A key conclusion of the RLTS, and of transport studies and strategies worldwide, is that building roads cannot,<br />
on its own, reduce traffic congestion or provide a transport system that meets wider environmental and social goals.<br />
Public transport, walking and cycling have vital roles to play in the shift towards lowering the cost of transport on the<br />
environment and human health.<br />
In 2006, <strong>ARTA</strong> launched the Sustainable <strong>Transport</strong> Plan, which defined sustainable transport as working with people and<br />
their communities to improve travel opportunities and to encourage people to make fewer car journeys. <strong>ARTA</strong> took the<br />
lead role in ensuring the plan remained on track and had three mains tools for influencing this: land use planning, funding<br />
and activities it delivered directly.<br />
18
Achievements in three main elements of the plan are reported on in this section:<br />
q<br />
q<br />
q<br />
TravelWise programme in schools, workplaces and tertiary institutes<br />
Accessible public transport<br />
Walking and cycling action plans.<br />
TravelWise programme<br />
<strong>The</strong> TravelWise programme was launched in 2005 with the goal of achieving voluntary reductions in car travel to <strong>Auckland</strong><br />
schools, workplaces and tertiary institutes of 20,000 trips each morning by 2016. For context, 20,000 is the maximum<br />
number of trips that could cross the <strong>Auckland</strong> Harbour Bridge — eight lanes of motorway — in an hour.<br />
<strong>ARTA</strong> has employed teams of plan advisers and the TravelWise partnership is on track to achieving the above RLTS goal. It<br />
is making an important contribution to the Government’s objectives for road safety and the reduction of traffic congestion<br />
in major urban areas.<br />
Overall, results of TravelWise include:<br />
q<br />
q<br />
q<br />
q<br />
q<br />
Taking 9,619 car trips off the road each morning peak<br />
Halving child pedestrian injury crashes around TravelWise schools<br />
Reducing car travel by 135,000 km, giving a congestion benefit of $20.35 million each year<br />
Long-term safety benefits of infrastructure installed to date of $132 million<br />
An established reputation with schools, and a growing reputation with NZ’s top companies and major<br />
institutions.<br />
<strong>The</strong> <strong>2010</strong> TravelWise Week was the most successful ever, with 133 schools registered across <strong>Auckland</strong> and 54,000<br />
students participating.<br />
<strong>The</strong>re are now over 300 Walking School Buses operating at 130 schools throughout <strong>Auckland</strong> (up from 159 in 2005).<br />
A travel plan for the two CBD university campuses has achieved a reduction of 1,626 car trips to the CBD universities each<br />
peak morning.<br />
Partners: TravelWise has been managed in partnership by <strong>ARTA</strong>, the councils of <strong>Auckland</strong> City, Franklin District, Manukau<br />
City, North Shore City, Papakura District, Rodney District and Waitakere City, and the NZ <strong>Transport</strong> Agency.<br />
Cost/benefit ratio: 9.5, making this one of the most cost-effective transport programmes in New Zealand.<br />
“I believe we are reaching a tipping point with public transport use, through a shift in some key drivers. <strong>Auckland</strong>ers<br />
are now genuinely motivated by its environmental benefits; 25% of the crowds at special events travel by public<br />
transport and more dense inner city living has made it acceptable not to own a car. <strong>The</strong>re’s been a slow groundswell,<br />
with use of public transport becoming normalised for high earners as well as those on tighter budgets.”<br />
Shelley Watson, <strong>ARTA</strong> general manager, Marketing and Communications<br />
19
<strong>The</strong>re are 34 organisations in <strong>Auckland</strong> that have a workplace travel plan. A 2008 review found that there were 355 fewer car trips to work each<br />
day at the five workplaces with the most advanced travel plans.<br />
20
Workplace travel plans<br />
Vodafone NZ and <strong>Auckland</strong> Airport are two examples of the success of workplace travel plans in promoting more<br />
sustainable travel. Vodafone NZ was one of the first organisations to begin a plan, early in <strong>2004</strong>. Needing to relocate their<br />
1,100 staff, they worked closely with <strong>ARTA</strong> on an i-commute programme to promote the use of public transport, walking<br />
and cycling. While the company has benefited from a reduced need for car parking, the major benefits to the wider<br />
community by 2006 were:<br />
q Reduced congestion, saving other road users $64,000<br />
q<br />
Fewer road crashes, valued at $21,000 per year<br />
q Environmental and health benefits, valued at $45,000.<br />
In 2006, <strong>Auckland</strong> Airport developed its Lift programme with input from <strong>ARTA</strong>. Promoting car pooling and use of public<br />
transport to over 12,000 staff, the programme now has 23 companies in the airport vicinity as members. In just two years<br />
it had taken 840 cars off the road each month, reducing CO 2 emissions by at least 68 tonnes per year.<br />
Results: Ten workplaces have now completed and evaluated travel plans, and collectively have achieved a reduction of<br />
788 car trips to work each morning peak. This reduction in car trips corresponds to 4.5 million fewer kilometres travelled,<br />
and a CO 2 reduction of 1,469 tonnes.<br />
Progress on accessible public transport<br />
Both national and regional transport strategies require local authorities to consider the needs of transport<br />
disadvantaged people and to provide services to meet those needs. <strong>ARTA</strong> has been proactively working to improve<br />
accessibility for communities and groups whose needs are not met by the regular public transport system. <strong>The</strong>se groups<br />
are primarily children, senior citizens and disabled people.<br />
<strong>ARTA</strong> has established a <strong>Transport</strong> Disability Advisory Group (TDAG) that provides guidance, advice and clear direction to<br />
<strong>ARTA</strong>, councils and key stakeholders with the aim of increasing access to transport services for disabled people. We work<br />
closely with bus, train and ferry operators and with<br />
KiwiRail and local councils to achieve improvements to<br />
existing and new infrastructure, services, information<br />
about services and staff training. We also administer<br />
the Total Mobility (TM) scheme for taxi and hoist vehicle<br />
transport. <strong>The</strong> <strong>Auckland</strong> Regional Public <strong>Transport</strong><br />
Plan <strong>2010</strong> contains new policies and actions for<br />
transport disadvantaged <strong>Auckland</strong>ers that build on the<br />
progress to date, and a number of improvements to<br />
the Total Mobility scheme are due to be implemented<br />
in October this year.<br />
<strong>The</strong> old Grafton Bridge (right) has become a<br />
key element of the Central Connector route<br />
that links to the new Grafton Station.<br />
21
q<br />
q<br />
q<br />
q<br />
Disability access<br />
By the end of June <strong>2010</strong>:<br />
27 of the 38 operational rail stations were<br />
fully accessible, including 10 stations with ifts<br />
All stations will meet modern design criteria<br />
for accessibility by the time the upgrade<br />
programme is completed in 2013<br />
All trains were accessible via a portable<br />
ramp<br />
60% of <strong>Auckland</strong>’s urban bus fleet was<br />
wheelchair accessible and a further<br />
12% had ‘SuperLow Floor’ (single step<br />
access) without wheelchair ramps. <strong>The</strong><br />
remaining 28% had multiple step access<br />
but operation of these buses was mainly<br />
confined to peak periods<br />
<strong>ARTA</strong>’s “Vessel Standards for Ferries” had<br />
been issued for initial consultation by the<br />
industry and the TDAG. <strong>The</strong> intention of<br />
the new standards is to provide more<br />
consistent accessibility as new and<br />
refurbished vessels are introduced into<br />
service.<br />
9,500 people are registered with Total Mobility in the <strong>Auckland</strong> region, up<br />
from 8,000 in 2005.<br />
Total Mobility<br />
<strong>ARTA</strong> has implemented two phases of recommendations for national improvements to the Total Mobility Scheme. TM<br />
working group member Mary Schnackenberg says the biggest reason behind increases in registration for the scheme<br />
in <strong>Auckland</strong> is <strong>ARTA</strong>’s commitment to these improvements. “<strong>ARTA</strong>’s placed considerable energy into training assessors<br />
and raising awareness of the scheme. <strong>The</strong>y’ve led the country in signing on to the Phase 2 improvements.”<br />
From October <strong>2010</strong>:<br />
q<br />
q<br />
q<br />
More disabled people will be able to get concessionary fares on public transport as the Total Mobility ID card<br />
will be accepted as valid ID on selected services<br />
<strong>The</strong> TM maximum fare subsidy per trip will increase to reflect increasing costs of taxis and hoist vehicles fares<br />
<strong>Auckland</strong>’s and Wellington’s TM ID cards will be interoperable so clients can use their card to claim discounted<br />
fares when travelling in the other region, instead of using ‘out of town’ TM vouchers.<br />
22
Cycling and walking action plans<br />
<strong>ARTA</strong> has convened the Regional Cycling and Walking Group, along with developing and monitoring walking and<br />
cycling action plans. Walking is an essential link between transport networks and destinations and accounted for 13% of<br />
all journeys in our region in 2006, yet <strong>Auckland</strong> has a reputation as one of the worst cities in the world for walking. Goals<br />
of the Sustainability Plan 2006 were for the <strong>Auckland</strong> region to be walk-friendly, and in particular for the walkability of 18<br />
town centres to be improved. <strong>The</strong>re are no specific means for measuring walking but all new town centre plans, such<br />
as Botany’s, take pedestrian needs into account, and the move towards more dense urban living is also supporting<br />
walking. <strong>The</strong> RLTS set a goal for 2016 of 15% of morning peak trips made by walking or cycling, particularly to schools and<br />
town centres. This goal is being measured through the TravelWise goal of 20,000 fewer car trips being taken each peak<br />
morning.<br />
Only 1% of all morning peak trips were being made by cycling in 2006. <strong>The</strong> key is providing space to cycle and minimising<br />
conflicts between cyclists and other road users. Hence, the Regional Cycle Network was created in 2007. Cycle parking<br />
also needed improving, along with the ability to take cycles on trains and ferries.<br />
Main goals of the Cycling Action Plan were:<br />
Achieved<br />
Half of the 938km Regional Cycle Network 32.6% or 306.2km scheduled for completion by 2012<br />
completed by 2016 (cost $100m)<br />
Develop and distribute cycle maps<br />
5 regional cycle maps produced showing dedicated<br />
cycleways 47,000 maps distributed. Google cycle<br />
maps available on MAXX website<br />
Contribute to the marketing and promotion BikeWise Week extended to one month in 2009<br />
of cycling<br />
Result: <strong>The</strong> RLTS target for 2016 was to increase cycling by 1%. <strong>The</strong>re was no overall change from 2006-2009 but<br />
significant increases at sites where cycle routes are continuous and connected. In <strong>2010</strong>, there has been an annual increase<br />
in cycling of 27%, with the North Western Cycleway rising by 70%.<br />
Increasing customer satisfaction and loyalty to public transport<br />
<strong>ARTA</strong>’s customer focus has built like a wave over the past six years, working hand-in-hand with delivery of major<br />
projects and development of services. In the first years, while comprehensive plans were being made, marketing had a<br />
twin focus — the need to better understand our customer base and the desire for customers to better understand their<br />
travel choices.<br />
In 2006, <strong>ARTA</strong> printed and distributed over 1.5 million timetable brochures and regional guides, along with increasing<br />
information on the ground at Britomart, bus stops, train stations and ferry terminals. Permanent information units were<br />
installed at 10 locations. <strong>The</strong> Contact Centre, run by the ARC, and the MAXX Journey Planner website were also central<br />
to creating a perception shift that public transport could be easy to use, safe and reliable.<br />
23
<strong>The</strong>se three qualities were discovered to be high on the list of barriers to use of public transport. In 2006 and again in<br />
2009, <strong>ARTA</strong> carried out segmentation studies of the public transport customer base, firstly to identify particular barriers<br />
and opportunities for each segment of the population and then to assess the shift in perception over three years. Six target<br />
customer segments were identified in 2009. <strong>The</strong>re are opportunities to retain and grow patronage by tertiary students,<br />
retirees, ‘empty nesters’ (50-69 age) and public transport lovers (30-59 environmentally aware). New customers could<br />
be attained from ‘flat out families’ who need to transport kids and ‘anxious parents’ with additional concerns about safety<br />
on public transport.<br />
Key managers from both Veolia and <strong>ARTA</strong> headed out to train stations in October 2008 and April 2009 to hear exactly<br />
what mattered most to customers. ‘Meet the Managers’ was designed to give rail customers the experience of giving<br />
feedback directly to decision-makers who had authority to act on complaints and suggestions. Customer feedback<br />
resulted in a number of improvements, such as customer service ambassadors available at Britomart and key interchange<br />
locations during times of service disruption and special events; new Star Mart ticket agencies in the central city; and<br />
improved safety signage for all trains.<br />
Tertiary fare concessions<br />
<strong>The</strong> Universities’ Travel Plan was introduced in 2007. At the start of the 2008 academic year, <strong>ARTA</strong> began an ongoing<br />
campaign, particularly via social media, to raise students’ awareness about their travel choices and launched it by<br />
introducing a 40% discount off the one-way single adult fare, doubling the discount students had previously received.<br />
Tertiary 12 month rolling total<br />
4,500,000<br />
4,264,535<br />
4,000,000<br />
3,500.000<br />
3,000,000<br />
2,500,000<br />
Tertiary discounts for<br />
Multiride discounts<br />
increases from 20% to<br />
40% of adult fare.<br />
2,000,000<br />
1,500,000<br />
1,000,000<br />
500,000<br />
Mar 05<br />
Jun 05<br />
Sep 05<br />
Dec 05<br />
Mar 06<br />
Jun 06<br />
Sep 06<br />
Dec 06<br />
Mar 07<br />
Jun 07<br />
Sep 07<br />
Dec 07<br />
Mar 08<br />
Jun 08<br />
Sep 08<br />
Dec 08<br />
Mar 09<br />
Jun 09<br />
Sep 09<br />
Dec 09<br />
Mar 10<br />
Jun 10<br />
24
<strong>The</strong> campaign was an instant success.<br />
Results: Tertiary student patronage of buses, trains and ferries was flat at around 1.5 million from March 2005 to March<br />
2008. Since then the 40% discount has boosted tertiary patronage to June <strong>2010</strong> by 186%, with an additional 2.78 million<br />
trips on public transport being taken by students in the 12 months to June <strong>2010</strong>.<br />
SuperGold Card success<br />
From 1 October 2008 Senior Citizen card holders became entitled to free public transport on all buses, trains and ferries<br />
after 9am on weekdays and all day on weekends and public holidays. Getting senior citizens out of their cars and onto<br />
public transport during commercial hours helps free up our roads for business activity, and makes good use of off-peak<br />
public transport services. Equally, it gives those who can no longer drive greater access to their local communities,<br />
reducing social isolation.<br />
While central government funded the off-peak SuperGold Card initiative through the Ministry of Social Development,<br />
<strong>ARTA</strong> and the ARC worked with the NZTA to get an even better deal exclusively for <strong>Auckland</strong>’s senior citizens, to include<br />
free travel during afternoon peak services.<br />
Results: SuperGold Card trips on public transport have risen from 1.7 million in the 12 months to September 2008 to 5.5<br />
million for the 12 months to June <strong>2010</strong>. This is an increase of 277%.<br />
SuperGold Card 12 month rolling total<br />
5,500,000<br />
5,531,832<br />
5,000,000<br />
4,500,000<br />
4,000,000<br />
3,500,000<br />
3,000,000<br />
Free offpeak travel<br />
for SuperGold Card<br />
holders introduced.<br />
2,500,000<br />
2,000,000<br />
1,500,000<br />
1,000,000<br />
500,000<br />
000,000<br />
Mar 05<br />
Jun 05<br />
Sep 05<br />
Dec 05<br />
Mar 06<br />
Jun 06<br />
Sep 06<br />
Dec 06<br />
Mar 07<br />
Jun 07<br />
Sep 07<br />
Dec 07<br />
Mar 08<br />
Jun 08<br />
Sep 08<br />
Dec 08<br />
Mar 09<br />
Jun 09<br />
Sep 09<br />
Dec 09<br />
Mar 10<br />
Jun 10<br />
25
Newmarket Station, nestled amidst apartment<br />
living and a vibrant retail area, is a great example<br />
of transport working hand in hand with more<br />
intensified land use.<br />
Planning and funding –<br />
a coordinated regional approach<br />
Until <strong>ARTA</strong>’s inception, the planning and funding of transport activities in the<br />
region was devolved to the ARC and each of the seven territorial authorities. This<br />
piecemeal approach and the lack of an objective framework for prioritising projects<br />
with a regional impact were seen as delaying action on the urgent need to address<br />
<strong>Auckland</strong>’s increasing traffic congestion and its associated challenges. <strong>ARTA</strong> was<br />
tasked with planning and prioritising funding for high-priority projects on a regional<br />
basis.<br />
A central focus in the initial 18 months was to:<br />
q<br />
q<br />
Develop a set of prioritisation principles and assessment criteria for<br />
allocating scarce funding – the right projects at the right time<br />
Prepare a set of plans for the region’s transport system, based on these<br />
principles and on wide consultation with stakeholders.<br />
While the PTNP published in April 2006 was required by the RLTS, other plans such<br />
as <strong>Auckland</strong> <strong>Transport</strong> Plan, the Sustainable <strong>Transport</strong> Plan and the Rail Development<br />
Plan were innovative and represented a first for <strong>Auckland</strong> as comprehensive planning<br />
documents to move <strong>Auckland</strong> forward in an integrated and sustainable way.<br />
Aspects of the PTNP research are discussed on pages 5 to 7 and the table on page<br />
13-14 shows the priority projects within the 2006-2016 planning period, along with<br />
substantial progress to <strong>2010</strong>. <strong>The</strong> Sustainable <strong>Transport</strong> Plan has been discussed in<br />
the section on encouraging more sustainable travel on pages 18 to 23. <strong>The</strong> other<br />
plans are discussed below.<br />
<strong>The</strong> first Rail Development Plan<br />
Revitalising <strong>Auckland</strong>’s rail assets was pivotal to the PTNP. Long neglected, the rail<br />
system had huge strategic importance for its potential to address traffic congestion<br />
and its revitalisation represented the possibility of a real step change in the shift<br />
towards increased patronage of public transport. <strong>The</strong> opening of Britomart, and a<br />
modest investment in upgraded trains, tracks and stations, had doubled patronage<br />
on the trains in three years, from 2.5 million in 2003 to 5 million in June 2006.<br />
At the same time, the underlying tensions in <strong>Auckland</strong>’s complex local body structures<br />
were nowhere more apparent than in the development of the region’s rail assets. <strong>The</strong><br />
Government and the ARC bought the rail assets back from TranzRail and granted<br />
access rights to a private operator Connex (now Veolia) to run services, while the<br />
territorial authorities set up the <strong>Auckland</strong> Regional <strong>Transport</strong> Network Ltd (ARTNL)<br />
26
to own and maintain the stations. This was the situation <strong>ARTA</strong> stepped into in<br />
<strong>2004</strong>. Launching the Rail Development Plan in August 2006 was a step in the<br />
direction of changing both <strong>Auckland</strong>’s transport development and the shape of<br />
the region’s urban development. <strong>The</strong> plan presented a strong business case<br />
for electrifying the network.<br />
Implementing the plan required buy-in at both regional and national levels,<br />
particularly as it incorporated a business case for electrifying <strong>Auckland</strong>’s rail<br />
network (see page 34 for more). <strong>The</strong> number of stakeholders involved has<br />
meant persistence and dedicated effort being required to give effect to an<br />
extensive programme of work — from rolling stock, signalling, train carriage<br />
refurbishment, station upgrades, new stations and electrification of the network.<br />
<strong>The</strong> significant results of that work are detailed on pages 15 to 18.<br />
ARTNL’s assets were transferred to <strong>ARTA</strong> in October 2007, by an Order In<br />
Council.<br />
<strong>The</strong> innovative <strong>Auckland</strong> <strong>Transport</strong> Plan 2007/2009<br />
<strong>The</strong> 2007 <strong>Auckland</strong> <strong>Transport</strong> Plan (ATP) became a landmark for forward<br />
planning in <strong>Auckland</strong> transport. As the region’s 10-year planning document,<br />
applied within a longer-term context, it set out — for the first time — one<br />
cohesive programme of work. It unified the strategies, plans and projects<br />
of every stakeholder agency and all the modes of travel, harnessing the<br />
role that transport can play in delivering a broad set of economic, social and<br />
environmental outcomes for the region.<br />
<strong>The</strong> ATP has encouraged cooperative action between all the agencies involved<br />
and priorisiting of funding. It is the main mechanism for transforming the policies<br />
and strategies in the RLTS into action. <strong>The</strong> ATP 2009 replaced this flagship<br />
document and requires funding in excess of $22 billion to achieve both the<br />
10-year and key long-term projects such as the CBD Rail Loop and rail to the<br />
airport. It aims to raise awareness of the major funding challenges faced by the<br />
region.<br />
Prioritising funding and projects<br />
<strong>Auckland</strong> has had to make trade-offs, given that funding for transport has<br />
consistently fallen short of and delayed projects required to meet both national<br />
and regional targets. In order to ensure that best use was made of scarce<br />
funds, <strong>ARTA</strong> was legally required to make a statement about its view of the land<br />
transport priorities in the region, including the priorities of other organisations.<br />
We have then recommended which projects should receive a subsidy from the<br />
National Land <strong>Transport</strong> Programme.<br />
27
To ensure that view was objective and backed by sound reasoning, <strong>ARTA</strong> developed a set of prioritisation principles that<br />
took account of other regional planning document objectives and goals as well as its own, and NZTA and Ministry of<br />
<strong>Transport</strong> objectives for the land transport network.<br />
Three main assessment criteria were derived from the principles:<br />
q<br />
q<br />
q<br />
Seriousness and urgency of the issues being addressed<br />
Effectiveness of the proposed solution<br />
Efficiency.<br />
Components of the PTNP 2006-2016 were rated as high, medium or low against each of the three criteria. <strong>The</strong> top priority<br />
was clear: making progress in developing the RTN, followed by the QTN.<br />
Funding would also be prioritised by taking into account:<br />
q<br />
q<br />
q<br />
Investments already committed to, such as double tracking the Western Line<br />
Geographic priorities, namely those areas poorly served by public transport<br />
Projects that contributed to the preferred long-term development of the network.<br />
<strong>The</strong> ATP has informed <strong>ARTA</strong>’s Regional Land <strong>Transport</strong> Programme of activities. Released in June 2009, the latest<br />
programme prioritises over 950 projects worth $4.36 billion over the next three years, compared to only around 300<br />
projects in previous three-year programmes.<br />
An inherited model for bus and ferry operation that had proved unsuccessful in other<br />
international cities<br />
Cities across the world outsource the operations of bus services to reduce subsidies and improve quality. Bus and ferry<br />
services have always been privately operated in <strong>Auckland</strong>, some services with government subsidies and others on a<br />
fully commercial basis. Restraints imposed by the Commerce Commission have prevented any one company from fully<br />
monopolising the <strong>Auckland</strong> bus or ferry market but deregulation had similar effects to those in the UK — a dramatic rise in<br />
public subsidies following a host of commercial service deregistrations, and stagnant bus and ferry patronage.<br />
<strong>The</strong> <strong>Transport</strong> Services Licensing Act 1989 had created a service delivery framework that had not kept pace with growth.<br />
<strong>The</strong> procurement system allowed private operators to establish commercial services that did not have to meet quality,<br />
performance or customer standards. <strong>The</strong>y could walk away from those services at short notice. New legislation was<br />
needed to reverse this trend. <strong>ARTA</strong> proposed a fully contracted system, specifying how transport services were to be<br />
delivered, to the Ministry of <strong>Transport</strong>’s Public <strong>Transport</strong> Procurement Legislation Review in 2006.<br />
<strong>The</strong> resulting Public <strong>Transport</strong> Management Act 2008, has three purposes:<br />
q<br />
q<br />
q<br />
To prevent commercial services from being registered strategically at break even or loss levels<br />
To introduce a model of full contracting with incentives<br />
To facilitate the introduction of an integrated fare system.<br />
28
<strong>The</strong> Act allows <strong>ARTA</strong> to integrate all the routes, timetables and fares. All the revenue from contracted services comes<br />
to <strong>ARTA</strong> and each operator is paid a fixed rate, along with an incentive payment for each additional passenger they<br />
generate. This model rewards operators for innovation but insulates them from risk. It gives <strong>ARTA</strong> accurate information<br />
about revenues, on which to allocate subsidies. Longer contracts and larger clusters of contracts increase the interest<br />
of potential bidders. <strong>The</strong> Act also acknowledges that <strong>ARTA</strong> is better placed to leverage patronage growth than private<br />
operators because most of the levers, such as fuel pricing and tertiary education policies, are not within operators’<br />
controls. Operators still work with <strong>ARTA</strong> to define the most efficient routes and streamline their operations but <strong>ARTA</strong> has<br />
been able to enforce universal reliability standards.<br />
<strong>The</strong> Integrated <strong>Transport</strong> Assessment Guidelines<br />
Another significant change introduced by the LG(A)AA <strong>2004</strong>, was related to integrated land use. Land use and urban<br />
design in <strong>Auckland</strong> has been influenced by cars since the 1950s when car travel started to dominate and <strong>Auckland</strong> began<br />
to sprawl. Our inherited housing density, street layout and mix of activities continued to influence travel choices, leading<br />
to a public perception of walking and cycling as unattractive options. By 2001, the average travel pattern across <strong>Auckland</strong><br />
was for most trips, even very short ones, to be made by car.<br />
<strong>The</strong> Act required the ARC and the seven territorial authorities to prepare and publicly notify amendments to their district<br />
plans to specifically provide for integrated land use and transport. It gave <strong>ARTA</strong> an influencing role in ensuring land use<br />
decisions support a more integrated and sustainable transport system. <strong>ARTA</strong> led a process to develop Integrated <strong>Transport</strong><br />
Assessment Guidelines as a framework for gathering and assessing all the appropriate transport information required to<br />
assist developers, councils and the NZTA in better aligning land use and transport in <strong>Auckland</strong>. Developed in consultation<br />
with the ARC and stakeholders and published in 2006, the assessment tools were already in use internationally but <strong>ARTA</strong><br />
reshaped these tools for the <strong>Auckland</strong> context.<br />
Results: <strong>The</strong> guidelines were adopted by all seven territorial authorities. “<strong>ARTA</strong>‘s Integrated <strong>Transport</strong> Assessment<br />
Guidelines are an example of a framework that can be applied at a local/regional level.” Quality Planning, <strong>The</strong> RMA<br />
Planning Resource website.<br />
29
Special events planning<br />
<strong>ARTA</strong> has created two full-time positions to lead planning of special events. Given the specialised nature of the<br />
positions and their novelty in New Zealand, both positions were recruited internationally.<br />
Rugby World Cup<br />
A team of planners is being led by super event expert, Bruce Barnard. Bruce came fresh from similar jobs in<br />
Melbourne during both the 2006 Commonwealth Games and the 2007 World Swimming Championships. <strong>The</strong> team’s<br />
task has been to develop and deliver the detailed transport and traffic plan for the region during RWC 2011. With up to<br />
70,000 international visitors coming to <strong>Auckland</strong> for the Rugby World Cup in 2011, and four billion television viewers, this<br />
event is the city’s greatest opportunity to shine. $5 million is being spent on Kingsland Station to widen and lengthen both<br />
platforms, and improve access to the northern platform by building a pedestrian underpass and extra stairs over the<br />
railway tracks.<br />
Eden Park transport arrangements:<br />
When the ref’s final whistle blows at the Rugby World Cup, 60,000 fans will be on the move. <strong>ARTA</strong>’s goal is to get at least<br />
75% of ticket-holders to the nine matches at Eden Park by means other than private cars, freeing up our roads for other<br />
economic activity.<br />
q<br />
q<br />
q<br />
q<br />
q<br />
Trains: Kingsland-Britomart nine trains clearing 15,000 people in 70 minutes; two trains clearing 1400 people to<br />
the western suburbs<br />
Buses: 7,400 customers moved by special event bus services to and from Eden Park<br />
Coaches: 15,000 customers moved by coach<br />
Taxi: 3,000 people<br />
Walking: 3,000 people<br />
Special events<br />
Since 2008, a range of tickets for events at North Shore Stadium, Eden Park, Mt Smart and Vector Arena have<br />
been integrated with ‘free’ public transport services provided specifically for the event, and have proved a great incentive<br />
in getting more people out of their cars. <strong>ARTA</strong>’s special events planner is an integral member of a wider decision-making<br />
team environment for regional events — from other event planners to councils, traffic management teams and the Police<br />
— which has also helped to broaden the understanding regionally of the range of <strong>ARTA</strong>’s specialised activities.<br />
Result: In 2007, only 2% of fans used public transport, taxis or walked. In the winter of 2008, 36% left their cars at home<br />
for the Bledisloe Cup match. In March <strong>2010</strong>, 15% of fans at the Blues Super 14 used public transport.<br />
30
ANNUAL HIGHLIGHTS – CASE STUDY<br />
2006: Northern Express service<br />
<strong>The</strong> Northern Express began service in November 2005. Linking the new Constellation and Albany stations on<br />
the North Shore with the CBD, the Northern Express had a massive 200% growth in patronage in its first five months and a<br />
survey showed that 39% of customers had previously driven into the city. By the end of its first year in service, the express<br />
bus, with its 7,000 daily customers, had taken 5,100 cars off New Zealand’s busiest stretch of road each morning peak<br />
and made a significant contribution to the region’s environmental, economic and social goals:<br />
q<br />
q<br />
q<br />
q<br />
q<br />
q<br />
Reduced petrol and diesel use by 408,000 litres<br />
Reduced greenhouse gas emissions by 1,000 tonnes of CO 2 , toxic carbon monoxide by 13.6 tonnes and fine<br />
particulates by 140kg<br />
Reduced car travel by 3.9 million kms, generating time savings to other drivers valued at $5.5 million<br />
Provided wheelchair and pushchair accessible stations and buses<br />
Encouraged walking. Northern Express customers walked 600m more each day than previously<br />
Linked the key employment and growth areas of the North Shore with the CBD.<br />
In June <strong>2010</strong>, the Northern Express carried its five millionth passenger across the Waitemata Harbour. From just over 14,000 in its first<br />
month of 2005, the service now averages 170,000 passengers each month and peaked at 210,000 in March <strong>2010</strong>.<br />
31
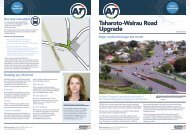
Growth, roads and economic challenges<br />
Population growth is one of two key drivers underlying the need for an integrated approach to transport planning<br />
in the region — one that encompasses state highways, arterial and local roads as well as public transport solutions.<br />
<strong>The</strong> second key driver is economic. We need to support and strengthen the transport links between <strong>Auckland</strong> and<br />
neighbouring regions with which we have close economic ties. By 2036 the gross domestic products (GDP) of <strong>Auckland</strong>,<br />
Northland, Waikato and the Bay of Plenty are expected to generate 60% of the country’s GDP.<br />
Three of the four major challenges identified in the ATP 2009 are roading related:<br />
q<br />
q<br />
q<br />
Complete the work under way to deliver a properly connected strategic and arterial roading network<br />
Manage the use of this roading network as the primary mover of freight, commercially important trips and other<br />
trips that cannot be made by public transport<br />
Maintain and improve <strong>Auckland</strong>’s inter-regional road and rail connections with its neighbouring regional<br />
economies.<br />
For the first time, the 2009-2012 Regional Land <strong>Transport</strong> Programme includes state highways, as a result of legislative<br />
changes. <strong>ARTA</strong> has been involved with state highway projects but does not manage them. Planning for, and prioritising,<br />
regional arterial road maintenance has formed an important part of <strong>ARTA</strong>’s role since the Land <strong>Transport</strong> Management<br />
Amendment Act was passed in 2008.<br />
<strong>The</strong> Regional Arterial Road Plan, released by <strong>ARTA</strong> in February 2009, defines the role of regional arterial roads, provides a<br />
framework for the integrated management of these roads and a robust basis for prioritising projects. Our regional arterials<br />
are stretches of: Great North and Great South roads, Ti Rakau Drive, Lincoln Road, Neilson/Church streets, South Eastern,<br />
Ellerslie Panmure and Albany highways; and Redoubt/Mill roads.<br />
<strong>The</strong> regional arterial road network plays an important role in distributing goods and services within the region. While<br />
comprising only 4% of the length of the total roading network it carries 18% of all freight and commercial journeys, and<br />
almost half of all bus trips and 15% of all peak-hour travel.<br />
<strong>The</strong> projected cost of upgrading the regional arterial network is around $4 billion. This reflects the high cost of road<br />
widening.<br />
Managing use of the road network<br />
<strong>The</strong> benefits of optimising traffic signals on one single major arterial, such as Dominion Road:<br />
q Fuel savings: 10%, or 215,000L<br />
q<br />
q<br />
C0 2 reduction: 10% or 550 tonnes<br />
Time savings: 64,000 hours<br />
q Benefit/cost ratio: 30<br />
32
Urban sprawl and reliance on private vehicles are being gradually reversed in <strong>Auckland</strong>, partly by integrating land use with development of public transport.<br />
33
ANNUAL HIGHLIGHTS – CASE STUDY<br />
2007: Electrification of the rail network<br />
Around the world, cities with high-frequency metropolitan rail services use electric trains. In 2005, <strong>ARTA</strong><br />
undertook a technical evaluation of possible electrification systems and compared the preferred option to diesel trains.<br />
While the start-up costs of electrifying the network were higher than sustaining the diesel system — around $180 million<br />
for infrastructure — the long-term performance and environmental benefits outweighed the status quo. Electric trains<br />
would improve local air quality, reduce noise and vibration, reduce greenhouse gas emissions and futureproof the rail<br />
system from fossil fuel price shocks. Electric trains are more reliable and cheaper to purchase, operate and maintain.<br />
<strong>The</strong>y have better acceleration between stations and enable high-frequency services through tunnels.<br />
This technical study formed a significant part of the first comprehensive Rail Development Plan for <strong>Auckland</strong>, published<br />
in 2006. It set out the business case for electrifying the region’s rail network. This business case was provided to<br />
the Government for funding approval. Persistent lobbying was required by both <strong>ARTA</strong> and the ARC to convince the<br />
Government to shift direction from its support for diesel trains, with ARC Chair Mike Lee giving an undertaking that the<br />
ARC would back the introduction of a regional fuel tax to pay for the electrification project. <strong>The</strong> Government considered<br />
the issue for eight months, and in May 2007 Cabinet gave its approval for <strong>ARTA</strong> to begin the process. In December 2008,<br />
expressions of interest were called for the supply of 140 electric trains. In March 2009, with the cancellation of the regional<br />
fuel tax, the project was reassigned to KiwiRail, and the completion date moved forward to 2013. In January <strong>2010</strong>, a<br />
contract was signed for the construction of 3,500 masts to support 80km of overhead wires. A supplier for the 38 electric<br />
multiple units (EMUs) is expected to be contracted early 2011, out of a shortlist of four bidders.<br />
Electric trains make it possible for the first time for <strong>Auckland</strong> to have an underground CBD Loop, as diesel trains cannot<br />
operate in long, confined tunnels. Similar metro rail projects in other cities such as Melbourne have resulted in more jobs<br />
being created and significant urban development and renewal around the stations. And with Britomart as a through<br />
station rather than a terminal, the total capacity of the rail network would also increase.<br />
Partners: KiwiRail, <strong>ARTA</strong>, ARC<br />
Cost: $500 million for train fleet and $180m for civil engineering, overhead wiring and signalling<br />
34
A step change to a world-class transport system<br />
In 2003, when Britomart opened, the new station was New Zealand’s first underground railway station. <strong>ARTA</strong>’s<br />
mission has been to deliver a world-class transport system — one that compares with other major cities around the globe.<br />
To achieve this required a step change and innovations in the way transport infrastructure and services were funded and<br />
delivered. <strong>ARTA</strong>’s concerted focus on moving ahead with its partners on long-delayed projects, has led to a number of<br />
other ‘firsts’ for New Zealand over the past six years.<br />
q<br />
q<br />
q<br />
q<br />
q<br />
q<br />
q<br />
<strong>The</strong> Northern Busway is the first purpose-built road for buses.<br />
Park-and-ride facilities at Albany and Constellation stations are a first.<br />
<strong>The</strong> new Sylvia Park rail station is the first privately funded rail station.<br />
<strong>Auckland</strong>’s single integrated ticket will be the first, true multi-modal transport ticket.<br />
Special event ticketing for sports and cultural events was well established internationally but unknown in<br />
New Zealand until introduced by <strong>ARTA</strong>.<br />
<strong>ARTA</strong> published the country’s first ever Sustainable <strong>Transport</strong> Plan in 2006, which was comprehensive and<br />
ambitious even by world standards.<br />
<strong>The</strong> Botany Town Centre Plan is the first town centre plan of its kind.<br />
Awards for projects<br />
<strong>The</strong> TravelWise school travel plan programme won a prestigious International Walk to School (IWalk) Award in<br />
2006, and was co-winner in the Outstanding Community Safety and/or Injury Prevention Initiative category of the<br />
2008 Community Safety and Injury Prevention Awards.<br />
<strong>The</strong> Botany Town Centre travel plan won the <strong>2010</strong> New Zealand Planning Institute’s Best Practice Award.<br />
<strong>ARTA</strong> won the 2006 Energy Efficiency and Conservation Authority (EECA) national award for the most energy<br />
efficient project in the transport category, for its role in coordinating <strong>Auckland</strong>’s Walking School Bus network,<br />
which topped 300 buses by 2009.<br />
<strong>Auckland</strong> Airport won the 2009 EECA Shell NZ <strong>Transport</strong> Award for its ‘Lift’ staff travel plan that, in its first two<br />
years, took 840 cars off the road each month. <strong>ARTA</strong> supported <strong>Auckland</strong> Airport in developing the plan.<br />
<strong>The</strong> first stage of the Northern Busway won the Shell Bitumen Excellence Award for a Major Roading Project<br />
and the Roading New Zealand Supreme Award. <strong>The</strong> completed busway won the Construction Projects over $2<br />
million at the Ingenium Excellence Awards.<br />
<strong>The</strong> MAXX Contact Centre, run by the ARC to provide customer information on public transport, won three prizes<br />
at the Contact Centre World Asia Pacific finals in 2009: second in the Best Contact Centre category, first in the<br />
Contact Centre Recruitment Campaigns, and runner-up for the Best Contact Centre Leader. <strong>The</strong> Contact Centre<br />
was the only finalist from New Zealand.<br />
35
Challenges and opportunities<br />
Industrial action and fare increases<br />
Patronage of <strong>Auckland</strong>’s buses had been steadily growing since the mid 1990s, peaking in 2003 at over 46<br />
million boardings. In May 2005, Stagecoach drivers went out on strike for a week in demand of better pay and working<br />
conditions. Stagecoach was receiving $35 million a year in subsidies to run its bus services in <strong>Auckland</strong>. While most<br />
<strong>Auckland</strong>ers were sympathetic towards the drivers, patronage on the buses fell quite dramatically in the second half of<br />
2005, down almost two million on the previous year. It took until March 2006 before patronage levels regained their 2003<br />
level, doubly hit by a 10% increase in bus fares in October 2005.<br />
Again in September and October 2009, a lock-out by NZ bus of 900 drivers and cleaners in its employment meant a week<br />
of disruption to 80,000 commuters and 10,000 school children. Bus patronage fell by 12.9% compared to October 2008<br />
but recovered faster than in 2005. By March <strong>2010</strong>, patronage was up 5% over the March 2009 figures and continued to<br />
climb, reaching 5.8% by May. In June <strong>2010</strong>, fares again increased by 2-3%.<br />
Service punctuality during major infrastructure works<br />
Reliable services underpin growth in public transport patronage. Service punctuality is measured using on-time<br />
running figures and has been a particular challenge for bus and rail services. Rail has suffered primarily from extensive<br />
construction work to tracks and stations, ageing track, signalling and rolling stock, increased patronage slowing boarding<br />
times, and inevitable incidents and accidents during construction. Road congestion has been the key difficulty for bus<br />
service punctuality. A standard measure used in similar cities around the world is five minutes, but <strong>Auckland</strong> was operating<br />
on a ‘within 20 minutes’ measure in <strong>2004</strong>. <strong>The</strong> new July 2005 North Shore bus service upped the ante, with a measure<br />
of arriving within five minutes of scheduled times and <strong>ARTA</strong> sought to have at least 80% of all services arriving within the<br />
same measure.<br />
Punctuality of the rail network dipped sharply from May 2005, due to the bus strike and increased passenger numbers,<br />
but rose again to 90% by November, as bus patronage recovered. In 2008, a lower target of 75% was set for the Western<br />
Line to account for double tracking work, yet 80.8% of services arrived within five minutes of their scheduled time, close<br />
to that of the Southern and Eastern Lines, at 82.8%. A wide range of mainly one-off events led to delays, primarily caused<br />
by signals and points failures. In 2009, delays due to infrastructure faults fell to their lowest level in three years, with<br />
Western Line punctuality rising to 87.8% and the other two lines averaging 84.2%. In <strong>2010</strong>, the Western Line performance<br />
was again affected by major infrastructure works at Newmarket and New Lynn, but has recovered with the completion<br />
of these works.<br />
On the Northern Busway, given dedicated road space, up to 99% of services were reported by their operator to run within<br />
five minutes of schedule.<br />
36
ANNUAL HIGHLIGHTS – CASE STUDY<br />
2008: Northern Busway opens<br />
When the Northern Busway opened in<br />
February 2008 it became New Zealand’s first<br />
purpose-built road dedicated to buses. Following<br />
SH1 from Constellation Drive to the Harbour Bridge,<br />
the busway was a key element of the Rapid Transit<br />
Network, allowing buses to travel at high frequencies<br />
(every three minutes now in peak times) unaffected<br />
by traffic congestion.<br />
Within weeks of the busway opening, passengers<br />
stopped checking the timetable because it was<br />
as simple as turn-up-and-go. In its first year, the<br />
Northern Express service on the busway took<br />
around 5,100 cars off the road (the equivalent of two<br />
motorway lanes both inbound and outbound).<br />
This service was largely responsible for a 6% drop in<br />
traffic on the Harbour Bridge in 2008.<br />
<strong>The</strong> busway has also supported the first public<br />
transport service linking the North Shore with<br />
<strong>Auckland</strong> Airport, with the Northern Flyer. From<br />
2009, Super Shuttles and Shore Shuttles were<br />
also permitted to use the busway, taking 20 to 30<br />
minutes off travel times in peak hours.<br />
<strong>ARTA</strong>’s role has been to programme bus services and<br />
the agency added $10 million to the construction of<br />
stations. Stage 2 of the busway is planned to extend<br />
north to Silverdale and Orewa.<br />
Partners: Transit New Zealand (now the<br />
New Zealand <strong>Transport</strong> Agency), North Shore City<br />
Council, <strong>Auckland</strong> City Council and <strong>ARTA</strong><br />
Cost: $300 million<br />
Dedicated busways carry 12,000 people an hour while a single lane of<br />
motorway carries only 2,400 people. <strong>The</strong> Northern Busway’s capacity<br />
and reliability is playing a key role in addressing traffic congestion over the<br />
Harbour Bridge by taking 5,100 cars off the road in morning peak times.<br />
37
ANNUAL HIGHLIGHTS – CASE STUDY<br />
2009: A single integrated ticket for <strong>Auckland</strong><br />
In December 2009, <strong>ARTA</strong> signed a contract with Thales to supply the country’s first truly multi-modal transport<br />
ticket, similar to London’s Oyster and Hong Kong’s Octopus systems. <strong>The</strong> swipe-on, swipe-off, smartcard payment<br />
system will include automated gates, smartcard readers on board buses and ferries, smartcard reload devices at<br />
selected rail and bus stations and ferry wharves, and the supply of all computer hardware, software, networks and<br />
communications. <strong>The</strong> contract is a critical next step in the delivery of an integrated ticket that will mean faster boarding<br />
times (speeding up bus journeys by 4%), dispensing with a wallet full of different tickets or change, fare reductions and<br />
potentially more frequent services.<br />
<strong>ARTA</strong> began exploring options to deliver affordable integrated ticketing in 2005 by developing a draft concept design<br />
and a tender evaluation process. <strong>The</strong> Passenger <strong>Transport</strong> Network Plan 2006-2016 included a fares policy to create<br />
uniform fare products across all operators of all modes of transport. <strong>The</strong> project since then has focused on identifying a<br />
best value for money, proven, risk-minimised solution. Thales has over 40 years’ experience in delivering integrated fare<br />
systems in more than 100 cities around the world.<br />
Planning and initial implementation activities are now under way for a limited functionality pilot of the system to take place<br />
in August 2011.<br />
This year, a key agreement has been developed between the New Zealand <strong>Transport</strong> Agency and ticketing system<br />
providers. <strong>The</strong> agreement paves the way for a set of national standards for a single, integrated public transport ticket that<br />
other regions can cost-effectively tap into after they’ve been adopted in <strong>Auckland</strong>. <strong>The</strong> standards define how the central<br />
core of a national system will function as well as how on-board<br />
operator equipment will interact with that system. By making<br />
transport usage data easier to collect in a common format, the<br />
An integrated ticket will deliver numerous benefits,<br />
including faster boarding times and more frequent<br />
national integrated ticket system will also enable better longterm<br />
planning and funding of public transport.<br />
services, as commuters transfer more easily between<br />
modes of transport using a single ticket purchased ahead<br />
of their journey.<br />
Partners: <strong>The</strong> French company Thales’ winning bid was placed<br />
as a consortium in partnership with the Bank of New Zealand<br />
and Transfield Services. Other project partners with <strong>ARTA</strong> are<br />
funders NZTA and the ARC. <strong>The</strong> national standards process is<br />
being assisted by Dutch specialists, Collis.<br />
“This is history in the making for <strong>Auckland</strong> and New Zealand.<br />
After a long and often challenging process, <strong>ARTA</strong> is at the gate<br />
and very happy to be signing the contract for the supply of a<br />
superior, multi-modal transport ticket for <strong>Auckland</strong>, which forms<br />
the basis of a core central ticketing system for New Zealand. This<br />
is about winning the big game.” <strong>ARTA</strong> Chair, Rabin Rabindran.<br />
38
Rising fuel prices in 2008 supports shift to public transport use<br />
In mid-2008, fuel prices reached unprecedented levels, peaking in July with regular petrol reaching $2.18 a litre.<br />
While the link between fuel prices and total public transport boardings over the past six years seems weak, uptake of<br />
public transport is influenced by a number of factors, including convenience, capacity, reliability and the relative cost of<br />
public versus private transport.<br />
In <strong>Auckland</strong>, in the 12 months to July 2008 train passenger numbers were 32% higher and average boardings for <strong>Auckland</strong><br />
buses increased by 3.5%. Between July and November 2008, transport fuel prices dropped significantly. An immediate<br />
upswing in traffic volumes was observed throughout New Zealand but customers in <strong>Auckland</strong> have remained loyal to<br />
public transport. From surveys <strong>ARTA</strong> has carried out, there is a growing commitment to use of public transport, with its<br />
environmental benefits being a significant driver.<br />
Sustaining funding for major projects<br />
Experience has shown there is no single solution to lifting <strong>Auckland</strong>’s transport funding constraints. A significant<br />
funding gap has long been identified in both the RLTS and <strong>ARTA</strong>’s ten-year planning documents. Even with adequate<br />
funding, the programme of action may be too little and too late to make acceptable progress towards <strong>Auckland</strong>’s, and<br />
the Government’s, objectives and targets.<br />
<strong>The</strong>re have been three major challenges in respect of funding:<br />
Allocation by mode<br />
<strong>The</strong> 2009 ATP has been limited by government funding arrangements that allocated funding by mode rather than across<br />
modes and based on merit.<br />
Changes to the way funding and projects are delivered<br />
For example, in 2005/06 the Government changed funding for the core network upgrade of rail. For the Western Line<br />
double tracking, Newmarket remodelling and Manukau Rail Link Treasury, through KiwiRail, would fund all below track<br />
upgrades (track, track signalling and platforms) while the region will totally fund above track capital improvements (trains<br />
and station facilities).<br />
In 2009, cancellation of the regional fuel tax affected a number of big ticket projects, including completion of Newmarket<br />
rail station and the electrification project, which was subsequently transferred to KiwiRail.<br />
<strong>The</strong> complexities of fragmented transport governance<br />
<strong>Transport</strong> funding has been complex. State highways are funded 100% through the National Land <strong>Transport</strong> Programme,<br />
local roads from local rates and the NLTP, KiwiRail directly by Treasury, <strong>ARTA</strong>’s rail infrastructure activities by the ARC,<br />
public transport services from regional rates and the NLTP; and ferry wharves by local councils, the ARC and the NLTP.<br />
39
ANNUAL HIGHLIGHTS – CASE STUDY<br />
<strong>2010</strong>: Newmarket Station opens<br />
Newmarket’s rail station is the city’s second busiest after Britomart and a key junction in <strong>Auckland</strong>’s rail network.<br />
<strong>The</strong> new station opened in January <strong>2010</strong>, after the old station closed in January 2008 to allow for both track realignment<br />
and construction of a large, modern station.<br />
<strong>The</strong> station is a self-ventilating, light and airy environment. A high-roofed atrium-like main station concourse is covered by<br />
a floating roof canopy, supported on elegant columns. Lower level canopies create shelter over the platforms. Commuters<br />
access the platforms by lifts, stairs or escalators and there is shelter, seating, lighting and signage along the entire 180m<br />
length of platform. A ticket office where customers can purchase multiple tickets or monthly passes is housed on the<br />
concourse and CCTV cameras and help points are situated throughout for the safety of customers. <strong>The</strong> redevelopment<br />
has also improved connections between the station and its surrounding commercial and residential areas, with entrances<br />
from a new square off Broadway, the Remuera Road Link Bridge and a bridge from Joseph Banks Terrace.<br />
In addition to the new station, KiwiRail completed a complex new track layout at Newmarket Junction, where the key<br />
Southern and Western lines intersect. <strong>The</strong> new station has twin island platforms with three tracks. Direct connections<br />
40
etween Newmarket, the Western Line and Britomart provide flexible services in every direction. Brand new, insulated rail<br />
signals have been installed, which are fully enabled for electrification and provide a greater level of reliability.<br />
<strong>The</strong> two-year rebuild required major works in a tightly confined and busy space. Work began in earnest in August 2008.<br />
By Christmas, the first milestone was reached. Crews worked night and day for three weeks, relaying tracks and the<br />
foundations for the new 65-metre long Remuera Road Link Bridge. <strong>The</strong> bridge now connects the Remuera Road Entrance<br />
to the station concourse. Dramatic steel portals frame the bridge creating a sense of enclosure. Vertical glazed screens<br />
to both sides provide security and weather screening, while a full width solid roof provides additional shelter.<br />
Partners: KiwiRail, <strong>Auckland</strong> City Council, <strong>ARTA</strong>, ARC, Newmarket Business Association<br />
Design: Opus International Consultants<br />
Construction: Hawkins Construction<br />
Length of the building: 37 metres<br />
Around 3,500 people catch the train to or from Newmarket on a daily basis; by 2016 we expect 17,000 people will do so. <strong>The</strong> new station has been<br />
futureproofed for electrification, to accommodate overhead cables. Its focal point is a 1,000m 2 concourse, constructed 5m above the tracks.<br />
Customers converge from four entrances to access the escalators, lifts or stairs to the four 180m-long platforms.<br />
41
Our people<br />
<strong>ARTA</strong> has had a very diverse workforce. Beginning in <strong>2004</strong> with around 40 staff transferring from the ARC, the<br />
number of employees has grown to around 115, with representation from many parts of the world. <strong>The</strong> people employed<br />
by <strong>ARTA</strong> are primarily at a professional level including rolling stock engineers, planners and account managers. <strong>The</strong> rest<br />
of the organisation has been made up of skilled staff across all other areas such as finance, organisational development,<br />
administration, marketing, communications and media.<br />
<strong>The</strong> <strong>ARTA</strong> Board was appointed in July <strong>2004</strong>. <strong>The</strong> directors were selected by a 15-member appointments panel, which<br />
included five ARC councillors, a representative from each of the local councils and three external representatives. A firm<br />
of external recruitment consultants assisted in selecting candidates for the appointment process.<br />
Directors<br />
Dates<br />
Directors<br />
Dates<br />
Brian Roche<br />
<strong>2004</strong> – 2007 Chair<br />
Tony Parsons <strong>2004</strong> – 2007<br />
Ted van Arkel <strong>2004</strong> – 2007<br />
Richard Waddel <strong>2004</strong> – 2007<br />
Professor Peter Brothers <strong>2004</strong> – <strong>2010</strong><br />
Gary Taylor <strong>2004</strong> – <strong>2010</strong><br />
Mike Williams <strong>2004</strong> – <strong>2010</strong><br />
Adrienne Young-Cooper <strong>2004</strong> – <strong>2010</strong><br />
Mark Benjamin 2007 – 1 July <strong>2010</strong><br />
Andrew Buxton 2007 – 1 July <strong>2010</strong><br />
Mark Ford<br />
2007 – 2009 Chair<br />
Tony Marks 2007 – 1 July <strong>2010</strong><br />
Rabin Rabindran <strong>2004</strong> – <strong>2010</strong><br />
2009 – <strong>2010</strong> Chair<br />
Board profiles<br />
Rabin Rabindran<br />
BOARD CHAIR<br />
Rabin Rabindran is a commercial barrister and international legal consultant specialising in infrastructure development,<br />
construction and energy. He has worked on major projects in more than 25 countries acting for governments, local<br />
authorities and major corporates. He is a director of Manukau Water Limited, Tomorrow’s Manukau Properties Limited, TMPL<br />
(Flat Bush) Limited and a company with interests in China. Rabin is also chairman of the Rugby World Cup Regional Trust<br />
Forum, Singapore Chapter of the ASEAN New Zealand Combined Business Council and a trustee of the Chinese Language<br />
Foundation. He was previously a partner at Simpson Grierson and a director of an Australian public company. Rabin has been<br />
appointed as a director of <strong>Auckland</strong> <strong>Transport</strong>.<br />
Adrienne Young-Cooper<br />
DEPUTY CHAIR<br />
Adrienne Young-Cooper is a professional planning consultancy director. She was a founding shareholder of Hill Young Cooper<br />
Limited. She was an inaugural director of <strong>Auckland</strong> Regional <strong>Transport</strong> Networks Limited, and took special responsibility for<br />
the commissioning of the Britomart <strong>Transport</strong> Centre. She sits on the boards of Solid Energy New Zealand Limited, Maritime<br />
New Zealand, Housing New Zealand Corporation, Hobsonville Land Company and the <strong>Auckland</strong> City Property Enterprise<br />
Board. Adrienne is also a trustee of several charitable organisations. Adrienne has been appointed deputy chair of the new<br />
<strong>Auckland</strong> Waterfront Development Agency Limited.<br />
Gary Taylor<br />
Gary Taylor is an experienced company director and environmental policy analyst. He is currently chairman of the Environmental<br />
Defence Society, the Climate Change and Business Centre and is also a director of the Hobsonville Land Company.<br />
42
Professor Peter Brothers<br />
Peter Brothers is chief executive of Manukau Institute of Technology. He was previously Dean of Engineering at the University<br />
of <strong>Auckland</strong>, holding that position for nine years. His career began with what was then the DSIR (Department of Scientific and<br />
Industrial Research), later spending 20 years in the United States in both public and private sector infrastructure roles. Peter<br />
was formerly a director of <strong>Auckland</strong> Regional <strong>Transport</strong> Network Limited (ARTNL) and of UniServices Limited, the University<br />
of <strong>Auckland</strong>’s intellectual property company, and is a director of Metrowater.<br />
Mike Williams<br />
Mike Williams is a director of Sustainable Power Technologies Limited, the CEO of Stellar Trust and a trustee of Waitakere<br />
Enterprise.<br />
Previous directors<br />
Mark Benjamin<br />
Mark Benjamin is the chief financial officer of the Contract Resources group of companies. He has previously held senior<br />
financial and operational management roles within the agricultural and infrastructure industries, and prior to that worked<br />
at Price Waterhouse internationally. In addition he provides consulting and director services to small businesses, start-up<br />
businesses and not-for-profit entities.<br />
Tony Marks<br />
Tony Marks worked in marketing for major food companies in England, the United States and Venezuela before coming to<br />
New Zealand in 1978. Over the next 30 years, he has held senior management positions at Carter Holt Harvey, was general<br />
manager Sales and Marketing at Air New Zealand for 10 years, CEO of Zespri International for four years. Prior to retiring from<br />
corporate life in 2006, he was the inaugural CEO of Pacific Blue Airlines, the international arm of Virgin Blue Airlines. He now<br />
holds a number of directorships in food, aviation, travel and engineering companies.<br />
Andrew Buxton<br />
Andrew Buxton is general manager Systems, Logistics and Strategy Deployment for <strong>The</strong> Warehouse Stationery. He has<br />
previously held senior executive roles in retail and consulting in NZ, Asia and the UK, and has led successful start-up<br />
companies. Currently he is a director of a category management business (Complete Entertainment Services Ltd), a small<br />
consulting company (MH Group Ltd), a global standards organisation (GS1 NZ) and a global charity (UNICEF NZ).<br />
43
Mark Ford<br />
Mark Ford was CEO of Watercare Services, a position he took up in 1994. Prior to that he was chief executive of the New<br />
Zealand Forestry Corporation and the <strong>Auckland</strong> Regional Services Trust, and managing director of New Zealand Timberlands<br />
Ltd. <strong>The</strong>se positions followed a career in Europe and the USA in the petroleum industry. A former chair of the Energy<br />
Efficiency and Conservation Authority and deputy chair of the New Zealand Business Council for Sustainable Development,<br />
Mark was also a commissioner with the Gambling Commission during his term as an <strong>ARTA</strong> director. He is now chair of the<br />
<strong>Auckland</strong> Transition Agency, and will chair <strong>Auckland</strong> <strong>Transport</strong>’s directors.<br />
Brian Roche<br />
Brian Roche was a partner in PriceWaterhouse Coopers when he took up his role as first chair of <strong>ARTA</strong>. He was a former<br />
chief executive of Housing New Zealand Corporation, chief executive of the Crown company Monitoring and Advisory Unit in<br />
Treasury, and a chief negotiator for the Crown in the Ngai Tahu treaty settlement. He is now chief executive of New Zealand<br />
Post Group.<br />
Ted van Arkel<br />
Ted van Arkel had retired from his position as managing director of Progressive Enterprises when he joined <strong>ARTA</strong>, as part of<br />
a shift to becoming a full-time independent director. Other directorships included the <strong>Auckland</strong> Chamber of Commerce and<br />
<strong>Auckland</strong> Retailers Association. He was a council member, and now chair of Unitec Council.<br />
Richard Waddel<br />
Richard Waddel was a partner with Ernst & Young when he joined <strong>ARTA</strong>, and was the company’s CEO for 11 years. He was<br />
chairman of Pharmac, <strong>Auckland</strong> Festival Trust and a director of Aotea Centre Board of Management. Also a past member of<br />
Infrastructure <strong>Auckland</strong>, director of <strong>Auckland</strong> City’s <strong>The</strong> Edge® and chair of the <strong>Auckland</strong> District Health Board.<br />
Tony Parsons<br />
Tony Parsons was a civil engineer with more than 40 years’ experience in the construction industry, including major railway<br />
and roading projects. A former director of ARTNL, he was an advisor to Transit NZ on project viability and was project<br />
manager for Watercare’s Mangere treatment plant upgrade.<br />
Chief executives<br />
Alan Thompson was appointed CEO November <strong>2004</strong>. He had been CE of the Department of Urban Services for the<br />
Australian Capital Territory for the previous six years. When he left to take up the role of Secretary of <strong>Transport</strong> at the Ministry<br />
of <strong>Transport</strong> in 2006, he was replaced by Fergus Gammie, who has remained in the role through to the establishment of<br />
<strong>Auckland</strong> <strong>Transport</strong>.<br />
<strong>ARTA</strong>’s executive team (from left)<br />
Fergus Gammie<br />
Stephen Smith<br />
Mark Lambert<br />
Allen Bufton<br />
Shelley Watson<br />
Peter Clark<br />
Chief executive<br />
General manager, Corporate Services<br />
General manager, Customer Services<br />
Acting general manager, Project Delivery<br />
General manager, Marketing and<br />
Communications<br />
General manager, Strategy and Planning<br />
44
Walking the talk<br />
Over two-thirds of <strong>ARTA</strong> employees walk, cycle or take public transport to work, compared with only 12% of<br />
<strong>Auckland</strong>ers as a whole. Many also walk to and from meetings in the city. This outcome has been driven primarily by the<br />
organisational culture and a strong sense of social responsibility. <strong>ARTA</strong> has provided lockers and showers, plus a pool of<br />
bicycles for traveling to local meetings.<br />
In <strong>2010</strong>, as part of a calendar of sustainable transport events, <strong>ARTA</strong> employees have taken to wearing a pedometer and<br />
committing to 10,000 steps a day. <strong>The</strong> results have been posted daily on the staff noticeboard.<br />
Walking the talk<br />
69% <strong>ARTA</strong> Staff travelling sustainably<br />
Cycling 4%, Walking 11%, Public <strong>Transport</strong> 38%,<br />
Carpooling 16%, this includes being a passenger<br />
or sharing a ride with a member of your household<br />
24% Drove alone<br />
3% Came by motorcycle or scooter<br />
1% Worked from home on these days<br />
3% Other<br />
Ninety staff participated in the July 2009 survey on travel to work, an 80% response rate. Results show that<br />
69% travel to work by a sustainable means (cycling, walking, public transport or carpooling). That’s a five percent<br />
increase from 2007. In 2007 only 12% of <strong>Auckland</strong>ers as a whole used sustainable means of travel.<br />
45
<strong>The</strong> journey ahead for transport<br />
<strong>The</strong> <strong>Auckland</strong> Council<br />
In October 2007, a Royal Commission was established to report to the Government on restructuring the way<br />
<strong>Auckland</strong> is governed. Concerns were growing that local government arrangements in <strong>Auckland</strong> were not meeting the<br />
challenges of urban growth. How <strong>Auckland</strong>’s transport needs are best delivered has been widely debated as part of the<br />
new <strong>Auckland</strong> Council structure. <strong>ARTA</strong>’s submission to the Royal Commission noted a lack of coordination and ongoing<br />
capacity in <strong>Auckland</strong>’s transport system. It proposed a model that enabled coordinated delivery of regional transport<br />
services without superseding individual agencies’ statutory responsibilities.<br />
When the Commission released its report in March 2009, it proposed to replace <strong>ARTA</strong> with a new regional transport<br />
authority, a council-controlled organisation reporting to the <strong>Auckland</strong> Council. It would work in partnership with the NZ<br />
<strong>Transport</strong> Agency and KiwiRail and be responsible for regional transport and arterial roads.<br />
By 23 May 2009, the Local Government (Tamaki Makaurau Reorganisation) Act 2009 was passed. <strong>The</strong> Act made some<br />
controversial changes to the Commission’s recommendations. An <strong>Auckland</strong> Transition Authority (ATA) was formed to<br />
effect the changes required in time for the <strong>2010</strong> local government elections.<br />
<strong>Auckland</strong> <strong>Transport</strong><br />
<strong>The</strong> new structure for transport planning, funding and delivery was confirmed in May <strong>2010</strong>. <strong>Auckland</strong> <strong>Transport</strong><br />
amalgamates the transport roles of <strong>ARTA</strong>, the ARC and the region’s seven local authorities. <strong>The</strong> CCO will be responsible<br />
for spending more than half of <strong>Auckland</strong>’s $1.3 billion rates income to manage every aspect from major infrastructure<br />
projects such as the CBD Rail Loop to parking and fixing broken footpaths and potholes.<br />
<strong>Auckland</strong> <strong>Transport</strong> will deliver a more cohesive governance model for transport funding, reducing the number of agencies<br />
involved in funding decisions from eight to one and the time taken to evaluate and process funding applications. It will<br />
increase the efficiency of delivering on community needs. This model for transport offers possibilities to further investigate<br />
alternative sources of funding.<br />
<strong>The</strong>se might include:<br />
q<br />
q<br />
q<br />
q<br />
q<br />
Tolls on individual parts of the roading network<br />
Public private partnerships to finance infrastructure investments, including the competitive tensions of the PPP<br />
procurement process<br />
Land use value capture, which captures the increase in land values around fixed-route public transport<br />
systems, e.g. the underground CBD rail loop, benefiting both transport sponsors and contributing developers<br />
Making better use of <strong>Auckland</strong>’s accumulated public income-earning assets by polling them<br />
Financial instruments such as infrastructure bonds or other forms of debt.<br />
A more consolidated budget may provide the opportunity to establish a small risk fund to effectively trial a few of the<br />
innovative ideas <strong>ARTA</strong> has received for growing patronage of public transport.<br />
<strong>The</strong> primary strategy and planning documents <strong>Auckland</strong> <strong>Transport</strong> will inherit are the Regional Land <strong>Transport</strong> Strategy<br />
<strong>2010</strong> and the <strong>Auckland</strong> <strong>Transport</strong> Plan 2009. <strong>The</strong>se guiding documents form the backbone for continuing to move<br />
46
<strong>Auckland</strong> forward, with planning aligned to broader land use, and economic, social and environmental objectives. At<br />
just over halfway through the 10 years of the RLTS 2005 and <strong>ARTA</strong>’s first substantial planning documents, this legacy<br />
document demonstrates the substantial progress, and in many cases completion, of the major projects <strong>ARTA</strong> set out<br />
to achieve. Over the past six years, <strong>Auckland</strong> has gained a more resilient backbone in its Rapid Transit Network of the<br />
Northern Busway and rail connections, and the beginnings of more sustainable choices of transport. Satisfaction with,<br />
and use of public transport, has reached record levels.<br />
<strong>The</strong>re is still crucial work to be done in integrating the region’s transport network, both within the region and inter-regionally<br />
from Northland through to Waikato. <strong>Auckland</strong> <strong>Transport</strong> will continue to have challenges in meeting regional goals and<br />
objectives but it inherits milestone successes which we, as a team, have been committed to achieving.<br />
<strong>Auckland</strong> <strong>Transport</strong> will begin operating on 1 November <strong>2010</strong>, almost six years exactly after <strong>ARTA</strong> was formed to plan, fund and develop<br />
<strong>Auckland</strong>’s transport system of roads, rail, buses and ferries into one that is world-class, safe, responsive and sustainable.<br />
47
Appendices<br />
Appendix A: Summary of capital works expenditure/assets and sources of funding<br />
<strong>ARTA</strong>’s operating and capital expenditure has been jointly funded by the ARC (from rates and regional investment funds<br />
held by <strong>Auckland</strong> Regional Holdings) and by the New Zealand <strong>Transport</strong> Agency through the Land <strong>Transport</strong> New Zealand<br />
fund.<br />
Capital project/assets Cost to Original Funding source split<br />
30 April <strong>2010</strong> forecast<br />
($m)<br />
[revised] ($m)<br />
Rolling stock, train sets SA15-23 91.8 104 ARC<br />
Rolling stock ADK refurbishment 13.56 15.5 ARC<br />
Rolling stock 2005-07 94.35 - ARC<br />
Rolling stock renewals 2007-10 8.8 13.27 ARC<br />
Western Line duplication stages 2-5 10.82 12.6 stages 2&4 ARC<br />
stages 3&5 first<br />
$462k 100% ARC<br />
then balance 60%<br />
NZTA; 40% ARC<br />
Newmarket remodelling 35.6 35.6 $20m ARC funded<br />
Final $15.6m 60%<br />
NZTA; 40% ARC<br />
Manukau Rail Link 1.14 15.2 First $400k ARC,<br />
balance 60% NZTA;<br />
40% ARC<br />
Onehunga (DART 19) .83 4.1 60% NZTA; 40% ARC<br />
New Lynn Station 9.04 15.97 60% NZTA; 40% ARC<br />
Kingsland enhancement (RWC) 3.22 6.02 60% NZTA; 40% ARC<br />
Rail station upgrades 9.66 10.5 ARC<br />
Electrification of trains 1 - 496.3 Crown<br />
Real time information – total across modes 9.27 15.64 53% NZTA; 47% ARC<br />
Single integrated ticket 13.92 58.25 $20m for central<br />
system NZTA<br />
Remaining $38.25m<br />
60% NZTA; 40% <strong>ARTA</strong><br />
Downtown Ferry Terminal upgrade – stage 1 5.52 6.0 53% NZTA; 47% ARC<br />
Birkenhead ferry terminal upgrade 1.91 2.73 60% NZTA; 40% ARC<br />
Northern Busway 10.0 10.0 ARC<br />
Note<br />
1. Project moved to KiwiRail<br />
48
Appendix B: Indicative capital expenditure to 2019<br />
Indicative expenditure 2008/09 to 2018/19 ($b)<br />
2009 - 2011<br />
2012 - 2014<br />
2015 - 2019<br />
<strong>Transport</strong> planning 33,516,772 29,894,251 39,369,060<br />
Walking and cycling 187,646,972 210,689,391 156,178,763<br />
Demand management 49,557,252 50,969,361 61,292,599<br />
Passenger transport infrastructure 709,974,587 297,025,780 87,452,616<br />
Local road renewal and maintenance 764,730,964 811,323,264 1,159,938,708<br />
New and improved local roads 902,726,830 479,892,413 800,778,823<br />
Public transport services 788,873,031 862,193,772 1,145,565,485<br />
State highway renewals and maintenance 290,283,606 347,916,667 550,000,000<br />
New and improved state highways 952,118,132 900,000,000 900,000,000<br />
Rail infrastructure 888,235,993 668,568,109 60,000,000<br />
TOTALS: 5,567,664,139 4,658,473,008 4,960,576,054<br />
GRAND TOTAL: 15,186,713,201<br />
Appendix C: <strong>ARTA</strong>’s stakeholders and project partners<br />
Stakeholder<br />
Customers<br />
Shareholder (ARC)<br />
Territorial authorities<br />
Central government<br />
Relationship<br />
On a day-to-day basis, <strong>ARTA</strong> has planned and funded public transport,<br />
promoted alternative ways to get around <strong>Auckland</strong>, and coordinated and<br />
integrated transport across the region on behalf of <strong>Auckland</strong>ers<br />
<strong>The</strong> ARC has been <strong>ARTA</strong>’s sole shareholder. It has provided bulk<br />
funding on an annual basis for <strong>ARTA</strong>’s activities, and for the<br />
region’s new train stations and ferry wharves.<br />
<strong>The</strong> seven territorial authorities (to October <strong>2010</strong>) have been responsible for<br />
maintaining the roads in their areas. <strong>ARTA</strong> has provided advice on how their<br />
plans fit with regional objectives.<br />
<strong>The</strong> Ministry of <strong>Transport</strong> has undertaken reviews of <strong>Auckland</strong>’s transport<br />
capabilities and guides the development of futuren strategies nationwide.<br />
<strong>The</strong> ministries of Economic Development, Education, Environment, Treasury<br />
and Health, NZ Police and the Accident Compensation Corporation are also<br />
involved. Central government also directly funds KiwiRail.<br />
49
Stakeholder<br />
Relationship<br />
New Zealand <strong>Transport</strong><br />
Agency (NZTA)<br />
KiwiRail<br />
Service operators<br />
Employees<br />
<strong>Auckland</strong> Regional <strong>Transport</strong><br />
Network Limited (ARTNL)<br />
Community<br />
NZTA was established in August 2008 by merging Land <strong>Transport</strong> New<br />
Zealand with Transit New Zealand. NZTA is responsible for allocating transport<br />
funding on behalf of the Government. NZTA also owns and manages the state<br />
national highway network. In the <strong>Auckland</strong> region, <strong>ARTA</strong> has worked<br />
closely with NZTA to establish regional priorities for funding.<br />
In July 2008, the Government took over the assets of former private operator<br />
Toll Rail and created KiwiRail. KiwiRail also incorporated ONTRACK, which had<br />
maintained and improved the rail network in <strong>Auckland</strong> and controlled the<br />
operation of trains on the network. ONTRACK became KiwiRail Network.<br />
KiwiRail is also responsible for the mechanical maintenance of <strong>Auckland</strong>’s<br />
rolling stock and for purchasing new electric trains. KiwiRail reports to the New<br />
Zealand Railways Corporation Board.<br />
A wide range of transport operators supply bus, train and ferry services. While<br />
relationships with <strong>ARTA</strong> have been defined by tendered contracts, <strong>ARTA</strong> has<br />
also worked collaboratively with operators to improve customers’ experiences<br />
of using the network.<br />
<strong>ARTA</strong>’s staff have been key to achieving the organisation’s goals.<br />
Set up by <strong>Auckland</strong>’s territorial authorities to own and maintain the rail stations<br />
and maintain ferry infrastructure, ARTNL’s assets were transferred to <strong>ARTA</strong> in<br />
October 2007, by an Order In Council.<br />
<strong>ARTA</strong> has played an important role in maintaining and improving the quality<br />
of life in our community by having an overall, multi-modal regional view of<br />
transport priorities that is unconstrained by territorial boundaries.<br />
A number of voluntary organisations within the community, e.g. Campaign for<br />
Better <strong>Transport</strong>, act as public watchdogs for transport issues in <strong>Auckland</strong>.<br />
Brian Rudman of the New Zealand Herald has been a long-time commentator.<br />
50
New Lynn Station, will become a landmark for Waitakere City and the western region, symbolising the large investment in infrastructure which<br />
has transformed <strong>Auckland</strong>’s public transport.<br />
51
Vision for transport in <strong>Auckland</strong><br />
2011<br />
n<br />
Rugby World Cup sees 75% of ticket-holders get to matches using public transport, taxis or on<br />
foot<br />
2012 onwards (projects within the Regional Land <strong>Transport</strong> Strategy <strong>2010</strong>-2040)<br />
n Purchase electric trains and electrify rail lines (KiwiRail 2015)<br />
n Integrated smartcard ticket (supplier contracted December 2009, in place by 2012)<br />
n Construct rail to the airport (2031-2040)<br />
n Improve airport road access (2021-2030)<br />
n Construct the Avondale-Southdown rail connection (2031-2040)<br />
n<br />
Complete the Western Ring Route connecting State Highway 1 from Manukau through Waterview<br />
and Hobsonville to Albany, as a complete alternative route from south to north (construction<br />
under way, completion by 2016)<br />
n Complete the regional cycle network (50% completed by 2016)<br />
n<br />
Build an additional Waitemata Harbour Crossing<br />
n Complete the multi-modal <strong>Auckland</strong>-Manukau Eastern <strong>Transport</strong> Initiative (AMETI) (2021-2030)<br />
n<br />
Construct the CBD Loop Tunnel (preferred route chosen March <strong>2010</strong>, construction<br />
by 2021)<br />
n Extend the Northern Busway to Redvale (2021-2030) and Redvale to Orewa (2031-2040)<br />
n<br />
n<br />
n<br />
n<br />
Construct a northbound tunnel beneath Victoria Park to increase the capacity of the Northern<br />
Motorway between the <strong>Auckland</strong> Harbour Bridge and Wellington Street (construction began<br />
November 09. Expected completion by April 2012)<br />
Replace Newmarket Viaduct with a new structure that will add a fourth southbound lane on the<br />
motorway between Gillies Avenue and Greenlane (construction under way)<br />
Develop the Panmure-Botany-Manukau bus connection as a QTN, with upgrade to RTN<br />
in 2021-2030<br />
Develop the Henderson-Westgate-Albany bus connection as a QTN<br />
52
In 2009, Pine Harbour and West Harbour ferry trips increased over 2008 by 20% and 24% respectively. <strong>ARTA</strong> subsidises these services, which enabled both ferry<br />
operators to purchase an additional vessel and increase the number of weekday trips.<br />
53