The ARTA Years 2004 â 2010 - Auckland Transport
The ARTA Years 2004 â 2010 - Auckland Transport
The ARTA Years 2004 â 2010 - Auckland Transport

You also want an ePaper? Increase the reach of your titles
YUMPU automatically turns print PDFs into web optimized ePapers that Google loves.
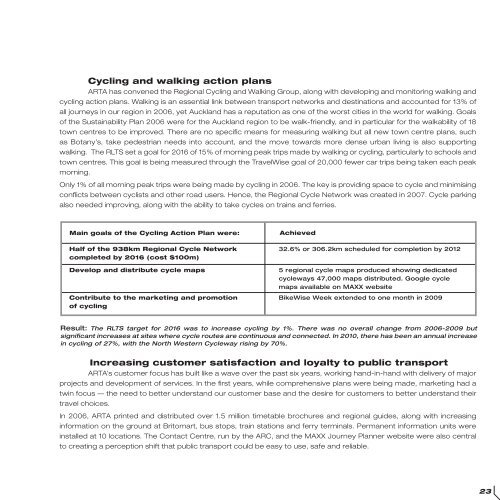
Cycling and walking action plans<br />
<strong>ARTA</strong> has convened the Regional Cycling and Walking Group, along with developing and monitoring walking and<br />
cycling action plans. Walking is an essential link between transport networks and destinations and accounted for 13% of<br />
all journeys in our region in 2006, yet <strong>Auckland</strong> has a reputation as one of the worst cities in the world for walking. Goals<br />
of the Sustainability Plan 2006 were for the <strong>Auckland</strong> region to be walk-friendly, and in particular for the walkability of 18<br />
town centres to be improved. <strong>The</strong>re are no specific means for measuring walking but all new town centre plans, such<br />
as Botany’s, take pedestrian needs into account, and the move towards more dense urban living is also supporting<br />
walking. <strong>The</strong> RLTS set a goal for 2016 of 15% of morning peak trips made by walking or cycling, particularly to schools and<br />
town centres. This goal is being measured through the TravelWise goal of 20,000 fewer car trips being taken each peak<br />
morning.<br />
Only 1% of all morning peak trips were being made by cycling in 2006. <strong>The</strong> key is providing space to cycle and minimising<br />
conflicts between cyclists and other road users. Hence, the Regional Cycle Network was created in 2007. Cycle parking<br />
also needed improving, along with the ability to take cycles on trains and ferries.<br />
Main goals of the Cycling Action Plan were:<br />
Achieved<br />
Half of the 938km Regional Cycle Network 32.6% or 306.2km scheduled for completion by 2012<br />
completed by 2016 (cost $100m)<br />
Develop and distribute cycle maps<br />
5 regional cycle maps produced showing dedicated<br />
cycleways 47,000 maps distributed. Google cycle<br />
maps available on MAXX website<br />
Contribute to the marketing and promotion BikeWise Week extended to one month in 2009<br />
of cycling<br />
Result: <strong>The</strong> RLTS target for 2016 was to increase cycling by 1%. <strong>The</strong>re was no overall change from 2006-2009 but<br />
significant increases at sites where cycle routes are continuous and connected. In <strong>2010</strong>, there has been an annual increase<br />
in cycling of 27%, with the North Western Cycleway rising by 70%.<br />
Increasing customer satisfaction and loyalty to public transport<br />
<strong>ARTA</strong>’s customer focus has built like a wave over the past six years, working hand-in-hand with delivery of major<br />
projects and development of services. In the first years, while comprehensive plans were being made, marketing had a<br />
twin focus — the need to better understand our customer base and the desire for customers to better understand their<br />
travel choices.<br />
In 2006, <strong>ARTA</strong> printed and distributed over 1.5 million timetable brochures and regional guides, along with increasing<br />
information on the ground at Britomart, bus stops, train stations and ferry terminals. Permanent information units were<br />
installed at 10 locations. <strong>The</strong> Contact Centre, run by the ARC, and the MAXX Journey Planner website were also central<br />
to creating a perception shift that public transport could be easy to use, safe and reliable.<br />
23