The ARTA Years 2004 â 2010 - Auckland Transport
The ARTA Years 2004 â 2010 - Auckland Transport
The ARTA Years 2004 â 2010 - Auckland Transport

Create successful ePaper yourself
Turn your PDF publications into a flip-book with our unique Google optimized e-Paper software.
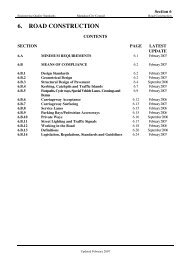
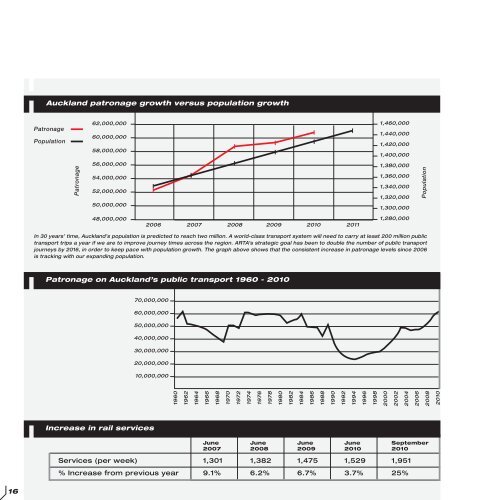
<strong>Auckland</strong> patronage growth versus population growth<br />
Patronage<br />
Population<br />
62,000,000<br />
60,000,000<br />
58,000,000<br />
1,460,000<br />
1,440,000<br />
1,420,000<br />
1,400,000<br />
Patronage<br />
56,000,000<br />
54,000,000<br />
52,000,000<br />
50,000,000<br />
2006 2007 2008 2009 <strong>2010</strong> 2011<br />
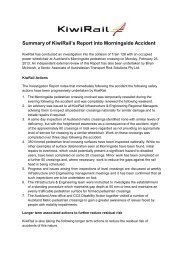
Patronage on <strong>Auckland</strong>’s public transport 1960 - <strong>2010</strong><br />
70,000,000<br />
60,000,000<br />
50,000,000<br />
40,000,000<br />
30,000,000<br />
20,000,000<br />
10,000,000<br />
1960<br />
1962<br />
1964<br />
1966<br />
1968<br />
1970<br />
1972<br />
1974<br />
1976<br />
1978<br />
1980<br />
1982<br />
1984<br />
1986<br />
1988<br />
1990<br />
1992<br />
1994<br />
1996<br />
1998<br />
2000<br />
2002<br />
<strong>2004</strong><br />
2006<br />
2008<br />
<strong>2010</strong><br />
1,380,000<br />
1,360,000<br />
1,340,000<br />
1,320,000<br />
1,300,000<br />
Population<br />
48,000,000<br />
1,280,000<br />
In 30 years’ time, <strong>Auckland</strong>’s population is predicted to reach two million. A world-class transport system will need to carry at least 200 million public<br />
transport trips a year if we are to improve journey times across the region. <strong>ARTA</strong>’s strategic goal has been to double the number of public transport<br />
journeys by 2016, in order to keep pace with population growth. <strong>The</strong> graph above shows that the consistent increase in patronage levels since 2006<br />
is tracking with our expanding population.<br />
Increase in rail services<br />
June<br />
2007<br />
June<br />
2008<br />
June<br />
2009<br />
June<br />
<strong>2010</strong><br />
September<br />
<strong>2010</strong><br />
Services (per week) 1,301 1,382 1,475 1,529 1,951<br />
% Increase from previous year 9.1% 6.2% 6.7% 3.7% 25%<br />
16