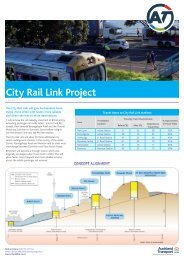
The ARTA Years 2004 â 2010 - Auckland Transport
The ARTA Years 2004 â 2010 - Auckland Transport
The ARTA Years 2004 â 2010 - Auckland Transport

You also want an ePaper? Increase the reach of your titles
YUMPU automatically turns print PDFs into web optimized ePapers that Google loves.
Challenges and opportunities<br />
Industrial action and fare increases<br />
Patronage of <strong>Auckland</strong>’s buses had been steadily growing since the mid 1990s, peaking in 2003 at over 46<br />
million boardings. In May 2005, Stagecoach drivers went out on strike for a week in demand of better pay and working<br />
conditions. Stagecoach was receiving $35 million a year in subsidies to run its bus services in <strong>Auckland</strong>. While most<br />
<strong>Auckland</strong>ers were sympathetic towards the drivers, patronage on the buses fell quite dramatically in the second half of<br />
2005, down almost two million on the previous year. It took until March 2006 before patronage levels regained their 2003<br />
level, doubly hit by a 10% increase in bus fares in October 2005.<br />
Again in September and October 2009, a lock-out by NZ bus of 900 drivers and cleaners in its employment meant a week<br />
of disruption to 80,000 commuters and 10,000 school children. Bus patronage fell by 12.9% compared to October 2008<br />
but recovered faster than in 2005. By March <strong>2010</strong>, patronage was up 5% over the March 2009 figures and continued to<br />
climb, reaching 5.8% by May. In June <strong>2010</strong>, fares again increased by 2-3%.<br />
Service punctuality during major infrastructure works<br />
Reliable services underpin growth in public transport patronage. Service punctuality is measured using on-time<br />
running figures and has been a particular challenge for bus and rail services. Rail has suffered primarily from extensive<br />
construction work to tracks and stations, ageing track, signalling and rolling stock, increased patronage slowing boarding<br />
times, and inevitable incidents and accidents during construction. Road congestion has been the key difficulty for bus<br />
service punctuality. A standard measure used in similar cities around the world is five minutes, but <strong>Auckland</strong> was operating<br />
on a ‘within 20 minutes’ measure in <strong>2004</strong>. <strong>The</strong> new July 2005 North Shore bus service upped the ante, with a measure<br />
of arriving within five minutes of scheduled times and <strong>ARTA</strong> sought to have at least 80% of all services arriving within the<br />
same measure.<br />
Punctuality of the rail network dipped sharply from May 2005, due to the bus strike and increased passenger numbers,<br />
but rose again to 90% by November, as bus patronage recovered. In 2008, a lower target of 75% was set for the Western<br />
Line to account for double tracking work, yet 80.8% of services arrived within five minutes of their scheduled time, close<br />
to that of the Southern and Eastern Lines, at 82.8%. A wide range of mainly one-off events led to delays, primarily caused<br />
by signals and points failures. In 2009, delays due to infrastructure faults fell to their lowest level in three years, with<br />
Western Line punctuality rising to 87.8% and the other two lines averaging 84.2%. In <strong>2010</strong>, the Western Line performance<br />
was again affected by major infrastructure works at Newmarket and New Lynn, but has recovered with the completion<br />
of these works.<br />
On the Northern Busway, given dedicated road space, up to 99% of services were reported by their operator to run within<br />
five minutes of schedule.<br />
36