examples of fire engineering design for steel members, using a ...
examples of fire engineering design for steel members, using a ...
examples of fire engineering design for steel members, using a ...

Create successful ePaper yourself
Turn your PDF publications into a flip-book with our unique Google optimized e-Paper software.
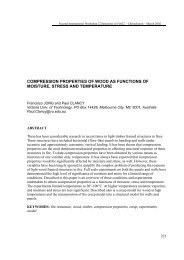
Second International Workshop « Structures in Fire » – Christchurch – March 2002<br />
EXAMPLES OF FIRE ENGINEERING DESIGN FOR STEEL<br />
MEMBERS, USING A STANDARD CURVE VERSUS A NEW<br />
PARAMETRIC CURVE<br />
C R BARNETT<br />
Macdonald Barnett Partners Ltd, Consulting Engineers, Auckland, New Zealand.<br />
cliff@macbar.co.nz<br />
G C CLIFTON<br />
HERA Structural Engineer, HERA, Auckland, New Zealand<br />
structural @hera.org.nz<br />
ABSTRACT<br />
This paper presents <strong>examples</strong> <strong>of</strong> the differences that can occur when a standard timetemperature<br />
curve and a parametric time-temperature curve are used to determine<br />
temperatures likely to be reached by uninsulated and insulated <strong>steel</strong> <strong>members</strong> during a <strong>fire</strong>.<br />
For low and moderate structural <strong>fire</strong> severity situations, determination <strong>of</strong> the adequacy <strong>of</strong> a<br />
<strong>steel</strong> member by comparing the temperature reached in a “<strong>design</strong> <strong>fire</strong>” with the limiting<br />
temperature based on the member heat sink characteristics, extent <strong>of</strong> insulation and utilisation<br />
factor is becoming increasingly common <strong>fire</strong> <strong>engineering</strong> <strong>design</strong> practice. For this it is<br />
important to have as accurate and widely applicable parametric <strong>fire</strong> model as is practicable.<br />
The standard time-temperature curve used in the <strong>examples</strong> is the ISO 834 Curve. The two<br />
parametric time-temperature curves used in the paper are the Eurocode Parametric Curve [1]<br />
and a recently developed one termed the “BFD Curve” [2]. The latter has been found to fit<br />
the results <strong>of</strong> a wide range <strong>of</strong> actual <strong>fire</strong> tests more closely than do existing parametric curves<br />
and is mathematically simpler in <strong>for</strong>m.<br />
The shape <strong>of</strong> the BFD Curve and the parameters used to define it bear a strong relationship to<br />
both the pyrolysis coefficient (R/A v h v 0.5 ) and the opening factor, F 02 . The curve also models<br />
the development <strong>of</strong> <strong>fire</strong> without the need <strong>for</strong> time shifts. It uses a single and relatively simple<br />
equation to generate the temperature <strong>of</strong> both the growth and decay phases <strong>of</strong> a <strong>fire</strong> in a<br />
building and only three factors are required to derive the curve. These factors are (i) the<br />
maximum gas temperature, (ii) the time at which this maximum temperature occurs, and (iii)<br />
a shape constant <strong>for</strong> the curve. If desired, the shape constant can be different on the growth<br />
and the decay sides to model a very wide range <strong>of</strong> natural <strong>fire</strong> conditions and test results.<br />
Other parametric curves such as the current Eurocode Parametric Curve [1] require at least<br />
two relatively complex equations and both seem to have time shifts involved in their original<br />
derivations.<br />
KEYWORDS: Fire <strong>engineering</strong>, <strong>fire</strong> compartment temperatures, structural <strong>fire</strong> <strong>engineering</strong><br />
<strong>design</strong>, <strong>fire</strong> modelling.<br />
381
Second International Workshop « Structures in Fire » – Christchurch – March 2002<br />
INTRODUCTION<br />
For low and moderate structural <strong>fire</strong> severity situations, determination <strong>of</strong> the adequacy <strong>of</strong> a<br />
<strong>steel</strong> member by comparing the temperature reached in a “<strong>design</strong> <strong>fire</strong>” with the limiting<br />
temperature <strong>for</strong> the member is becoming increasingly common <strong>fire</strong> <strong>engineering</strong> <strong>design</strong><br />
practice. More details on this practice and <strong>examples</strong> where it is applied are given in section<br />
1.3 <strong>of</strong> [3].<br />
For applications to enclosures where the fuel can be considered cellulosic in nature and<br />
uni<strong>for</strong>mly distributed over the enclosure area, one <strong>of</strong> the most commonly used natural <strong>design</strong><br />
<strong>fire</strong> curves is the Eurocode Parametric temperature–time curve, given in Appendix A <strong>of</strong><br />
prEN1991-1-2 [1]. Once the <strong>fire</strong> time-temperature curve has been generated, the temperature<br />
rise in a <strong>steel</strong> member can be determined <strong>using</strong> the heat transfer method given in section 3 <strong>of</strong><br />
[1] or section 5.7 <strong>of</strong> the Fire Engineering Design Guide [4]. The adequacy <strong>of</strong> the <strong>steel</strong><br />
member can then be determined in accordance with NZS 3404 [5] Clauses 11.3, 11.4 and<br />
11.5, by determining whether the maximum temperature reached, T max , is less than the<br />
limiting temperature, T l , calculated from Clause 11.5.<br />
The Eurocode Parametric Curve comprises up to three equations <strong>for</strong> the heating side <strong>of</strong> the<br />
curve and one <strong>of</strong> three equations <strong>for</strong> the cooling side. This makes it complex to implement in<br />
a spreadsheet. Furthermore, the decay curve has been found not to well represent the<br />
exponential time-temperature cooling characteristics <strong>of</strong> experimental <strong>fire</strong> tests. The cooling<br />
conditions can be modified to give better agreement with experiments, eg. as presented in the<br />
Modified Eurocode Curves [6], however at the cost <strong>of</strong> adding a further two equations on the<br />
cooling side.<br />
A new parametric natural <strong>fire</strong> curve has been developed that fits the results <strong>of</strong> a wide range <strong>of</strong><br />
natural <strong>fire</strong> tests more closely than do the Eurocode Parametric Curves and is mathematically<br />
simpler in <strong>for</strong>m. It is called the “BFD Curve” and full details <strong>of</strong> its development are given in<br />
[2]. It has been developed from curve fitting to a wide range <strong>of</strong> experimental tests.<br />
The first two sections <strong>of</strong> this paper present the equations describing the BFD Curve and<br />
<strong>examples</strong> <strong>of</strong> its fitting to some natural <strong>fire</strong> tests.<br />
The method <strong>of</strong> limiting <strong>steel</strong> temperature determination to the New Zealand standards (NZS<br />
3404 [5] and NZS 4203 [7]) is then illustrated, through an example involving a <strong>steel</strong> floor<br />
support beam.<br />
This is followed by a check on the adequacy <strong>of</strong> the <strong>steel</strong> floor support beam under the natural<br />
<strong>fire</strong> conditions – first to the Eurocode Parametric Curves [1] and then to the BFD Curve [2].<br />
The purpose <strong>of</strong> these checks is to illustrate the minimum effect that the shape differences<br />
between these two curves has on the temperature reached in an unprotected <strong>steel</strong> beam and a<br />
protected <strong>steel</strong> beam exposed to the two different parametric <strong>fire</strong> curves. For this comparison,<br />
the BFD Curve is fitted as closely as is practicable to the Eurocode Parametric Curve in terms<br />
<strong>of</strong> peak gas temperature and the time from t = 0 at which that peak temperature occurs.<br />
As the BFD Curve [2] is still awaiting <strong>for</strong>mal publication, the timing is opportune to make<br />
some suggestions as to how it might be used to generate <strong>design</strong> <strong>fire</strong>s <strong>for</strong> a range <strong>of</strong> enclosure<br />
conditions in a simple but realistic manner. This is followed by a comparison between the<br />
two temperature-time curves when applied to a given enclosure.<br />
382
Second International Workshop « Structures in Fire » – Christchurch – March 2002<br />
Finally, some general conclusions are given, followed by the acknowledgments and<br />
references.<br />
THE BFD CURVE EQUATIONS<br />
The two basic equations that describe the BFD Curve are:<br />
T g = T a + T m e -z (1)<br />
z = (log e t – log e t m ) 2 /s c (2)<br />
where:<br />
T g = gas temperature at any time t ( o C )<br />
T a = ambient temperature ( o C )<br />
T m = maximum gas temperature generated above T a ( o C )<br />
t = time from start <strong>of</strong> <strong>fire</strong> (mins)<br />
m t = time at which T m occurs (mins)<br />
s c = shape constant <strong>for</strong> the time-temperature curve (-)<br />
In equation 2, the log e is the natural log.<br />
The input parameters <strong>for</strong> the BFD Curve are T m , t m and s c . Detailed guidance on determining<br />
each <strong>of</strong> them is given in [2] and briefly described below.<br />
The maximum temperature, T m , can be derived as specified in [8] and described in section 7.1<br />
<strong>of</strong> [2]. However, analyses <strong>of</strong> a number <strong>of</strong> natural <strong>fire</strong> tests by the authors, eg. [9], and<br />
analyses undertaken as part <strong>of</strong> HERA’s <strong>fire</strong> research programme have shown that the<br />
maximum average temperature reached in a “real” enclosure, with a wide range <strong>of</strong><br />
combustible material, is nearly constant over a range <strong>of</strong> ventilation conditions. Maximum<br />
average gas temperatures have been developed as part <strong>of</strong> implementing the SPM procedure<br />
<strong>for</strong> floor system <strong>design</strong> [10], where they have been used to derive <strong>design</strong> temperatures in<br />
unprotected <strong>steel</strong> beam elements. These average gas temperatures are given in Table 1 and<br />
could be used as T m in the BFD Curve.<br />
Maximum Average<br />
Gas Temperature<br />
FHC 1, NWC 800<br />
FHC 2, NWC 900<br />
FHC 3, NWC 950<br />
FHC 1, LWC 900<br />
FHC 2, LWC 1000<br />
FHC 3, LWC 1050<br />
Table 1 : Possible Values <strong>of</strong> T m <strong>for</strong> the BFD Curve<br />
Notes to Table 1:<br />
1. FHC1, FHC 2 and FHC 3 are as defined by C/AS1 [11]<br />
2. NWC ≡ normal weight concrete; density ≥ 2300 kg/m 3<br />
LWC = light weight concrete; density 1500 – 1900 kg/m 3<br />
383
Second International Workshop « Structures in Fire » – Christchurch – March 2002<br />
Determination <strong>of</strong> t m (the time at which T max occurs) is described in section 7.2 <strong>of</strong> [2]. If a plot<br />
<strong>of</strong> heat release rate Q (MW) versus time is plotted <strong>for</strong> a <strong>fire</strong>, the time t m is the time at which<br />
Q max occurs <strong>for</strong> a fuel surface controlled <strong>fire</strong> or the time at the end <strong>of</strong> the peak heat release<br />
rate plateau <strong>for</strong> a ventilation controlled <strong>fire</strong>.<br />
Barnett [2] also gives two equations <strong>for</strong> calculating t m .<br />
As an alternative, t m can be obtained from the Eurocode EC1-1-2/59 Annex A Parametric<br />
temperature–time curve provisions, where t max is given by equation (A.7) <strong>of</strong> [1]. To obtain<br />
the correct units from that source:<br />
t m = 60 t max (3)<br />
where:<br />
m t<br />
max t<br />
= time <strong>for</strong> input into BFD Curve (mins)<br />
= time from equation (A.7) <strong>of</strong> [1] (hours)<br />
Note also when calculating the opening factor, O, <strong>for</strong> use in [1] that A t = A t1 (surface area <strong>of</strong><br />
enclosure including openings).<br />
The shape constant, s c , has been shown [2] to be a simple relationship between the degree <strong>of</strong><br />
insulation <strong>of</strong> the enclosure, c, and the pyrolysis coefficient, k p . The equation is;<br />
s c = ck p (4)<br />
where:<br />
c = 38 <strong>for</strong> enclosures with minimum insulation (corresponding to k b = 0.045 from<br />
Table 5.1 <strong>of</strong> the FEDG [4] and applying to an enclosure with <strong>steel</strong> sheet ro<strong>of</strong> and walls <strong>of</strong> any<br />
construction).<br />
c = 16 <strong>for</strong> enclosures with maximum typical insulation (corresponding to k b<br />
= 0.09 from [4] and applying to an enclosure with timber floors and plasterboard lined walls<br />
and ceiling)<br />
k p = 1/(148 F 02 + 3.8) (-) (5)<br />
F 02 = A v h 0.5 v / A t2 (m 0.5 ) (6)<br />
A t2 = A t - A v (m 2 ) (7)<br />
A t = total internal surface area <strong>of</strong> enclosure including openings (m 2 )<br />
A v = sum <strong>of</strong> areas <strong>of</strong> vertical openings (m 2 )<br />
h v = weighted mean height <strong>of</strong> vertical openings (m)<br />
For natural <strong>fire</strong>s, s c varies from around 0.5 to 5. The shape constant is a significant variable<br />
and can also be varied between the heating and cooling side, to generate a range <strong>of</strong> curves<br />
from equations (1) and (2) that range from representing a well ventilated natural <strong>fire</strong> to the<br />
ISO 834 standard curve. This makes the <strong>for</strong>mulation a powerful mathematical tool.<br />
There is scope <strong>for</strong> developing a relationship between c and k b <strong>for</strong> the full range <strong>of</strong> insulation<br />
values typically encountered in practice. To date this has not been done, however <strong>for</strong> an<br />
enclosure with NWC floors and ro<strong>of</strong>, corresponding to k b = 0.065 from Table 5.1 <strong>of</strong> [4], c =<br />
25 provides a suitable answer.<br />
384
Second International Workshop « Structures in Fire » – Christchurch – March 2002<br />
FITTED EXAMPLES OF THE BFD CURVE TO FIRE TEST RESULTS<br />
General<br />
In developing the BFD Curve <strong>for</strong>mulation, Barnett [2] has fitted the curve to a wide range <strong>of</strong><br />
natural <strong>fire</strong> tests; ranging from car <strong>fire</strong>s, through enclosure <strong>fire</strong>s with a range <strong>of</strong> fuels and<br />
enclosure materials <strong>of</strong> construction, to the Cardington large enclosure tests [12]. (These latter<br />
tests were undertaken to determine the appropriateness <strong>of</strong> the equivalent time <strong>of</strong> <strong>fire</strong> exposure<br />
provisions in Annex D <strong>of</strong> [1]). While a wide range <strong>of</strong> these results are presented in [2]; only<br />
two sets are given below.<br />
CIB/W14 Temperature–Time Curves<br />
During the period 1964-1974, 321 experiments were carried out and the results were<br />
summarised by Thomas and Heselden [13]. Out <strong>of</strong> these 321 experiments, temperature-time<br />
in<strong>for</strong>mation was provided therein <strong>for</strong> only four <strong>of</strong> the tests.<br />
BFD Curves have been fitted to these four tests. Figs.1(a) and 1(b) below are the results<br />
taken from Figs. 2 and 3 <strong>of</strong> [13]. As can be seen, the BFD agreement is good.<br />
TEMPERATURE in C<br />
1400<br />
1200<br />
1000<br />
800<br />
600<br />
400<br />
200<br />
0<br />
Test<br />
Data<br />
BFD<br />
Curve<br />
ISO<br />
Curve<br />
0 10 20 30 40<br />
TEMPERATURE in C<br />
1400<br />
1200<br />
1000<br />
800<br />
600<br />
400<br />
200<br />
0<br />
Test Data<br />
BFD Curve<br />
ISO Curve<br />
0 10 20 30 40<br />
TIME in minutes<br />
TI ME i n mi nutes<br />
(a) Ref [13] Fig. 2 (b) Ref [13] Fig. 3<br />
FIGURE 1: BFD Curves Fitted to CIB/W14 Temperature-time Curves<br />
CTICM Temperature-Time Curves<br />
Ref. [14] describes 44 <strong>fire</strong> tests <strong>for</strong> both insulated and non-insulated <strong>fire</strong> compartments, BFD<br />
curves were fitted to these and graded <strong>for</strong> fit. Six tests were rated as Category 1 (excellent<br />
fit), 15 tests as Category 2 (very good), and 15 tests as Category 3 (satisfactory). In all cases<br />
where the <strong>fire</strong> burnt in a near uni<strong>for</strong>m manner throughout the enclosure, the fit was very good<br />
or excellent. The eight cases where the fit was poor were tests where the behaviour <strong>of</strong> the <strong>fire</strong><br />
was markedly non-uni<strong>for</strong>m. In such instances the fit between any parametric curve and the<br />
experimental <strong>fire</strong> temperature-time curve will not be good. Two <strong>of</strong> the insulated CTICM tests<br />
(tests 35 and 53) rated as Category 1 are illustrated below.<br />
385
Second International Workshop « Structures in Fire » – Christchurch – March 2002<br />
<br />
1400<br />
1200<br />
1000<br />
800<br />
600<br />
400<br />
200<br />
0<br />
Test<br />
Data<br />
BFD<br />
Curve<br />
ISO<br />
Curve<br />
0 10 20 30 40 50 60<br />
TEMPERATURE in C<br />
1400<br />
1200<br />
1000<br />
800<br />
600<br />
400<br />
200<br />
0<br />
Test Data<br />
BFD Curve<br />
ISO Curve<br />
0 10 20 30 40 50 60<br />
TIME in minutes<br />
TIME in minutes<br />
(a) CTICM Test 35 (b) CTICM Test 53<br />
FIGURE 2: BFD Curves Fitted to CTICM Temperature-time Curves.<br />
DETERMINATION OF LIMITING STEEL TEMPERATURE AND PERIOD OF<br />
STRUCTURAL ADEQUACY FOR STEEL BEAM<br />
Scope <strong>of</strong> Example<br />
This example illustrates application <strong>of</strong> the NZS 3404 [5] provisions <strong>for</strong> determining the<br />
limiting temperature and period <strong>of</strong> structural adequacy <strong>of</strong> an unprotected secondary beam<br />
supporting a pr<strong>of</strong>iled concrete slab. The same beam and exposure configuration is then used,<br />
in both protected and unprotected applications, to determine the maximum <strong>steel</strong> temperatures<br />
reached under the Eurocode Parametric Curve [1] and the BFD Curve [2].<br />
Structural Floor System Characteristics and Loading<br />
The floor system subjected to the <strong>fire</strong> comprises a composite floor with concrete slab on a<br />
pr<strong>of</strong>iled <strong>steel</strong> deck, supported on primary and secondary <strong>steel</strong> beams, which are <strong>design</strong>ed to<br />
act compositely with the floor slab. In this example, only the slab and secondary beam<br />
elements are given, these being the components relevant to this <strong>design</strong> example:<br />
• normal weight concrete slab, 120 mm thick on Dimond Hi-Bond [15]<br />
• secondary beams are at 2.8 m centres<br />
• secondary beam size, grade is 310UB40, Grade 300<br />
• secondary beam is composite with the floor slab<br />
• secondary beams are unprotected against <strong>fire</strong><br />
• connections to secondary beams are WP30 from [16]<br />
• beam span is 8.3 metres<br />
• dead load, G = 2.4 kPa<br />
• basic live load, Q = 2.5 kPa<br />
• the live load combination factor <strong>for</strong> the ultimate limit state, from [7], is 0.4<br />
386
Second International Workshop « Structures in Fire » – Christchurch – March 2002<br />
Determination <strong>of</strong> the NZS 3404 Limiting Temperature <strong>for</strong> the Beam in a Simply<br />
Supported Condition.<br />
(1) Fire emergency loading and moment on beam<br />
G + Q u = 2.4 + 2.5 x 0.4 = 3.40 kPa<br />
w = 3.4 x 0.5 (2.8 + 2.8) + 0.4 = 9.92 kN/m<br />
*<br />
u,lineload<br />
* 2<br />
2<br />
* wu<br />
L 9.92 x 8.3<br />
M<br />
ss<br />
= =<br />
= 85.4 kNm<br />
8 8<br />
(2) Determination <strong>of</strong> beam limiting temperature in a simply supported condition<br />
This uses NZS 3404 [5] Clause 11.5<br />
φ <strong>fire</strong> M pos = 1.0 x 1.5 x M sx<br />
= 1.0 x 1.5 x 202 = 303 kNm<br />
φ <strong>fire</strong> = 1.0 (NZS 3404 [5] Amendment No. 1)<br />
1.5 = factor accounting <strong>for</strong> the minimum increase in moment capacity due to<br />
composite action from that <strong>for</strong> the beam alone (see HERA DCB No. 2,<br />
p.2)<br />
M sx,310UB40 = 202 kNm (<strong>for</strong> the beam alone, from [17] but multiplied<br />
by 1/φ)<br />
85.4<br />
303<br />
*<br />
f<br />
ss<br />
=<br />
φ<strong>fire</strong>Mpos<br />
= =<br />
r<br />
M<br />
0.28<br />
T l,ss<br />
= 905 – 690 r f = 711 o C<br />
Some points in regard to this check are as follows:<br />
(i)<br />
The utilisation factor, r f , is quite low. This is typical <strong>for</strong> composite secondary beams,<br />
whose size is <strong>of</strong>ten controlled by serviceability considerations. For example, in this<br />
instance, the span <strong>of</strong> 8.3 m <strong>for</strong> the 310UB40 size is controlled by deflection limitations.<br />
The Composite Floor Preliminary Design Charts [18] Tables 2 and 3 illustrate this<br />
point.<br />
(ii) That publication [18] also lists the <strong>design</strong> moment capacity <strong>for</strong> 50% and <strong>for</strong> 75%<br />
partial composite action. That can be used to determine φ <strong>fire</strong> M pos instead <strong>of</strong> the<br />
approach in (2) above, which uses a factor <strong>of</strong> 1.5 on the bare <strong>steel</strong> beam section moment<br />
capacity and gives a lower bound value.<br />
(iii)<br />
(iv)<br />
The <strong>fire</strong> emergency loading is determined from NZS 4203 [7] Clause 2.4.3.4 Load<br />
Combination (7).<br />
If the limiting temperature associated with simple support considerations was too low,<br />
in comparison with T max reached <strong>for</strong> given <strong>fire</strong> conditions, then the additional resistance<br />
available from the connections, as given by DCB No. 46 pp. 14 & 15 [19], could have<br />
been used to determine the increased <strong>fire</strong> resistance. However, this increased resistance<br />
is associated with increased permanent post-<strong>fire</strong> de<strong>for</strong>mation, as described in [3].<br />
387
Second International Workshop « Structures in Fire » – Christchurch – March 2002<br />
Temperatures Reached Under Standard Fire Test<br />
Fig. 3 shows the standard temperature-time curve, given by section 3.2.1 <strong>of</strong> [1] as well as the<br />
temperatures in the bottom flange <strong>for</strong> the 310UB40 floor beam unprotected and with 20 mm<br />
<strong>of</strong> pr<strong>of</strong>ile applied insulation material.<br />
Thermal exposure details are as follows:<br />
(1) For the <strong>steel</strong> beam<br />
• Hp/A <strong>for</strong> 310UB40, top flange shielded, = 206 m -1<br />
• Specific mass <strong>of</strong> <strong>steel</strong> = 7850 kg/m 3<br />
• Relative emissivity = 0.5<br />
• Coefficient <strong>of</strong> heat transfer by convection = 25 W/m 2 K<br />
(2) For the insulation material<br />
• Specific mass = 840 kg/m 3<br />
• Specific heat = 1700 J/kgK<br />
• Thermal conductivity = 0.80 W/mK<br />
• Thickness = 0.020 m<br />
1200<br />
1000<br />
TEMPERATURE in C<br />
800<br />
600<br />
400<br />
T ISO Curve<br />
T unprotected<br />
T protected<br />
200<br />
0<br />
0 30 60 90 120 150 180<br />
TIME in minutes<br />
FIGURE 3: Temperatures <strong>of</strong> Fire and Steel Beam Bottom Flange<br />
The local deviation in the <strong>steel</strong> temperature at between 700 o C and 800 o C is due to the<br />
increased specific heat <strong>of</strong> <strong>steel</strong> over that temperature range when the <strong>steel</strong> internal structure<br />
undergoes a phase change at around 720 o C.<br />
Period <strong>of</strong> Structural Adequacy <strong>for</strong> Unprotected Steel Beam<br />
Having obtained the section factor and limiting temperature <strong>for</strong> an unprotected <strong>steel</strong> beam or<br />
column, its time to failure conditions as defined in the standard <strong>fire</strong> test can be determined<br />
from Equations 11.6.1 and 11.6.2 <strong>of</strong> NZS 3404. The latter is <strong>for</strong> column (4 sided exposure),<br />
the <strong>for</strong>mer <strong>for</strong> beams (3 sided exposure; 1 flange shielded). These curves are derived directly<br />
from standard <strong>fire</strong> tests, as referenced in Commentary Clause C11.6 <strong>of</strong> [5].<br />
388
Second International Workshop « Structures in Fire » – Christchurch – March 2002<br />
This time to failure conditions in the standard <strong>fire</strong> test is called the period <strong>of</strong> structural<br />
adequacy (PSA) by NZS 3404. In the <strong>design</strong> <strong>for</strong> <strong>fire</strong> resistance it is compared with a specified<br />
Fire Resistance Rating (FRR).<br />
If PSA ≥ FRR, then the <strong>steel</strong> member is satisfactory <strong>for</strong> the <strong>fire</strong> exposure. If PSA < FRR, then<br />
the <strong>fire</strong> resistance <strong>of</strong> the member needs to be increased. This can be done by increasing the<br />
member load carrying capacity, which increases the limiting temperature, decreasing the<br />
section factor or adding insulation material to slow down the temperature rise in <strong>fire</strong>.<br />
CHECK ON BEAM ADEQUACY UNDER THE EUROCODE PARAMETRIC<br />
CURVE<br />
This is given in Fig. 4, <strong>for</strong> an enclosure with the following characteristics:<br />
enclosure floor area (m 2 ) A f 48.0<br />
enclosure height (m) 3<br />
total enclosure surface area: walls, ceiling, floor and openings (m 2 ) A t 180.0<br />
total area <strong>of</strong> vertical openings (m 2 ) A v 8<br />
weighted mean height <strong>of</strong> vertical openings (m) h 2<br />
<strong>fire</strong> load energy density related to the floor area A e (MJ/ m 2 ) q e,d 400<br />
<strong>fire</strong> load energy density related to the total surface area A t ((MJ/ m 2 ) q t,d 107<br />
A v / A f 0.167<br />
thermal characteristic b 1700<br />
opening factor OF 0.063<br />
Fig. 4 shows the results <strong>for</strong> the beam under the pre-2001 version <strong>of</strong> the Eurocode Parametric<br />
Curve. In this instance:<br />
T max, <strong>fire</strong><br />
T max, unprotected <strong>steel</strong><br />
T max, unprotected <strong>steel</strong><br />
= 736 o C at 13 mins<br />
= 687 o C at 17 mins<br />
= 555 o C at 29 mins<br />
1200<br />
1000<br />
TEMPERATURE in C<br />
800<br />
600<br />
400<br />
T Eurocode<br />
T unprotected<br />
T protected<br />
200<br />
0<br />
0 30 60 90 120 150 180<br />
TIME in minutes<br />
FIGURE 4: Temperatures <strong>of</strong> Fire and Steel, Pre-2001 Eurocode Parametric Curve <strong>for</strong><br />
Fire<br />
By comparing T max, <strong>steel</strong> with T l, ss from the earlier section, the beam can be seen to be<br />
satisfactory without insulation to support the applied load, under this <strong>fire</strong> temperature-time<br />
curve.<br />
389
Second International Workshop « Structures in Fire » – Christchurch – March 2002<br />
CHECK ON BEAM ADEQUACY UNDER THE BFD CURVE REPRESENTATION<br />
OF THIS FIRE<br />
This is shown in Fig. 5. The parameters used <strong>for</strong> developing the BFD Curve are as follows:<br />
T m = 716 o C = maximum temperature from the Eurocode Curve - 20 o C ambient<br />
m t = 13 mins (as determined from the Eurocode Curve)<br />
s c = 2.0<br />
These parameters have been chosen to get the best fit between the two curves; a comparison<br />
between the current Eurocode Parametric Curve and the BFD Curve <strong>using</strong> the recommended<br />
<strong>design</strong> parameters is given in the next section.<br />
In this instance:<br />
T max, <strong>fire</strong><br />
T max, unprotected <strong>steel</strong><br />
T max, unprotected <strong>steel</strong><br />
1200<br />
= 736 o C at 13 mins<br />
= 694 o C at 18 mins<br />
= 552 o C at 29 mins<br />
1000<br />
TEMPERATURE in C<br />
800<br />
600<br />
400<br />
T BFD Curve<br />
T unprotected<br />
T protected<br />
200<br />
0<br />
0 30 60 90 120 150 180<br />
TIME in minutes<br />
FIGURE 5: Temperatures <strong>of</strong> Fire and Steel, BFD Curve <strong>for</strong> Fire<br />
The reason <strong>for</strong> showing Fig. 4 and Fig. 5 is to show the similarity in <strong>steel</strong> temperatures given<br />
by the two <strong>fire</strong> curves. The differences arise from the slightly different shapes <strong>of</strong> the curves<br />
and they are minor. However, this does not illustrate how well the two parametric <strong>fire</strong> curves<br />
compare when applied to a given enclosure. That comparison is made in the next section.<br />
390
Second International Workshop « Structures in Fire » – Christchurch – March 2002<br />
SOME SUGGESTIONS FOR GENERATING DESIGN FIRES USING THE BFD<br />
CURVE<br />
Determination <strong>of</strong> Input Variables<br />
As previously stated, there are three input variables required <strong>for</strong> generating the BFD Curve.<br />
These are T m , t m , and s c , which in turn comprises c and k p.<br />
The maximum temperature, T m , can be obtained from Table 1 herein, <strong>for</strong> the given Fire<br />
Hazard Category and type <strong>of</strong> concrete. When generating the BFD Curve, the value <strong>of</strong> T a must<br />
be subtracted. The time to maximum temperature, t m , can be obtained through Equation (A.7)<br />
<strong>of</strong> Eurocode 1-1-2 Annex [3] (see equation (3) herein).<br />
The thermal insulation coefficient, c, varies from 16 to 38 as previously described. For<br />
enclosures with normal weight concrete ceiling and floor and plasterboard lined walls, c = 25<br />
is an appropriate value.<br />
The pyrolysis coefficient, k p , is determined from equations (5) to (7).<br />
Comparison Between Current (Modified) Eurocode Parametric Curve and BFD Curve<br />
There have been some significant changes made to the Eurocode Parametric Curve between<br />
the 1994 edition and the current (2001) edition [1]. There<strong>for</strong>e, any comparison between the<br />
two parametric curves must use the latest <strong>for</strong>mulation <strong>of</strong> the Eurocode Curve against the BFD<br />
Curve.<br />
However, as mentioned back in the introduction, the second author has found that the<br />
temperature-time relationship in the cooling regime can be better predicted through<br />
modification <strong>of</strong> the Eurocode Curve and has introduced these modifications in [6]. He has<br />
there<strong>for</strong>e used the modified curve incorporating the changes to the basic curve introduced via<br />
(1).<br />
(1) Modified inputs to the Eurocode Curve (Equation A.7 from [1])<br />
max t = max (2 x 10 -3 q t, d / OF; lim t )<br />
q t, d =<br />
Af<br />
400 =<br />
At<br />
106.7 MJ/m 2 surface area<br />
OF = 0.063<br />
lim t = 20 mins, from [1], <strong>for</strong> a medium growth <strong>fire</strong><br />
⇒ max t = max (0.339 ; 0.333) = 0.339 hours<br />
Γ = [OF/b] 2 / (0.04/1160) 2 = 1.15<br />
* t max = max t Γ = 0.390 hours<br />
(this is the variable * d<br />
t from the pre-2001 <strong>for</strong>mulation <strong>of</strong> the Eurocode Parametric Curve)<br />
(2) Inputs to the BFD Curve<br />
T m = 800 – 20 = 780 o C<br />
800 is from Table 1, <strong>for</strong> FHC1, NWC<br />
t m = 60 t max = 60 x 0.339 = 20 mins<br />
391
Second International Workshop « Structures in Fire » – Christchurch – March 2002<br />
c = 25<br />
F 02 = 8 2 / (180 – 8) = 0.066<br />
k p = 1 / (148 F 02 + 3.8) = 0.074<br />
s c = ck p = 25 x 0.074 = 1.85<br />
Temperature (degrees Celsius)<br />
900<br />
800<br />
700<br />
600<br />
500<br />
400<br />
300<br />
200<br />
100<br />
0<br />
Eurocode Parametric Curve<br />
BFD Curve<br />
0 10 20 30 40 50 60 70 80<br />
Time (minutes)<br />
FIGURE 6 : Comparison <strong>of</strong> Parametric Curves <strong>for</strong> Given Enclosure<br />
The comparison in Fig. 6 is <strong>for</strong> the first 74 minutes only. The agreement is good from a <strong>steel</strong><br />
temperature <strong>design</strong> viewpoint, such that either curve could be used to determine <strong>steel</strong> member<br />
temperatures with sufficient accuracy <strong>for</strong> structural <strong>design</strong> purposes.<br />
As a final point <strong>of</strong> interest, note that the changes to the Eurocode Parametric Curve<br />
<strong>for</strong>mulation have made the results more severe, in the case <strong>of</strong> a relatively short duration <strong>fire</strong>.<br />
This can be seen by comparing the Eurocode <strong>fire</strong> curves from Figs. 4 and 6, which gives, <strong>for</strong><br />
the maximum <strong>fire</strong> temperature reached and the associated time:<br />
• Old Eurocode <strong>for</strong>mulation : T max, <strong>fire</strong> = 736 o C at 13 mins<br />
• New Eurocode <strong>for</strong>mulation : T max, <strong>fire</strong> = 798 o C at 20 mins<br />
• BFD Curve : T max, <strong>fire</strong> = 800 o C at 20 mins<br />
CONCLUSIONS<br />
Increasing use is being made <strong>of</strong> “<strong>design</strong> <strong>fire</strong>” curves to represent the natural <strong>fire</strong> temperaturetime<br />
conditions in <strong>fire</strong> <strong>engineering</strong> <strong>design</strong>.<br />
The paper has illustrated <strong>examples</strong> <strong>of</strong> this approach and introduced a new parametric curve<br />
<strong>for</strong> such applications. Although a detailed description <strong>of</strong> this new curve is given elsewhere<br />
[2], sufficient detail is presented herein to allow its application in <strong>design</strong>. When compared<br />
with the Eurocode Parametric Curve [1] in regard to the predicted temperature reached in<br />
exposed unprotected and protected <strong>steel</strong> <strong>members</strong>, the differences are minor. When used as a<br />
<strong>design</strong> tool, an example <strong>of</strong> its application shows good agreement with the Eurocode<br />
392
Second International Workshop « Structures in Fire » – Christchurch – March 2002<br />
Parametric Curve, even though the BFD Curve is mathematically much simpler and more<br />
versatile to use in <strong>design</strong>, especially in spread-sheet based <strong>design</strong>.<br />
ACKNOWLEDGEMENTS<br />
The HERA Structural Engineer, second author <strong>of</strong> this paper, would like to acknowledge the<br />
contribution <strong>of</strong> the Foundation <strong>for</strong> Research, Science and Technology, <strong>for</strong> providing past and<br />
on-going funding <strong>of</strong> HERA’s <strong>fire</strong> research programme. This has made possible his research<br />
into the development <strong>of</strong> <strong>design</strong> <strong>fire</strong>s and hence his participation in the writing <strong>of</strong> this paper.<br />
The authors would also like to thank Jean-Marc Franssen <strong>for</strong> his assistance with the<br />
translation <strong>of</strong> Ref [14] and the provision <strong>of</strong> a spreadsheet which has been used to produce Figs<br />
3, 4 and 5.<br />
REFERENCES<br />
[1] EC1-1-2/59:2001 (Third Draft) : Eurocode 1 – Actions on Structures Part 1-2: General<br />
Actions – Actions on Structures Exposed to Fire; CEN, Brussels, Belgium.<br />
[2] Barnett, CR; BFD Curve – A New Empirical Model <strong>for</strong> Fire Compartment<br />
Temperatures; Fire Safety Journal; Elsevier Science, paper accepted <strong>for</strong> publication<br />
2002.<br />
[3] Clifton, GC; Fire Design Advice Article 65: Various Examples Covering the Design <strong>of</strong><br />
Structural Members <strong>for</strong> Fully Developed Fires; HERA Steel Design and Construction<br />
Bulletin No. 65, December 2001, pp. 4-13.<br />
[4] Buchanan, AH (Editor); Fire Engineering Design Guide, Second Edition; Centre <strong>for</strong><br />
Advanced Engineering, University <strong>of</strong> Canterbury, Christchurch, 2001.<br />
[5] NZS 3404: 1997, plus Amendment No. 1: 2001, Steel Structures Standard; Standards<br />
New Zealand, Wellington, New Zealand.<br />
[6] Clifton GC; Fire Models <strong>for</strong> Large Firecells; HERA Manukau City, 1996, HERA<br />
Report R4-83, plus amendments on page 20, HERA DCB No. 54, February 2000.<br />
[7] NZS 4203:1992, General Structural Design and Design Loadings <strong>for</strong> Buildings;<br />
Standards New Zealand, Wellington, New Zealand.<br />
[8] Law M and O’Brien T; Fire Safety <strong>of</strong> Bare External Structural Steel; Constrado,<br />
London, England,1968.<br />
[9] Auffinger, A; Response <strong>of</strong> Multi-Storey Steel Framed Buildings in Fully Developed<br />
Natural Fires: Revision <strong>of</strong> Fire Model and Inelastic Response Design Procedure; Report<br />
<strong>for</strong> Second Practical Term; HERA Manukau City, New Zealand 2000.<br />
[10] Clifton, GC et.al.; Design <strong>of</strong> Multi-Storey Steel Framed Buildings With Unprotected<br />
Secondary Beam or Joists <strong>for</strong> Dependable Inelastic Response in Severe Fires; HERA<br />
Steel Design and Construction Bulletin; No. 60, February 2001, pp. 1-58.<br />
393
Second International Workshop « Structures in Fire » – Christchurch – March 2002<br />
[11] C/AS1: 2001, Acceptable Solution <strong>for</strong> Fire Safety; Building Industry Authority,<br />
Wellington, New Zealand.<br />
[12] Kirby, B. R. et al.; Natural Fires in Large Scale Compartments – A British Steel<br />
Technical, Fire Research Station Collaborative Report, British Steel Technical,<br />
Swinden Laboratories, United Kingdom, 1994.<br />
[13] Thomas PH and Heselden AJM; Fully-developed Fires in Single Compartments; Fire<br />
Research Note No. 923, Fire Research Station, Borehamwood, England, 1972.<br />
[14] Arnault P, Ehm H and Kruppa J; Report Experimental sur les Essais Avec Des Naturels<br />
Executes Dans La Petite Installation; Maiziers-La-Metz Centre Technique Industrial De<br />
La Construction Metallique, Puteax, France, Doc C.E.C.M – 3.73-11-F, 1973.<br />
[15] Hi-Bond Design Manual; Dimond Structural, 1999, Auckland, New Zealand.<br />
[16] Hyland C; Structural Steelwork Connection Guide Incorporating Amendment No. 1;<br />
HERA, Manukau City, New Zealand, 1999/2001, HERA Report R4-100.<br />
[17] Design Capacity Tables <strong>for</strong> Structural Steel, Third Edition, Volume 1 : Open Sections;<br />
Australian Institute <strong>of</strong> Steel Construction, Sydney, Australia, 2000.<br />
[18] Composite Floor Preliminary Design Charts; Steltech Structural Ltd, Auckland, New<br />
Zealand, 1999.<br />
[19] Clifton GC; Fire Design Advice Article 46: Eliminating the Need <strong>for</strong> Passive Fire<br />
Protection in Aulti-Storey Apartment and Hotel Buildings By Using the Shielding<br />
Effects <strong>of</strong> the Linings; HERA Steel Design and Construction Bulletin, No. 46, October<br />
1998, pp.10-16.<br />
394