PDF | 2 MB - Australian Building Codes Board
PDF | 2 MB - Australian Building Codes Board
PDF | 2 MB - Australian Building Codes Board

You also want an ePaper? Increase the reach of your titles
YUMPU automatically turns print PDFs into web optimized ePapers that Google loves.
7. Observed trends in tropical cyclone activity in the <strong>Australian</strong> Region<br />
7.1 Introduction<br />
This Chapter reviews trends in tropical cyclonic activity in the <strong>Australian</strong> Region<br />
during the last thirty years, and possible explanations.<br />
7.2 Observations by Nicholls et al (1998)<br />
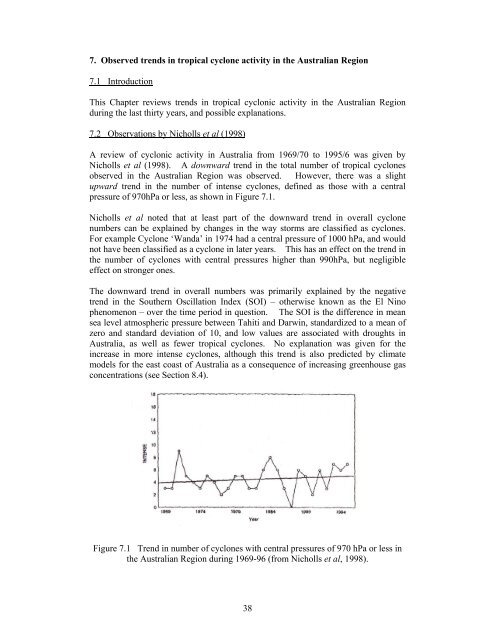
A review of cyclonic activity in Australia from 1969/70 to 1995/6 was given by<br />
Nicholls et al (1998). A downward trend in the total number of tropical cyclones<br />
observed in the <strong>Australian</strong> Region was observed. However, there was a slight<br />
upward trend in the number of intense cyclones, defined as those with a central<br />
pressure of 970hPa or less, as shown in Figure 7.1.<br />
Nicholls et al noted that at least part of the downward trend in overall cyclone<br />
numbers can be explained by changes in the way storms are classified as cyclones.<br />
For example Cyclone ‘Wanda’ in 1974 had a central pressure of 1000 hPa, and would<br />
not have been classified as a cyclone in later years. This has an effect on the trend in<br />
the number of cyclones with central pressures higher than 990hPa, but negligible<br />
effect on stronger ones.<br />
The downward trend in overall numbers was primarily explained by the negative<br />
trend in the Southern Oscillation Index (SOI) – otherwise known as the El Nino<br />
phenomenon – over the time period in question. The SOI is the difference in mean<br />
sea level atmospheric pressure between Tahiti and Darwin, standardized to a mean of<br />
zero and standard deviation of 10, and low values are associated with droughts in<br />
Australia, as well as fewer tropical cyclones. No explanation was given for the<br />
increase in more intense cyclones, although this trend is also predicted by climate<br />
models for the east coast of Australia as a consequence of increasing greenhouse gas<br />
concentrations (see Section 8.4).<br />
Figure 7.1 Trend in number of cyclones with central pressures of 970 hPa or less in<br />
the <strong>Australian</strong> Region during 1969-96 (from Nicholls et al, 1998).<br />
38