Anderson Elementary - Tulsa Public Schools
Anderson Elementary - Tulsa Public Schools
Anderson Elementary - Tulsa Public Schools

Create successful ePaper yourself
Turn your PDF publications into a flip-book with our unique Google optimized e-Paper software.
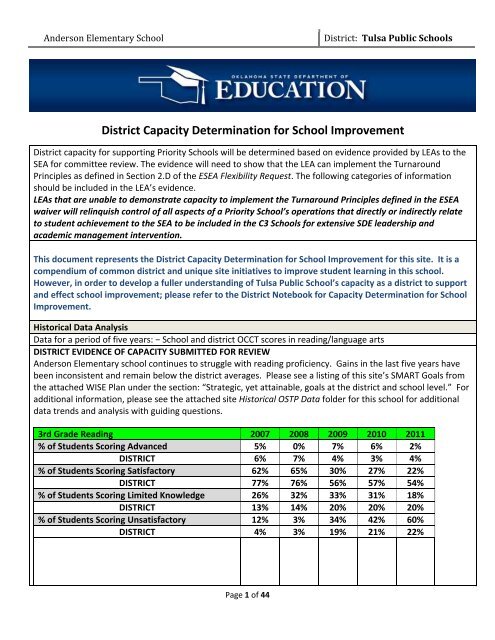
<strong>Anderson</strong> <strong>Elementary</strong> School<br />
District: <strong>Tulsa</strong> <strong>Public</strong> <strong>Schools</strong><br />
District Capacity Determination for School Improvement<br />
District capacity for supporting Priority <strong>Schools</strong> will be determined based on evidence provided by LEAs to the<br />
SEA for committee review. The evidence will need to show that the LEA can implement the Turnaround<br />
Principles as defined in Section 2.D of the ESEA Flexibility Request. The following categories of information<br />
should be included in the LEA’s evidence.<br />
LEAs that are unable to demonstrate capacity to implement the Turnaround Principles defined in the ESEA<br />
waiver will relinquish control of all aspects of a Priority School’s operations that directly or indirectly relate<br />
to student achievement to the SEA to be included in the C3 <strong>Schools</strong> for extensive SDE leadership and<br />
academic management intervention.<br />
This document represents the District Capacity Determination for School Improvement for this site. It is a<br />
compendium of common district and unique site initiatives to improve student learning in this school.<br />
However, in order to develop a fuller understanding of <strong>Tulsa</strong> <strong>Public</strong> School’s capacity as a district to support<br />
and effect school improvement; please refer to the District Notebook for Capacity Determination for School<br />
Improvement.<br />
Historical Data Analysis<br />
Data for a period of five years: − School and district OCCT scores in reading/language arts<br />
DISTRICT EVIDENCE OF CAPACITY SUBMITTED FOR REVIEW<br />
<strong>Anderson</strong> <strong>Elementary</strong> school continues to struggle with reading proficiency. Gains in the last five years have<br />
been inconsistent and remain below the district averages. Please see a listing of this site’s SMART Goals from<br />
the attached WISE Plan under the section: “Strategic, yet attainable, goals at the district and school level.” For<br />
additional information, please see the attached site Historical OSTP Data folder for this school for additional<br />
data trends and analysis with guiding questions.<br />
3rd Grade Reading 2007 2008 2009 2010 2011<br />
% of Students Scoring Advanced 5% 0% 7% 6% 2%<br />
DISTRICT 6% 7% 4% 3% 4%<br />
% of Students Scoring Satisfactory 62% 65% 30% 27% 22%<br />
DISTRICT 77% 76% 56% 57% 54%<br />
% of Students Scoring Limited Knowledge 26% 32% 33% 31% 18%<br />
DISTRICT 13% 14% 20% 20% 20%<br />
% of Students Scoring Unsatisfactory 12% 3% 34% 42% 60%<br />
DISTRICT 4% 3% 19% 21% 22%<br />
Page 1 of 44
<strong>Anderson</strong> <strong>Elementary</strong> School<br />
District: <strong>Tulsa</strong> <strong>Public</strong> <strong>Schools</strong><br />
4th Grade Reading 2007 2008 2009 2010 2011<br />
% of Students Scoring Advanced 0% 0% 0% 0% 0%<br />
DISTRICT 3% 4% 5% 2% 4%<br />
% of Students Scoring Satisfactory 86% 72% 25% 21% 21%<br />
DISTRICT 80% 85% 50% 52% 47%<br />
% of Students Scoring Limited Knowledge 10% 21% 25% 28% 26%<br />
DISTRICT 11% 9% 20% 19% 21%<br />
% of Students Scoring Unsatisfactory 5% 7% 50% 51% 53%<br />
DISTRICT 6% 3% 25% 27% 29%<br />
5th Grade Reading 2007 2008 2009 2010 2011<br />
% of Students Scoring Advanced 2% 0% 0% 0% 6%<br />
DISTRICT 10% 11% 8% 6% 7%<br />
% of Students Scoring Satisfactory 63% 71% 42% 24% 19%<br />
DISTRICT 61% 68% 52% 46% 46%<br />
% of Students Scoring Limited Knowledge 22% 24% 38% 21% 22%<br />
DISTRICT 17% 15% 23% 24% 25%<br />
% of Students Scoring Unsatisfactory 13% 5% 21% 56% 53%<br />
DISTRICT 12% 5% 17% 23% 21%<br />
DETERMINATION OF CAPACITY BY REVIEWERS AND COMMENTS<br />
School and district OCCT scores in mathematics<br />
DISTRICT EVIDENCE OF CAPACITY SUBMITTED FOR REVIEW<br />
<strong>Anderson</strong> <strong>Elementary</strong> School continues to struggle with Math proficiency. Any gains in the last five years have<br />
been inconsistent and have not been sustained. <strong>Anderson</strong> remains well below the district averages. Please<br />
see a listing of this site’s SMART Goals from the attached WISE Plan under the section: “Strategic, yet<br />
attainable, goals at the district and school level.” For additional information, please see the attached site<br />
Historical OSTP Data folder for this school for additional data trends and analysis with guiding questions.<br />
Page 2 of 44
<strong>Anderson</strong> <strong>Elementary</strong> School<br />
District: <strong>Tulsa</strong> <strong>Public</strong> <strong>Schools</strong><br />
3rd Grade Math 2007 2008 2009 2010 2011<br />
% of Students Scoring Advanced 5% 0% 7% 6% 2%<br />
DISTRICT 17% 17% 20% 19% 19%<br />
% of Students Scoring Satisfactory 34% 17% 24% 23% 20%<br />
DISTRICT 55% 17% 43% 44% 37%<br />
% of Students Scoring Limited Knowledge 37% 63% 36% 23% 22%<br />
DISTRICT 22% 17% 22% 20% 27%<br />
% of Students Scoring Unsatisfactory 24% 14% 33% 42% 57%<br />
DISTRICT 6% 3% 16% 18% 18%<br />
4th Grade Math 2007 2008 2009 2010 2011<br />
% of Students Scoring Advanced 10% 0% 6% 18% 4%<br />
DISTRICT 16% 17% 13% 11% 18%<br />
% of Students Scoring Satisfactory 62% 34% 31% 6% 21%<br />
DISTRICT 58% 61% 45% 45% 38%<br />
% of Students Scoring Limited Knowledge 24% 52% 22% 33% 26%<br />
DISTRICT 21% 19% 22% 23% 23%<br />
% of Students Scoring Unsatisfactory 5% 14% 41% 41% 49%<br />
DISTRICT 4% 4% 20% 21% 21%<br />
5th Grade Math 2007 2008 2009 2010 2011<br />
% of Students Scoring Advanced 3% 5% 4% 3% 9%<br />
DISTRICT 23% 26% 27% 27% 18%<br />
% of Students Scoring Satisfactory 52% 67% 13% 6% 19%<br />
DISTRICT 54% 58% 34% 33% 40%<br />
% of Students Scoring Limited Knowledge 30% 24% 46% 38% 31%<br />
DISTRICT 19% 14% 22% 21% 24%<br />
% of Students Scoring Unsatisfactory 5% 5% 38% 47% 41%<br />
DISTRICT 4% 3% 17% 19% 17%<br />
DETERMINATION OF CAPACITY BY REVIEWERS AND COMMENTS<br />
Page 3 of 44
<strong>Anderson</strong> <strong>Elementary</strong> School<br />
District: <strong>Tulsa</strong> <strong>Public</strong> <strong>Schools</strong><br />
School and district graduation rates<br />
DISTRICT EVIDENCE OF CAPACITY SUBMITTED FOR REVIEW<br />
NA<br />
DETERMINATION OF CAPACITY BY REVIEWERS AND COMMENTS<br />
School and district dropout rates<br />
DISTRICT EVIDENCE OF CAPACITY SUBMITTED FOR REVIEW<br />
NA<br />
DETERMINATION OF CAPACITY BY REVIEWERS AND COMMENTS<br />
School and district attendance rates<br />
DISTRICT EVIDENCE OF CAPACITY SUBMITTED FOR REVIEW<br />
<strong>Anderson</strong> <strong>Elementary</strong> School’s attendance rate has consistently exceeded the district average as well as the<br />
state standard for AYP.<br />
2011<br />
92.40%<br />
95.20%<br />
2010<br />
2009<br />
2008<br />
2007<br />
91.90%<br />
95.90%<br />
92.50%<br />
93.70%<br />
92.60%<br />
95.00%<br />
93.20%<br />
93.50%<br />
District Attendance<br />
Rate<br />
<strong>Anderson</strong> ES<br />
Attendance Rate<br />
88.00% 90.00% 92.00% 94.00% 96.00% 98.00%<br />
DETERMINATION OF CAPACITY BY REVIEWERS AND COMMENTS<br />
Page 4 of 44
<strong>Anderson</strong> <strong>Elementary</strong> School<br />
District: <strong>Tulsa</strong> <strong>Public</strong> <strong>Schools</strong><br />
School and district suspension rates and behavior records<br />
DISTRICT EVIDENCE OF CAPACITY SUBMITTED FOR REVIEW<br />
<strong>Anderson</strong> <strong>Elementary</strong> <strong>Schools</strong> suspension rate has decreased from a high five years ago. The table below<br />
indicates the trends over the last five years.<br />
<strong>Anderson</strong> ES 2006‐07 2007‐08 2008‐09 2009‐10 2010‐11<br />
Membership 375 310 319 356 369<br />
Total Suspensions 80 32 63 58 65<br />
Total Students Suspended 54 25 43 36 41<br />
% Suspension Total Rate 24 10 20 16 18<br />
% Suspension Total Student<br />
Rate<br />
14 8 13 10 11<br />
DISTRICT TOTALS 2006‐07 2007‐08 2008‐09 2009‐10 2010‐11<br />
Membership 40125 40754 39514 40879 41224<br />
Total Suspensions 9937 8299 9070 6984 8202<br />
Total Students Suspended NA NA NA 3647 4814<br />
% Suspension Total Rate 25% 20% 23% 17% 20%<br />
% Suspension Total Student Rate NA NA NA 9% 12%<br />
DETERMINATION OF CAPACITY BY REVIEWERS AND COMMENTS<br />
School and district teacher/principal attrition rates<br />
DISTRICT EVIDENCE OF CAPACITY SUBMITTED FOR REVIEW<br />
School 2006‐07 2007‐08 2008‐09 2009‐010 2010‐011 2011‐012<br />
Principal<br />
Attrition at<br />
<strong>Anderson</strong> ES<br />
Brenda<br />
<strong>Anderson</strong><br />
Brenda<br />
<strong>Anderson</strong><br />
Brenda<br />
<strong>Anderson</strong><br />
Brenda<br />
<strong>Anderson</strong><br />
Brenda<br />
<strong>Anderson</strong><br />
Marcus<br />
Moore<br />
On April 18, 2010 The Program Management Office (PMO) released a report outlining the results of four year<br />
review of the rate of certified staff turnover within schools of the district. The methodology utilized was to<br />
review the names of personnel on the payroll in September of one school year and then review the payroll<br />
Page 5 of 44
<strong>Anderson</strong> <strong>Elementary</strong> School<br />
District: <strong>Tulsa</strong> <strong>Public</strong> <strong>Schools</strong><br />
records the next September to determine if the individual was still in the same school. This analysis was<br />
conducted for all certificated staff regardless of funding source or assignment. The time period for this review<br />
was 2005‐06, 2006‐07, 2007‐08 and 2008‐09.<br />
<strong>Anderson</strong> ES<br />
Number of<br />
Certificated staff<br />
September 2005<br />
Number of the 2005 staff<br />
remaining on payroll in<br />
September 2009 at the<br />
site<br />
Annual % of<br />
Mobility<br />
% of Staff Turnover in<br />
the four year cycle.<br />
Staff Turnover 26 6 19.25 ‐77<br />
DETERMINATION OF CAPACITY BY REVIEWERS AND COMMENTS<br />
School and district; mobility rates<br />
DISTRICT EVIDENCE OF CAPACITY SUBMITTED FOR REVIEW<br />
TULSA PUBLIC SCHOOLS<br />
Mobility and Holding Power Report 2007‐2011<br />
HOLDING HOLDING HOLDING HOLDING HOLDING<br />
MOBILITY MOBILITY MOBILITY MOBILITY MOBILITY POWER POWER POWER POWER POWER<br />
2006‐07 2007‐08 2008‐09 2009‐10 2010‐2011 2006‐07 2007‐08 2008‐09% 2009‐10 2010‐11<br />
<strong>Anderson</strong> 125% 102% 102% 98% 134% 78% 83% 91% 82% 73%<br />
ELEMENTARY<br />
TOTAL 50% 51% 51% N/A N/A 82% 82% 94% NA NA<br />
DISTRICT<br />
TOTAL** 95% 95% 85% N/A N/.A 92% 82% 92% 84% 80%<br />
**The district total included special facility numbers which have included an inconsistent variety of<br />
sites over the years<br />
Note: Holding Power represents the number of students finishing the school year in the same school in which they began<br />
the school year.<br />
DETERMINATION OF CAPACITY BY REVIEWERS AND COMMENTS<br />
Page 6 of 44
<strong>Anderson</strong> <strong>Elementary</strong> School<br />
District: <strong>Tulsa</strong> <strong>Public</strong> <strong>Schools</strong><br />
School and district enrollment data, including subgroups<br />
DISTRICT EVIDENCE OF CAPACITY SUBMITTED FOR REVIEW<br />
2006‐07 2007‐08 2008‐09<br />
Site District Site District Site District<br />
No. Pct No. Pct No. Pct No. Pct No. Pct No. Pct<br />
All 375 100.00% 42169 100.00% 299 100.00% 41697 100.00% 309 100.00% 41180 100.00%<br />
Male 213 56.80% 21353 50.64% 170 56.86% 21204 50.85% 172 55.66% 21087 51.21%<br />
Female 162 43.20% 20816 49.36% 129 43.14% 20493 49.15% 137 44.34% 20093 48.79%<br />
White 19 5.07% 14759 35.00% 17 5.69% 14359 34.44% 11 3.56 13827 33.58%<br />
Black 326 86.93% 14787 35.07% 249 83.28% 14554 34.90% 255 82.52% 13882 33.71%<br />
Indian 18 4.80% 4260 10.10% 16 5.35% 4157 9.97% 19 6.15% 4490 10.90%<br />
Hispanic 10 2.67% 7784 18.46% 13 4.35% 8021 19.24% 21 6.80% 8401 20.40%<br />
Asian 2 0.53% 579 1.37% 4 1.34% 606 1.45% 3 0.97% 580 1.41%<br />
Pacific<br />
Multiracial<br />
SPED 46 12.27% 6410 15.20% 39 13.04% 6106 14.64% 32 10.36% 6046 14.68%<br />
2009‐10 2010‐11 2011‐12<br />
Site District Site District Site District<br />
No. Pct No. Pct No. Pct No. Pct No. Pct No. Pct<br />
All 353 100.00% 40846 100.00% 360 100.00% 41224 100.00% 431 100.00% 40919 100.00%<br />
Male 190 53.82% 21100 51.66% 195 54.17% 21247 51.54% 242 56.15% 21019 51.37%<br />
Female 163 46.18% 19746 48.34% 165 45.83% 19977 48.46% 189 43.85% 19900 48.63%<br />
White 27 7.65 13014 31.86% 21 5.83% 12213 29.63% 30 6.96% 11745 28.70%<br />
Black 274 77.62% 13834 33.87% 279 77.50% 12746 30.92% 310 71.93% 12062 29.48%<br />
Indian 25 7.08% 4383 10.73% 22 6.11% 3309 8.03% 25 5.80% 3022 7.39%<br />
Hispanic 24 6.80% 8970 21.96% 33 9.17% 10177 24.69% 43 9.98% 10693 26.13%<br />
Asian 3 0.85% 624 1.53% 3 0.83% 552 1.34% 4 0.93% 549 1.34%<br />
Pacific 0 0.00% 21 0.05% 0 0.00% 51 0.12% 1 0.23% 71 0.17%<br />
Multiracial 2 0.56% 2176 5.28% 18 4.18% 2777 6.79%<br />
SPED 38 10.76% 5886 14.41% 40 11.11% 6126 14.86% 68 15.78% 6259 15.30%<br />
DETERMINATION OF CAPACITY BY REVIEWERS AND COMMENTS<br />
Page 7 of 44
<strong>Anderson</strong> <strong>Elementary</strong> School<br />
District: <strong>Tulsa</strong> <strong>Public</strong> <strong>Schools</strong><br />
Historical analysis of data over a period of five years and evidence that historical data has been used to<br />
develop school‐level interventions (data should include, but is not limited to, the categories listed above)<br />
DISTRICT EVIDENCE OF CAPACITY SUBMITTED FOR REVIEW<br />
Please see attached WISE, School Improvement Plans (SI Plan) and File 6‐ Historical Data Analysis in the site<br />
additional documentation folder.<br />
In File 6‐Historical Data Analysis, the District provides:<br />
• Value‐added estimates for all Priority <strong>Schools</strong> for Math and Reading/English ( 3‐year average; 2010‐<br />
2011, and 2009‐2010)<br />
• Achievement results and value‐added data displayed in tandem for all District schools (3‐year average<br />
and 2010‐2011)<br />
• Sample value‐added report<br />
• Evidence of leaders and teachers’ use of the data and training in the use of value‐added data<br />
<strong>Anderson</strong> <strong>Elementary</strong> school administered the following assessments at the beginning of the 2011 school year<br />
to collect data and make informed decisions about instructional support for our students:<br />
• DIBELS (primary grade levels)<br />
• Diagnostic writing assessment (intermediate grade levels)<br />
• Fountas n Pinnell (Intermediate grade levels)<br />
• SRI (Scholastic Reading Inventory)<br />
Additionally, our staff development teacher analyzed the OCCT, the state assessment, in September of 2011<br />
and met with each teacher to discuss the strengths and areas of growth of students relative to the state<br />
standards. This data was triangulated with other forms of data to make decisions about interventions for<br />
students. Teachers were then challenged to identify instructional goals for their classrooms. Along with<br />
instructional goals, teachers were tasked with providing small group instruction regularly within the context of<br />
the classroom. Classroom libraries were purchased in October of 2011 so that students might have more<br />
opportunities to read books on their levels and of high interest to them. A writing plan was developed among<br />
intermediate grade‐level teachers to identify how they would support each other with addressing student<br />
needs in this area. A reading intervention teacher was hired in October of 2011 to support teachers with<br />
providing small group (pull‐out) instructional support. Finally, after school tutoring was created to provide<br />
extra support for students who fell right below proficiency. Teachers examined data from several sources,<br />
including classroom assessment data and the abovementioned assessments to identify the targeted students<br />
for after school tutoring.<br />
DETERMINATION OF CAPACITY BY REVIEWERS AND COMMENTS<br />
Page 8 of 44
<strong>Anderson</strong> <strong>Elementary</strong> School<br />
District: <strong>Tulsa</strong> <strong>Public</strong> <strong>Schools</strong><br />
A plan for developing school‐level interventions for the upcoming school year based on historical and current<br />
data (data should include, but is not limited to, the categories listed above)<br />
DISTRICT EVIDENCE OF CAPACITY SUBMITTED FOR REVIEW<br />
Each site’s OSDE approved WISE plan is presented in the site additional documentation folder as evidence<br />
supporting this criterion.<br />
As we move forward into next school year, we will make several adjustments to ensure our decisions are much<br />
more aligned to the data we collect both historically and currently, including:<br />
• Universally screen all students using a variety of assessments, including DIBELS (primary grades),<br />
Fountas and Pinnell (intermediate grades), a writing prompt for all grade levels with accompanying<br />
rubric, and a mathematics diagnostic.<br />
• Incorporate elements of Readers and Writer’s Workshop into our instructional program<br />
• Increase our focus on information text within the curriculum<br />
• Increase our emphasis on building background knowledge and vocabulary within the curriculum by:<br />
o Embedding more curriculum aligned field trips into the units of instruction<br />
o Identifying tier 1 and tier 2 words that students must know or become familiar with across<br />
subject areas or within the content<br />
• Provide more formal training for staff with the use of Fountas and Pinnell as our primary reading<br />
intervention program<br />
• Fullly implement the RTI model, allowing teams to utilize their time more strategically focused on<br />
academic gaps and supports<br />
• Build capacity among staff in the area of literacy through ongoing professional development:<br />
o Reader’s Workshop<br />
o Writer’s Workshop<br />
o Fountas n Pinnell<br />
DETERMINATION OF CAPACITY BY REVIEWERS AND COMMENTS<br />
Page 9 of 44
<strong>Anderson</strong> <strong>Elementary</strong> School<br />
District: <strong>Tulsa</strong> <strong>Public</strong> <strong>Schools</strong><br />
District Expectations Communicated to All Stakeholders<br />
Strategic, yet attainable, goals at the district and school level (including goals for each subgroup).<br />
DISTRICT EVIDENCE OF CAPACITY SUBMITTED FOR REVIEW<br />
Please see File 10‐Strategic Goals in site additional documentation folder. The District aligns its initiatives,<br />
objectives and measures of success around its five core goals:<br />
• Student achievement,<br />
• Teacher and leader effectiveness<br />
• Performance‐based culture<br />
• Financial Sustainability<br />
• Safe and Secure <strong>Schools</strong><br />
File 10 contains the following documents: Introduction to the District’s plan for identifying and measuring its<br />
goals; TPS Strategic Plan; Overview of the District’s Shared Accountability System; District’s Measures of<br />
Success; and Departments’ Balanced Scorecards, as available (draft versions only).<br />
As stated in <strong>Anderson</strong>’s WISE Plan, the staff evaluated 2011 OCCT and OMAAP scores for third to fifth grades.<br />
These scores were compared to the last two years to determine trends in reading and math. Priorities were<br />
determined in terms of academic achievement data. Based on these results, the identified areas of need for<br />
reading in third to fifth grades are: Affixes, Synonyms, antonyms, & Homonyms, Using Resource Materials,<br />
Literal Understanding, Inferences & Interpretation, Summary & Generalization, Analysis & Evaluation, Literary<br />
Elements, Figurative Language & Sound Devices, Accessing Information. The identified areas of need for math<br />
in third to fifth grades are: Algebra patterns, Problem Solving, Fractions/Decimals/Percents, Number Theory,<br />
Estimation, Whole Numbers/Decimals/Fractions, Geometric Figure Properties, Perimeter/Area, Convert<br />
Measurements, Data Analysis, and Probability.<br />
<strong>Anderson</strong> SMARTgoals as outlined in the WISE plan are as follows:<br />
Third Grade Reading 2.4<br />
During the 2011‐ 2012 school year, all third grade students will increase their Using Resource Materials (2.4)<br />
skills as measured by the OCCT scores from 2010 – 2011 to 2011 – 2012. The Regular Education Students<br />
scored 50% on Using Resource Materials and will increase their score by 25% up to 75%.<br />
Third Grade Reading 4.2<br />
During the 2011 – 2012 school year, all third grade students will increase their Inferences & Interpretation (4.2)<br />
skills as measured by the OCCT scores from 2010‐2011 to 2011‐2012. The regular Education Students scored<br />
43% on Inferences & Interpretation and will increase their score by 14% up to 57%.<br />
Third Grade Reading 4.3<br />
During the 2011 – 2012 school year, all third grade students will increase their Summary & Generalization (4.3)<br />
skills as measured by the OCCT scores from 2010‐ 2011 to 2011‐2012. The Regular Education Students scored<br />
50% on Summary and will increase their score by17% up to 67%.<br />
Page 10 of 44
<strong>Anderson</strong> <strong>Elementary</strong> School<br />
District: <strong>Tulsa</strong> <strong>Public</strong> <strong>Schools</strong><br />
Third Grade Reading 5.3<br />
During the 2011 – 2012 school year, all third grade students will increase their Figurative Language & Sound<br />
Devices (5.3) skills as measured by the OCCT scores from 2010 – 2011 to 2011 ‐ 2012. The Regular Education<br />
Students scored 50% on Figurative Language & Sound Devices and will increase score by 17% up to 67%.<br />
Third Grade Reading 6.1<br />
During the 2011 – 2012 school year, all third grade students will increase their Accessing Information (6.1) skills<br />
as measured by the OCCT scores from 2010 – 2011 to 2011 – 2012. The Regular Education Students scored<br />
50% on Accessing Information and will increase score by 17% up to 67%.<br />
Third Grade Math 3.1<br />
During the 2011 – 2012 school year, the third grade students will improve their Estimation skills (3.1) by 25% as<br />
measured by the OCCT scores from 2010 – 2011. This goal will increase the scores of Regular Education<br />
Students from 25% to 50%.<br />
Third Grade Math 4.2<br />
During the 2011 – 2012 school year, the third grade students will improve their Measurement (4.2) skills by<br />
25% as measured by the OCCT scores from 2010 – 2011. This goal will increase the scores of Regular Education<br />
Students from 25% to 50%.<br />
Third Grade Math 5.1<br />
During the 2011 – 2012 school year, the third grade students will improve their Data Analysis (5.1) skills by 25%<br />
as measured by the OCCT scores from 2010 – 2011. This goal will increase the scores of Regular Education<br />
Students from 25% to 50%.<br />
Fourth Grade Reading 1.2<br />
During the 2011 – 2012 school year, all fourth grade students will increase their Affixes, Roots, & Derivatives<br />
(1.2) skills as measured by the OCCT scores from 2010 – 2011 to 2011 – 2012. The Regular Education Students<br />
scored 40% on Affixes, Roots, & Derivatives and will increase score by 20% up to 60%.<br />
Fourth Grade Reading 3.2<br />
During the 2011 – 2012 school year, all fourth grade students will increase their Inferences & Interpretation<br />
(3.2) skills as measured by the OCCT scores from 2010 – 2011 to 2011 – 2012. The Regular Education Students<br />
scored 50% on Inferences & Interpretation and will increase score by 17% up to 67%.<br />
Fourth Grade Reading 4.2<br />
During the 2011 – 2012 school year, all fourth grade students will increase their Literary Elements (4.2) skills as<br />
measured by the OCCT scores from 2010 – 2011 to 2011 – 2012. The Regular Education Students scored 40%<br />
on Literary Elements and will increase score by 20% up to 60%.<br />
Fourth Grade Reading 5.0<br />
During the 2010 – 2011 school year, all fourth grade students will increase their Figurative Language & Sound<br />
Devices (5.0) skills as measured by the OCCT scores from 2010 – 2011 to 2011‐ 2012. The Regular Education<br />
Students scored 25% on Figurative Language & Sound Devices and will increase score by 25% up to 50%,<br />
Page 11 of 44
<strong>Anderson</strong> <strong>Elementary</strong> School<br />
District: <strong>Tulsa</strong> <strong>Public</strong> <strong>Schools</strong><br />
Fourth Grade Math 2.1<br />
During the 2011 ‐2012 school year, the fourth grade students will improve their Place Value (2.1) skills by 25%<br />
as measured by the OCCT scores from 2010 – 2011 to 2011 – 2012. This goal will increase the scores of<br />
Regular Education Students from 50% to 75%.<br />
Fourth Grade Math 3.3<br />
During the 2011 – 2012 school year, the fourth grade students will improve their Estimation (3.3) skills by 25%<br />
as measured by the OCCT scores from 2010 – 2011 to 2011 – 2012. This goal will increase the scores of<br />
Regular Education Students from 50% to 75%.<br />
Fourth Grade Math 4.4<br />
During the 2011 – 2012 school year, the fourth grade students will improve their Measurement (4.4.) skills by<br />
25% as measured by the OCCT scores from 2010 – 2011 to 2011 ‐2012. This goal will increase the scores of<br />
Regular Education Students from 50% to 75%.<br />
Fifth Grade Reading 3.1<br />
During the 2011 – 2012 school year, all fifth grade students will increase their Literal Understanding (3.1) skills<br />
as measured by the OCCT scores from 2010 – 2011 to 2011 – 2012. The Regular Education Students scored<br />
50% on Literal Understanding and will increase score by 25% by up to 75%.<br />
Fifth Grade Reading 3.3<br />
During the 2011 – 2012 school year, all fifth grade students will increase their Summary & Generalization (3.3)<br />
skills as measured by the OCCT scores from 2010 – 2011 to 2011 – 2012. The Regular Education Students<br />
scored 40% on Summary & Generalization and will increase score by 20% by up to 60%.<br />
Fifth Grade Reading 4.3<br />
During the 2011 ‐2012 school year, all fifth grade students will increase their Figurative Language/Sound<br />
Devices (4.3) skills as measured by the OCCT scores from 2010 – 2011 to 2011 – 2012. The Regular Education<br />
Students scored 38% on Figurative Language/Sound Devices and will increase score by 25% by up to 63%.<br />
Fifth Grade Math 1.2<br />
During the 2011‐2012 school year, the fifth grade students will improve their Problem Solving (1.2) skills by<br />
25% as measured by the OCCT scores from 2010‐2011 to 2011‐2012. This goal will increase the scores of<br />
Regular Education Students from 38% to 63%.<br />
Fifth Grade Math 3.1<br />
During the 2011‐2012 school year, the fifth grade students will improve their Estimation (3.1) skills by 25% as<br />
measured by the OCCT scores from 2010‐2011 to 2011‐2012. This goal will increase the scores of Regular<br />
Education Students from 38% to 63%.<br />
Fifth Grade Math 3.2<br />
During the 2011– 2012 school year, the fifth grade students will improve their Whole<br />
Numbers/Decimals/Fractions (3.2) skills by 25% as measured by the OCCT scores from 2010 – 2011 to 2011 ‐<br />
Page 12 of 44
<strong>Anderson</strong> <strong>Elementary</strong> School<br />
District: <strong>Tulsa</strong> <strong>Public</strong> <strong>Schools</strong><br />
2012. This goal will increase the scores of Regular Education Students from 38% to 63%.<br />
Fifth Grade Math 4.5<br />
During the 2011‐2012 school year, the fifth grade students will improve their Convert Measurements (4.5)<br />
skills by 25% as measured by the OCCT scores from 2010 – 2011 to 2011‐2012 . This goal will increase the<br />
scores of Regular Education Students from 25% to 50%.<br />
Fifth Grade Math 5.2<br />
During the 2011‐2012 school year, the fifth grade students will improve their Probability (5.2) skills by 25% as<br />
measured by the OCCT scores from 2010‐2011 to 2011‐2012. This goal will increase the scores of Regular<br />
Education Students from 25% to 50%.<br />
In addition to school‐wide goals, teachers set own goals based on their individual students’ data. Teachers<br />
identify which students they want to achieve what goals on a regular basis.<br />
DETERMINATION OF CAPACITY BY REVIEWERS AND COMMENTS<br />
A communication plan for involvement of all stakeholders in meeting annual goals<br />
DISTRICT EVIDENCE OF CAPACITY SUBMITTED FOR REVIEW<br />
Please see File 1‐Communications Plan in the site additional documentation folder. As this plan reveals, <strong>Tulsa</strong><br />
<strong>Public</strong> <strong>Schools</strong> is committed to open, honest and ongoing communication with stakeholders. The district<br />
understands communication is critical to achieving the district’s mission and its overall objectives. Its<br />
communication plan is aligned with the district’s core goals and will be incorporated into the district’s<br />
improvement plan. The communication plan has three overarching objectives:<br />
• Implement a communications program that directly helps the district achieve its strategic goals.<br />
• Foster strong relationships with district stakeholders.<br />
• Enable the district to present itself accurately to audiences.<br />
<strong>Anderson</strong> communicates with parents, students, and community stakeholders by way of a data wall and school<br />
goals posted on the wall when you first enter school. Teachers meet in collaborative meetings to plan and<br />
then as a whole group to plan across the grade levels using current Oklahoma PASS objectives as well as<br />
integrating Common Core when appropriate. This will help teachers begin the process of transitioning to full<br />
implementation of the Common Core curriculum by 2014.<br />
Next year, <strong>Anderson</strong> plans to host monthly meetings with parents to review data and district, school, and<br />
Page 13 of 44
<strong>Anderson</strong> <strong>Elementary</strong> School<br />
District: <strong>Tulsa</strong> <strong>Public</strong> <strong>Schools</strong><br />
student goals. <strong>Anderson</strong> will continue to utilize newsletters and Thursday folders as a way of communicating<br />
with stakeholders.<br />
DETERMINATION OF CAPACITY BY REVIEWERS AND COMMENTS<br />
Analysis of the percent of district’s annual goals that have been met each year for five years<br />
DISTRICT EVIDENCE OF CAPACITY SUBMITTED FOR REVIEW<br />
See, in part, documents in File 10‐ Strategic Goals provided with regard to “Strategic, yet attainable, goals at<br />
the district and school level (including goals for each subgroup).” As evidenced within those pages, the District<br />
has an unusually aggressive performance management system underway that requires frequent assessment of<br />
the District's success in meeting its goals. The District has defined meaningful, student achievement‐focused<br />
metrics and is in the process of collecting performance data.<br />
DETERMINATION OF CAPACITY BY REVIEWERS AND COMMENTS<br />
Academic Supports<br />
District curriculum aligned to state standards<br />
DISTRICT EVIDENCE OF CAPACITY SUBMITTED FOR REVIEW<br />
A transition plan is developed for Common Core State Standards to be fully implemented by 2014. (Refer to<br />
TPS CCSS Implementation Plan attached). The Office of Curriculum and Instruction has utilized the OK State<br />
Department’s curriculum resources to develop a pacing calendar and scope and sequence aligned with state<br />
standards. The curriculum department works with teachers and administrators in aligning and unwrapping<br />
state standards for clearer delivery of instruction. Grades K‐2 in language arts are written to Common Core<br />
State Standards with plans for further writing in math, science and social studies in 2012 and beyond until all<br />
content areas are aligned to CCSS. The district plans to utilize the commoncore.org resources as well as<br />
Page 14 of 44
<strong>Anderson</strong> <strong>Elementary</strong> School<br />
District: <strong>Tulsa</strong> <strong>Public</strong> <strong>Schools</strong><br />
unwrap priority standards in writing K‐2 for 2012 implementation in 2012‐13 and beyond. We utilize the<br />
research of Larry Ainsworth and the consultant from The Leadership and Learning Center to further this work<br />
in the district.<br />
<strong>Anderson</strong> <strong>Elementary</strong> School staff participated in several sessions with the Learning Keys/Flippen groups,<br />
national school improvement consultants, and a core group of teachers and district staff to work on aligning<br />
the PASS standards with the core curriculum standards. Teachers were provided curriculum binders including<br />
lessons for reading and math; this curriculum utilizes both PASS and Common Core. The teacher implements<br />
the curriculum on a daily basis, and the Staff Development Teacher and administration monitor and evaluate<br />
the progress. <strong>Anderson</strong> plans to utilize the District’s Dashboard capabilities further, specifically when<br />
identifying discrepancies between report card grades and standardized test scores.<br />
DETERMINATION OF CAPACITY BY REVIEWERS AND COMMENTS<br />
School and classroom alignment to district curriculum expectations<br />
DISTRICT EVIDENCE OF CAPACITY SUBMITTED FOR REVIEW<br />
In 2010, TPS began training teachers in curriculum design. Based on the work of Curriculum Development<br />
Using Backwards Design Method, Wiggins & McTighe, over 200 teachers were trained in writing curriculum<br />
maps, units and sample assessments. Nearly every school was represented by at least one teacher and in<br />
many instances several teachers. The goal was to prepare teachers in effectively aligning instruction to<br />
standards. Further work continues as each session of the Principals Leadership Conference focuses on at least<br />
one session dedicated to curriculum expectations.<br />
Educational Consultant Services, Focus on Results, Flippen Group and Leadership and Learning Center<br />
(consultant groups working in the district), provide individual school teams with classroom alignment to district<br />
curriculum development and expectations, providing training on topics including unwrapping standards,<br />
creating lesson plans aligned to standards, and identifying priority standards for instructional emphasis.<br />
In 2012, the district curriculum department will roll out a K‐2 curriculum design addressing the priority writing<br />
standards fully aligned with CCSS. This will be clearly communicated to schools prior to implementation in the<br />
Fall of 2012.<br />
A newly reorganized and restructured Office of Curriculum and instruction has eliminated previous positions<br />
Page 15 of 44
<strong>Anderson</strong> <strong>Elementary</strong> School<br />
District: <strong>Tulsa</strong> <strong>Public</strong> <strong>Schools</strong><br />
and hired Academic Coordinators and the School Improvement Office in 2011. These staff are responsible for<br />
developing and supporting the campus leadership teams who are then responsible for developing and<br />
supporting teachers and other campus staff with a focus on curriculum and aligning instruction to curriculum.<br />
The newly created Staff Development Teacher Project (2011) hired 38 Staff Development Teachers for each<br />
priority school to provide job‐embedded professional development at each of the priority schools. They are<br />
considered a major factor in facilitating and bridging district curriculum toward school and classroom<br />
alignment.<br />
As mentioned previously, teachers meet in collaborative groups to plan and then as a whole staff group to plan<br />
across the grade levels using current Oklahoma PASS objectives as well as integrating Common Core when<br />
appropriate. This will help teachers begin the process of transitioning to full implementation of the Common<br />
Core curriculum by 2014.<br />
As a means of monitoring classroom alignment to district and state goals, teachers are required to submit<br />
lesson plans weekly. The lesson plan template provides a place to identify the PASS or Common Core<br />
standard, as well as any interventions planned for the lesson.<br />
DETERMINATION OF CAPACITY BY REVIEWERS AND COMMENTS<br />
A plan for periodic progress monitoring in reading/language arts<br />
DISTRICT EVIDENCE OF CAPACITY SUBMITTED FOR REVIEW<br />
Data‐review teams (cross‐departmental) will analyze multiple indicators of student progress in<br />
reading/Language arts. Teams will be assigned based on the needs of the schools derived from a<br />
comprehensive review and interpretation of data. Content area specialists, as well as ELL, Special Education,<br />
School Improvement, Academic Coordinators, Staff Development Teachers, leadership and accountability will<br />
receive training in coaching and data analysis to ensure all team members are expert in progress monitoring<br />
and being a support to schools. Various data will be monitored including early childhood literacy, DIBELS,<br />
benchmarks, common assessments, Lexiles scores, and instructional programs.<br />
Beyond the three required screenings each year, using DIBELS, Literacy First or Scholastic Reading Inventory,<br />
students are to be progress monitored at least every two weeks using the progress monitoring assessments<br />
associated with the screening tools. The Data‐review teams will be responsible for monitoring the progress of<br />
students monthly and will determine appropriate next steps if adequate gains are not evident. The Staff<br />
Development Teacher serves as an important factor for progress monitoring and job‐embedded professional<br />
Page 16 of 44
<strong>Anderson</strong> <strong>Elementary</strong> School<br />
District: <strong>Tulsa</strong> <strong>Public</strong> <strong>Schools</strong><br />
development at each school site to ensure implementation of strategies recommended by the data review<br />
teams.<br />
DIBELS has a built‐in progress monitoring schedule, which tells teachers when to do things, as well as what to<br />
do with the data DIBELS provides. <strong>Anderson</strong> utilizes Title I funds to provide a reading interventionist. This<br />
reading interventionist, in conjunction with the Staff Development Teacher, meets with teachers on a regular<br />
basis to compile, disaggregate, and analyze date.<br />
All schools utilize the vendor EduSoft for periodic benchmarking. The district provides a testing calendar which<br />
all schools are required to follow.<br />
In the future, <strong>Anderson</strong> plans to provide professional development to all teachers regarding how to create<br />
formative assessments in an attempt to build capacity. Additional training may be needed to increase the<br />
teachers’ knowledge in utilizing the data collected via formative assessment to further drive classroom<br />
instruction.<br />
Two additional items are included in the site’s additional documentation folder to demonstrate the<br />
district/school’s efforts to routinely monitor progress. The first is the implementation of the Scholastic<br />
Reading Inventory screening program for students in grades 4 through 11 in the months of October and May of<br />
each school year. The 2011‐12 year is the first year that this program was implemented. The fall screening<br />
results as developed and reported by the district to each school from the October 7, 2011 timeline are<br />
attached.<br />
The second item attached is the Value Added data collected for the school for a three‐year period. This data<br />
demonstrates efforts underway to conduct a comprehensive progress review at the student, classroom, and<br />
school site level.<br />
DETERMINATION OF CAPACITY BY REVIEWERS AND COMMENTS<br />
A plan for periodic progress monitoring in mathematics<br />
DISTRICT EVIDENCE OF CAPACITY SUBMITTED FOR REVIEW<br />
Data‐review teams (cross‐departmental) will analyze multiple indicators of student progress in mathematics.<br />
Teams will be assigned based on the needs of the schools derived from a comprehensive review and<br />
Page 17 of 44
<strong>Anderson</strong> <strong>Elementary</strong> School<br />
District: <strong>Tulsa</strong> <strong>Public</strong> <strong>Schools</strong><br />
interpretation of data. Content area specialists as well as ELL, Special Education, School Improvement,<br />
Academic Coordinators, Staff Development Teachers, leadership and accountability will receive training in<br />
coaching and data analysis to ensure all team members are expert in progress monitoring and being a support<br />
to schools. Various data will be monitored including benchmarks, common assessments, and instructional<br />
programs. Data on literacy levels will also be assessed, as literacy is the foundation for learning in all content<br />
areas.<br />
The Staff Development Teacher serves as an important factor for progress monitoring and job‐embedded<br />
professional development at each school site to ensure implementation of strategies recommended by the<br />
data review teams.<br />
All schools utilize the vendor EduSoft for periodic benchmarking. The district provides a testing calendar which<br />
all schools are required to follow.<br />
In the future, <strong>Anderson</strong> plans to provide professional development to all teachers regarding how to create<br />
formative assessments in an attempt to build capacity. Additional training may be needed to increase the<br />
teachers’ knowledge in utilizing the data collected via formative assessment to further drive classroom<br />
instruction.<br />
Please see the Value Added data collected for the school for a three‐year period in the site additional<br />
documentation folder. This data demonstrates efforts underway to conduct a comprehensive progress review<br />
at the student, classroom, and school site level.<br />
DETERMINATION OF CAPACITY BY REVIEWERS AND COMMENTS<br />
Periodic benchmark assessments aligned to state standards<br />
DISTRICT EVIDENCE OF CAPACITY SUBMITTED FOR REVIEW<br />
The district administers four benchmarks aligned with state standards and the district’s pacing calendar. The<br />
benchmarks are derived from the current Edusoft system. While a testing bank of questions provided from<br />
Edusoft is limited in the number of higher level questions, the district curriculum department writes and aligns<br />
benchmark questions to assure depth of knowledge using guide lines provided by the State. In 2012‐13, the<br />
curriculum department will include at least one writing benchmark administered to all grade levels K‐12,<br />
aligned with CCSS. This benchmark will be scored by teachers as we encourage collaborative scoring in<br />
Professional Learning Communities (PLCs). Curriculum staff engages teachers, with support from the teachers’<br />
union, in reviewing benchmarks which may include making recommendations for revisions and or editing<br />
Page 18 of 44
<strong>Anderson</strong> <strong>Elementary</strong> School<br />
District: <strong>Tulsa</strong> <strong>Public</strong> <strong>Schools</strong><br />
benchmarks prior to administration.<br />
All schools utilize the vendor EduSoft for periodic benchmarking. The district provides a testing calendar which<br />
all schools are required to follow.<br />
DETERMINATION OF CAPACITY BY REVIEWERS AND COMMENTS<br />
Use of periodic benchmark assessments and other student data to inform classroom instruction<br />
DISTRICT EVIDENCE OF CAPACITY SUBMITTED FOR REVIEW<br />
Through the district’s newly created positions of Staff Development Teachers, benchmark assessments and<br />
other data are studied and analyzed in training sessions. While schools are to independently use benchmark<br />
data to inform classroom instruction, this new position is supported by the Office of Curriculum and<br />
Instruction, during bi‐weekly trainings focused on job‐embedded professional development. One of the many<br />
PD sessions includes using data to inform classroom instruction. Staff Development Teachers use their school’s<br />
data during these PD sessions and are equipped to deliver support to their schools.<br />
DETERMINATION OF CAPACITY BY REVIEWERS AND COMMENTS<br />
Timely, effective student interventions in classrooms<br />
DISTRICT EVIDENCE OF CAPACITY SUBMITTED FOR REVIEW<br />
Each site’s OSDE approved WISE plan is presented in the site additional documentation folder as evidence<br />
supporting this criterion.<br />
Further, the offices of <strong>Elementary</strong> and Secondary <strong>Schools</strong> use a Mid‐Year Review and End‐of‐Year Review<br />
process with four major purposes in mind. One of these purposes is to provide documented evidence of<br />
understanding within building leadership (and district supervisors) of school‐level student, staff, and<br />
Page 19 of 44
<strong>Anderson</strong> <strong>Elementary</strong> School<br />
District: <strong>Tulsa</strong> <strong>Public</strong> <strong>Schools</strong><br />
stakeholder data at the half‐way point in the school year. A second purpose is to ensure that these<br />
understanding results in action steps and specific interventions designed to foster continuous school<br />
improvement. This is demonstrated in the staff’s Professional Learning Community (PLC) work and by studentspecific<br />
Response to Interventions (RTI).<br />
Teachers and staff utilize DIBELS as classroom intervention for primary grades, and Fountas and Pinnell for<br />
intermediate grade levels. The Reading Interventionist and Staff Development Teacher meets with teachers to<br />
analyze data and decide a course of action for individual students. These data teams/PLC’s meet on Mondays;<br />
the following week teachers adjust their lesson plans accordingly. Within the lesson plan template, there is a<br />
section to identify interventions; teachers turn in lesson plans on Fridays.<br />
DETERMINATION OF CAPACITY BY REVIEWERS AND COMMENTS<br />
Data system that collects, stores, and disseminates timely school‐ and student‐level academic data<br />
DISTRICT EVIDENCE OF CAPACITY SUBMITTED FOR REVIEW<br />
The District has developed a dashboard system of collecting and disseminating to principals and other staff<br />
information regarding student demographic, student enrollment, student discipline, academic performance,<br />
OCCT and EOI performance. The dashboard data can be disaggregated by three distinct levels; District, School<br />
Level and Student. Four specific screen shots of this data are in the site folder; please see File 2‐Data System<br />
Screen Shots.<br />
<strong>Tulsa</strong> <strong>Public</strong> <strong>Schools</strong>’ data collection system consists of the student’s cumulative data being located on<br />
PowerSchool and the district’s Dashboard system. Through Edusoft, benchmark data is available after student<br />
assessments are conducted. The information from PowerSchool and dashboard is easily assessable to the user.<br />
Trainings are conducted for teachers, staff and administration. Teachers and parents also have access to this<br />
database in order to access student records. The dashboard data details attendance, grades, discipline reports<br />
and testing information. As mentioned in other questions, <strong>Anderson</strong> also utilizes the data collection systems<br />
provided with DIBELS and Fountas and Pinnell.<br />
Page 20 of 44
<strong>Anderson</strong> <strong>Elementary</strong> School<br />
District: <strong>Tulsa</strong> <strong>Public</strong> <strong>Schools</strong><br />
DETERMINATION OF CAPACITY BY REVIEWERS AND COMMENTS<br />
Timely and equitable distribution of textbooks and instructional materials aligned to state standards<br />
DISTRICT EVIDENCE OF CAPACITY SUBMITTED FOR REVIEW<br />
<strong>Anderson</strong> <strong>Elementary</strong> School currently uses its teacher leaders to identify what textbooks need to be ordered<br />
and disseminated to staff. At the beginning of the year, the staff development teacher was charged with<br />
ensuring we collected this information in a timely manner in order to place all orders. In order to ensure all<br />
teachers received what they needed, teacher leaders met with their grade‐level teams for input concerning<br />
what materials needed to be ordered. Before any order was placed, the principal had to approve it.<br />
The following will be implemented as we transition into next school year:<br />
• Conduct an end‐of‐the‐year inventory of all curriculum materials in May, 2012<br />
• Store curriculum materials in a location agreed upon by staff<br />
• Teacher leaders will meet with grade‐level teams to reflect on what curriculum materials need to be<br />
ordered for next school year<br />
• Teacher leaders will meet with the principal to discuss orders for all curriculum materials<br />
• Teacher leaders will conduct another inventory at the beginning of next school year to determine<br />
additional needs with each grade‐level team<br />
• Submit final orders to the principal for approval<br />
• Principal places order for all curriculum materials<br />
DETERMINATION OF CAPACITY BY REVIEWERS AND COMMENTS<br />
Page 21 of 44
<strong>Anderson</strong> <strong>Elementary</strong> School<br />
District: <strong>Tulsa</strong> <strong>Public</strong> <strong>Schools</strong><br />
Timely district interventions when a school is not making progress<br />
DISTRICT EVIDENCE OF CAPACITY SUBMITTED FOR REVIEW<br />
Please see attached 11‐ Menu of Strategies for Turnaround School Implementation files in the site additional<br />
documentation folder. In addition, a specific plan was developed for elementary schools; this document is<br />
labeled File 12 ‐<strong>Elementary</strong> School Timely District Intervention.<br />
DETERMINATION OF CAPACITY BY REVIEWERS AND COMMENTS<br />
School board’s unified vision for school improvement<br />
DISTRICT EVIDENCE OF CAPACITY SUBMITTED FOR REVIEW<br />
Please see File 10‐ Strategic Goals which is located in the site additional documentation folder. In particular,<br />
please review the Board’s Strategic Plan, its Vision, and its Core Goals. As those documents reveal, the<br />
District’s vision for school improvement is embodied within its overall vision of Excellence and High<br />
Expectations with a Commitment to All. Supporting that vision are the descriptions of the five core goals:<br />
• Student Achievement–Each student will meet or exceed state and national standards by demonstrating<br />
mastery of a rigorous curriculum that provides a foundation for success in career readiness or college<br />
preparedness and beyond.<br />
• Teacher and Leader Effectiveness–Assure that <strong>Tulsa</strong> <strong>Public</strong> <strong>Schools</strong> has an effective teacher in every<br />
classroom, an effective principal in every building and an effective employee in every position.<br />
• Performance‐Based Culture–Create an environment for sustainable performance improvement and<br />
accomplishment of the District’s Vision, Mission, Core Goals and Core Beliefs.<br />
• Financial Sustainability–Seek, organize and optimize resources for improved academic results.<br />
• Safe and Secure <strong>Schools</strong>–Ensure the safety and security of all students and staff throughout the District.<br />
DETERMINATION OF CAPACITY BY REVIEWERS AND COMMENTS<br />
Page 22 of 44
<strong>Anderson</strong> <strong>Elementary</strong> School<br />
District: <strong>Tulsa</strong> <strong>Public</strong> <strong>Schools</strong><br />
Organizational Supports<br />
Human resource policies that effectively recruit, hire, induct, and retain effective school personnel and release<br />
ineffective personnel in a timely manner<br />
DISTRICT EVIDENCE OF CAPACITY SUBMITTED FOR REVIEW<br />
Please see File 7‐Human Resource Policies in the site additional documentation folder. <strong>Tulsa</strong> <strong>Public</strong> <strong>Schools</strong> has<br />
many noteworthy policies and strategies regarding the effective recruitment, hiring, induction and retention of<br />
effective school personnel and the release of ineffective personnel in a timely manner. As noted within these<br />
documents, many of these initiatives began in the 2010 to 2011 timeframe and are already bearing fruit. The<br />
District’s Office of Teacher and Leader Effectiveness, whose work is supported by the Bill and Melinda Gates<br />
Foundation, leads much of this work.<br />
DETERMINATION OF CAPACITY BY REVIEWERS AND COMMENTS<br />
Timeline to place certified personnel at the site when filling vacancies<br />
DISTRICT EVIDENCE OF CAPACITY SUBMITTED FOR REVIEW<br />
<strong>Tulsa</strong> <strong>Public</strong> <strong>Schools</strong> has well established processes and personnel to process and place certified personnel at<br />
the site when filling vacancies. Using “finishers”—Human Capital personnel dedicated to processing the<br />
paperwork and background checks of personnel at District schools—the District places new certified personnel<br />
within a week of their accepting a job offer.<br />
DETERMINATION OF CAPACITY BY REVIEWERS AND COMMENTS<br />
Page 23 of 44
<strong>Anderson</strong> <strong>Elementary</strong> School<br />
District: <strong>Tulsa</strong> <strong>Public</strong> <strong>Schools</strong><br />
Equitable distribution of highly qualified and effective teachers<br />
DISTRICT EVIDENCE OF CAPACITY SUBMITTED FOR REVIEW<br />
Please see File 4‐Equitable Distribution in the site additional documentation folder. With regard to highly<br />
qualified teachers, this document reveals that 100% of the Priority <strong>Schools</strong>’ core teachers are highly qualified.<br />
With respect to effective teachers, the District provides rich detail in this document that describes the<br />
distribution of teachers in terms of their value‐added scores, including comparison data to non‐Priority<br />
<strong>Schools</strong>. Please note that, in general terms, a value‐added score estimates how much a teacher impacted his<br />
or her students’ learning (student growth) over the course of the school year, controlling for the student’s<br />
starting point and other factors that influence student achievement that are outside the control of the teacher.<br />
The District’s value‐added scores are distributed on a 1 to 5 point scale, with three being the District’s average<br />
for that grade/course. Teachers whose students grow more than predicted (more than the District average for<br />
similarly situated students) are high value‐added teachers and teachers whose students grow less than<br />
predicted are low value‐added.<br />
The data within File 4‐Equitable Distribution reveals that some Priority <strong>Schools</strong> have a disproportionately high<br />
number of low value‐added teachers and that some Priority <strong>Schools</strong> have, on average, higher value‐added<br />
teachers. As explained within other sections of the capacity documentation, the District is leveraging this new<br />
information and will be using it for recruitment, retention, and placement initiatives.<br />
DETERMINATION OF CAPACITY BY REVIEWERS AND COMMENTS<br />
Strategies for recruitment of teachers and administrators<br />
DISTRICT EVIDENCE OF CAPACITY SUBMITTED FOR REVIEW<br />
Information responsive to this request is found in the response to the request for information regarding<br />
“Effective recruitment, hiring, induction and retention of effective school personnel and the release of<br />
ineffective personnel in a timely manner.” Please see File 7‐Human Resource Policies file in the site additional<br />
documentation folder.<br />
This document describes the District’s use of several significant recruitment strategies for teachers and<br />
leaders, including, but not limited to:<br />
Page 24 of 44
<strong>Anderson</strong> <strong>Elementary</strong> School<br />
District: <strong>Tulsa</strong> <strong>Public</strong> <strong>Schools</strong><br />
• Teach For America<br />
• Urban Educator Pipeline Programs with Higher Ed Partners<br />
• Gallup Insight Tools<br />
• TPS Leadership Development Program<br />
• Assistant Principal Internship Program Pilot<br />
• Emerging Leadership Academy<br />
DETERMINATION OF CAPACITY BY REVIEWERS AND COMMENTS<br />
Information technology supports aligned with district/school academic goals<br />
DISTRICT EVIDENCE OF CAPACITY SUBMITTED FOR REVIEW<br />
Please see File 8‐ Information Technology Supports in the site additional documentation folder.<br />
As this document reveals, the District has an impressive Student Progress Portal for its teachers, leaders and<br />
the public at large to communicate its Strategic Plan and its Value‐Added initiative. This portal has reports,<br />
webinars, videos and FAQs as well as opportunities for input.<br />
DETERMINATION OF CAPACITY BY REVIEWERS AND COMMENTS<br />
Page 25 of 44
<strong>Anderson</strong> <strong>Elementary</strong> School<br />
District: <strong>Tulsa</strong> <strong>Public</strong> <strong>Schools</strong><br />
Transportation aligned with district/school academic goals (District transportation ensures students are in<br />
school prior to start of school day. Bus schedules ensure students attend school in a timely manner.)<br />
DISTRICT EVIDENCE OF CAPACITY SUBMITTED FOR REVIEW<br />
Mission of Transportation Department: To ensure a quality school bus ride to and from school so as to<br />
support a positive learning experience for every student, every day, without exception.<br />
Department Goal: To provide prompt and efficient transportation services to support a positive learning<br />
environment.<br />
Description of Work: Quality School Bus Ride:<br />
• On schedule pick‐up and delivery for all students every time.<br />
• A safe and secure school bus stop and ride.<br />
• An orderly school bus at all times.<br />
• Consistency of action for all student management on the school bus.<br />
Fact Facts: TPS Transportation is the second largest pupil transportation operation in the state of Oklahoma.<br />
TPS transports over 15,000 students daily on the largest fleet of CNG vehicles in the state. More than 300 staff<br />
members effectively support the following five major department business functions:<br />
1. Transportation Services<br />
2. Student routing and scheduling<br />
3. Safety and training<br />
4. Fleet Maintenance<br />
5. Fiscal accountability<br />
DETERMINATION OF CAPACITY BY REVIEWERS AND COMMENTS<br />
Local, state, and federal funds aligned to subgroup academic goals<br />
DISTRICT EVIDENCE OF CAPACITY SUBMITTED FOR REVIEW<br />
<strong>Anderson</strong> <strong>Elementary</strong> School uses its local, state, and federal funds in a variety of ways to support academic<br />
achievement.<br />
Local funds are being utilized to support the following items:<br />
• Ensure teachers have adequate supplies for their classroom<br />
• Provide sufficient copy paper for teachers to fully implement the curriculum<br />
Page 26 of 44
<strong>Anderson</strong> <strong>Elementary</strong> School<br />
District: <strong>Tulsa</strong> <strong>Public</strong> <strong>Schools</strong><br />
• Provide substitutes for teachers to collaborate and/or attend professional development trainings<br />
• Purchase curriculum materials such as textbooks to support the instructional program<br />
• Offer stipends for all special assignmentso<br />
Teacher leaders – these individuals meet with me biweekly to discuss reading and mathematics<br />
priorities<br />
o Teacher‐in‐Charge – this individual helps to ensure the instructional program is being fully<br />
implemented, particularly whenever administration is out of the building for any reason.<br />
o Testing Coordinator – this person is in charge of ensuring we are in compliance with regulations<br />
concerning statewide testing<br />
o Safety Patrol – this is a group of students led by a teacher who help to support a safe, learning<br />
environment<br />
o Leadership Teams (e.g., safe school committee, advisory committee, etc.) – several of these<br />
teams contribute to continuous learning at the school in a variety of ways through collaboration<br />
Federal funds are being utilized to support the following items:<br />
• After school tutoring services for students below proficiency<br />
• Classroom libraries for various grade levels<br />
• A reading interventionist teacher to support teachers with the implementation of the instructional<br />
program (e.g., DIBELS, SRA, etc)<br />
• Professional development provided by a consultant<br />
• The school’s parent facilitator is used to foster parent‐school involvement<br />
• Reading and mathematics supplemental materials are purchased to support the regular instructional<br />
program<br />
• Sponsor events that encourage parental engagement such as supplemental parent/teacher conferences<br />
(over and above what the district requires), literacy night, etc.<br />
Below are some objectives for next school year’s budget:<br />
• Field trips will be encouraged at the beginning of each unit of instruction next school year<br />
• Research for Better Teaching Skillful Teacher – will be utilized to build teachers’ instructional capacity<br />
• Writer’s Workshop will be utilized to support the school and district’s writing initiative<br />
Use and Alignment of Philanthropic Funds<br />
The District uses national and local foundation support to fund key Teacher and Leader Effectiveness initiatives<br />
focused on reducing the achievement gap and raising students’ college and career readiness. The Bill and<br />
Melinda Gates Foundation and a consortium of <strong>Tulsa</strong> civic donors provide support for the implementation of<br />
district reform strategies that will lead to gains in student achievement across racial/ethnic and socioeconomic<br />
subgroups. These goals—including specific subgroup academic goals—are detailed in File 13—TLE<br />
Funding Objectives and Progress Report and are aligned with the District’s core goals of Student Achievement,<br />
Teacher/Leader Effectiveness and Performance‐Based Culture. In particular, philanthropic support is being<br />
been used to:<br />
• Develop and support the deployment of teacher performance standards<br />
• Implement the District’s research‐based evaluation rubric<br />
• Reorganize the human capital department (complete)<br />
Page 27 of 44
<strong>Anderson</strong> <strong>Elementary</strong> School<br />
District: <strong>Tulsa</strong> <strong>Public</strong> <strong>Schools</strong><br />
• Develop and support the rollout of a value added data system for schools and teachers<br />
• Design and provide professional development for teachers and leaders on the use of value added data<br />
to improve instruction and to determine which practices and programs are having the greatest impact<br />
on student learning<br />
• Develop leadership pipelines to identify, recruit, and develop future principals who will positively<br />
impact academic performance<br />
DETERMINATION OF CAPACITY BY REVIEWERS AND COMMENTS<br />
Local, state, and federal funds use to purchase research‐based programs, materials, and professional learning<br />
opportunities<br />
DISTRICT EVIDENCE OF CAPACITY SUBMITTED FOR REVIEW<br />
<strong>Anderson</strong> <strong>Elementary</strong> School’s leadership team collaborates to determine appropriate research‐based<br />
programs, materials and professional learning opportunities for staff. Currently the leadership team is<br />
comprised of the principal, counselor, special education coordinator, assistant principal, librarian, teacher<br />
leaders, reading interventionist, staff development teacher, and parent facilitator.<br />
• Research‐based reading programs such as SRA, DIBELS, and Fountas and Pinnell<br />
• Professional development is provided to build staff capacity around instructional best practices given by<br />
various consultants such as the Flippen Learning Group, Discovery Learning, teacher leaders, etc.<br />
• A reading interventionist is being used to support teachers with the implementation of the various<br />
research‐based programs being offered – SRA and DIBELS.<br />
Use of Philanthropic Funds<br />
The District uses national and local foundation support to purchase research‐based programs, materials and<br />
professional development that support its Teacher and Leader Effectiveness initiatives. In particular,<br />
philanthropic support is being been used to:<br />
• Develop and support the deployment of research‐based teacher performance standards<br />
• Implement the District’s research‐based evaluation rubric<br />
• Develop and support the rollout of a value added data system for schools and teachers<br />
• Design and provide professional development for teachers and leaders on the use of value added data<br />
to improve instruction and to determine which practices and programs are having the greatest impact<br />
Page 28 of 44
<strong>Anderson</strong> <strong>Elementary</strong> School<br />
District: <strong>Tulsa</strong> <strong>Public</strong> <strong>Schools</strong><br />
on student learning<br />
• Develop leadership pipelines to identify, recruit, and develop future principals who will positively<br />
impact academic performance<br />
DETERMINATION OF CAPACITY BY REVIEWERS AND COMMENTS<br />
Special Education resources aligned with the needs of the students<br />
DISTRICT EVIDENCE OF CAPACITY SUBMITTED FOR REVIEW<br />
Special education teachers and paraprofessionals are allocated to schools based on the services provided on<br />
the IEPs. When an IEP is developed for a student, it is noted on the IEP how the services are delivered.<br />
Information is compiled for all the students in that school and is used to determine the allocation. In addition,<br />
there are Centralized programs are located throughout the district for students with autism, emotional<br />
disturbances, multiple disabilities, and PK students with developmental delays that need a greater level of<br />
service than is typically available at their home school. These programs are heavily staffed in order to provide<br />
the support these students need.<br />
The Special Education department has coordinators that serve elementary and secondary schools as well as<br />
coordinators for specific disabilities. Each coordinator maintains a small budget to have available for<br />
purchasing items requested for programs. If a school makes a request larger than their budget allows, we<br />
determine if the departmental budget can fund the request. The coordinators assist teachers with any<br />
questions they may have from curriculum to services to paperwork.<br />
Technology purchases for all programs have been a focus of the Special Education department. We try to<br />
assure that all teachers have current technology. In schools that house Centralized programs, we do not want<br />
a school to carry the entire responsibility for outfitting those programs when they have been open to taking<br />
students from other schools.<br />
At <strong>Anderson</strong>, Special Education teachers plan with grade level teachers twice a month. Special education<br />
teachers utilize the same curriculum as the non‐special education students. Special Education resources are<br />
aligned to the needs of the students due the consistent monitoring of the needs of the special education<br />
students’ IEP’s. Special education files are reviewed by the special education department chair, teachers, and<br />
parents in order to ensure that students are placed appropriately and able to receive the accommodations and<br />
modifications necessary. Special education students’ OCCT testing history is also monitored in order to make<br />
Page 29 of 44
<strong>Anderson</strong> <strong>Elementary</strong> School<br />
District: <strong>Tulsa</strong> <strong>Public</strong> <strong>Schools</strong><br />
sure that they receive the appropriate OCCT test based on their academic needs.<br />
DETERMINATION OF CAPACITY BY REVIEWERS AND COMMENTS<br />
English Language Learner resources aligned with the needs of the students<br />
DISTRICT EVIDENCE OF CAPACITY SUBMITTED FOR REVIEW<br />
<strong>Tulsa</strong> <strong>Public</strong> <strong>Schools</strong>' English Language Development programs offered to LEP students are designed to<br />
accelerate students’ English proficiency and to meet challenging state academic standards. The programs are<br />
offered to assist students in Pre‐K‐12th grades with achieving proficiency in each of the four domains of<br />
language development by using proven strategies that are aligned with state standards and assessments which<br />
are scientifically research based.<br />
The elementary level language program offered to District LEP students in Pre‐K ‐ 5th grades is met by a variety<br />
of instructional delivery programs at each of the school sites and it is dependent on the site's individual<br />
population characteristics such as level of students proficiency in English, newcomer status, previous<br />
instruction in English, etc. Models of instruction offered include: self‐contained classrooms, inclusion,<br />
structured immersion, resource or pullout. Students are provided English language instruction by certified<br />
teachers allocated for ELL as per the TPS Staffing Formula. Some of the elementary ELL instructors also assist<br />
LEP students in their classroom working with the regular classroom teachers through SIOP.<br />
The secondary language program offered to District LEP students in grades 6 ‐ 12 follows a collaborative team<br />
model. Each secondary school site selects the model(s) which best serve their population. The SIOP model is<br />
utilized for planning and delivery of instruction when the students are mainstreamed into the core curriculum.<br />
Principals are strongly encouraged to have all of their core subject teachers SIOP trained. A cadre of district<br />
resource instructional specialists and curriculum specialists have received the SIOP Coaching Implementation<br />
training and will assist, model, coach, and support the core teachers with the SIOP's eight components and<br />
thirty features. At some of the sites the ELL certified teachers travel with students to regular education core<br />
classrooms.<br />
<strong>Anderson</strong> is provided 1 ELL teacher as a teacher allocation. As with the Special Education teachers, our ELL<br />
teacher plans every other Monday with individual grade levels on a rotating basis. At <strong>Anderson</strong>, the ELL<br />
teacher provides support by way of coaching or modeling as well as providing support within the classroom to<br />
groups of students.<br />
Page 30 of 44
<strong>Anderson</strong> <strong>Elementary</strong> School<br />
District: <strong>Tulsa</strong> <strong>Public</strong> <strong>Schools</strong><br />
DETERMINATION OF CAPACITY BY REVIEWERS AND COMMENTS<br />
Plan for maintaining a safe and orderly environment<br />
DISTRICT EVIDENCE OF CAPACITY SUBMITTED FOR REVIEW<br />
<strong>Tulsa</strong> <strong>Public</strong> <strong>Schools</strong> Campus Police<br />
Mission: The Mission of the <strong>Tulsa</strong> <strong>Public</strong> <strong>Schools</strong> Campus Police Department is to provide a safe environment,<br />
free from fear and with emphasis on an improved quality of life within the School District for all students,<br />
faculty, staff and authorized visitors. We do so with pride, integrity and a commitment to quality services<br />
within the policing profession.<br />
Fast Facts: The <strong>Tulsa</strong> <strong>Public</strong> <strong>Schools</strong> Campus Police Department is comprised of 21 sworn police officers, 20<br />
security officers and 14 non‐sworn employees. We are a certified law enforcement agency with full police<br />
powers under statute of the State of Oklahoma.<br />
Description: Officers of the <strong>Tulsa</strong> <strong>Public</strong> <strong>Schools</strong> Campus Police Department are stationed at each High School<br />
site and are responsible for supervising the security staff and working in concert and cooperation with the<br />
building principal and school staff to provide a safe school environment. Campus Police administration<br />
maintain private security contracts that support our employees at both elementary and secondary schools<br />
across the district on a regular basis. We are also responsible for security services at over 600 special events<br />
(elementary and secondary), including all athletic events throughout the school year. In additional to policing<br />
services, the campus police are responsible for overseeing the emergency radio communication system for<br />
<strong>Tulsa</strong> <strong>Public</strong> <strong>Schools</strong>, monitoring and maintaining over 44,000 alarms on a 24/7 basis, nearly 2,400 surveillance<br />
cameras, and issues related to Emergency Management and Safety.<br />
DETERMINATION OF CAPACITY BY REVIEWERS AND COMMENTS<br />
Page 31 of 44
<strong>Anderson</strong> <strong>Elementary</strong> School<br />
District: <strong>Tulsa</strong> <strong>Public</strong> <strong>Schools</strong><br />
Strong Leadership<br />
Details of how performance of a current principal or a new principal (with a proven track record for turning<br />
around schools) will be reviewed for hiring, retention, or dismissal<br />
DISTRICT EVIDENCE OF CAPACITY SUBMITTED FOR REVIEW<br />
Leadership Review Process<br />
Mid‐Year Review Process<br />
<strong>Elementary</strong><br />
The purpose of the Mid‐Year Review process is to provide an opportunity for supervisors and employees to<br />
engage in a discussion regarding progress on site‐based annual goals. It is also an opportunity for supervisors<br />
to acknowledge and encourage good performance and address any possible issues that may have developed.<br />
Process:<br />
A. For Quarterly Review # 2, we request that principals develop a power point presentation to<br />
demonstrate progress in the following areas.<br />
Dashboard Data<br />
1. Attendance update<br />
‐ What are you doing to increase student attendance?<br />
2. Suspensions update<br />
3. School Wide Discipline Plan<br />
‐ If you have one in place, talk about how it is working.<br />
‐ If you do not have a plan in place ‐ What progress have you made toward developing a<br />
school wide discipline plan?<br />
Student Achievement Data<br />
4. District Benchmark data update – Have you seen improvement in student performance?<br />
5. What progress have you made toward utilizing In‐house formative assessments?<br />
6. Update on DIBELS Results & SRI student results<br />
7. How will you utilize your RSA funds? What materials will you purchase? Tutoring?<br />
8. How are students & teachers tracking data?<br />
9. How are you meeting the needs of students working below grade level in reading and math?<br />
PLC`s – Professional Development<br />
10. How are you utilizing PLC`s to improve student achievement?<br />
Page 32 of 44
<strong>Anderson</strong> <strong>Elementary</strong> School<br />
District: <strong>Tulsa</strong> <strong>Public</strong> <strong>Schools</strong><br />
11. What changes have you and your staff made as a result of PLC`s as it relates to:<br />
‐ Ensuring that students learn<br />
‐ Building a culture of collaboration<br />
‐ Focus on results<br />
B. Prepare a self‐evaluation utilizing the Principal Evaluation form. We are requesting supporting<br />
documentation for ratings of 4’s and 5’s.<br />
C. Below is the timeline for the above submissions:<br />
• March 15, 2012 ‐ PowerPoint and Self‐Evaluation documents are due to your first point of contact<br />
(Lovett, Swanson or House).<br />
• March 26 – April 6, 2012 – Performance Reviews scheduled for principals (3 years or less).<br />
• April 26‐May 17, 2012 – Performance Reviews scheduled for principals (4 years or more).<br />
For additional information, please see File 9‐Principal Performance in the site additional documentation folder.<br />
In this document, the District describes how it uses the <strong>Tulsa</strong> TLE Observation and Evaluation System to evaluate<br />
and support principals as well as guide performance‐based exits, as necessary. The TLE system, which incorporates<br />
the McREL Principal Evaluation Rubric, is an evidence‐based process of evaluation anchored in specific Domains,<br />
Dimensions and Indicators reflecting national best practices and current research regarding effective school<br />
leadership.<br />
DETERMINATION OF CAPACITY BY REVIEWERS AND COMMENTS<br />
Page 33 of 44
<strong>Anderson</strong> <strong>Elementary</strong> School<br />
District: <strong>Tulsa</strong> <strong>Public</strong> <strong>Schools</strong><br />
Details of how principals will be given operational flexibility in the areas of scheduling, staffing, curriculum, and<br />
budget<br />
DISTRICT EVIDENCE OF CAPACITY SUBMITTED FOR REVIEW<br />
Regarding Scheduling: All principals have flexibility in scheduling insofar as arranging student academic<br />
delivery within a general daily, weekly, monthly and yearly time‐frame that supports economic and<br />
stakeholder feasibility. Priority <strong>Schools</strong> make scheduling decisions based on student need data. Double<br />
blocking of specific subjects or content areas in high needs areas is common, but is ultimately the decision of<br />
the school principal along with the staff members at the school. Increasing instructional time is common (ie;<br />
Continuous Learning Calendar schools, extended day schools and – new for 2012 – expected increased time<br />
during summer for students who fall below performance expectations). Research based practices, as well as<br />
evidence‐driven local examples, are presented regularly to principals during planned district, state and national<br />
leadership development sessions. Principals regularly learn from one another and from their national peers –<br />
and embed successful practices in their own schools. Doug Reeves, Bob Marzano, Rick and Susan DeFour, Tony<br />
Wagner, Geoffery Canada and countless other nationally recognized leaders have personally lent their<br />
expertise to TPS principals – to learn and use practices that will increase learning at their schools.<br />
Regarding Staffing: Staffing decisions for placement and selection of teachers – especially in areas of most<br />
need (ie; placing the most effective teachers in subjects or grade levels where students most need teachers’<br />
individual expertise) – are building based decisions and the practice is supported by district leadership. District<br />
support includes prevention of poorly performing staff members from being “placed” at priority schools.<br />
Principals interview, from an approved pool of teachers who have met a specific criteria as analyzed by our<br />
district partners using the Gallup Insight (strength finder) specifically calibrated to determine promise for<br />
urban educator excellence.<br />
Regarding Curriculum: Student achievement data drive decisions at each school. <strong>Schools</strong> leadership focus on<br />
unpacking the content standards to meet student needs based on what the students’ achievement data tell<br />
them. The curriculum is standard – and will focus solely on Common Core expectations. Teacher and leaders,<br />
working in Professional Learning Communities, make decisions for individual students and schools. These<br />
decisions include specific instructional practices using the Common Core’s expectations ‐ all designed to<br />
improve student academic performance. The district supports schools with analysis of successful curricular<br />
interventions (ie; Doug Reeve’s curriculum audit) so that a choice menu is readily available for selection by<br />
principals and their teacher teams. Narrowing the plethora of interventions to only those with strong<br />
implementation records (especially locally) helps schools and principals to select promising practices – rather<br />
than stabbing blindly at the “intervention of the week.” The district further supports principals through staff<br />
and leadership development of skills in using rubrics to increase the level of implementation of successful<br />
practices. Strategically increasing building‐level conversations around implementation – rather than “trying<br />
new interventions” is critical to improving student achievement. Principals and teacher leaders are<br />
accountable for the decisions they make and for the outcomes of those decisions. This is reflected in their<br />
Mid‐Year and End‐of‐Year Reviews – and in their annual performance review.<br />
Regarding Budget: At each district building, principals decide individual budget and expenditures each year ‐<br />
based on student and staff needs. The decisions are based on data and research. TLE data drive staff<br />
development budget decisions. Student achievement data drive building decisions for yearly budgets in<br />
Page 34 of 44
<strong>Anderson</strong> <strong>Elementary</strong> School<br />
District: <strong>Tulsa</strong> <strong>Public</strong> <strong>Schools</strong><br />
curriculum or instructional delivery. For example: Data that reflects increased need for reading intervention<br />
drives a principal’s decision to increase funding for Read 180 licenses or increased staffing in this area. Or:<br />
Data that indicates need for engaging instructional practices, drives a principal’s decision to increase the<br />
budget for SmartBoards. The use of professional learning communities increases stakeholder input and<br />
therefore increase the likelihood of successful implementation of a particular budget strategy. Again,<br />
principals are held accountable for the decisions they make regarding use of budget authority. Student<br />
achievement and teacher value‐addedness are reflections of these budget decisions. Both are analyzed in<br />
annual principal and teacher leader performance reviews.<br />
DETERMINATION OF CAPACITY BY REVIEWERS AND COMMENTS<br />
Effective Teachers<br />
Details of how the performance of current teachers or new teachers (with proven track record for success in<br />
challenging schools) will be reviewed for hiring, retention, or dismissal<br />
DISTRICT EVIDENCE OF CAPACITY SUBMITTED FOR REVIEW<br />
Please see File 3‐Effective Teacher in site additional documentation folder. In this document, the District<br />
explains how it uses the <strong>Tulsa</strong> TLE Observation and Evaluation System to evaluate and support teachers as well<br />
as guide performance‐based hires, placements and exits. The TLE system, in use District‐wide since 2010‐2011,<br />
has been validated by third‐party researchers, meaning that its evaluation criteria and rankings are positively<br />
correlated with student achievement gains. The document also describes how the District is developing plans<br />
to use quantitative measures of teacher effectiveness (value‐added estimates) as a tool for recruiting and<br />
placing teachers according to their strengths.<br />
DETERMINATION OF CAPACITY BY REVIEWERS AND COMMENTS<br />
Page 35 of 44
<strong>Anderson</strong> <strong>Elementary</strong> School<br />
District: <strong>Tulsa</strong> <strong>Public</strong> <strong>Schools</strong><br />
Policy for preventing ineffective teachers to transfer to the school<br />
DISTRICT EVIDENCE OF CAPACITY SUBMITTED FOR REVIEW<br />
Ineffective teachers are prevented from transferring to a school insofar that voluntary transfer policies require<br />
that the teacher’s evaluation record be considered as a basis for determining whether or not to accept the<br />
transfer request.<br />
In the recent past, some schools have also been able to stock their teachers with highly effective teachers<br />
through the administrative transfer process and thereby preclude any openings that might be open to less<br />
effective teachers. This process has allowed those schools to fundamentally restructure their teacher<br />
workforce by “seeding” the teacher workforce with exemplary teachers. It is typically instigated at the<br />
Associate Superintendent’s level and, in some cases, coordinated with the direct input of the school principal.<br />
DETERMINATION OF CAPACITY BY REVIEWERS AND COMMENTS<br />
Extended Learning Time<br />
Plan for extended learning time (beyond the regular school day) for student learning and teacher collaboration<br />
DISTRICT EVIDENCE OF CAPACITY SUBMITTED FOR REVIEW<br />
<strong>Anderson</strong> <strong>Elementary</strong> School is offering a tutoring program after school for students who are below proficiency<br />
and commit to participate. Teachers were asked if they were interested in tutoring after school. This data was<br />
compiled to determine the number of teachers who would be hired to offer tutoring services. The tutoring<br />
program after school includes a pre and post‐test and formative weekly assessments. Teachers analyze data to<br />
determine student proficiency levels and reteach standards. Curriculum materials for tutoring are decided by<br />
the teachers. A teacher was hired to manage and evaluate the effectiveness of our tutoring program.<br />
• We will ensure after school tutoring begins earlier next school year, once universal screening data is<br />
retrieved and analyzed.<br />
• We also plan to offer Saturday School next school year for students<br />
Page 36 of 44
<strong>Anderson</strong> <strong>Elementary</strong> School<br />
District: <strong>Tulsa</strong> <strong>Public</strong> <strong>Schools</strong><br />
District Plan:<br />
Extended School Year with TFA<br />
In order to extend learning time beyond the regular day and provide meaningful training opportunities for<br />
many of TPS’ newest teachers, this summer <strong>Tulsa</strong> <strong>Public</strong> <strong>Schools</strong> will host its most widespread summer school<br />
program in recent history in collaboration with the Community Action Project (CAP), Teach For America (TFA),<br />
and the University of <strong>Tulsa</strong>. The district will have 6 elementary and 3 secondary sites. The sites are strategically<br />
located throughout the district’s boundaries in an attempt to offer the wealth of summer school programming<br />
to every student who wishes to attend.<br />
This extended‐year program, which lasts four weeks, will serve students needing extra instruction,<br />
remediation, or more time to prepare for the next grade. Students will be in class for a little over four hours<br />
each day.<br />
Working with both CAP and TFA, TPS’ curriculum and instruction team is developing a framework and vision for<br />
courses and grade‐levels to facilitate strong student achievement. The District will offer elementary students<br />
remediation in Math and Reading. Middle‐school students will receive a highly differentiated and in‐depth<br />
curriculum based upon the diagnostic data collected on each student. At the high‐school level, the District will<br />
offer credit‐recovery courses in the following areas: Algebra I, Algebra II, English I, English II, Geometry, and<br />
Biology.<br />
Faculty Advisors will work alongside both TFA staff and corps members to provide written and verbal feedback<br />
as well as model lessons in an effort to improve instruction, collaboration and teacher effectiveness. Site<br />
Administrators will use summer school as an opportunity to reflect on their own practices and develop plans to<br />
improve their own building the following school year. There will be approximately 3‐6 educators in each<br />
classroom teaching children. This will allow for increased differentiation in an effort to reach all students and<br />
prepare them for the next grade level. Selection of applicants will include the use of value‐added data as well<br />
as administrative recommendations so that strong instructional leaders will help students this summer.<br />
After‐School Tutoring<br />
Approximately 58% of <strong>Tulsa</strong> <strong>Public</strong> <strong>Schools</strong>’ Title I schools (42 out of 73) provide after school tutoring or<br />
intercession with their Title dollars. Tutoring is provided by highly qualified teachers in all applicable content<br />
areas. Ten out of the 18 Priority <strong>Schools</strong> provide after school tutoring or intercession.<br />
In addition, <strong>Tulsa</strong> <strong>Public</strong> <strong>Schools</strong> has contracted with 25 Supplemental Educational Services (SES) providers who<br />
provide additional remediation for all eligible students. To date, 2,351 students have selected an SES provider.<br />
This equates to an additional 49,324 hours of tutoring for our students.<br />
Citizen <strong>Schools</strong><br />
<strong>Tulsa</strong> <strong>Public</strong> <strong>Schools</strong> is currently exploring the option of partnering with Citizen <strong>Schools</strong> and providing extended<br />
learning time for our middle school students. The Citizen <strong>Schools</strong> program runs for three hours in the<br />
Page 37 of 44
<strong>Anderson</strong> <strong>Elementary</strong> School<br />
District: <strong>Tulsa</strong> <strong>Public</strong> <strong>Schools</strong><br />
afternoon, Monday‐Thursday, as an after‐school activity. There are four major components to the Citizen<br />
<strong>Schools</strong> program*:<br />
• Apprenticeships<br />
o Students discover new fields alongside adult volunteers—Citizen Teachers—who bring their<br />
expertise to life.<br />
o The hands‐on curricula, either pre‐written or created, link academic skills (aligned with common<br />
core standards) to college and career success<br />
o Projects build “21st Century Skills”: communication, collaboration, data analysis, advanced<br />
literacy, global awareness, effective reasoning, problem solving, innovation and technology<br />
o Students create and present an end product to share what they’ve learned with families,<br />
teachers, public officials, community members, and business leaders.<br />
• Academic Support<br />
o Focused learning time that emphasizes quality homework<br />
o Students work toward homework that is neat, complete, and turned in on time<br />
o Students apply the concept of effective effort towards school‐day success, and practice time<br />
management and self‐organization<br />
o Staff communicate with school‐day teachers to identify students’ homework assignments and<br />
projects, upcoming tests and quizzes, opportunities for extra credit, and missing or make‐up<br />
work<br />
o Targeted support and enrichment for Math or English Language Arts, depending on school<br />
strategy<br />
o Hands‐on curricula mapped to state standards and national common core standards<br />
• College to Career Connections<br />
o Unique curriculum introduces the idea of college and career readiness, laying a foundation of<br />
excellent study habits and skills for students at an early age<br />
o Units include school navigation, student success habits, college knowledge and grades coaching<br />
o Builds a community of achievers and trains them for a habit of success<br />
o 6th and 7th graders gain college exposure<br />
o 8th graders participate in 8th Grade Academy, receiving individualized support to prepare for<br />
college pathway high schools<br />
• Culture of Achievement<br />
*information adapted from http://www.citizenschools.org/about/model<br />
DETERMINATION OF CAPACITY BY REVIEWERS AND COMMENTS<br />
Page 38 of 44
<strong>Anderson</strong> <strong>Elementary</strong> School<br />
District: <strong>Tulsa</strong> <strong>Public</strong> <strong>Schools</strong><br />
Research‐Based Instruction<br />
Strong instructional program that is research‐based, rigorous, and aligned with state standards<br />
DISTRICT EVIDENCE OF CAPACITY SUBMITTED FOR REVIEW<br />
The Office of Curriculum and Instruction supports a research‐based model of Balanced Literacy for all<br />
<strong>Elementary</strong> <strong>Schools</strong> in the district. <strong>Schools</strong> have received a rubric detailing the six components of Balanced<br />
Literacy and will receive the first in a series of professional development sessions by Spring 2012. Additional<br />
training modules will be available to schools during the 2012‐13 school year, ensuring that all teachers have a<br />
clear understanding of balanced literacy and receive support in their implementation efforts. (Refer to<br />
Balanced Literacy Rubric, attached) Using the commoncore.org website, we use the common core units<br />
developed in English/Language Arts to guide instruction during the 2012‐13 school year in TPS.<br />
The district deploys the REAC³H Network toolkits to schools through the Academic Coordinators.<br />
• Toolkit #1 Making the Case for the Common Core – an Overview<br />
• Toolkit #2 Aligning School Curriculum to the Common Core<br />
• Toolkit #3 Changing Instruction for the Common Core<br />
• Toolkit #4 Developing Effective Teachers and Leaders for the Common Core<br />
• Toolkit #5 Assessing Student Performance for the Common Core<br />
• Toolkit #6 Using Data to Implement the Common Core<br />
• Toolkit #7 Integrating the Common Core across the Curriculum<br />
• Toolkit #8 Collaborating about the Common Core<br />
• Toolkits #9‐12: Focus determined through district input<br />
Numerous programs are being reviewed and some eliminated to ensure the district has a menu of instructional<br />
programs aligned with rigorous state standards. This is a process just beginning as a result of the<br />
Implementation Audit conducted in TPS utilizing the expertise of Dr. Doug Reeves and the Leadership and<br />
Learning Center.<br />
While curriculum units for mathematics, science, social studies and other contents have not been fully<br />
developed to the CCSS, we have informed our district schools of the rigor these standards require by bringing<br />
to TPS Skip Fennel and Phil Daro during the 2010 school year. These mathematicians are highly knowledgeable<br />
of the CCSS mathematics standards. All mathematics teachers and principals were invited to attend sessions.<br />
We are exploring mathematics “look‐fors” to assist teachers and leaders in recognizing and informing rigorous<br />
instructional practices.<br />
Further, a video prepared by our curriculum department with a facilitator’s guide was prepared and delivered<br />
electronically to all principals in the district at their request. This tool better equipped the principals as<br />
instructional leaders as they prepare their staffs for CCSS and rigorous standards.<br />
The district curriculum department prepares writing prompts for schools to utilize as instructional materials.<br />
During the Principals’ Leadership Conference, staff conducted sessions to support principals and leadership<br />
teams as they collaboratively score students’ work and developed a common understanding of the<br />
expectations for quality student writing using a rubric.<br />
Page 39 of 44
<strong>Anderson</strong> <strong>Elementary</strong> School<br />
District: <strong>Tulsa</strong> <strong>Public</strong> <strong>Schools</strong><br />
Creating content teams in 2012, the curriculum department will work with mathematics, science, social<br />
studies, arts and literacy to further the development of quality, rigorous curricula using the research from Larry<br />
Ainsworth to unwrap standards and write quality common assessments. This further advances the continuous<br />
work of creating a strong instructional program that is research‐based, rigorous and aligned with state<br />
standards.<br />
DETERMINATION OF CAPACITY BY REVIEWERS AND COMMENTS<br />
Use of Data<br />
Time for principals and teachers to analyze data to inform instruction for continuous improvement<br />
DISTRICT EVIDENCE OF CAPACITY SUBMITTED FOR REVIEW<br />
<strong>Anderson</strong> <strong>Elementary</strong> School currently provides ongoing professional development opportunities twice a week.<br />
Every Monday, grade‐level teams meet collaboratively during their planning time to focus on one of several<br />
identified priorities, including analyzing student performance data. Scoring writing samples using a rubric,<br />
analyzing DIBELS data, and grouping students according to Fountas and Pinnell data are examples of the types<br />
of data currently being analyzed during these meetings.<br />
Faculty meetings are also scheduled once a week every Monday after school to focus on instructional<br />
priorities. This time is used sometimes to examine schoolwide data such as the number of referrals or<br />
suspensions for the month or quarter, average daily attendance or tardies, statewide assessment results. This<br />
year we also utilized the skills we learned from our partnership with the Flippen group to conduct schoolwide<br />
walkthroughs, collect instructional data and present our findings to staff.<br />
As we move forward this year into next school year, we will build upon our current understanding in this area<br />
with ongoing professional development and consistent practice. Below is a list of priorities for next school year<br />
pertaining to analyzing data:<br />
• Universally screen all students using a variety of assessments, including DIBELS (primary grades),<br />
Fountas and Pinnell (intermediate grades), a writing prompt for all grade levels with accompanying<br />
rubric, and a mathematics diagnostic.<br />
• Collect and analyze previous schoolwide assessment data<br />
• Set schoolwide and classroom goals for student achievement<br />
• Celebrate student achievement weekly, monthly and quarterly via student of the week, student of<br />
the month, teacher of the month, schoolwide assemblies, etc.<br />
Page 40 of 44
<strong>Anderson</strong> <strong>Elementary</strong> School<br />
District: <strong>Tulsa</strong> <strong>Public</strong> <strong>Schools</strong><br />
• Build literacy and staff capacity using data through ongoing professional development<br />
• Establishing weekly data chats that incorporate teachers creating formative and summative<br />
assessments, analyzing student results on assessments, grouping students according to proficiency,<br />
sharing best practices based on results, re‐teaching, and reassessing<br />
• Build in additional time for staff to collect and analyze student achievement data<br />
• Display student achievement data throughout the school<br />
DETERMINATION OF CAPACITY BY REVIEWERS AND COMMENTS<br />
School Environment<br />
Strong support for school safety and discipline, addressing other non‐academic factors that impact student<br />
achievement, such as students’ social, emotional, and health needs<br />
DISTRICT EVIDENCE OF CAPACITY SUBMITTED FOR REVIEW<br />
<strong>Anderson</strong> <strong>Elementary</strong> School believes the foundation for a great school begins with an environment that is<br />
conducive to learning. This means doing our best to ensure students and staff feel safe and protected from all<br />
unnecessary interruptions during the instructional day. One way we do this is by refraining from making<br />
announcements over the intercom while instruction is taking place. We also ask all parents to schedule<br />
appointments with teachers prior to visiting their classrooms to prevent disruptions and frequent traffic<br />
throughout the building.<br />
We currently have a safety committee comprised of teachers and support staff. Committees meet once a<br />
month to discuss various agenda items. The safety committee is in charge of making sure we are in compliance<br />
with school safety guidelines. We also have a number of students who participate in safety patrol. This group<br />
helps to monitor student traffic throughout the building in the mornings, passes out breakfast to students, and<br />
helps to keep the building clean.<br />
The school’s counselor currently acts as chair of the child study team. This team meets once a week to discuss<br />
student concerns and determine appropriate interventions to match the needs of each student. It is<br />
comprised of the counselor, special education teacher, a teacher, school psychologist, staff development<br />
teacher, and parent. Teachers determine what students are referred to the child study team based on student<br />
academic and behavioral data. Interventions are provided from 4‐6 weeks to and reviewed to determine if<br />
further actions are to be administered by the team. The counselor is also held responsible for conducting<br />
ongoing sessions with students and classes to discuss bullying, responsibility, conflict resolution, etc.<br />
Page 41 of 44
<strong>Anderson</strong> <strong>Elementary</strong> School<br />
District: <strong>Tulsa</strong> <strong>Public</strong> <strong>Schools</strong><br />
Administration supports teachers and staff with discipline by collaboratively establishing rules and procedures<br />
throughout the school that promote a positive and safe environment. Posters were created that articulate<br />
expectations for students and staff throughout the building. All teachers were charged with creating classroom<br />
management plans that included rewards and consequences for student behavior. Additionally, teachers<br />
utilized the skills they developed at the beginning of the school year during training with the Flippen group<br />
entitled – Capturing Kids Hearts. As a result, teachers were responsible for using social contracts that engaged<br />
the students in the classroom as a community.<br />
A schoolwide discipline matrix was created to help students, parents and staff understands how consequences<br />
are to be issued for student misbehavior. The school’s uniform policy was enforced through letters and<br />
phones calls to parents, along with strong enforcement of the school’s discipline policy.<br />
In the near future, we will implement several new items to ensure our staff, students, and parents feel<br />
welcomed and safe:<br />
• Establish a positive behavior team<br />
• Administer and collect staff, student, and parent surveys that helps us collect data on ways to<br />
improve our school’s culture<br />
• Orient all students to the code of conduct and behavioral system at the beginning of the school year<br />
• Ensure the first 6 weeks of school incorporates many opportunities for students to understand and<br />
reflect on school safety, values and behavioral expectations<br />
• Offer incentives weekly, monthly and quarterly for good behavior via classroom rewards, student of<br />
the week, student of the month, schoolwide assemblies, etc.<br />
District Response: The <strong>Tulsa</strong> <strong>Public</strong> <strong>Schools</strong> Behavior Response Plan (BRP), in coordination with the Discipline<br />
Review Committee (DRC), provides a scaffolding of services in a Response to Intervention (RTI) design that<br />
incorporates research‐based interventions to support student success. The strategies have been designed to<br />
align with the philosophy and practices of the Positive Behavior Support programs used by many of the District<br />
sites. The goal is to help students in their development as mature, able, knowledgeable and responsible<br />
individuals.<br />
Recent school site changes implemented through Project Schoolhouse have already show positive effects,<br />
particularly in regards to decreasing 6 th grade suspensions. The District will continue to monitor current data<br />
and address as necessary.<br />
DETERMINATION OF CAPACITY BY REVIEWERS AND COMMENTS<br />
Page 42 of 44
<strong>Anderson</strong> <strong>Elementary</strong> School<br />
District: <strong>Tulsa</strong> <strong>Public</strong> <strong>Schools</strong><br />
Family and Community Engagement<br />
Strong ongoing family and community engagement<br />
DISTRICT EVIDENCE OF CAPACITY SUBMITTED FOR REVIEW<br />
<strong>Anderson</strong> <strong>Elementary</strong> School currently has a parent facilitator on staff. Our parent facilitator acts as the chair<br />
for the family engagement committee. Much of her responsibility involves increasing the level of parentschool<br />
communication and involvement throughout the school year. Students receive a Thursday folder each<br />
week communicating pertinent information about the school. Often, parents are asked to sign various forms<br />
and return them to the school, indicating they received what we sent home. Our parent facilitator helps to<br />
schedule our PTO meetings with parents. This allows parents to have a voice in what happens at the school.<br />
This month, surveys will be administered to parents and students asking for their feedback concerning the<br />
school and its leadership. Our parent facilitator will play a major part in making sure this process and<br />
information is gathered efficiently. Additionally, our parent facilitator helps to build relationships with our<br />
partners in education. This is a tremendous help to the school—as many of these partnerships sponsor events<br />
or even donate items that many of our families find difficult to afford. During Thanksgiving, one of the local<br />
churches provided an entire Thanksgiving dinner for every family in the school who attended this event. This<br />
turned out to be a very special and successful event –as several of our parents showed up to receive food.<br />
In previous years, I realized that many of our parents did not attend parent/teacher report card conferences.<br />
One of the goals we set for the school was to increase the level of parent/teacher engagement, particularly<br />
around parent/teacher conferences. With the help of my staff, we collaborated with the YMCA to help<br />
sponsor food, activities and music for students and parents. Additionally, we sent home flyers, letters, made<br />
phone calls home, advertised using the marquee, and even reached out to the local radio station to help us<br />
communicate this important occasion. Out of 400 parents, more than 245 of them showed up to<br />
parent/teacher conferences. This amazed the staff because they had never witnessed this level of parent<br />
participation for report card conferences. After the event, we reflected and celebrated our achievement.<br />
We plan to increase parent engagement next school year by implementing the following:<br />
• Create and enforce a complete family engagement plan<br />
• Provide more after school functions for students and parents to come participate in<br />
• Solicit more parent volunteers at the beginning of the year<br />
• Ask parents to commit to certain tasks and responsibilities by creating a parent‐school “contract”<br />
For a more complete picture of family and community engagement as a whole for <strong>Tulsa</strong> <strong>Public</strong> <strong>Schools</strong>, please<br />
refer to the District notebook.<br />
DETERMINATION OF CAPACITY BY REVIEWERS AND COMMENTS<br />
Page 43 of 44
<strong>Anderson</strong> <strong>Elementary</strong> School<br />
District: <strong>Tulsa</strong> <strong>Public</strong> <strong>Schools</strong><br />
Submit electronically with completed form and supporting documents to school.improvement@sde.ok.gov<br />
upon request.<br />
Signature<br />
District Board President<br />
Date<br />
Signature<br />
District Superintendent<br />
Date<br />
Signature<br />
Site Administrator<br />
Date<br />
Contact Information<br />
Page 44 of 44
Introduction<br />
Welcome to a review and analysis of published <strong>Tulsa</strong> <strong>Public</strong> <strong>Schools</strong>, Oklahoma School Testing Program (OSTP)<br />
results for the school years 2008-09, 2009-10, and 2010-11.<br />
In the 2008-09, 2009-10, and 2010-11. columns, the individual results are reported by their current school, not<br />
necessarily the school where they were tested. This allows the site to view the current student performance over<br />
the past three years for:<br />
• Curriculum modifications<br />
• Interventions<br />
• Differentiation of instruction<br />
• Instructional practices<br />
This report presents the median OPI Score achieved as a common reference in many of its analyses. The median<br />
score is the score at which 50% of students are above and 50% of the students are below. The median score is a<br />
better measure of performance as it is not subject to the influence of variability in very high scores or very low<br />
scores dampening its measurement capability. The median OPI score or the median percentile of questions<br />
answered correctly on individual standards and objectives can reveal over time the extent a school or district is<br />
moving students to higher levels of performance. This document is not a report of effort to meet or exceed Annual<br />
Yearly progress (AYP); it is presented as a planning tool to assist schools to engage in a vigorous and complex<br />
discussion relative to increasing student achievement.<br />
Sources of Data<br />
All data presented within this document was taken directly from the published State, District and<br />
Individual School OSTP summaries for the years indicated as published by Oklahoma Department of<br />
Education. The data analysis presented unless otherwise noted are for all students Full Academic<br />
Year (FAY) and Non Full Academic Year (NFAY). This method of comparison was selected as districts<br />
are charged with the academic achievement of all students. The All FAY/NFAY category is used<br />
whenever student data is compared at the school, district and/or the state level, unless otherwise<br />
noted.
Explanation of Tables and Their Use<br />
Six tables have been constructed for each content or subject area assessed. The state of<br />
Oklahoma increased its levels of rigor in the OSTP beginning with the 2009 assessment year. In<br />
many situations students and schools within TPS meet or exceed the increased state expectations<br />
as demonstrated by median OPI scores greater than the median OPI scores achieved by the same<br />
reporting group in Oklahoma.<br />
Each of the tables are presented and discussed and followed by discussion starter questions in a<br />
bulleted format. Readers are encouraged to view the information presented as only a part of the<br />
data set which schools/district must use to review progress. This data presentation is part of the<br />
story it is not the entire story
Table 1 --- School's Median OPI Score - Mathematics<br />
For Current School ANDERSON ELEMENTARY<br />
Grade 03<br />
2008-2009 2009-2010 2010-2011<br />
American Indian or Alaskan Nat **** **** ****<br />
Asian X X X<br />
Black or African-American 666 628 609<br />
Hispanic or Latino 686 697 ****<br />
Pacific Islander X X X<br />
Two or More Races / Multi Racial X X ****<br />
White or Caucasian **** **** ****<br />
2008-2009 2009-2010 2010-2011<br />
Female 680 662 609<br />
Male 666 637 621<br />
2008-2009 2009-2010 2010-2011<br />
Free Lunch Eligible 670 654 609<br />
N/A X **** ****<br />
Reduced Lunch Eligbile **** X ****<br />
ELL Year Proficient - 1<br />
ELL Year Proficient - 2<br />
Non ELL<br />
2008-2009 2009-2010 2010-2011<br />
X X X<br />
**** X X<br />
670 654 617<br />
2008-2009 2009-2010 2010-2011<br />
Regular Ed 669.5 666 613<br />
Special Ed **** 589 648<br />
X Represents no students **** Represents fewer than five students Minor descrepancies because of rounding
Table 1 --- School's Median OPI Score - Mathematics<br />
For Current School ANDERSON ELEMENTARY<br />
Grade 04<br />
2008-2009 2009-2010 2010-2011<br />
American Indian or Alaskan Nat X **** ****<br />
Asian X X X<br />
Black or African-American **** 610 620<br />
Hispanic or Latino X 695 676<br />
Pacific Islander X X X<br />
Two or More Races / Multi Racial X X ****<br />
White or Caucasian X **** ****<br />
2008-2009 2009-2010 2010-2011<br />
Female **** 637 620<br />
Male **** 634 633<br />
2008-2009 2009-2010 2010-2011<br />
Free Lunch Eligible **** 634 620<br />
N/A X **** ****<br />
Reduced Lunch Eligbile X X ****<br />
ELL Year Proficient - 1<br />
ELL Year Proficient - 2<br />
Non ELL<br />
2008-2009 2009-2010 2010-2011<br />
X X X<br />
X X X<br />
**** 634 629<br />
2008-2009 2009-2010 2010-2011<br />
Regular Ed **** 643 657<br />
Special Ed **** **** 591<br />
X Represents no students **** Represents fewer than five students Minor descrepancies because of rounding
Table 1 --- School's Median OPI Score - Mathematics<br />
For Current School ANDERSON ELEMENTARY<br />
Grade 05<br />
2008-2009 2009-2010 2010-2011<br />
American Indian or Alaskan Nat X X X<br />
Asian X X X<br />
Black or African-American X X 593<br />
Hispanic or Latino X X 700<br />
Pacific Islander X X X<br />
Two or More Races / Multi Racial X X X<br />
White or Caucasian X X ****<br />
2010-2011<br />
Female 613<br />
Male 654<br />
2010-2011<br />
Free Lunch Eligible 638<br />
N/A ****<br />
Reduced Lunch Eligbile ****<br />
ELL Year Proficient - 1<br />
ELL Year Proficient - 2<br />
Non ELL<br />
2008-2009 2009-2010 2010-2011<br />
X X X<br />
X X X<br />
X X 630<br />
2008-2009 2009-2010 2010-2011<br />
Regular Ed X X 646<br />
Special Ed X X ****<br />
X Represents no students **** Represents fewer than five students Minor descrepancies because of rounding
Table 1: School's Median OPI Score<br />
Table I presents the major NCLB reporting groups across a historical time period. The main OSTP assessments are provided<br />
in the spring of each year; so the assessment of 2007 occurred in the spring of the 2006-2007 year.<br />
Four distinct groupings of data are apparent, these are: Ethnicity, Gender, Economic Status and ELL proficiency classification.<br />
Table 1 presents median OPI scores obtained for each reporting group across the time period so that increases or decreases<br />
can be easily observed. The OPI scores presented are “scaled scores” and are a valid measure of comparison across multiple<br />
years for the same assessment, as levels of difficulty may increase or decrease over years the use of the scaled score is a<br />
sound means to compare performance from year to year.<br />
The optimal expectation is to observe annual increases in the OPI score, which well exceed the minimum number required to<br />
reach the proficiency level established for the subject area tested.<br />
It is highly desirable to see a small point spread in the differences of the OPI scores with these spreads well into the middle or<br />
upper ranges of the proficiency/advanced range for each of the reporting groups.<br />
If the points differential are small and close together then all groups are experiencing the same relative growth in the<br />
curriculum area, if there are large variations in the spread of scores different reporting groups are achieving vastly different<br />
outcomes from the same instructional delivery systems. What are the variables that might be influencing the spread?<br />
Discussion Points<br />
• Has a significant change in staff occurred from one year to the next?<br />
• Have new or different methods been employed from one year versus the last?<br />
• What is the potential influence of the time of day the content is presented within the school day?<br />
• How are staff developments efforts increased and strengthen over time in the content area in an effort to<br />
reach higher levels of rigor?<br />
• What are the rigor expectations established in this subject and how does the school routinely review and<br />
monitor attainment?<br />
• What is the consistency of delivery of instruction from one year to the next? How do we measure<br />
consistency? Is it progress measured by delivering of instruction in alignment with the pacing calendar or skill<br />
attainment of students on formative assessment such as benchmarks?<br />
Page 1 of 2
Table 1: School's Median OPI Score --- Continued<br />
Discussion Points ---- Continued<br />
• What are the support or intervention services provided for students if students within a reporting category are consistently<br />
underperforming?<br />
• How is success celebrated with the school when children/staff reach higher levels of achievement?<br />
• Do students and staff know the targets they are shooting for to demonstrate greater levels of rigor?<br />
• Have we changed how and what we teach to meet the changing needs of students selecting our school?<br />
How do we know?<br />
• What is working and how do we sustain the growth?<br />
• How often are we reviewing and discussing student performance data?<br />
Page 2 of 2
Table 1 --- School's Median OPI Score - Mathematics For<br />
Student Current School ANDERSON ELEMENTARY<br />
Grade 03<br />
2008-2009 2009-2010 2010-2011<br />
Advanced NEI 2% 4%<br />
Satisfactory 36% 31% 16%<br />
Limited Knowledge 42% 22% 22%<br />
Unsatisfactory 21% 44% 57%<br />
Grade 04<br />
2008-2009 2009-2010 2010-2011<br />
Advanced NEI NEI 2%<br />
Satisfactory NEI 20% 16%<br />
Limited Knowledge 50% 27% 29%<br />
Unsatisfactory 50% 53% 53%<br />
Grade 05<br />
2008-2009 2009-2010 2010-2011<br />
Satisfactory NEI NEI 18%<br />
Limited Knowledge NEI NEI 32%<br />
Unsatisfactory NEI NEI 50%<br />
80% or > Median Correct<br />
70% to 79% Median Correct<br />
60% to 69% Median Correct<br />
59% or Less Median Correct
Table 2: Historical Trend Data by Performance Levels<br />
The optimum expectation would be to see significantly fewer students scoring in the unlimited or unsatisfactory range across time.<br />
However, if a school has experienced significant percentages of students performing in the unsatisfactory range one year followed by<br />
the second year with a significant decrease in this range and a larger increase in students with limited knowledge this is a significant<br />
achievement even though the school may not have moved the students to the proficient range. It is significant because significant<br />
growth has occurred to move the student to a higher level. Further exploration to determine how close to the proficiency range did the<br />
school move would be warranted. In the third year the desired outcome would be to see the percentage of student scoring below<br />
proficient to have diminished even further which would indicate that the staff was able to influence how the curriculum was delivered<br />
so that students could master the content and demonstrate higher levels of performance. Patterns with wide fluctuations in percentile<br />
changes between performance levels should raise significant questions.<br />
Discussion Points<br />
• Is there a discernable pattern evident when we reviewing our historical trend?<br />
• Is our trend line continuously moving in an upward direction?<br />
• If we are reaching high % levels of students performing in the proficient and/or above range are we maintaining, decreasing or<br />
increasing this trend?<br />
• Do we know how far into the proficient range or how close to the advanced range our students placed?<br />
• Are we moving an increasing number of students into the advanced range year after year? If not, what can we do differently?<br />
• What is the relationship between median OPI scores in Table I and the levels of proficiency reached in Table 2?<br />
• Do we have a means of gauging how we think our students are going to perform on the OSTP assessment before the assessment<br />
is given? If not, why not? If so, how do we as a school, a team, a department review<br />
• How do we track changes that we make to determine if they worked or produced the intended results?<br />
• If we have determined that something is working how do we maintain our focus?
Table 3 --- Comparison Proficient to Below Proficient - Mathematics For<br />
Student Current School ANDERSON ELEMENTARY<br />
Grade 03<br />
2008-2009 2009-2010 2010-2011<br />
Students Scoring<br />
Proficient and Above<br />
No 64% 67% 80%<br />
Students Scoring<br />
Proficient and Above<br />
Yes 36% 33% 20%<br />
Indicates that more than 51% scored Proficient and/or Above. Total of<br />
percentages may not equal 100 due to the effect of rounding.<br />
Indicates that more than 51% scored below Proficient. Total of percentages may<br />
not equal 100 due to the effect of rounding.
Grade 04<br />
2008-2009 2009-2010 2010-2011<br />
Students Scoring<br />
Proficient and Above<br />
No 100% 80% 82%<br />
Students Scoring<br />
Proficient and Above<br />
Yes 20% 18%<br />
Indicates that more than 51% scored Proficient and/or Above. Total of<br />
percentages may not equal 100 due to the effect of rounding.<br />
Indicates that more than 51% scored below Proficient. Total of percentages may<br />
not equal 100 due to the effect of rounding.
Grade 05<br />
2010-2011<br />
Students Scoring<br />
Proficient and Above<br />
No 82%<br />
Students Scoring<br />
Proficient and Above<br />
Yes 18%<br />
Indicates that more than 51% scored Proficient and/or Above. Total of<br />
percentages may not equal 100 due to the effect of rounding.<br />
Indicates that more than 51% scored below Proficient. Total of percentages may<br />
not equal 100 due to the effect of rounding.
Table 3: Comparison Proficient to Below Proficient<br />
Table 3 is designed to reveal the trend data in the subject area tested to indicate if more students are moving into higher proficiency<br />
ranges. As the state continues to increases expectations for students/schools to reach high levels of rigor we can measure our<br />
response to the increased expectations in two ways, higher median OPI scores or greater % of students scoring well into the proficient<br />
or above range. Consequently, Table 3 and Table 1 must be reviewed together. Example: if in Table 1 the Median OPI for Male and<br />
Female in 5th Grade Reading was 706 and 709 respectfully in 2010, this could result in 51% of students scoring proficient (a green<br />
bar) in Table 3. However, the beginning of the proficiency range for this subject in this year was 700. This comparison indicates that<br />
the median score is very close to the break point for limited knowledge and with increased levels of rigor on the horizon the school may<br />
be challenged to obtain the same levels of performance in subsequent years.<br />
Discussion Points<br />
• Are we maintaining, decreasing or increasing the percentages of students scoring proficient and/or above?<br />
• What information is used to identify a student’s proficiency level in the beginning of a school year? How is that information<br />
communicated to staff that may have the student in their class? What method(s) are used to determine how much growth is needed<br />
for each student to reach a higher performance range?<br />
• How did the levels of proficiency revealed in Table 3 match the stated schools goals in the WISE Plan? Where were we close,<br />
where did we exceed expectations, where did we fail to reach our stated growth expectations?<br />
• Is there a discernable pattern evident when we reviewing our historical trend?<br />
• What are we going to do differently and why?
Table 4 --- School to TPS to State Median OPI Score Comparison - Mathematics For<br />
Student Current School ANDERSON ELEMENTARY<br />
Grade 03<br />
School Median<br />
OPI Score<br />
TPS Median OPI<br />
Score<br />
State Median<br />
OPI Score<br />
Gap Between<br />
School and TPS<br />
Median OPI<br />
Score<br />
Gap Between<br />
School and State<br />
Median OPI<br />
Score<br />
2008-2009 666 717 728 -51 -62<br />
2009-2010 654 724 740 -70 -86<br />
2010-2011 617 706 X -89 617<br />
Grade 04<br />
School Median<br />
OPI Score<br />
TPS Median OPI<br />
Score<br />
State Median<br />
OPI Score<br />
Gap Between<br />
School and TPS<br />
Median OPI<br />
Score<br />
Gap Between<br />
School and State<br />
Median OPI<br />
Score<br />
2008-2009 **** **** **** -176 -194<br />
2009-2010 634 712 738 -78 -104<br />
2010-2011 629 713 X -84 629<br />
Grade 05<br />
School Median<br />
OPI Score<br />
TPS Median OPI<br />
Score<br />
State Median<br />
OPI Score<br />
Gap Between<br />
School and TPS<br />
Median OPI<br />
Score<br />
Gap Between<br />
School and State<br />
Median OPI<br />
Score<br />
2010-2011 630 717 X -87 630<br />
X Represents no students<br />
**** Represents fewer than five students
Table 4: School to TPS to State Median OPI Score Comparison<br />
Table 4 presents a historical comparison of the median OPI score for the subject area tested between the median OPI score obtained<br />
by the district and the state. This reveals if a school is scoring higher than the district median OPI or the State median OPI and<br />
consequently tracks if the gaps in median OPI scores are decreasing or increasing. This allows a historical comparison of school to<br />
district to state median OPI scores as a measure of progress of growth obtained or needed.<br />
Discussion Points<br />
• What are the linkages between our school and our feeder schools? Do we have accurate ways of knowing how well they are<br />
preparing students to successfully be ready for our expectations?<br />
• Do we conduct curriculum planning and staff development in the core academic areas with our feeder middle schools?<br />
• Do we routinely get together with them to review student performance data?<br />
• What are the structured interventions available within our school for students in a subject area when we have sound evidence they<br />
are at risk of not demonstrating high levels of performance?<br />
• Are interventions electives or in addition to?<br />
• If they are in addition to, how are communications and linkages between the two classes maintained? Do intervention teachers and<br />
core teachers share the same team or planning time to work together? Is one an extension of the other or are they both separate?<br />
• What are the before school or after school opportunities for students to seek additional assistance?
Table 5: Priority Academic Student Skills (PASS), Oklahoma's Core Curriculum, Median Percent<br />
Correct - Mathematics For<br />
Student Current School ANDERSON ELEMENTARY<br />
Grade 03<br />
(NEI means Not Enough Info)<br />
2008-2009 2009-2010 2010-2011<br />
OCCT 1.0 Algebraic Reasoning Standard NEI NEI 57%<br />
OCCT 1.0 Pattern & Algebraic Rsng Standard 69% NEI NEI<br />
OCCT 1.0 Patterns & Algebraic Reasoning Standard NEI 63% NEI<br />
OCCT 1.1 Algebra Patterns Objective 75% 50% NEI<br />
OCCT 1.2 Problem Solving Objective 63% 75% NEI<br />
OCCT 2.0 Number Sense Standard 57% 71% NEI<br />
OCCT 2.0 Number Sense and Operation Standard NEI NEI 50%<br />
OCCT 2.1 Number Sense Objective NEI NEI 60%<br />
OCCT 2.1 Place Value Objective NEI 75% NEI<br />
OCCT 2.2 Number Operations Objective NEI NEI 40%<br />
OCCT 2.2 Whole Numbers & Fractions Objective 50% NEI NEI<br />
OCCT 3.0 Geometry Standard NEI NEI 57%<br />
OCCT 3.0 Number Operations & Computation Standard 50% 42% NEI<br />
OCCT 3.1 Estimation Objective 50% 25% NEI<br />
OCCT 3.2 Multiplication Objective 50% 75% NEI<br />
OCCT 3.3 Money Problems Objective 50% 25% NEI<br />
OCCT 4.0 Geometry Measurement Standard 63% NEI NEI<br />
OCCT 4.0 Geometry & Measurement Standard NEI 67% NEI<br />
OCCT 4.0 Measurement Standard NEI NEI 33%<br />
OCCT 4.1 Measurment Objective NEI NEI 25%<br />
OCCT 4.1 Spatial Reasoning Objective 63% 75% NEI<br />
OCCT 4.2 Measurement Objective 50% 50% NEI<br />
OCCT 4.4 Time & Temperature Objective 75% 75% NEI<br />
80% or > Median Correct 70% to 79% Median Correct 60% to 69% Median Correct 59% or Less Median Correct
OCCT 5.0 Data Analysis Standard NEI NEI 43%<br />
OCCT 5.0 Data Analysis & Probability Standard 50% 33% NEI<br />
OCCT 5.1 Data Analysis Objective NEI 25% 25%<br />
Table 5: Priority Academic Student Skills (PASS), Oklahoma's Core Curriculum, Median Percent<br />
Correct - Mathematics For<br />
Student Current School ANDERSON ELEMENTARY<br />
Grade 04<br />
(NEI means Not Enough Info)<br />
2008-2009 2009-2010 2010-2011<br />
OCCT 1.0 Algebraic Reasoning Standard NEI NEI 57%<br />
OCCT 1.0 Patterns & Algebraic Reasoning Standard 44% 75% NEI<br />
OCCT 1.1 Algebra Patterns Objective 63% 75% NEI<br />
OCCT 1.2 Functions Objective 25% 75% NEI<br />
OCCT 2.0 Number Sense Standard 40% 50% NEI<br />
OCCT 2.0 Number Sense and Operation Standard NEI NEI 50%<br />
OCCT 2.1 Number Sense Objective NEI NEI 50%<br />
OCCT 2.1 Place Value Objective 38% 50% NEI<br />
OCCT 2.2 Number Operations Objective NEI NEI 40%<br />
OCCT 3.0 Geometry Standard NEI NEI 44%<br />
OCCT 3.0 Number Operations & Computation Standard 32% 45% NEI<br />
OCCT 3.2 Division Objective NEI 63% NEI<br />
OCCT 3.3 Estimation Objective 30% 25% NEI<br />
OCCT 4.0 Geometry & Measurement Standard 35% 50% NEI<br />
OCCT 4.0 Measurement Standard NEI NEI 44%<br />
OCCT 4.1 Lines & Angles Objective NEI 50% NEI<br />
OCCT 4.1 Measurment Objective NEI NEI 60%<br />
80% or > Median Correct 70% to 79% Median Correct 60% to 69% Median Correct 59% or Less Median Correct
OCCT 4.4 Measurement Objective 25% 50% NEI<br />
OCCT 5.0 Data Analysis Standard NEI NEI 57%<br />
OCCT 5.0 Data Analysis & Probability Standard 33% 67% NEI<br />
OCCT 5.1 Data Analysis Objective 33% 67% NEI<br />
Table 5: Priority Academic Student Skills (PASS), Oklahoma's Core Curriculum, Median Percent<br />
Correct - Mathematics For<br />
Student Current School ANDERSON ELEMENTARY<br />
Grade 05<br />
(NEI means Not Enough Info)<br />
2010-2011<br />
OCCT 1.0 Algebraic Reasoning Standard 39%<br />
OCCT 1.1 Algebra Patterns Objective 40%<br />
OCCT 1.2 Problem Solving Objective 50%<br />
OCCT 1.3 Number Properties Objective 50%<br />
OCCT 2.0 Number Sense and Operation Standard 47%<br />
OCCT 2.1 Number Sense Objective 63%<br />
OCCT 2.2 Number Operations Objective 32%<br />
OCCT 3.0 Geometry Standard 43%<br />
OCCT 3.1 Circles and Polygons Objective 25%<br />
OCCT 4.0 Measurement Standard 43%<br />
OCCT 4.1 Measurment Objective 40%<br />
OCCT 5.0 Data Analysis Standard 57%<br />
80% or > Median Correct 70% to 79% Median Correct 60% to 69% Median Correct 59% or Less Median Correct
Table 5: Median Percent Correct (0-100) By Standards and Objectives<br />
Table 5 presents the median percent of questions answered correctly on the state assessment by standard and objective. The<br />
standards are shaded in gray while objectives are not shaded. Each objective median percent score stands on its own while<br />
the median percentage correct for standards is based upon how individual students collectively performed on all objectives<br />
within a given standard. A color coding system is used to indicate movement toward higher levels of median percent questions<br />
answered correctly. The optimum median percentage of standards and objectives answered correctly would be 100%.<br />
However, obtaining a median percentage correct of 70% or greater is very desirable and there is evidence that when a school<br />
experiences scores at this level there is greater opportunity of achieving higher OPI scores. Achieving higher OPI scores<br />
consequently leads to an increase in a school’s Academic Performance Index (API) score. It is important to understand that the<br />
median percent correct by standard/objective does not directly correlate to obtaining proficiency within a given assessment.<br />
The right hand side of Table 7 presents a summary by assessment years of the placement by median percentage correct by<br />
standards/objectives within the percentile ranges selected for the color coding system. A trend of decreasing percentage<br />
levels from the far right hand column into columns moving to the left indicate that the school is moving students to a higher<br />
range of median percent questions answered correctly by objective and standard.<br />
Discussion Points<br />
• What percentage of our standards are coded gold and/or green?<br />
• Are we maintaining or exceeding the numerical value assigned within each gold or green colored cell?<br />
• What percentage of our standards are coded pink and or red?<br />
• If we have consecutive years of pink or red designations for a standard or objective are we reaching higher<br />
numerical values in consecutive years?<br />
• What are the expectations of students, teachers, teams or departments to track and display group<br />
performance data toward higher levels of proficiency?<br />
• Is there a process for encouraging students to monitor, chart or graph their progress toward attainment of the<br />
next highest level of performance?<br />
• Do we have a means to routinely collect, analyze and discuss student data which assists to make a<br />
prediction of where students will place within the performance ranges?<br />
• How do we review our predictions of student performance to actual performance and make adjustments if<br />
adjustments are necessary?<br />
Page 1 of 2
Table 5: Median Percent Correct (0-100) By Standards and Objectives ---- Continued<br />
Discussion Points ---- Continued<br />
• If there is a district benchmark for the areas being discussed, how does the teacher, team, department, school use the results<br />
to provide differentiation of instruction.<br />
• If there is a less than desirable amount of pink and/or red coded cells evident within the subject area being discussed, what<br />
process(s) are in place to drill down into the individual standards and objectives to determine how rigor can be increased?<br />
• What is the alignment of summative and or formative assessments given by the teacher during the course of<br />
the year to OSTP formats?<br />
• How does the school routinely review the level of difficulty or rigor contained within its<br />
questions ,assignments, outcome expectations etc, so that students can be systematically instructed on how<br />
to demonstrate successful completion of higher level thinking skills?<br />
• If supplemental interventions are used in the school what is the process used during the course of the year<br />
to compare student usage and performance data to the desired proficiency range?<br />
• What are the opportunities for staff to collaborate by reviewing and discussing student performance data to<br />
identify opportunities for improvement or enrichment?<br />
• How is the progress of individual students experiencing difficulty meeting expectations monitored so that<br />
they can be provided additional supports, specific instruction and encouragement?<br />
Page 2 of 2
Table 6: Priority Academic Student Skills (PASS), Oklahoma's Core Curriculum,<br />
Median Percent Correct - Mathematics For<br />
Student Current School ANDERSON ELEMENTARY<br />
03<br />
OCCT 1.0<br />
Algebraic<br />
Reasoning<br />
OCCT 1.0<br />
Pattern &<br />
Algebraic<br />
Rsng<br />
OCCT 1.0<br />
Patterns &<br />
Algebraic<br />
Reasoning<br />
OCCT 2.0<br />
Number<br />
Sense<br />
OCCT 2.0<br />
Number<br />
Sense and<br />
Operation<br />
OCCT 3.0<br />
Geometry<br />
OCCT 3.0<br />
Number<br />
Operations<br />
&<br />
Computatio<br />
n<br />
OCCT 4.0<br />
Geometry<br />
Measureme<br />
nt<br />
OCCT 4.0<br />
Geometry &<br />
Measureme<br />
nt<br />
OCCT 4.0<br />
Measureme<br />
nt<br />
2008-2009 X 69% X 57% X X 50% 63% X X<br />
2009-2010 X X 63% 71% X X 42% X 67% X<br />
2010-2011 57% X X X 50% 57% X X X 33%<br />
04<br />
OCCT 1.0<br />
Algebraic<br />
Reasoning<br />
OCCT 1.0<br />
Patterns &<br />
Algebraic<br />
Reasoning<br />
OCCT 2.0<br />
Number<br />
Sense<br />
OCCT 2.0<br />
Number<br />
Sense and<br />
Operation<br />
OCCT 3.0<br />
Geometry<br />
OCCT 3.0<br />
Number<br />
Operations<br />
&<br />
Computatio<br />
n<br />
OCCT 4.0<br />
Geometry &<br />
Measureme<br />
nt<br />
OCCT 4.0<br />
Measureme<br />
nt<br />
OCCT 5.0<br />
Data<br />
Analysis<br />
OCCT 5.0<br />
Data<br />
Analysis &<br />
Probability<br />
2008-2009 X **** **** X X **** **** X X ****<br />
2009-2010 X 75% 50% X X 45% 50% X X 67%<br />
2010-2011 57% X X 50% 44% X X 44% 57% X<br />
05<br />
OCCT 1.0<br />
Algebraic<br />
Reasoning<br />
OCCT 2.0<br />
Number<br />
Sense and<br />
Operation<br />
OCCT 3.0<br />
Geometry<br />
OCCT 4.0<br />
Measureme<br />
nt<br />
OCCT 5.0<br />
Data<br />
Analysis<br />
Count:<br />
80% to<br />
100%<br />
70% to<br />
79%<br />
60% to<br />
69%<br />
59% or<br />
Less<br />
2010-2011 39% 47% 43% 43% 57%<br />
5 0% 0% 0% 100%<br />
X Represents no students<br />
**** Represents fewer than five students
OCCT 5.0<br />
Data<br />
Analysis<br />
OCCT 5.0<br />
Data<br />
Analysis &<br />
Probability<br />
Count:<br />
80% to<br />
100%<br />
70% to<br />
79%<br />
60% to<br />
69%<br />
59% or<br />
Less<br />
2008-2009 X 50%<br />
2009-2010 X 33%<br />
2010-2011 43% X<br />
5 0% 0% 40% 60%<br />
5 0% 20% 40% 40%<br />
5 0% 0% 0% 100%<br />
Count:<br />
80% to<br />
100%<br />
70% to<br />
79%<br />
60% to<br />
69%<br />
59% or<br />
Less<br />
2008-2009<br />
2009-2010<br />
2010-2011<br />
5 0% 0% 0% 100%<br />
5 0% 20% 20% 60%<br />
5 0% 0% 0% 100%<br />
X Represents no students<br />
**** Represents fewer than five students
Table 6: Vertically Aligned Median Percent Correct (0-100) by Standards and Objectives<br />
This section of the report stacks each Table 6 by curricular area such as math, reading when multiple or consecutive courses or<br />
grades contain a like OSTP assessment. This allows for a comparison of the standards and objectives performance within one<br />
course or curriculum area; which would be required to reach higher levels of proficiency required by the standards and<br />
objectives within a higher level course for which the first course was a prerequisite or at the next grade level.<br />
This overview promotes the ability to review vertical and horizontal alignment with a curricula area across classrooms and the<br />
entire schools.
Introduction<br />
Welcome to a review and analysis of published <strong>Tulsa</strong> <strong>Public</strong> <strong>Schools</strong>, Oklahoma School Testing Program (OSTP)<br />
results for the school years 2008-09, 2009-10, and 2010-11.<br />
In the 2008-09, 2009-10, and 2010-11. columns, the individual results are reported by their current school, not<br />
necessarily the school where they were tested. This allows the site to view the current student performance over<br />
the past three years for:<br />
• Curriculum modifications<br />
• Interventions<br />
• Differentiation of instruction<br />
• Instructional practices<br />
This report presents the median OPI Score achieved as a common reference in many of its analyses. The median<br />
score is the score at which 50% of students are above and 50% of the students are below. The median score is a<br />
better measure of performance as it is not subject to the influence of variability in very high scores or very low<br />
scores dampening its measurement capability. The median OPI score or the median percentile of questions<br />
answered correctly on individual standards and objectives can reveal over time the extent a school or district is<br />
moving students to higher levels of performance. This document is not a report of effort to meet or exceed Annual<br />
Yearly progress (AYP); it is presented as a planning tool to assist schools to engage in a vigorous and complex<br />
discussion relative to increasing student achievement.<br />
Sources of Data<br />
All data presented within this document was taken directly from the published State, District and<br />
Individual School OSTP summaries for the years indicated as published by Oklahoma Department of<br />
Education. The data analysis presented unless otherwise noted are for all students Full Academic<br />
Year (FAY) and Non Full Academic Year (NFAY). This method of comparison was selected as districts<br />
are charged with the academic achievement of all students. The All FAY/NFAY category is used<br />
whenever student data is compared at the school, district and/or the state level, unless otherwise<br />
noted.
Explanation of Tables and Their Use<br />
Six tables have been constructed for each content or subject area assessed. The state of<br />
Oklahoma increased its levels of rigor in the OSTP beginning with the 2009 assessment year. In<br />
many situations students and schools within TPS meet or exceed the increased state expectations<br />
as demonstrated by median OPI scores greater than the median OPI scores achieved by the same<br />
reporting group in Oklahoma.<br />
Each of the tables are presented and discussed and followed by discussion starter questions in a<br />
bulleted format. Readers are encouraged to view the information presented as only a part of the<br />
data set which schools/district must use to review progress. This data presentation is part of the<br />
story it is not the entire story
Table 1 --- School's Median OPI Score - Reading For<br />
Current School ANDERSON ELEMENTARY<br />
Grade 03<br />
2008-2009 2009-2010 2010-2011<br />
American Indian or Alaskan Nat **** **** ****<br />
Asian X X X<br />
Black or African-American 678 651 638<br />
Hispanic or Latino 685 670 ****<br />
Pacific Islander X X X<br />
Two or More Races / Multi Racial X X ****<br />
White or Caucasian **** **** ****<br />
2008-2009 2009-2010 2010-2011<br />
Female 682 658 646<br />
Male 678 651 634<br />
2008-2009 2009-2010 2010-2011<br />
Free Lunch Eligible 678 655 638<br />
N/A X **** ****<br />
Reduced Lunch Eligbile **** X ****<br />
ELL Year Proficient - 1<br />
ELL Year Proficient - 2<br />
Non ELL<br />
2008-2009 2009-2010 2010-2011<br />
X X X<br />
**** X X<br />
678 658 638<br />
2008-2009 2009-2010 2010-2011<br />
Regular Ed 678 658 646<br />
Special Ed **** 628 605<br />
X Represents no students **** Represents fewer than five students Minor descrepancies because of rounding
Table 1 --- School's Median OPI Score - Reading For<br />
Current School ANDERSON ELEMENTARY<br />
Grade 04<br />
2008-2009 2009-2010 2010-2011<br />
American Indian or Alaskan Nat X **** ****<br />
Asian X X X<br />
Black or African-American **** 630 645<br />
Hispanic or Latino X 668 667<br />
Pacific Islander X X X<br />
Two or More Races / Multi Racial X X ****<br />
White or Caucasian X **** ****<br />
2008-2009 2009-2010 2010-2011<br />
Female **** 665 667<br />
Male **** 650 642<br />
2008-2009 2009-2010 2010-2011<br />
Free Lunch Eligible **** 650 648<br />
N/A X **** ****<br />
Reduced Lunch Eligbile X X ****<br />
ELL Year Proficient - 1<br />
ELL Year Proficient - 2<br />
Non ELL<br />
2008-2009 2009-2010 2010-2011<br />
X X X<br />
X X X<br />
**** 656 654<br />
2008-2009 2009-2010 2010-2011<br />
Regular Ed **** 656 664<br />
Special Ed **** **** 550<br />
X Represents no students **** Represents fewer than five students Minor descrepancies because of rounding
Table 1 --- School's Median OPI Score - Reading For<br />
Current School ANDERSON ELEMENTARY<br />
Grade 05<br />
2008-2009 2009-2010 2010-2011<br />
American Indian or Alaskan Nat X X X<br />
Asian X X X<br />
Black or African-American X X 589<br />
Hispanic or Latino X X 688<br />
Pacific Islander X X X<br />
Two or More Races / Multi Racial X X X<br />
White or Caucasian X X ****<br />
2010-2011<br />
Female 611<br />
Male 597<br />
2010-2011<br />
Free Lunch Eligible 601<br />
N/A ****<br />
Reduced Lunch Eligbile ****<br />
ELL Year Proficient - 1<br />
ELL Year Proficient - 2<br />
Non ELL<br />
2008-2009 2009-2010 2010-2011<br />
X X X<br />
X X X<br />
X X 608<br />
2008-2009 2009-2010 2010-2011<br />
Regular Ed X X 611<br />
Special Ed X X ****<br />
X Represents no students **** Represents fewer than five students Minor descrepancies because of rounding
Table 1: School's Median OPI Score<br />
Table I presents the major NCLB reporting groups across a historical time period. The main OSTP assessments are provided<br />
in the spring of each year; so the assessment of 2007 occurred in the spring of the 2006-2007 year.<br />
Four distinct groupings of data are apparent, these are: Ethnicity, Gender, Economic Status and ELL proficiency classification.<br />
Table 1 presents median OPI scores obtained for each reporting group across the time period so that increases or decreases<br />
can be easily observed. The OPI scores presented are “scaled scores” and are a valid measure of comparison across multiple<br />
years for the same assessment, as levels of difficulty may increase or decrease over years the use of the scaled score is a<br />
sound means to compare performance from year to year.<br />
The optimal expectation is to observe annual increases in the OPI score, which well exceed the minimum number required to<br />
reach the proficiency level established for the subject area tested.<br />
It is highly desirable to see a small point spread in the differences of the OPI scores with these spreads well into the middle or<br />
upper ranges of the proficiency/advanced range for each of the reporting groups.<br />
If the points differential are small and close together then all groups are experiencing the same relative growth in the<br />
curriculum area, if there are large variations in the spread of scores different reporting groups are achieving vastly different<br />
outcomes from the same instructional delivery systems. What are the variables that might be influencing the spread?<br />
Discussion Points<br />
• Has a significant change in staff occurred from one year to the next?<br />
• Have new or different methods been employed from one year versus the last?<br />
• What is the potential influence of the time of day the content is presented within the school day?<br />
• How are staff developments efforts increased and strengthen over time in the content area in an effort to<br />
reach higher levels of rigor?<br />
• What are the rigor expectations established in this subject and how does the school routinely review and<br />
monitor attainment?<br />
• What is the consistency of delivery of instruction from one year to the next? How do we measure<br />
consistency? Is it progress measured by delivering of instruction in alignment with the pacing calendar or skill<br />
attainment of students on formative assessment such as benchmarks?<br />
Page 1 of 2
Table 1: School's Median OPI Score --- Continued<br />
Discussion Points ---- Continued<br />
• What are the support or intervention services provided for students if students within a reporting category are consistently<br />
underperforming?<br />
• How is success celebrated with the school when children/staff reach higher levels of achievement?<br />
• Do students and staff know the targets they are shooting for to demonstrate greater levels of rigor?<br />
• Have we changed how and what we teach to meet the changing needs of students selecting our school?<br />
How do we know?<br />
• What is working and how do we sustain the growth?<br />
• How often are we reviewing and discussing student performance data?<br />
Page 2 of 2
Table 1 --- School's Median OPI Score - Reading For<br />
Student Current School ANDERSON ELEMENTARY<br />
Grade 03<br />
2008-2009 2009-2010 2010-2011<br />
Advanced NEI 2% NEI<br />
Satisfactory 39% 23% 27%<br />
Limited Knowledge 33% 32% 18%<br />
Unsatisfactory 27% 43% 55%<br />
Grade 04<br />
2008-2009 2009-2010 2010-2011<br />
Advanced NEI NEI 2%<br />
Satisfactory NEI 13% 18%<br />
Limited Knowledge 50% 37% 24%<br />
Unsatisfactory 50% 50% 55%<br />
Grade 05<br />
2008-2009 2009-2010 2010-2011<br />
Satisfactory NEI NEI 18%<br />
Limited Knowledge NEI NEI 14%<br />
Unsatisfactory NEI NEI 68%<br />
80% or > Median Correct<br />
70% to 79% Median Correct<br />
60% to 69% Median Correct<br />
59% or Less Median Correct
Table 2: Historical Trend Data by Performance Levels<br />
The optimum expectation would be to see significantly fewer students scoring in the unlimited or unsatisfactory range across time.<br />
However, if a school has experienced significant percentages of students performing in the unsatisfactory range one year followed by<br />
the second year with a significant decrease in this range and a larger increase in students with limited knowledge this is a significant<br />
achievement even though the school may not have moved the students to the proficient range. It is significant because significant<br />
growth has occurred to move the student to a higher level. Further exploration to determine how close to the proficiency range did the<br />
school move would be warranted. In the third year the desired outcome would be to see the percentage of student scoring below<br />
proficient to have diminished even further which would indicate that the staff was able to influence how the curriculum was delivered<br />
so that students could master the content and demonstrate higher levels of performance. Patterns with wide fluctuations in percentile<br />
changes between performance levels should raise significant questions.<br />
Discussion Points<br />
• Is there a discernable pattern evident when we reviewing our historical trend?<br />
• Is our trend line continuously moving in an upward direction?<br />
• If we are reaching high % levels of students performing in the proficient and/or above range are we maintaining, decreasing or<br />
increasing this trend?<br />
• Do we know how far into the proficient range or how close to the advanced range our students placed?<br />
• Are we moving an increasing number of students into the advanced range year after year? If not, what can we do differently?<br />
• What is the relationship between median OPI scores in Table I and the levels of proficiency reached in Table 2?<br />
• Do we have a means of gauging how we think our students are going to perform on the OSTP assessment before the assessment<br />
is given? If not, why not? If so, how do we as a school, a team, a department review<br />
• How do we track changes that we make to determine if they worked or produced the intended results?<br />
• If we have determined that something is working how do we maintain our focus?
Table 3 --- Comparison Proficient to Below Proficient - Reading For<br />
Student Current School ANDERSON ELEMENTARY<br />
Grade 03<br />
2008-2009 2009-2010 2010-2011<br />
Students Scoring<br />
Proficient and Above<br />
No 61% 75% 73%<br />
Students Scoring<br />
Proficient and Above<br />
Yes 39% 25% 27%<br />
Indicates that more than 51% scored Proficient and/or Above. Total of<br />
percentages may not equal 100 due to the effect of rounding.<br />
Indicates that more than 51% scored below Proficient. Total of percentages may<br />
not equal 100 due to the effect of rounding.
Grade 04<br />
2008-2009 2009-2010 2010-2011<br />
Students Scoring<br />
Proficient and Above<br />
No 100% 87% 80%<br />
Students Scoring<br />
Proficient and Above<br />
Yes 13% 20%<br />
Indicates that more than 51% scored Proficient and/or Above. Total of<br />
percentages may not equal 100 due to the effect of rounding.<br />
Indicates that more than 51% scored below Proficient. Total of percentages may<br />
not equal 100 due to the effect of rounding.
Grade 05<br />
2010-2011<br />
Students Scoring<br />
Proficient and Above<br />
No 82%<br />
Students Scoring<br />
Proficient and Above<br />
Yes 18%<br />
Indicates that more than 51% scored Proficient and/or Above. Total of<br />
percentages may not equal 100 due to the effect of rounding.<br />
Indicates that more than 51% scored below Proficient. Total of percentages may<br />
not equal 100 due to the effect of rounding.
Table 3: Comparison Proficient to Below Proficient<br />
Table 3 is designed to reveal the trend data in the subject area tested to indicate if more students are moving into higher proficiency<br />
ranges. As the state continues to increases expectations for students/schools to reach high levels of rigor we can measure our<br />
response to the increased expectations in two ways, higher median OPI scores or greater % of students scoring well into the proficient<br />
or above range. Consequently, Table 3 and Table 1 must be reviewed together. Example: if in Table 1 the Median OPI for Male and<br />
Female in 5th Grade Reading was 706 and 709 respectfully in 2010, this could result in 51% of students scoring proficient (a green<br />
bar) in Table 3. However, the beginning of the proficiency range for this subject in this year was 700. This comparison indicates that<br />
the median score is very close to the break point for limited knowledge and with increased levels of rigor on the horizon the school may<br />
be challenged to obtain the same levels of performance in subsequent years.<br />
Discussion Points<br />
• Are we maintaining, decreasing or increasing the percentages of students scoring proficient and/or above?<br />
• What information is used to identify a student’s proficiency level in the beginning of a school year? How is that information<br />
communicated to staff that may have the student in their class? What method(s) are used to determine how much growth is needed<br />
for each student to reach a higher performance range?<br />
• How did the levels of proficiency revealed in Table 3 match the stated schools goals in the WISE Plan? Where were we close,<br />
where did we exceed expectations, where did we fail to reach our stated growth expectations?<br />
• Is there a discernable pattern evident when we reviewing our historical trend?<br />
• What are we going to do differently and why?
Table 4 --- School to TPS to State Median OPI Score Comparison - Reading For<br />
Student Current School ANDERSON ELEMENTARY<br />
Grade 03<br />
School Median<br />
OPI Score<br />
TPS Median OPI<br />
Score<br />
State Median<br />
OPI Score<br />
Gap Between<br />
School and TPS<br />
Median OPI<br />
Score<br />
Gap Between<br />
School and State<br />
Median OPI<br />
Score<br />
2008-2009 678 716 732 -38 -54<br />
2009-2010 658 716 739 -58 -81<br />
2010-2011 638 702 X -64 638<br />
Grade 04<br />
School Median<br />
OPI Score<br />
TPS Median OPI<br />
Score<br />
State Median<br />
OPI Score<br />
Gap Between<br />
School and TPS<br />
Median OPI<br />
Score<br />
Gap Between<br />
School and State<br />
Median OPI<br />
Score<br />
2008-2009 **** **** **** -111 -129<br />
2009-2010 656 706 721 -50 -65<br />
2010-2011 654 713 X -59 654<br />
Grade 05<br />
School Median<br />
OPI Score<br />
TPS Median OPI<br />
Score<br />
State Median<br />
OPI Score<br />
Gap Between<br />
School and TPS<br />
Median OPI<br />
Score<br />
Gap Between<br />
School and State<br />
Median OPI<br />
Score<br />
2010-2011 608 696 X -89 608<br />
X Represents no students<br />
**** Represents fewer than five students
Table 4: School to TPS to State Median OPI Score Comparison<br />
Table 4 presents a historical comparison of the median OPI score for the subject area tested between the median OPI score obtained<br />
by the district and the state. This reveals if a school is scoring higher than the district median OPI or the State median OPI and<br />
consequently tracks if the gaps in median OPI scores are decreasing or increasing. This allows a historical comparison of school to<br />
district to state median OPI scores as a measure of progress of growth obtained or needed.<br />
Discussion Points<br />
• What are the linkages between our school and our feeder schools? Do we have accurate ways of knowing how well they are<br />
preparing students to successfully be ready for our expectations?<br />
• Do we conduct curriculum planning and staff development in the core academic areas with our feeder middle schools?<br />
• Do we routinely get together with them to review student performance data?<br />
• What are the structured interventions available within our school for students in a subject area when we have sound evidence they<br />
are at risk of not demonstrating high levels of performance?<br />
• Are interventions electives or in addition to?<br />
• If they are in addition to, how are communications and linkages between the two classes maintained? Do intervention teachers and<br />
core teachers share the same team or planning time to work together? Is one an extension of the other or are they both separate?<br />
• What are the before school or after school opportunities for students to seek additional assistance?
Table 5: Priority Academic Student Skills (PASS), Oklahoma's Core Curriculum, Median Percent<br />
Correct - Reading For<br />
Student Current School ANDERSON ELEMENTARY<br />
Grade 03<br />
(NEI means Not Enough Info)<br />
2008-2009 2009-2010 2010-2011<br />
OCCT 2.0 Vocabulary Standard 67% 58% 42%<br />
OCCT 2.4 Using Resource Materials Objective NEI 50% 25%<br />
OCCT 4.0 Comprehension/Critical Literacy Standard 67% 46% 54%<br />
OCCT 4.1 Literal Understanding Objective 83% 60% 80%<br />
OCCT 4.2 Inferences & Interpretation Objective 57% 43% 50%<br />
OCCT 4.3 Summary & Generalization Objective 60% 50% 40%<br />
OCCT 4.4 Analysis & Evaluation Objective 67% 50% 50%<br />
OCCT 5.0 Literature Standard 50% 50% 50%<br />
OCCT 5.2 Literary Elements Objective 50% NEI 50%<br />
OCCT 5.3 Figurative Language/Sound Devices Objective 50% 50% 75%<br />
OCCT 6.0 Research & Information Standard 50% 50% 33%<br />
OCCT 6.1 Accessing Information Objective 50% 50% 33%<br />
80% or > Median Correct 70% to 79% Median Correct 60% to 69% Median Correct 59% or Less Median Correct
Table 5: Priority Academic Student Skills (PASS), Oklahoma's Core Curriculum, Median Percent<br />
Correct - Reading For<br />
Student Current School ANDERSON ELEMENTARY<br />
Grade 04<br />
(NEI means Not Enough Info)<br />
2008-2009 2009-2010 2010-2011<br />
OCCT 1.0 Vocabulary Standard 42% 50% 58%<br />
OCCT 1.1 Words in Context Objective 38% NEI NEI<br />
OCCT 1.2 Affixes, Roots, & Stems Objective 50% 40% 60%<br />
OCCT 1.3 Synonyms, Antonyms, & Homonyms Objective 38% 50% 50%<br />
OCCT 3.0 Comprehension/Critical Literacy Standard 48% 55% 57%<br />
OCCT 3.1 Literal Understanding Objective 38% 63% 75%<br />
OCCT 3.2 Inferences & Interpretation Objective 42% 67% 50%<br />
OCCT 3.3 Summary & Generalization Objective 64% 43% 50%<br />
OCCT 3.4 Analysis & Evaluation Objective 42% 50% 57%<br />
OCCT 4.0 Literature Standard 39% 44% 33%<br />
OCCT 4.2 Literary Elements Objective 34% 40% 40%<br />
OCCT 4.3 Figurative Language/Sound Devices Objective NEI 25% 50%<br />
OCCT 5.0 Research & Information Standard 50% 50% 50%<br />
OCCT 5.1 Accessing Information Objective 50% 50% 50%<br />
80% or > Median Correct 70% to 79% Median Correct 60% to 69% Median Correct 59% or Less Median Correct
Table 5: Priority Academic Student Skills (PASS), Oklahoma's Core Curriculum, Median Percent<br />
Correct - Reading For<br />
Student Current School ANDERSON ELEMENTARY<br />
Grade 05<br />
(NEI means Not Enough Info)<br />
2010-2011<br />
OCCT 1.0 Vocabulary Standard 50%<br />
OCCT 1.1 Words in Context Objective 50%<br />
OCCT 1.2 Affixes, Roots, & Stems Objective 63%<br />
OCCT 1.3 Synonyms, Antonyms, & Homonyms Objective 50%<br />
OCCT 3.0 Comprehension/Critical Literacy Standard 50%<br />
OCCT 3.1 Literal Understanding Objective 25%<br />
OCCT 3.2 Inferences & Interpretation Objective 50%<br />
OCCT 3.3 Summary & Generalization Objective 60%<br />
OCCT 3.4 Analysis & Evaluation Objective 60%<br />
OCCT 4.0 Literature Standard 42%<br />
OCCT 4.1 Literary Genre Objective 50%<br />
OCCT 4.2 Literary Elements Objective 50%<br />
OCCT 4.3 Figurative Language/Sound Devices Objective 50%<br />
OCCT 5.0 Research & Information Standard 50%<br />
OCCT 5.1 Accessing Information Objective 50%<br />
80% or > Median Correct 70% to 79% Median Correct 60% to 69% Median Correct 59% or Less Median Correct
Table 5: Median Percent Correct (0-100) By Standards and Objectives<br />
Table 5 presents the median percent of questions answered correctly on the state assessment by standard and objective. The<br />
standards are shaded in gray while objectives are not shaded. Each objective median percent score stands on its own while<br />
the median percentage correct for standards is based upon how individual students collectively performed on all objectives<br />
within a given standard. A color coding system is used to indicate movement toward higher levels of median percent questions<br />
answered correctly. The optimum median percentage of standards and objectives answered correctly would be 100%.<br />
However, obtaining a median percentage correct of 70% or greater is very desirable and there is evidence that when a school<br />
experiences scores at this level there is greater opportunity of achieving higher OPI scores. Achieving higher OPI scores<br />
consequently leads to an increase in a school’s Academic Performance Index (API) score. It is important to understand that the<br />
median percent correct by standard/objective does not directly correlate to obtaining proficiency within a given assessment.<br />
The right hand side of Table 7 presents a summary by assessment years of the placement by median percentage correct by<br />
standards/objectives within the percentile ranges selected for the color coding system. A trend of decreasing percentage<br />
levels from the far right hand column into columns moving to the left indicate that the school is moving students to a higher<br />
range of median percent questions answered correctly by objective and standard.<br />
Discussion Points<br />
• What percentage of our standards are coded gold and/or green?<br />
• Are we maintaining or exceeding the numerical value assigned within each gold or green colored cell?<br />
• What percentage of our standards are coded pink and or red?<br />
• If we have consecutive years of pink or red designations for a standard or objective are we reaching higher<br />
numerical values in consecutive years?<br />
• What are the expectations of students, teachers, teams or departments to track and display group<br />
performance data toward higher levels of proficiency?<br />
• Is there a process for encouraging students to monitor, chart or graph their progress toward attainment of the<br />
next highest level of performance?<br />
• Do we have a means to routinely collect, analyze and discuss student data which assists to make a<br />
prediction of where students will place within the performance ranges?<br />
• How do we review our predictions of student performance to actual performance and make adjustments if<br />
adjustments are necessary?<br />
Page 1 of 2
Table 5: Median Percent Correct (0-100) By Standards and Objectives ---- Continued<br />
Discussion Points ---- Continued<br />
• If there is a district benchmark for the areas being discussed, how does the teacher, team, department, school use the results<br />
to provide differentiation of instruction.<br />
• If there is a less than desirable amount of pink and/or red coded cells evident within the subject area being discussed, what<br />
process(s) are in place to drill down into the individual standards and objectives to determine how rigor can be increased?<br />
• What is the alignment of summative and or formative assessments given by the teacher during the course of<br />
the year to OSTP formats?<br />
• How does the school routinely review the level of difficulty or rigor contained within its<br />
questions ,assignments, outcome expectations etc, so that students can be systematically instructed on how<br />
to demonstrate successful completion of higher level thinking skills?<br />
• If supplemental interventions are used in the school what is the process used during the course of the year<br />
to compare student usage and performance data to the desired proficiency range?<br />
• What are the opportunities for staff to collaborate by reviewing and discussing student performance data to<br />
identify opportunities for improvement or enrichment?<br />
• How is the progress of individual students experiencing difficulty meeting expectations monitored so that<br />
they can be provided additional supports, specific instruction and encouragement?<br />
Page 2 of 2
Table 6: Priority Academic Student Skills (PASS), Oklahoma's Core Curriculum,<br />
Median Percent Correct - Reading For<br />
Student Current School ANDERSON ELEMENTARY<br />
03<br />
OCCT 2.0<br />
Vocabulary<br />
OCCT 4.0<br />
Comprehen<br />
sion/Critical<br />
Literacy<br />
OCCT 5.0<br />
Literature<br />
OCCT 6.0<br />
Research &<br />
Information<br />
Count:<br />
80% to<br />
100%<br />
70% to<br />
79%<br />
60% to<br />
69%<br />
59% or<br />
Less<br />
2008-2009 67% 67% 50% 50%<br />
2009-2010 58% 46% 50% 50%<br />
2010-2011 42% 54% 50% 33%<br />
4 0% 0% 50% 50%<br />
4 0% 0% 0% 100%<br />
4 0% 0% 0% 100%<br />
04<br />
OCCT 1.0<br />
Vocabulary<br />
OCCT 3.0<br />
Comprehen<br />
sion/Critical<br />
Literacy<br />
OCCT 4.0<br />
Literature<br />
OCCT 5.0<br />
Research &<br />
Information<br />
Count:<br />
80% to<br />
100%<br />
70% to<br />
79%<br />
60% to<br />
69%<br />
59% or<br />
Less<br />
2008-2009 **** **** **** ****<br />
2009-2010 50% 55% 44% 50%<br />
2010-2011 58% 57% 33% 50%<br />
4 0% 0% 0% 100%<br />
4 0% 0% 0% 100%<br />
4 0% 0% 0% 100%<br />
05<br />
OCCT 1.0<br />
Vocabulary<br />
OCCT 3.0<br />
Comprehen<br />
sion/Critical<br />
Literacy<br />
OCCT 4.0<br />
Literature<br />
OCCT 5.0<br />
Research &<br />
Information<br />
Count:<br />
80% to<br />
100%<br />
70% to<br />
79%<br />
60% to<br />
69%<br />
59% or<br />
Less<br />
2010-2011 50% 50% 42% 50%<br />
4 0% 0% 0% 100%<br />
X Represents no students<br />
**** Represents fewer than five students
Table 6: Vertically Aligned Median Percent Correct (0-100) by Standards and Objectives<br />
This section of the report stacks each Table 6 by curricular area such as math, reading when multiple or consecutive courses or<br />
grades contain a like OSTP assessment. This allows for a comparison of the standards and objectives performance within one<br />
course or curriculum area; which would be required to reach higher levels of proficiency required by the standards and<br />
objectives within a higher level course for which the first course was a prerequisite or at the next grade level.<br />
This overview promotes the ability to review vertical and horizontal alignment with a curricula area across classrooms and the<br />
entire schools.
ESEA Waiver<br />
District Capacity Determination for School Improvement<br />
The following document is responsive to the OSDE’s request for information regarding:<br />
A communication plan for involvement of all stakeholders in meeting annual goals.<br />
<strong>Tulsa</strong> <strong>Public</strong> <strong>Schools</strong> is in the process of developing a comprehensive communications plan<br />
under the leadership of a new Director of <strong>Public</strong> Information. The overarching objectives and<br />
strategies described below encompass the basic framework of what will become part of the<br />
final plan.
TULSA PUBLIC SCHOOLS COMMUNICATION PLAN- DRAFT<br />
<strong>Tulsa</strong> <strong>Public</strong> <strong>Schools</strong> is committed to open, honest and ongoing communication with<br />
stakeholders. The district understands communication is critical to achieving the district’s<br />
mission and its overall objectives. As such, this communication plan is aligned with the<br />
district’s core goals and will be incorporated into the district’s improvement plan.<br />
Overarching Goals<br />
• Implement a communications program that directly helps the district achieve its<br />
strategic goals.<br />
• Foster strong relationships with district stakeholders.<br />
• Enable the district to present itself accurately to audiences.<br />
Target Audiences<br />
Internal<br />
• Principals<br />
• Department managers/central<br />
office administrators<br />
• Teachers and other instructional<br />
staff<br />
• Support staff<br />
• Professional development staff<br />
• Board of Education<br />
External<br />
• Students<br />
• Parents/PTA<br />
• Community members and leaders<br />
• Teacher associations<br />
• Partner organizations and foundations<br />
• Business leaders and chamber of<br />
commerce<br />
• Media<br />
• Parents/PTA<br />
• Students<br />
• Taxpayers<br />
The communication approach for internal audiences will include keeping internal<br />
stakeholders informed of key district initiatives, promote pride and ownership of the district<br />
and encourage a collaborative and high-performing work environment. The main goals in<br />
communicating with external audiences will be to strengthen relationships based on trust<br />
and transparency, engage them in the process of improving schools, and enlist broad support<br />
for the district from all constituencies.<br />
Communication Objectives and Strategies<br />
2
1. Develop and maintain positive, collaborative relationships with all stakeholders to<br />
strengthen support for <strong>Tulsa</strong> <strong>Public</strong> <strong>Schools</strong><br />
a. Develop communication messages that proactively inform stakeholders about<br />
district’s progress in achieving strategic goals as well as key district issues.<br />
b. Maintain electronic communication and social media updates for widespread<br />
community reach.<br />
c. Work closely with Community Relations and Parent Involvement departments to<br />
expand interpersonal communication channels to broader external audiences.<br />
d. Provide district representations for community-led meetings, such as <strong>Tulsa</strong> Metro<br />
Chamber, community organizations, civic groups, and others.<br />
e. Continue engaging parent, students and community through forums and town<br />
hall meetings to provide regular updates on key district issues.<br />
2. Establish an effective employee communication plan to improve internal communication and<br />
employee engagement.<br />
a. Distribute organizational charts to all staff showing decision-making process,<br />
reporting, and accountability structure.<br />
b. Establish structured communications channels to disseminate information<br />
internally regarding key district initiatives and progress (via Intranet, district Open<br />
Book newsletter, etc.)<br />
c. Assist schools and departments with internal communication plans and actions.<br />
d. Provide relevant content to TPS Communications and Community Relations to<br />
continually update the Open Book newsletter.<br />
3. Utilize a variety of media to maximize awareness and support of the district goals, objectives<br />
and key initiatives.<br />
a. Develop a centralized page on external website where regular updates on<br />
strategic initiatives are posted.<br />
b. Maintain TPS website and train key school personnel on effective use of online<br />
tools to update school web pages with key district information as well as school<br />
performance data.<br />
c. Maximize use of TPS Channel 20 via revamped programming that builds<br />
awareness of district initiatives.<br />
d. Conduct annual media training with principals and other key district leadership<br />
that emphasizes messaging about strategic priorities.<br />
4. Develop stakeholder understanding of accountability, the district’s performance-based<br />
culture and continuous improvement approach.<br />
3
a. Publish external TPS dashboard to provide real-time information on leading<br />
indicators of district’s performance.<br />
b. Promote and highlight district improvements through website, print publications<br />
and employee communication channels.<br />
c. In collaboration with the Accountability and Community Relations departments<br />
develop a concise and user-friendly guide to understanding district and school<br />
level reports.<br />
d. Work closely with school improvement team to develop a uniform reporting<br />
template to be shared in school newsletters, websites, and parent meetings.<br />
5. Establish strong, positive connections between individual schools and their surrounding<br />
communities.<br />
a. In collaboration with Community Relations, Parent Involvement and Community<br />
<strong>Schools</strong> departments, provide easy-to-use communication tools for staff<br />
members and parent leaders and encourage their use.<br />
b. Promote use of parent and student portals for timely school information and<br />
updates.<br />
c. Support Community Relations department efforts to recognize community<br />
leaders, Partners in Education and others for their involvement and support of<br />
schools.<br />
d. Encourage parent and community feedback regarding school and district needs<br />
and priorities through surveys, community forums, PTA meetings, etc.<br />
6. Design a coordinated approach, both internally and externally, regarding safety issues and<br />
emergency management.<br />
a. Work closely with Emergency Management department to coordinate sharing of<br />
information regarding safety and crisis management.<br />
b. Maintain and update emergency content feature on district’s home page.<br />
c. Work with administrative staff to provide crisis information to all employees.<br />
7. Develop a branding strategy for the district and build on that image and reputation.<br />
a. Provide messaging, branding and production oversight of promotional materials,<br />
PowerPoint presentations and other necessary materials to principals and district<br />
leadership to ensure consistency.<br />
b. Create a cohesive message when communicating district initiatives to all<br />
stakeholders to establish familiarity and brand recognition.<br />
c. Develop an easy to use branding standards guide to be shared with employees to<br />
use consistently when communicating with stakeholders.<br />
4
8. Maintain a proactive media relations program to enhance the district’s image on local, state<br />
and national levels.<br />
a. Continue to build relationships with media through regular press releases,<br />
updates, briefings and photo opportunities.<br />
b. Work with broadcast producers, editorial boards and others to promote positive,<br />
newsworthy stories that highlight TPS’ progress and successes.<br />
Communication Channels<br />
To develop a broad and deep understanding of <strong>Tulsa</strong> <strong>Public</strong> <strong>Schools</strong> strategic priorities<br />
and initiatives, various communication channels will be used, including but not limited to:<br />
Electronic<br />
District Website<br />
District E-Newsletter<br />
District Newsletter “Open Book”<br />
District Bulletin Board<br />
School Web pages<br />
Targeted E-mail lists<br />
Video media<br />
Social Media: Facebook & Twitter<br />
Parent/Student Portals<br />
Print<br />
Brochures<br />
Targeted mailing lists<br />
School newsletters<br />
ESC newsletter<br />
Media<br />
<strong>Tulsa</strong> World<br />
Other print newspapers<br />
Radio stations<br />
<strong>Tulsa</strong> magazines<br />
Interpersonal<br />
Town Hall meetings<br />
PTA meetings<br />
Community advisory meetings<br />
Superintendent Advisory Committees<br />
(various)<br />
Principal meetings<br />
Foundation for <strong>Tulsa</strong> <strong>Schools</strong><br />
Civic and philanthropic community<br />
Superintendent’s Council meetings<br />
<strong>Tulsa</strong> Metro Chamber<br />
Professional associations meetings<br />
Strategic Approach & Deliverables<br />
Evaluation<br />
<strong>Tulsa</strong> <strong>Public</strong> <strong>Schools</strong> will perform the following to assess the effectiveness of the communication<br />
plan:<br />
• Create and distribute a stakeholder communication feedback survey annually.<br />
• Solicit input from a Communications Steering Committee about ways to continually improve<br />
district’s communication plan.<br />
• Collect and analyze published articles, media coverage, public inquiries, website visits<br />
statistics, etc.<br />
• Conduct an annual review of plan to make any necessary adjustments<br />
5
Assessment Rates – District Level
Assessment Rates – School Level
Assessment Values – Student Level
Assessment Graphs – School Level
Math Results – Student level
ESEA Waiver<br />
District Capacity Determination for School Improvement<br />
The following document is responsive to the OSDE’s request for information regarding:<br />
Details of how performance of a current teachers or a new teachers (with a proven track record for<br />
turning around schools) will be reviewed for hiring, retention, or dismissal.<br />
1
How Performance is Reviewed for Hiring, Retention, or Dismissal.<br />
Assessing Performance<br />
In a high-performing school system, there is an emphasis on continuous improvement<br />
and shared accountability for student achievement. Instructional practices grow and student<br />
achievement levels rise in an organization that values performance feedback, analysis and<br />
refinement.<br />
In August of 2010, <strong>Tulsa</strong> <strong>Public</strong> <strong>Schools</strong> embarked on a new Teacher and Leader<br />
Effectiveness (TLE) initiative in support of its mission—Excellence and High Expectations with a<br />
Commitment to All—and its Core Goal of Raising Student Achievement.<br />
<strong>Tulsa</strong> <strong>Public</strong> <strong>Schools</strong>’ Core Goals<br />
The <strong>Tulsa</strong> TLE Observation and Evaluation System is an evidence-based process of<br />
teacher evaluation anchored in specific Domains, Dimensions and Indicators reflecting national<br />
best practices and current research regarding effective instruction. The Domains, Dimensions<br />
and Indicators within a Rubric categorize and explicitly define effective teaching/performance<br />
along a spectrum of professional proficiency. (A copy of the Rubric is at the end of this<br />
2
document.) The Rubric creates a common language to guide teachers’ understanding of<br />
expectations and the various levels of performance.<br />
Each Domain has one or more Dimensions and Indicators. When performing an<br />
observation or evaluation, a principal must judge the teacher's performance as to each<br />
Indicator. The principal bases his or her score for an Indicator according to the Rubric. The<br />
Rubric contains a set of detailed narratives—scoring guidelines developed collaboratively by the<br />
District's Administrators and teachers based upon professional practices linked to student<br />
learning. By evaluating the teacher’s performance using the Rubric's narratives, the principal:<br />
• Creates a common framework and language for evaluation.<br />
• Provides teachers with clear expectations about what is being assessed, as well<br />
as standards that should be met.<br />
• Send messages about what is most meaningful.<br />
• Increases the consistency and objectivity of evaluating professional<br />
performances.<br />
• Provides teachers with information about where they are in relation to where<br />
they need to be for success.<br />
• Identifies what is most important to focus on in instruction.<br />
• Gives teachers guidance in evaluating and improving their work.<br />
The principal's assessment is a reflection of the teacher's performance during formal<br />
observations as well as his or her overall performance. The evaluation software calculates the<br />
average score for each Domain according to the scores entered for each Indicator within the<br />
Domain. The overall evaluation score—the composite average—is determined by calculating a<br />
weighted average of the evaluation's Domain scores.<br />
The Rubric's descriptions as to each Indicator are organized along a five-point scale<br />
with numeric rankings of 1 - 5. The rankings of N/A and N/O are used for not applicable and<br />
not observed behavior (evidence) respectively. The numeric scores represent the following<br />
rankings:<br />
3
The TLE evaluation process is comprised of observations and evaluations. Every<br />
evaluation must be supported by (built upon) at least two observations in addition to the<br />
principal’s overall assessment of the teacher’s performance.<br />
Career teachers must be evaluated at least once a year.<br />
Probationary teachers must be evaluated at least twice a year.<br />
Observations are a principal's intentional study and analysis of the teacher's performance (e.g.,<br />
the teacher's classroom instruction). The principal's assessment is guided by the detailed descriptions of<br />
the Teacher's Rubric. The principal's assessments of the teacher's performance during the observation<br />
must be recorded in the Observation Form, described in more detail in Section 5. Each observation<br />
must be followed by an observation conference held no more than five (5) instructional days from the<br />
date of the observation. An evaluation conference is held within five (5) instructional days from the<br />
date of the evaluation.<br />
4
Use of Performance Data for Hiring, Retention of Dismissal<br />
Retention/Dismissal. As noted above, the District’s successful evaluation system (the TLE<br />
Observation and Evaluation System) provides teachers with a performance ranking on a scale from 1-5.<br />
The TLE evaluation system provides teachers with a five-tier support system for improvement, but when<br />
they fail to improve, the District’s performance-based exit procedures go into effect and provide for<br />
their timely release from the District.<br />
In the months following the district-wide implementation of the<br />
TLE evaluation system in 2010-2011, the Human Capital personnel successfully exited 57 teachers from<br />
the District for poor performance through recommendations for non-renewal and termination<br />
proceedings. These exits targeted teachers whose performance rankings were 1 or 2 (Ineffective or<br />
Needs Improvement). Due process hearings, as applicable, were held throughout the summer of 2011<br />
and all recommendations for non-renewal and termination were adopted by the Board. Many other<br />
teachers were counseled out of the District for performance reasons prior to this time.<br />
The District is aggressive in seeking performance-based exits, but it also recognizes that teachers<br />
must be supported and provided a chance to improve prior to any removal from the District. As a<br />
precursor to the District’s support/release program , over 130 Personal Development Plans (plans for<br />
improvement) were issued for teachers. At least 29 teachers were also placed in an intensive<br />
remediation-based mentoring program lasting 8 weeks.<br />
It is notable that prior to the implementation of the TLE Evaluation System in 2010-2011, there<br />
had been no performance-based exiting of teachers or principals and a very small number of personal<br />
development plans. A significant support for this occurrence was the complete reorganization of the<br />
District’s entire human capital department and the addition of a team of Human Capital Partners. The<br />
human resource function at the District has been completely restructured, with a new approach to<br />
recruitment, retention, and development. The addition of the Human Capital Partner position has<br />
provided a cadre of HC liaisons to quickly respond to the staffing needs of every building principal, as<br />
well as support the implementation of the new evaluation system and the necessary exiting procedures.<br />
Human Capital Partners—experts in teacher-related human capital matters—are assigned to<br />
specific schools and assist principals throughout the school year with regard to evaluation processes and<br />
substantive personnel matters. They are the principal’s primary human capital (HC) contact. They<br />
provide invaluable support to their clients by:<br />
• Directing and coordinating evaluations;<br />
• Providing assistance, guidance and review of PDPs (Personal Development Plans); and<br />
• Assisting with the compilation of necessary documentation for employment actions,<br />
including coordination with legal staff to satisfy procedural requirements for dismissal;<br />
5
Human Capital Partners meet with each principal toward the end of each school year<br />
and review the evaluation data for purposes of determining which teachers merit<br />
exiting/retention. Because Human Capital Partners work so closely with principals, they know<br />
which teachers have needed support for improvement, the levels of intervention necessary<br />
(from subtle suggestions to intensive mentoring) and how successful the supports to the<br />
teacher were. HC Partners know for which teachers the principals have adequate<br />
documentation and rationale for purposes of making a recommendation for termination or<br />
non-renewal.<br />
Principals have the ultimate responsibility for making a recommendation to their<br />
Associate Superintendent regarding exits. That said, they benefit greatly from the counsel and<br />
support of the HC Partners. For purposes of assisting principals in determining which teachers<br />
should be recommended for exiting, the HC Partner and the principal look at those teachers<br />
who scored between a 1 and a 2 on their evaluation(s). Their primary focus is typically those<br />
teachers who scored a 1 or a 2 on the domain of Classroom Management or Instructional<br />
Effectiveness. They also evaluate the PDPs that were used and the teachers’ success in meeting<br />
the goals of the plans for improvement. They also consider those teachers who were placed in<br />
the 8-week intensive mentoring program or who were asked to participate in the program but<br />
declined. HC Partners also assist principals by reminding them of key legal issues that can<br />
influence the District’s ability to exit a teacher. Specifically, HC Partners help principals focus on<br />
retention and release decisions involving those teachers who are in their last year of<br />
probationary status. In doing so, they can exit those teachers who should be exited before they<br />
gain tenure and help the District improve the effectiveness of its career teaching pool.<br />
Hiring. As always, the teachers’ evaluation record is available to principals with whom<br />
the teacher is interviewing. As such, the TLE data also provides an essential data element for<br />
the District when teachers are investigating a move from one school to another. In addition,<br />
while value-added data is not a component of the teacher evaluation system or included within<br />
the decision-making regarding the exiting of teachers, planning is underway to use value-added<br />
data in the summer of 2011 for purposes of identifying those teachers with strengths in specific<br />
6
subgroups (by achievement level, ELL status and/or special ed). With this information, the<br />
District will be able to recruit and strategically place teachers in new positions.<br />
7
TLE Observation and Evaluation Rubric<br />
Teachers<br />
2011-2012<br />
Domain/Relative Weight Dimension Page<br />
Classroom<br />
Management<br />
30%<br />
1. Preparation<br />
2. Discipline<br />
3. Building-Wide Climate Responsibility<br />
4. Lesson Plans<br />
5. Assessment Patterns<br />
6. Work Area Environment<br />
2<br />
2<br />
3<br />
3<br />
4<br />
4<br />
Instructional Effectiveness<br />
50%<br />
Professional Growth &<br />
Continuous Improvement<br />
10%<br />
Interpersonal Skills<br />
5%<br />
7. Literacy<br />
8. Common Core Standards<br />
9. Involves All Learners<br />
10. Explains Content<br />
11. Explains Directions<br />
12. Models<br />
13. Monitors<br />
14. Adjusts Based upon Monitoring<br />
15. Establishes Closure<br />
16. Student Achievement<br />
17. Uses Professional Growth as an<br />
Important Strategy<br />
18. Exhibits Professional Behaviors and<br />
Efficiencies<br />
19. Effective Interactions/<br />
Communications with Stakeholders<br />
5<br />
5<br />
6<br />
7<br />
8<br />
8<br />
9<br />
10<br />
11<br />
12<br />
13<br />
13<br />
14<br />
Leadership<br />
5%<br />
20. Leadership Involvements 15
Indicator No.<br />
1<br />
Domain: Classroom Management<br />
Dimension: Preparation<br />
Teacher plans for delivery of the lesson relative to short-term and long-term objectives.<br />
1<br />
Ineffective<br />
2<br />
Needs Improvement<br />
3<br />
Effective<br />
4<br />
Highly Effective<br />
5<br />
Superior<br />
Does not plan for<br />
instructional strategies<br />
that encourage the<br />
development of<br />
performance skills.<br />
Materials and<br />
equipment are not<br />
ready at the start of the<br />
lesson or instructional<br />
activity.<br />
Occasionally plans for<br />
instructional strategies<br />
that encourage the<br />
development of<br />
performance skills.<br />
Materials and<br />
equipment are usually<br />
not ready at the start of<br />
the lesson or<br />
instructional activity.<br />
Plans for instructional<br />
strategies that<br />
encourage the<br />
development of<br />
performance skills.<br />
Ensures materials and<br />
equipment are ready at<br />
the start of the lesson<br />
or instructional activity<br />
(most of the time).<br />
Plans for instructional<br />
strategies that<br />
encourage the<br />
development of critical<br />
thinking, problem<br />
solving, and<br />
performance skills.<br />
Materials and<br />
equipment are ready at<br />
the start of the lesson<br />
or instructional activity.<br />
Plans for instructional<br />
strategies that<br />
encourage the<br />
development of critical<br />
thinking, problem<br />
solving and<br />
performance skills and<br />
consistently<br />
implements.<br />
Materials and equipment<br />
are ready at the start of<br />
the lesson or<br />
instructional activity and<br />
learning environment is<br />
conducive to the activity.<br />
2<br />
Domain: Classroom Management<br />
Teacher clearly defines expected behavior.<br />
1<br />
Ineffective<br />
Standards of conduct<br />
have not been<br />
established.<br />
Students are<br />
disengaged and unclear<br />
about the expectations<br />
of the classroom.<br />
Does not monitor the<br />
behavior of students<br />
during whole class,<br />
small groups, seat work<br />
activities and<br />
transitions.<br />
Usually ignores<br />
inappropriate behavior<br />
and uses an<br />
inappropriate voice<br />
level / word choice<br />
when correction is<br />
attempted.<br />
2<br />
Needs Improvement<br />
Standards of conduct<br />
have been established<br />
with inconsistent<br />
implementation.<br />
Students are usually<br />
disengaged and unclear<br />
about the expectations<br />
of the classroom.<br />
Rarely monitors the<br />
behavior of students<br />
during whole class,<br />
small groups, seat work<br />
activities and<br />
transitions.<br />
Most of the time<br />
ignores inappropriate<br />
behavior and / or uses<br />
an inappropriate voice<br />
level / word choice to<br />
attempt to bring<br />
correction.<br />
3<br />
Effective<br />
Establishes and posts<br />
standards of conduct<br />
and implements with<br />
consistency.<br />
Ensures that students<br />
are engaged and clear<br />
as to the expectations<br />
of the classroom with<br />
few reminders given.<br />
Monitors the behavior<br />
of students during<br />
whole-class, small<br />
group and seat work<br />
activities and during<br />
transitions between<br />
instructional activities.<br />
Stops inappropriate<br />
behavior promptly and<br />
consistently with an<br />
appropriate voice level /<br />
word choice.<br />
4<br />
Highly Effective<br />
Standards of conduct<br />
have been established<br />
and posted with<br />
consistent peer-based<br />
implementation.<br />
Students are engaged<br />
and clear about the<br />
expectations of the<br />
classroom with no need<br />
for reminders.<br />
Monitors the behavior of<br />
all students during<br />
whole-class, small group<br />
and seat work activities<br />
and during transitions<br />
between instructional<br />
activities, lunch time,<br />
recess, assemblies, etc.<br />
Stops inappropriate<br />
behavior promptly and<br />
consistently, with an<br />
appropriate voice level /<br />
word choice, while<br />
maintaining the dignity<br />
of the student.<br />
Dimension: Discipline<br />
5<br />
Superior<br />
Standards of conduct<br />
have been established<br />
and posted with<br />
consistent peer<br />
monitoring.<br />
Students are engaged<br />
and are clear about the<br />
expectations of the<br />
classroom and are<br />
responsible for their<br />
own learning.<br />
Monitors the behavior<br />
of all students at all<br />
times. Standards of<br />
conduct extend beyond<br />
the classroom.<br />
Stops inappropriate<br />
behavior promptly and<br />
consistently, with an<br />
appropriate voice level /<br />
word choice,<br />
maintaining the dignity<br />
of the student and<br />
encouraging students to<br />
self discipline.<br />
<strong>Tulsa</strong> <strong>Public</strong> <strong>Schools</strong><br />
2<br />
TLE Teacher Evaluation and Observation Rubric
3<br />
Domain: Classroom Management<br />
Dimension: Building-Wide Climate Responsibilities<br />
Teacher assures a contribution to building-wide positive climate responsibilities.<br />
1<br />
Ineffective<br />
Is not involved in school<br />
projects and initiatives<br />
that contribute to<br />
promoting orderly<br />
behavior throughout the<br />
school.<br />
Ignores the procedures,<br />
practices and guidelines<br />
outlined by the school,<br />
district, state and federal<br />
laws, intended to keep<br />
students healthy and<br />
safe.<br />
2<br />
Needs Improvement<br />
Participates in school<br />
projects and initiatives<br />
that contribute to<br />
promoting orderly<br />
behavior throughout the<br />
school when specifically<br />
requested and only for<br />
specified time.<br />
Inconsistently follows the<br />
procedures, practices<br />
and guidelines outlined<br />
by the school, district,<br />
state and federal laws,<br />
intended to keep<br />
students healthy and<br />
safe.<br />
3<br />
Effective<br />
Regularly and routinely<br />
participates in school<br />
projects and initiatives<br />
that contribute to<br />
promoting orderly<br />
behavior throughout the<br />
school.<br />
Follows the procedures,<br />
practices and guidelines<br />
outlined by the school,<br />
district, state and federal<br />
laws, intended to keep<br />
students healthy and<br />
safe.<br />
4<br />
Highly Effective<br />
Participates actively in<br />
school projects and<br />
initiatives that promote<br />
orderly behavior<br />
throughout the school<br />
volunteering for extra<br />
assignments / time<br />
periods.<br />
Follows the procedures,<br />
practices and guidelines<br />
outlined by the school,<br />
district, state and federal<br />
laws, intended to keep<br />
students healthy and<br />
safe. Offers<br />
enhancements and<br />
suggestions to<br />
procedures and<br />
guidelines.<br />
5<br />
Superior<br />
Makes substantial<br />
contribution to school<br />
projects and initiatives<br />
that promote orderly<br />
behavior throughout the<br />
school. Teacher assumes<br />
a leadership role in these<br />
projects and initiatives<br />
inspiring others to<br />
participate.<br />
Always follows the<br />
procedures, practices<br />
and guidelines outlined<br />
by the school, district,<br />
state and federal laws,<br />
intended to keep<br />
students healthy and<br />
safe. Is proactive in<br />
intervening on behalf of<br />
children and staff.<br />
4<br />
Domain: Classroom Management<br />
<strong>Tulsa</strong> <strong>Public</strong> <strong>Schools</strong><br />
3<br />
Dimension: Lesson Plans<br />
Teacher develops daily lesson plans designed to achieve the identified objectives.<br />
1<br />
Ineffective<br />
Only develops a brief outline<br />
of the daily schedule, which<br />
shows no alignment with<br />
state/common core<br />
standards and does not<br />
address student diversity<br />
and learning style.<br />
Plans are not completed.<br />
Never plans with other<br />
members of the gradelevel/school<br />
planning teams<br />
(when it is an expectation of<br />
the campus).<br />
Never provides substitute<br />
plans, classroom rosters,<br />
seating charts, behavior<br />
plans, emergency plans and<br />
identification of diverse<br />
learning groups.<br />
2<br />
Needs Improvement<br />
Develops instructional plans<br />
that are not in alignment<br />
with State / common core<br />
standards and does not<br />
address student's diversity<br />
and learning styles.<br />
Plans are rarely completed.<br />
Rarely plans with other<br />
members of the gradelevel/school<br />
planning teams<br />
(when it is an expectation of<br />
the campus).<br />
Rarely provides substitute<br />
plans, classroom rosters,<br />
seating charts, behavior<br />
plans, emergency plans and<br />
identification of diverse<br />
learning groups.<br />
3<br />
Effective<br />
Develops instructional plans<br />
that are in alignment with<br />
State / common core<br />
standards including an<br />
amount of strategies that<br />
address student diversity<br />
and learning styles.<br />
Plans are developed<br />
consistently and on time<br />
based upon an analysis of<br />
data.<br />
Plans with other members<br />
of the grade-level / school<br />
planning teams (when it is<br />
an expectation of the<br />
campus).<br />
Provides substitute plans,<br />
classroom rosters, seating<br />
charts, behavior plans,<br />
emergency plans and<br />
identification of diverse<br />
learning groups.<br />
4<br />
Highly Effective<br />
Develops instructional plans<br />
that are in alignment with<br />
State / common core<br />
standards and addresses<br />
student diversity and<br />
learning styles through<br />
differentiated instruction.<br />
Plans are developed<br />
consistently and on time or<br />
in advance.<br />
Plans with other members<br />
of the grade-level/school<br />
planning teams (when it is<br />
an expectation of the<br />
campus).<br />
Revises plans according to<br />
student data analysis and<br />
shares same with fellow<br />
staff members to the<br />
benefit of the grade level,<br />
curricular area or building.<br />
Provides in sequenced and<br />
organized fashion substitute<br />
plans, classroom rosters,<br />
seating charts, behavior<br />
plans, emergency plans and<br />
identification of diverse<br />
learning groups.<br />
5<br />
Superior<br />
Has long and short-term<br />
instructional plans that are<br />
aligned with State /<br />
common core (CCSS) /<br />
district PASS standards and<br />
address student diversity<br />
and learning styles through<br />
differentiated instruction<br />
and other research-based<br />
learning strategies.<br />
Plans are developed<br />
consistently and on time or<br />
in advance with inherent<br />
opportunity for continual<br />
revision &/or modification.<br />
Plans with other members<br />
of the grade-level / school<br />
planning teams (when it is<br />
an expectation of the<br />
campus or based upon<br />
collegial decision-making).<br />
Revises plans according to<br />
student data and<br />
performance.<br />
Can serve as a grade level,<br />
curricular area and/or<br />
building-wide model for<br />
substitute plans, classroom<br />
rosters, seating charts,<br />
behavior plans, emergency<br />
plans and identification of<br />
diverse learning groups.<br />
TLE Teacher Evaluation and Observation Rubric
5<br />
Domain: Classroom Management<br />
Dimension: Assessment Patterns<br />
Teacher utilizes assessments patterns that are fairly administered and based on identified<br />
criteria.<br />
1<br />
Ineffective<br />
2<br />
Needs Improvement<br />
3<br />
Effective<br />
4<br />
Highly Effective<br />
5<br />
Superior<br />
Assessment is<br />
inconsistent and<br />
insufficient to<br />
determine student's<br />
overall progress and is<br />
not based on the<br />
district’s grading policy.<br />
Assessments provide<br />
delayed and inadequate<br />
feedback for students<br />
to assess themselves.<br />
Assessment is<br />
inconsistent and is not<br />
based on district’s<br />
grading policy.<br />
Assessments provide<br />
delayed and inadequate<br />
feedback for students<br />
to assess themselves.<br />
Formative and<br />
summative assessments<br />
are recorded<br />
consistently based on<br />
district’s grading policy<br />
and are used to guide<br />
instruction.<br />
Provides adequate and<br />
timely feedback from<br />
assessment results for<br />
students to reflect and<br />
set goals.<br />
Formative and<br />
summative assessments<br />
are recorded<br />
consistently based on<br />
district’s grading policy<br />
and are used to develop<br />
and evaluate<br />
instruction.<br />
Assessments provide<br />
useful and immediate<br />
feedback that assists<br />
students in assessing<br />
themselves in meeting<br />
their learning goals.<br />
Formative and<br />
summative assessments<br />
are recorded<br />
consistently based on<br />
district’s grading policy<br />
and utilized to develop,<br />
refine and evaluate<br />
instruction.<br />
Assessments provide<br />
useful and immediate<br />
feedback that assists<br />
students in assessing<br />
themselves to develop<br />
and evaluate their<br />
progress with their<br />
learning goals.<br />
Learning goals are not<br />
only designed by the<br />
teacher but the student<br />
has an opportunity to<br />
direct his/her own<br />
learning by contributing<br />
goals.<br />
6<br />
Domain: Classroom Management<br />
Dimension: Work Area Environment<br />
Teacher optimizes the physical learning environment to assure student learning<br />
advantage in alignment with classroom management best practices.<br />
1<br />
Ineffective<br />
2<br />
Needs Improvement<br />
3<br />
Effective<br />
4<br />
Highly Effective<br />
5<br />
Superior<br />
The classroom (as set<br />
up by the teacher)<br />
prohibits learning<br />
opportunities, order,<br />
cleanliness, safety and<br />
ease of traffic flow.<br />
Physical resources are<br />
not utilized as designed<br />
and instructionally<br />
intended.<br />
The classroom lacks<br />
organization for<br />
learning opportunities,<br />
order, cleanliness,<br />
safety and ease of<br />
traffic flow.<br />
Physical resources are<br />
not optimized for<br />
effective utilization.<br />
The classroom is<br />
organized for providing<br />
learning opportunities,<br />
order, cleanliness,<br />
safety and ease of<br />
traffic flow.<br />
Physical resources are<br />
well placed in locations<br />
that enhance their<br />
functions and do not<br />
interfere with other<br />
functions.<br />
The classroom is<br />
attractive and organized<br />
for efficacy in learning<br />
opportunities, order,<br />
cleanliness, safety and<br />
ease of traffic flow.<br />
Physical resources,<br />
spaces for studying and<br />
learning activities and<br />
specific space for large<br />
group, small group<br />
and/or center work are<br />
well placed in locations<br />
that enhance their<br />
functions and do not<br />
interfere with other<br />
functions.<br />
Includes the narrative<br />
descriptions in<br />
performance category<br />
4, plus the classroom<br />
could serve as an<br />
exemplary model for<br />
replication at a grade /<br />
building level or<br />
curricular venue.<br />
<strong>Tulsa</strong> <strong>Public</strong> <strong>Schools</strong><br />
4<br />
TLE Teacher Evaluation and Observation Rubric
7<br />
Domain: Instructional Effectiveness<br />
Teacher embeds the components of literacy into all instructional content.<br />
1<br />
Ineffective<br />
2<br />
Needs Improvement<br />
3<br />
Effective<br />
4<br />
Highly Effective<br />
Literacy, the ability to<br />
read, write, spell, listen<br />
and speak, is not<br />
embedded / woven into<br />
instructional lessons;<br />
rather, it is presented as<br />
single, stand-alone<br />
skills.<br />
Literacy, the ability to<br />
read, write, spell, listen<br />
and speak, is rarely<br />
embedded / woven into<br />
instructional lessons;<br />
rather, it is presented as<br />
single, stand-alone<br />
skills. Students do not<br />
see literacy as the<br />
“bonding agent” for all<br />
learning.<br />
Literacy is embedded in<br />
ALL content.<br />
Literacy is embedded in<br />
ALL content and its<br />
definition is expanded<br />
to include visually<br />
representing,<br />
expressing ideas and<br />
opinions, making<br />
decisions and solving<br />
problems.<br />
Dimension: Literacy<br />
5<br />
Superior<br />
Includes the narrative<br />
descriptions in<br />
performance category<br />
4, plus the additional<br />
definitional<br />
components of literacy<br />
to include: multimedia,<br />
computer, information<br />
analysis and technology.<br />
8<br />
Domain: Instructional Effectiveness<br />
Dimension: Common Core<br />
Teacher understands and optimizes the delivery focus of Common Core State Standards<br />
and the expectations derived from same on student learning and achievement.<br />
1<br />
Ineffective<br />
2<br />
Needs Improvement<br />
3<br />
Effective<br />
4<br />
Highly Effective<br />
5<br />
Superior<br />
Neither understands<br />
nor participates (at<br />
even the “conversation<br />
/ awareness” level) in<br />
the multi-year<br />
conversion process<br />
from PASS to CCSS.<br />
Neither understands<br />
nor participates (at<br />
even a minimal<br />
implementation level)<br />
in the multi-year<br />
conversion process<br />
from PASS to CCSS.<br />
Understands and<br />
participates in the<br />
multi-year conversion<br />
process from an<br />
emphasis on PASS to an<br />
emphasis on CCSS as<br />
evidenced by use of<br />
alternate instructional<br />
strategies and modified<br />
content focus aligned<br />
with CCSS.<br />
Has participated in<br />
available learning<br />
opportunities to assure<br />
a strong foundation of<br />
understanding the<br />
conversion process<br />
from PASS to CCSS and<br />
regularly and routinely<br />
uses alternate<br />
instructional strategies<br />
and modified content<br />
focus aligned with CCSS.<br />
Includes the narrative<br />
descriptions in<br />
performance category<br />
4, plus serves as a<br />
“change agent” and/or<br />
grade level, curricular<br />
area, building-wide, or<br />
departmental presenter<br />
/ facilitator for the<br />
implementation of the<br />
conversion from PASS<br />
to CCSS. This<br />
participation level could<br />
be initiated via<br />
volunteering or being<br />
asked.<br />
<strong>Tulsa</strong> <strong>Public</strong> <strong>Schools</strong><br />
5<br />
TLE Teacher Evaluation and Observation Rubric
9<br />
Domain: Instructional Effectiveness<br />
Dimension: Involves All Learners<br />
Teacher uses questioning techniques and/or guided practices to involve all students in<br />
active learning.<br />
1<br />
Ineffective<br />
Students are not<br />
mentally engaged in<br />
active learning<br />
experiences.<br />
Displays no knowledge<br />
of students’ interests<br />
and skills.<br />
Does not ask any type<br />
of questions or use<br />
questioning techniques<br />
during the lesson to<br />
check for student<br />
understanding or to<br />
involve all learners.<br />
Student participation is<br />
not monitored or the<br />
teacher response is<br />
inconsistent, overly<br />
repressive or does not<br />
respect the student's<br />
dignity.<br />
2<br />
Needs Improvement<br />
A few students are<br />
minimally engaged in<br />
active learning<br />
experiences 50 percent<br />
of the class time.<br />
Displays little<br />
knowledge of students’<br />
interests and skills and<br />
rarely uses strategies.<br />
All or most questions<br />
used are recall<br />
questions.<br />
Typically calls on<br />
students who raise their<br />
hands first and<br />
responds to students<br />
who blurt out answers.<br />
A few students<br />
dominate the lesson.<br />
3<br />
Effective<br />
Engages most students<br />
in active learning<br />
experiences 80 percent<br />
of the class time.<br />
Uses questioning<br />
strategies throughout<br />
the lesson that are<br />
primarily at a lower or<br />
mid level of Bloom's<br />
taxonomy. Provides<br />
wait time for some<br />
student response and<br />
does random checking<br />
for understanding.<br />
Lesson progresses at a<br />
pace that<br />
accommodates most<br />
student questions and<br />
interests.<br />
Recognizes the value of<br />
understanding students’<br />
skills and interests.<br />
Asks critical thinking<br />
questions throughout<br />
the lesson and uses<br />
questioning techniques<br />
to involve all learners.<br />
4<br />
Highly Effective<br />
The significant majority<br />
of students are<br />
cognitively engaged and<br />
exploring content in<br />
active learning<br />
experiences 80 percent<br />
of the class time.<br />
Uses questioning<br />
strategies which include<br />
high and low levels of<br />
complexity, providing<br />
adequate wait time for<br />
most students to<br />
respond. A variety of<br />
techniques are used to<br />
solicit responses from<br />
most students<br />
throughout the lesson<br />
to check for student<br />
understanding.<br />
Uses varied questioning<br />
techniques that engage<br />
students in critical<br />
thinking.<br />
5<br />
Superior<br />
All students are<br />
cognitively engaged in<br />
active learning activities<br />
and assignments in<br />
exploration of content.<br />
Students initiate or<br />
adapt activities and<br />
projects to enhance<br />
their understanding.<br />
Questions are of high<br />
quality with adequate<br />
time wait time for all<br />
students to respond. A<br />
variety of techniques<br />
are used to solicit<br />
responses from all<br />
students before, during<br />
and after the lesson to<br />
check for student<br />
understanding and to<br />
encourage critical<br />
thinking.<br />
Students formulate<br />
many of their own<br />
questions. Uses full<br />
realm of Bloom’s<br />
taxonomy.<br />
Seizes opportunities to<br />
enhance learning,<br />
building on student<br />
interests or a<br />
spontaneous event.<br />
<strong>Tulsa</strong> <strong>Public</strong> <strong>Schools</strong><br />
6<br />
TLE Teacher Evaluation and Observation Rubric
10<br />
Domain: Instructional Effectiveness<br />
Teacher teaches the objectives through a variety of methods.<br />
1<br />
Ineffective<br />
Explanation of the<br />
content is unclear or<br />
confusing or uses<br />
inappropriate language.<br />
Does not use<br />
cooperative learning<br />
activities, advance<br />
organizers, teaching<br />
strategies that foster<br />
participation of<br />
students and activities<br />
that address a variety of<br />
learning styles /<br />
multiple intelligences to<br />
involve any of the<br />
learners.<br />
Students are provided<br />
with activities from the<br />
textbook, specific to the<br />
content but are not<br />
differentiated for varied<br />
needs or learning styles.<br />
Technology is not<br />
utilized as designed and<br />
not used as an<br />
instructional tool.<br />
No techniques used to<br />
make concepts clear.<br />
Lessons do not reflect<br />
the stated objectives.<br />
2<br />
Needs Improvement<br />
Explanation of the<br />
content is sporadic with<br />
some portions difficult<br />
to follow.<br />
Uses limited<br />
cooperative learning<br />
activities, advance<br />
organizers, teaching<br />
strategies that foster<br />
participation of<br />
students and activities<br />
that address a variety of<br />
learning styles /<br />
multiple intelligences to<br />
involve all learners.<br />
Uses an occasional<br />
strategy that is<br />
research-based. There is<br />
evidence of attempts to<br />
differentiate instruction<br />
for diverse learners<br />
without success.<br />
Technology is rarely<br />
included in the planning<br />
process to support<br />
instruction, and<br />
technology is not used<br />
on a regular basis as an<br />
instructional tool.<br />
Some techniques used<br />
to make concepts clear.<br />
Students are provided<br />
with activities from the<br />
textbook, specific to the<br />
content but are not<br />
varied.<br />
3<br />
Effective<br />
Explains content<br />
appropriately and<br />
connects with students’<br />
knowledge and<br />
experience.<br />
Uses cooperative<br />
learning activities,<br />
advance organizers and<br />
teaching strategies that<br />
foster participation of<br />
students. Uses some<br />
activities that address a<br />
variety of learning styles<br />
/ multiple intelligences<br />
to involve all learners.<br />
Provides differentiated<br />
tasks to meet the varied<br />
learning styles and<br />
needs of students. An<br />
understanding of the<br />
concepts, tools of<br />
inquiry and structures<br />
of the discipline is<br />
evidenced through<br />
research-based<br />
strategies that support<br />
the standards and<br />
promote student<br />
engagement.<br />
Technology is included<br />
in the planning process<br />
to support instruction,<br />
and technology is used<br />
on a regular basis as an<br />
instructional tool.<br />
Uses a variety of<br />
techniques to make<br />
content clear (e.g.<br />
modeling, visuals,<br />
hands-on activities,<br />
demonstrations,<br />
gestures, body<br />
language).<br />
4<br />
Highly Effective<br />
Explanation of content<br />
is imaginative, ongoing<br />
and connects with<br />
students’ knowledge<br />
and experience.<br />
Utilizes the knowledge<br />
of student skills and<br />
interests to decide<br />
which cooperative<br />
learning activities,<br />
advance organizers and<br />
teaching strategies that<br />
foster participation of<br />
students. Activities that<br />
address a variety of<br />
learning styles /<br />
multiple intelligences<br />
are used to maximize<br />
student potential.<br />
Technology is woven<br />
into / serves as a<br />
foundational base in the<br />
planning process to<br />
support instruction, and<br />
technology is used on a<br />
common-place basis as<br />
an instructional tool.<br />
Students contribute to<br />
explaining concepts to<br />
their peers.<br />
Dimension: Explains Content<br />
5<br />
Superior<br />
Uses all of the<br />
characteristics of Level 4.<br />
Additionally, the teacher<br />
has an understanding of<br />
the concepts, tools of<br />
inquiry and structures of<br />
the discipline. This is<br />
evidenced through<br />
research-based strategies<br />
that support the<br />
standards and promote<br />
student engagement.<br />
Utilizes the knowledge of<br />
student skills and<br />
interests to determine<br />
appropriate cooperative<br />
learning activities,<br />
advance organizers and<br />
teaching strategies that<br />
successfully foster<br />
participation of students.<br />
Activities that address<br />
individual learning styles<br />
and multiple intelligences<br />
are used to help<br />
maximize student<br />
potential.<br />
Students are included in<br />
planning for methods of<br />
instructional delivery.<br />
Uses differentiated tasks<br />
including (modeling,<br />
visuals, hands-on<br />
activities,<br />
demonstrations,<br />
gestures, body language,<br />
and thematic instruction)<br />
to teach the objectives<br />
that are research-based.<br />
Technology has achieved<br />
an efficacy level not only<br />
in the support of<br />
instruction but in and by<br />
itself is an instructional<br />
platform.<br />
Continually seeks out<br />
new methods and<br />
strategies to better teach<br />
and willingly shares<br />
discoveries and successes<br />
with colleagues.<br />
<strong>Tulsa</strong> <strong>Public</strong> <strong>Schools</strong><br />
7<br />
TLE Teacher Evaluation and Observation Rubric
11<br />
Domain: Instructional Effectiveness<br />
Dimension: Explains Directions<br />
Teacher gives directions that are clearly stated and relate to the learning objectives.<br />
1<br />
Ineffective<br />
Directions and<br />
procedures are<br />
confusing to students.<br />
Does not offer<br />
alternative, clarifying<br />
directions.<br />
Does not give students<br />
directions for<br />
transitions and does not<br />
plan for transitions.<br />
Spoken language is<br />
inaudible or written<br />
language is illegible.<br />
Spoken or written<br />
language contains<br />
errors of grammar or<br />
syntax. Vocabulary may<br />
be inappropriate, vague<br />
or used incorrectly<br />
causing students to be<br />
confused.<br />
2<br />
Needs Improvement<br />
Directions and<br />
procedures are initially<br />
confusing to students<br />
and are not clarified.<br />
Attempts to give<br />
students directions for<br />
transitions but does not<br />
plan for transitions.<br />
Spoken language is<br />
audible and written<br />
language is legible.<br />
Usage of both<br />
demonstrates many<br />
basis errors<br />
(mispronunciation,<br />
misspelled words, etc.).<br />
Vocabulary is correct,<br />
but limited, or is not<br />
appropriate to the<br />
students’ ages or<br />
backgrounds.<br />
3<br />
Effective<br />
Provides directions and<br />
procedures, in a variety<br />
of delivery modes, e.g.,<br />
verbal, modeling, visual,<br />
demonstration, etc.,<br />
that are clearly stated /<br />
presented and relate to<br />
the learning objectives.<br />
Gives students<br />
directions for<br />
transitions and includes<br />
transitioning in the<br />
planning process to<br />
optimize academic<br />
learning time.<br />
Uses spoken and<br />
written language that is<br />
clear and correct,<br />
conforms to standard<br />
English, vocabulary, and<br />
is appropriate to<br />
students’ ages and<br />
interests.<br />
4<br />
Highly Effective<br />
Directions and<br />
procedures, in a variety<br />
of delivery modes, are<br />
clear to students.<br />
Anticipation of possible<br />
student<br />
misunderstanding<br />
and/or confusion is<br />
incorporated in the<br />
initial direction and<br />
clarified.<br />
Gives clear directions<br />
for transitions between<br />
lessons and between<br />
instructional activities<br />
while optimizing<br />
academic learning time.<br />
Spoken and written<br />
language is clear and<br />
correct and conforms to<br />
standard English.<br />
Vocabulary is<br />
appropriate to the<br />
students’ ages and<br />
interests. Teacher finds<br />
opportunities to extend<br />
students’ vocabularies.<br />
5<br />
Superior<br />
Uses all of the<br />
characteristics of Levels<br />
3 and 4. Facilitates<br />
students in constructing<br />
their own<br />
understanding of how<br />
the directions relate to<br />
the learning objectives.<br />
Plans for smooth,<br />
structured transitions<br />
between lessons and<br />
instructional activities<br />
and gives clear, concise<br />
directions to accomplish<br />
same while optimizing<br />
academic learning time.<br />
Spoken and written<br />
language is correct and<br />
conforms to standard<br />
English. It is also<br />
expressive with wellchosen<br />
vocabulary that<br />
enriches the lesson and<br />
extends students’<br />
vocabularies. Teacher<br />
seizes opportunities to<br />
enhance learning by<br />
building vocabulary<br />
skills and experiences<br />
based on student<br />
interests or a<br />
spontaneous event.<br />
12<br />
Domain: Instructional Effectiveness<br />
Teacher demonstrates / models the desired skill or process.<br />
1<br />
Ineffective<br />
Does not demonstrate<br />
or model the desired<br />
skill or process.<br />
2<br />
Needs Improvement<br />
Demonstration or<br />
modeling of the desired<br />
skill or process is<br />
infrequent and unclear<br />
to students.<br />
3<br />
Effective<br />
Provides<br />
demonstrations and<br />
modeling of the desired<br />
skill or process that are<br />
clear and precise to<br />
students.<br />
4<br />
Highly Effective<br />
Demonstrations are<br />
clear and precise to<br />
students with<br />
anticipation and<br />
preemptive action to<br />
avoid possible students'<br />
misunderstanding.<br />
Dimension: Models<br />
5<br />
Superior<br />
Demonstrations will<br />
match all characteristics<br />
of Level 4. Additionally,<br />
teacher’s modeling will<br />
assist students in<br />
achieving the lesson’s<br />
stated objective.<br />
Students will<br />
demonstrate the skill or<br />
process.<br />
<strong>Tulsa</strong> <strong>Public</strong> <strong>Schools</strong><br />
8<br />
TLE Teacher Evaluation and Observation Rubric
13<br />
Domain: Instructional Effectiveness<br />
1<br />
Ineffective<br />
Dimension: Monitors<br />
Teacher checks to determine if students are progressing toward stated objectives.<br />
2<br />
3<br />
4<br />
Needs Improvement Effective<br />
Highly Effective<br />
5<br />
Superior<br />
Never moves around<br />
the room while<br />
students are working on<br />
guided practice.<br />
Never uses student<br />
response techniques to<br />
increase active<br />
engagement.<br />
Never uses feedback<br />
concerning student’s<br />
understanding.<br />
Never uses wait time<br />
after voicing a question<br />
to the students.<br />
Seldom moves around<br />
the room while<br />
students are working on<br />
guided practice to<br />
promote and reinforce<br />
positive student<br />
behaviors. When<br />
movement happens it is<br />
to the same area of<br />
classroom.<br />
Seldom uses student<br />
response techniques to<br />
increase active<br />
engagement.<br />
Seldom uses feedback<br />
concerning student’s<br />
understanding.<br />
Seldom uses wait time<br />
after voicing a question<br />
to the students.<br />
When appropriate,<br />
moves to all areas of<br />
the room while<br />
students are working on<br />
guided practice to<br />
promote and reinforce<br />
positive student<br />
behaviors.<br />
Uses different types of<br />
student response<br />
techniques, both<br />
individual / group.<br />
Uses student response<br />
techniques to increase<br />
active engagement.<br />
Student’s<br />
understanding is<br />
evaluated by feedback.<br />
Uses wait time of 3-5<br />
seconds (more for more<br />
complex questions)<br />
after voicing the<br />
question. Provides<br />
opportunity for<br />
students to formulate<br />
more thoughtful<br />
responses and allows<br />
time for the student to<br />
consider supporting<br />
evidence.<br />
Moves to all areas of<br />
the room with efficiency<br />
and effectiveness while<br />
students are working on<br />
guided practice to<br />
promote and reinforce<br />
positive student<br />
behaviors. Makes eye<br />
contact with all<br />
students often.<br />
Routinely uses<br />
developmentally<br />
appropriate student<br />
response techniques to<br />
increase active<br />
engagement by the<br />
students. Uses<br />
immediate feedback<br />
concerning student’s<br />
understanding.<br />
Routinely uses wait<br />
time of 3-5 seconds<br />
(additional time for<br />
more complex<br />
questions) after voicing<br />
the question. Provides<br />
opportunity for<br />
students to formulate<br />
more thoughtful<br />
responses and allows<br />
time for the student to<br />
consider supporting<br />
evidence. Re-phrases<br />
the question after<br />
hearing student<br />
response to probe for<br />
deeper understanding<br />
of concept utilizing<br />
appropriate wait time.<br />
Moves throughout the<br />
room to assure optimal<br />
instructional impact<br />
while students are<br />
working on guided<br />
practice to promote and<br />
reinforce positive<br />
student behaviors.<br />
When a problem is<br />
observed reviews / reteaches<br />
it to the whole<br />
class.<br />
Delivers upon all of<br />
performance category 4<br />
and varied response<br />
techniques are used to<br />
provide immediate<br />
feedback to re-teach /<br />
review the concept(s)<br />
misinterpreted or not<br />
learned, while actively<br />
engaging all students.<br />
Delivers upon all of<br />
performance category 4<br />
and is able to assess<br />
when question / wait<br />
time is no longer<br />
effective and employs a<br />
different strategy /<br />
technique.<br />
<strong>Tulsa</strong> <strong>Public</strong> <strong>Schools</strong><br />
9<br />
TLE Teacher Evaluation and Observation Rubric
14<br />
Domain: Instructional Effectiveness<br />
Teacher changes instruction based on the results of monitoring.<br />
1<br />
Ineffective<br />
2<br />
Needs Improvement<br />
3<br />
Effective<br />
Dimension: Adjusts Based Upon Monitoring<br />
4<br />
Highly Effective<br />
5<br />
Superior<br />
Does not adjust<br />
instructional plan to<br />
meet the needs of<br />
students. Lesson pace<br />
is too fast or slow to<br />
accommodate for<br />
students’ questions or<br />
interest.<br />
Does not assess<br />
mastery of the new<br />
learning to determine if<br />
independent practice or<br />
re-teaching is<br />
appropriate.<br />
There is no evidence<br />
that the teacher uses<br />
data from various<br />
assessments to modify<br />
instruction and guide<br />
intervention strategies.<br />
Inconsistently monitors<br />
student involvement<br />
and makes some effort<br />
to adjust instructional<br />
plans to engage more<br />
students.<br />
Inconsistently assesses<br />
mastery of the new<br />
learning to determine if<br />
independent practice or<br />
re-teaching is<br />
appropriate without<br />
making adjustments as<br />
necessary.<br />
There is little evidence<br />
that data is used from<br />
various assessments to<br />
modify instruction and<br />
guide intervention<br />
strategies.<br />
Consistently monitors<br />
student involvement<br />
and makes efforts to<br />
adjust instructional<br />
plans to engage more<br />
students.<br />
Assesses mastery of the<br />
new learning to<br />
determine if<br />
independent practice or<br />
re-teaching is<br />
appropriate and makes<br />
adjustments to lessons.<br />
Reviews data from<br />
assessments to modify<br />
instruction and guide<br />
intervention strategies.<br />
Is aware of student<br />
participation and<br />
smoothly makes<br />
appropriate<br />
adjustments to the<br />
lesson successfully<br />
accommodating student<br />
questions or interests.<br />
Assesses mastery of the<br />
new learning using a<br />
variety of methods to<br />
determine if<br />
independent practice or<br />
re-teaching is<br />
appropriate and<br />
restructures lessons to<br />
address various learning<br />
needs.<br />
Uses data from various<br />
assessments to modify<br />
instruction and to<br />
determine what<br />
additional interventions<br />
can be implemented to<br />
assist students.<br />
Is always aware of<br />
student participation<br />
and successfully<br />
engages all students in<br />
the lesson. Is able to<br />
successfully make<br />
adjustments to the<br />
lesson to accommodate<br />
student questions or<br />
interests.<br />
Assesses mastery of the<br />
new learning using a<br />
variety of methods to<br />
determine if<br />
independent practice or<br />
re-teaching is<br />
appropriate. Works<br />
with individual students<br />
or small groups to<br />
reteach. Uses peer<br />
tutoring to facilitate<br />
mastery of skills.<br />
Multiple classroom<br />
evaluations,<br />
assessments and formal<br />
State assessments<br />
provide ample and<br />
varied opportunity for<br />
all students to<br />
demonstrate their<br />
knowledge and skill set<br />
levels. Ongoing<br />
assessment is<br />
systematically used to<br />
modify instruction and<br />
guide intervention<br />
strategies.<br />
<strong>Tulsa</strong> <strong>Public</strong> <strong>Schools</strong><br />
10<br />
TLE Teacher Evaluation and Observation Rubric
15<br />
Domain: Instructional Effectiveness<br />
Teacher summarizes and fits into context what has been taught.<br />
1<br />
Ineffective<br />
Does not teach students<br />
to summarize new<br />
learning in a variety of<br />
ways. There is no<br />
ending to the lesson.<br />
Students disengage at<br />
the end of the class<br />
with no teacher<br />
direction.<br />
2<br />
Needs Improvement<br />
Students are asked to<br />
summarize new<br />
learning but are not<br />
taught why it’s<br />
important or how to do<br />
it. The teacher ends the<br />
lesson without a<br />
summary of the main<br />
points of the segment<br />
of instruction or day’s<br />
learning/activity and<br />
does not relate it to<br />
how the learning will be<br />
needed in the future.<br />
3<br />
Effective<br />
Ends the day’s learning<br />
/ activity by<br />
summarizing the lesson<br />
and teaches students to<br />
summarize new<br />
learning.<br />
Connects what is<br />
learned to prior<br />
learning.<br />
Dimension: Establishes Closure<br />
4<br />
Highly Effective<br />
Summarizes the lesson<br />
in a variety of ways and<br />
relates instruction to<br />
prior and future<br />
learning.<br />
Students are able to<br />
summarize in a variety<br />
of ways and reflect on<br />
their own learning.<br />
5<br />
Superior<br />
Facilitates students in<br />
summarizing and<br />
discussing main ideas.<br />
Students are able to<br />
connect the lesson to<br />
prior learning and<br />
articulate how learned<br />
skills can be used in the<br />
future. Linkages with<br />
real world situations are<br />
woven into the lessons.<br />
<strong>Tulsa</strong> <strong>Public</strong> <strong>Schools</strong><br />
11<br />
TLE Teacher Evaluation and Observation Rubric
Domain: Instructional Effectiveness<br />
Dimension:<br />
16<br />
Student Achievement<br />
Use of common / varied assessments, tracking of student progress, use of data from<br />
various assessments, recognition of student achievement, appropriately modifying assessments.<br />
1<br />
Ineffective<br />
2<br />
Needs Improvement<br />
3<br />
Effective<br />
4<br />
Highly Effective<br />
5<br />
Superior<br />
There is no evidence<br />
that the teacher<br />
recognizes student<br />
progress or<br />
achievement.<br />
There is no evidence<br />
that the teacher is<br />
knowledgeable of the<br />
IEP or that the teacher<br />
modifies instruction for<br />
all students on an IEP<br />
regardless of student’s<br />
learning goals.<br />
When a student has<br />
difficulty learning, the<br />
teacher either gives up<br />
or blames the student<br />
or the student’s home<br />
environment.<br />
There is some evidence<br />
that students are<br />
recognized for their<br />
progress and<br />
achievement; however,<br />
recognition is sporadic.<br />
There is some evidence<br />
that the teacher is<br />
aware of the IEP;<br />
however, the IEP is not<br />
being used to guide<br />
instruction for the<br />
student.<br />
When a student has<br />
difficulty learning, the<br />
teacher makes an<br />
ineffectual effort and<br />
quickly gives up or<br />
blames the student or<br />
the student’s home<br />
environment.<br />
Recognizes student<br />
progress and<br />
achievement at<br />
significant intervals and<br />
encourages behaviors<br />
that would result in<br />
student success.<br />
Modifies assessments<br />
for special student<br />
populations in<br />
alignment with the IEP.<br />
Provides required<br />
feedback to student,<br />
roster teacher and/or<br />
parent.<br />
Assures that all<br />
students have access to<br />
standard / common<br />
core / district<br />
curriculum.<br />
Accepts responsibility<br />
for the success of all<br />
students.<br />
Students are informed<br />
regularly regarding their<br />
progress and<br />
achievement and are<br />
provided opportunities<br />
to improve and achieve<br />
academic success.<br />
Works with individual<br />
students to develop a<br />
mutually acceptable<br />
plan for "success."<br />
Modifies assessments<br />
for special student<br />
populations as indicated<br />
in IEP and as needed.<br />
Provides frequent /<br />
timely feedback to<br />
student, teacher or<br />
parent.<br />
Assures that all<br />
students have access<br />
and modifications to<br />
standard /common core<br />
/district curriculum.<br />
Perseveres in seeking<br />
effective approaches for<br />
students who have<br />
difficulty learning<br />
drawing on a broad<br />
repertoire of strategies.<br />
Students are informed<br />
regularly regarding their<br />
progress and<br />
achievement and are<br />
provided opportunities<br />
to improve and achieve<br />
academic success. The<br />
teacher informs parents<br />
on a timely basis of<br />
their student’s progress<br />
and achievement<br />
through systematic<br />
communication<br />
procedures.<br />
Informs student, roster<br />
teacher and parent of<br />
the results of<br />
modifications on<br />
student progress and<br />
participates as a team<br />
member in<br />
recommending needed<br />
changes in<br />
modifications. The<br />
teacher consistently<br />
advocates for all special<br />
needs students to have<br />
direct access to<br />
standard /common core<br />
/district curriculum.<br />
Perseveres in seeking<br />
effective approaches for<br />
students who need help<br />
using an extensive<br />
repertoire of strategies<br />
and soliciting additional<br />
resources from the<br />
school and community.<br />
Maintains contact with<br />
the student to monitor<br />
and encourage<br />
participation even after<br />
the student has moved<br />
on (to another class).<br />
<strong>Tulsa</strong> <strong>Public</strong> <strong>Schools</strong><br />
12<br />
TLE Teacher Evaluation and Observation Rubric
17<br />
Domain: Professional Growth and Continuous Improvement<br />
Uses Professional Growth as a Continuous Improvement Strategy<br />
1<br />
Ineffective<br />
Does not participate in<br />
professional<br />
development that<br />
updates their content<br />
knowledge and<br />
professional practices.<br />
18<br />
2<br />
Needs Improvement<br />
Participates in a portion<br />
of the required<br />
minimum hours of<br />
professional<br />
development. The<br />
professional<br />
development does not<br />
update their content<br />
knowledge and current<br />
professional practices.<br />
3<br />
Effective<br />
Participates in the<br />
required minimum<br />
hours of professional<br />
development updating<br />
their content<br />
knowledge and current<br />
professional practices.<br />
Domain: Professional Growth and Continuous Improvement<br />
4<br />
Highly Effective<br />
Participates in the<br />
required hours of<br />
professional<br />
development and seeks<br />
additional training to<br />
update their content<br />
knowledge and<br />
professional practices<br />
beyond what is<br />
required.<br />
Exhibits behaviors and efficiencies associated with professionalism.<br />
1<br />
Ineffective<br />
Exhibits documentable<br />
patterns of repeated<br />
inconsistent reliabilitybased<br />
behavior patterns<br />
as delineated in<br />
performance category 3<br />
– Effective.<br />
2<br />
Needs Improvement<br />
Exhibits inconsistent<br />
reliability-based<br />
behavior patterns as<br />
evidenced by flawed<br />
punctuality and<br />
dependability; not<br />
adhering to prescribed<br />
arrival and departure<br />
times; not following<br />
notification and<br />
reporting procedures<br />
for absences; not<br />
complying with<br />
reporting timelines and<br />
other time sensitive<br />
info./compliance<br />
requests.<br />
3<br />
Effective<br />
Exhibits consistent<br />
reliability-based<br />
behavior patterns as<br />
evidenced by<br />
punctuality and<br />
dependability; adhering<br />
to prescribed arrival<br />
and departure times;<br />
following notification<br />
and reporting<br />
procedures for<br />
absences; complying<br />
with reporting timelines<br />
and other time sensitive<br />
info./compliance<br />
requests.<br />
4<br />
Highly Effective<br />
Exhibits highly<br />
consistent reliabilitybased<br />
behavior patterns<br />
as evidenced by<br />
punctuality and<br />
dependability; adhering<br />
to prescribed arrival<br />
and departure times;<br />
following notification<br />
and reporting<br />
procedures for<br />
absences; complying<br />
with reporting timelines<br />
and other time sensitive<br />
info./compliance<br />
requests<br />
5<br />
Superior<br />
In addition to<br />
participating in the<br />
required hours of prof.<br />
development and add'l<br />
training, the teacher<br />
makes a substantial<br />
contribution to the<br />
profession through<br />
activities such as,<br />
coaching and mentoring<br />
new teachers, training<br />
teachers in professional<br />
practices, making<br />
presentations,<br />
conducting action<br />
research, working<br />
towards Master<br />
Teacher Certification<br />
and/or writing articles<br />
for grade level,<br />
department level,<br />
internal / school-wide<br />
and/or external<br />
publication. Writings<br />
that could be used as<br />
“models” may include<br />
classroom newsletters,<br />
parent / community<br />
communications, etc.<br />
5<br />
Superior<br />
Serves as a model and<br />
mentor exhibiting<br />
consistent reliabilitybased<br />
behavior patterns<br />
as evidenced by<br />
punctuality and<br />
dependability; adhering<br />
to prescribed arrival<br />
and departure times;<br />
following notification<br />
and reporting<br />
procedures for<br />
absences; complying<br />
with reporting timelines<br />
and other time sensitive<br />
info./compliance<br />
requests.<br />
<strong>Tulsa</strong> <strong>Public</strong> <strong>Schools</strong><br />
13<br />
TLE Teacher Evaluation and Observation Rubric
19<br />
Domain: Interpersonal Skills<br />
Effective Interactions and Communications with Stakeholders.<br />
1<br />
Ineffective<br />
Provides minimal or no<br />
information to families<br />
and makes no attempt<br />
to engage them in the<br />
educational program.<br />
Oral, written and<br />
nonverbal<br />
communication is<br />
unclear (without regard<br />
to student<br />
misconceptions) and<br />
inconsiderate to<br />
students, as<br />
characterized by<br />
insensitivity, demeaning<br />
language and<br />
condescension<br />
Makes decisions based<br />
on self-serving<br />
interests. Never<br />
consults other staff or<br />
team members.<br />
2<br />
Needs Improvement<br />
Appears to be<br />
inconsistent and<br />
inaccurate in providing<br />
information to families<br />
and engaging them in<br />
the educational<br />
program.<br />
Oral, written, and<br />
nonverbal<br />
communication may not<br />
be considerate and<br />
usually requires further<br />
explanations to avoid<br />
confusion.<br />
Makes decisions<br />
assuming the result will<br />
be positive for<br />
everyone. Never checks<br />
to see if it is or will be.<br />
3<br />
Effective<br />
Interacts with families<br />
in a timely, consistent,<br />
positive and<br />
professional manner.<br />
Complies with school<br />
procedures for<br />
communicating with<br />
families and makes an<br />
effort to engage<br />
families in the<br />
educational program.<br />
Uses effective<br />
communication skills<br />
with students.<br />
Demonstrates<br />
communication skills<br />
(oral, written and<br />
nonverbal) that are<br />
clear, considerate,<br />
positive and rarely<br />
requires further<br />
explanations.<br />
Collaborates<br />
appropriately and<br />
makes decisions that<br />
reflect genuine<br />
professional<br />
consideration.<br />
4<br />
Highly Effective<br />
Communicates<br />
frequently and<br />
sensitively with families<br />
and engages them in<br />
the educational<br />
program.<br />
Oral, written, and<br />
nonverbal<br />
communication is clear,<br />
considerate, sensitive<br />
and positive.<br />
Further explanations to<br />
avoid confusion are not<br />
needed.<br />
Maintains an open mind<br />
and participates in<br />
collaborative decision<br />
making respecting and<br />
considering the<br />
thoughts of other peers.<br />
5<br />
Superior<br />
Communicates<br />
consistently and<br />
sensitively with families<br />
and uses diverse<br />
methods to engage<br />
them in the educational<br />
program and supports<br />
their participation.<br />
Oral, written, and<br />
nonverbal<br />
communication is clear<br />
(with conscientious<br />
regard and anticipation<br />
of possible student<br />
misconceptions),<br />
considerate, sensitive<br />
and positive.<br />
Communication is<br />
clearly understood by<br />
diverse stakeholders.<br />
Takes a leadership role<br />
in advocating that all<br />
collaborative decisions<br />
are based on the<br />
highest professional<br />
standards. Seeks out<br />
the expertise and<br />
opinion of other<br />
professionals before<br />
considering<br />
collaborative decisions.<br />
<strong>Tulsa</strong> <strong>Public</strong> <strong>Schools</strong><br />
14<br />
TLE Teacher Evaluation and Observation Rubric
20<br />
Domain: Leadership<br />
1<br />
Ineffective<br />
2<br />
Needs Improvement<br />
3<br />
Effective<br />
4<br />
Highly Effective<br />
5<br />
Superior<br />
Provides no evidence of<br />
leadership as described<br />
in performance<br />
category 3 – Effective.<br />
Declines becoming<br />
involved in school<br />
events.<br />
Avoids becoming<br />
involved in school and<br />
district projects.<br />
Makes no effort to<br />
share knowledge with<br />
others or to assume<br />
professional<br />
responsibilities.<br />
Rarely contributes to<br />
the modification of<br />
school practices that<br />
would result in students<br />
being better served by<br />
the school.<br />
Participates in school<br />
events when asked.<br />
Participates in school<br />
and district projects<br />
when asked.<br />
Finds ways to<br />
contribute to the<br />
profession and follows<br />
through.<br />
Assumes a proactive<br />
role in addressing<br />
student needs.<br />
Volunteers to<br />
participate in school<br />
events making a<br />
substantial<br />
contribution.<br />
Volunteers to<br />
participate in school<br />
and district projects<br />
making a substantial<br />
contribution.<br />
Participates actively in<br />
assisting other<br />
educators.<br />
Works within the<br />
context of a particular<br />
team or department to<br />
ensure that all students<br />
receive a fair and equal<br />
opportunity to succeed.<br />
Volunteers to<br />
participate in school<br />
events, making a<br />
substantial contribution<br />
and assumes a<br />
leadership role in at<br />
least some aspect of<br />
school life.<br />
Volunteers to<br />
participate in school /<br />
district projects, making<br />
a substantial<br />
contribution /<br />
leadership role in a<br />
major school or district<br />
project.<br />
Initiates important<br />
activities to contribute<br />
to the profession, such<br />
as mentoring new<br />
teachers and/or writing<br />
articles for publication<br />
and/or making<br />
presentations.<br />
Makes a particular<br />
effort to challenge<br />
negative attitudes and<br />
helps ensure that all<br />
students, particularly<br />
those traditionally<br />
underserved, are<br />
respected in the school.<br />
<strong>Tulsa</strong> <strong>Public</strong> <strong>Schools</strong><br />
15<br />
TLE Teacher Evaluation and Observation Rubric
ESEA Waiver<br />
District Capacity Determination for School Improvement<br />
The following document is responsive to the OSDE’s request for information regarding:<br />
Equitable distribution of:<br />
1. Highly qualified teachers and<br />
2. Effective teachers.<br />
1. Distribution of Highly Qualified Teachers<br />
2011-2012<br />
% HQ in Core<br />
ANDERSON ELEMENTARY 100<br />
CELIA CLINTON ELEMENTARY 100<br />
CENTRAL HIGH 100<br />
CLINTON MIDDLE 100<br />
EAST CENTRAL HIGH 100<br />
GREELEY ELEMENTARY 100<br />
HALE HIGH 100<br />
LINDBERGH ELEMENTARY 100<br />
MACARTHUR ELEMENTARY 100<br />
MARSHALL ELEMENTARY 100<br />
MCCLURE ELEMENTARY 100<br />
MCKINLEY ELEMENTARY 100<br />
MCLAIN HIGH 100<br />
SEQUOYAH ELEMENTARY 100<br />
SPRINGDALE ELEMENTARY 100<br />
WEBSTER HIGH 100<br />
WHITMAN ELEMENTARY 100<br />
Number of Priority <strong>Schools</strong> with at<br />
least one teacher not HQ<br />
Number of non-Priority <strong>Schools</strong><br />
with at least one teacher not HQ<br />
0 schools<br />
0 teachers<br />
3 schools<br />
3 teachers total
2<br />
2. Distribution of Effective Teachers (by Value-Added Scores)<br />
In the past, the primary method of communicating a school's performance was student achievement data, a<br />
measurement of student knowledge at a single point in time and how well that performance compares against a<br />
standard. Achievement data alone, however, does not reflect the effectiveness of a school. Growth measures like<br />
value-added provide a more complete and accurate picture of a school's impact on student achievement over a school<br />
year. It isolates the effectiveness of the school and its teachers by combining achievement and growth information<br />
with other data sources to statistically control for factors outside of educators’ influence such as students' starting<br />
points, whether they are English language learners, their disability status, etc. Using value-added along with other data<br />
allows us to separate what we think is happening from what is actually happening.<br />
Value-added data is available now for 2009-2010 and 2010-2011. It is being used for information, analysis and<br />
improvement. The statistical modeling and reporting is provided by the Value Added Research Center (VARC) of Univ.<br />
of Wisconsin. In general terms, VARC calculates the gain of scale score points for students at each school using a<br />
prior-test and a post-test. Due to the statistical controls that eliminate the effect of external factors (starting point,<br />
student demographics, etc.), value-added data reveals in which schools students are growing faster than average and in<br />
which schools students are growing slower than average. The District average is set at three. Consequently, schools<br />
with high value-added are greater than three, and schools with value added estimates less than 3 are low value-added<br />
schools. 1 The following tables reflect the distribution of teachers by their value-added scores for the 2010-2011 school<br />
year.<br />
1<br />
Please note that value-added data for Burroughs <strong>Elementary</strong> is not available because it would reveal one or more<br />
individual teachers’ value added data, which is confidential and protected from disclosure.
3<br />
VA Score<br />
Distribution of Teachers by Value Added Scores (all subjects)<br />
Average Distribution of<br />
VA Scores by School<br />
Non-priority <strong>Schools</strong><br />
Frequency<br />
Pct of Prior + Non-Prior<br />
Pct of Non-Prior’s Total<br />
4<br />
Distribution of Teachers by Value Added Scores (all subjects)<br />
VA Score<br />
Average Distribution of<br />
VA Scores by School<br />
Non-priority <strong>Schools</strong><br />
Frequency<br />
Pct of Prior + Non-Prior<br />
Pct of Non-Prior’s Total<br />
5<br />
Distribution of Teachers by Value Added Scores (all subjects)<br />
VA Score<br />
Average Distribution of<br />
VA Scores by School<br />
Non-priority <strong>Schools</strong><br />
Frequency<br />
Pct of Prior + Non-Prior<br />
Pct of Non-Prior’s Total<br />
1
6<br />
Distribution of Teachers by Value Added Scores (Math only)<br />
VA Score Average Distribution of<br />
VA Scores by School<br />
Non-priority <strong>Schools</strong><br />
Frequency<br />
Pct of Prior + Non-Prior<br />
Pct of Non-Prior’s Total<br />
7<br />
Distribution of Teachers by Value Added Scores (Math only)<br />
VA<br />
Score<br />
Average Distribution of<br />
VA Scores by School<br />
Non-priority <strong>Schools</strong><br />
Frequency<br />
Pct of Prior + Non-Prior<br />
Pct of Non-Prior’s Total<br />
1
8<br />
Distribution of Teachers by Value Added Scores (Math only)<br />
VA<br />
Score<br />
Average Distribution of<br />
VA Scores by School<br />
Non-priority <strong>Schools</strong><br />
Frequency<br />
Pct of Prior + Non-Prior<br />
Pct of Non-Prior’s Total<br />
1
9<br />
Distribution of Teachers by Value Added Scores (Reading/English only)<br />
VA<br />
Score<br />
Average Distribution of<br />
VA Scores by School<br />
Non-priority <strong>Schools</strong><br />
Frequency<br />
Pct of Prior + Non-Prior<br />
Pct of Non-Prior’s Total<br />
10<br />
Distribution of Teachers by Value Added Scores (Reading/English only)<br />
VA<br />
Score<br />
Average Distribution of<br />
VA Scores by School<br />
Non-priority <strong>Schools</strong><br />
Frequency<br />
Pct of Prior + Non-Prior<br />
Pct of Non-Prior’s Total<br />
1
11<br />
Distribution of Teachers by Value Added Scores (Reading/English only)<br />
VA<br />
Score<br />
Average Distribution of<br />
VA Scores by School<br />
Non-priority <strong>Schools</strong><br />
Frequency<br />
Pct of Prior + Non-Prior<br />
Pct of Non-Prior’s Total<br />
1
12<br />
Priority <strong>Schools</strong>’ Distribution of Teachers by Value Added Scores (All Subjects)<br />
Frequency<br />
Row Pct<br />
ANDERSON ELEMENTARY 0<br />
0.00<br />
CELIA CLINTON<br />
ELEMENTARY<br />
1
13<br />
Priority <strong>Schools</strong>’ Distribution of Teachers by Value Added Scores (Math only)<br />
Frequency<br />
Row Pct 1
14<br />
Priority <strong>Schools</strong>’ Distribution of Teachers by Value Added Scores (Reading/English only)<br />
Frequency<br />
Row Pct
PARENT FACILITATORS<br />
EVIDENCE OF FAMILY & COMMUNITY ENGAGEMENT<br />
The Title I office provides coordination, technical assistance and other support necessary to<br />
assist all schools in planning and implementing effective parent involvement activities to<br />
improve student academic achievement and school performance. All schools have Parent<br />
Facilitators or someone in charge of those duties. Parent Facilitators are the liaison between the<br />
school, parents and community. In their capacity as liaison they are the outreach to increase<br />
communication between interested parties. Every month of the school year, the Parent<br />
Facilitators meet to receive technical support, collaborate with other facilitators and link with<br />
other resources. Each Title I school has established a Parent Community Advisory Council. All<br />
schools keep a binder with the evidence of Title I requirements for parent involvement that is<br />
formally monitored once a year.<br />
<strong>Tulsa</strong> <strong>Public</strong> <strong>Schools</strong> provides training for Parent facilitators with the Practical Parent Education<br />
Curriculum (PPE) (below is an explanation of the initial training). Parent Facilitators that have<br />
taken the initial training for PPE have a new one‐day workshop using a PPE Profile of Families<br />
Checklist; a PPE Educational Consultant will help the parent educators identify specific<br />
characteristics of their families and create a plan that will do two things: (1) It will design parent<br />
involvement events at their school that are culturally comfortable to encourage parents to<br />
attend, and (2) it will help parents change their parenting practices at home so that their home<br />
life supports their children’s learning.<br />
Initial Parent Educator Training<br />
Practical Parent Education’s Initial Parent Educator Training is designed to provide participants a<br />
comprehensive set of skills in three days of interactive fun. Practical application and practice are<br />
joined with theory and research so that parent educators leave with the following concepts and<br />
the confidence to make them applicable in their programs:<br />
• an understanding of the field of parent education as it has emerged in the 21st<br />
century<br />
• recognition of the benefits to children when parents and families have<br />
appropriate parenting skills<br />
• confidence in establishing and maintaining appropriate professional boundaries<br />
• an understanding of family systems and its application to parent education<br />
• awareness of the ways that lifespan development affects families<br />
• an understanding of how long‐term change takes place<br />
• effective strategies for increasing parental capacity and parental involvement
• effective group facilitation skills<br />
• strategies for promoting school and community support for parent education<br />
programs<br />
• awareness of funding opportunities<br />
• short‐term and long‐term goals for parent education programs<br />
• familiarity with services, support, and materials offered through Practical Parent<br />
Education membership<br />
VOLUNTEER HOURS<br />
<strong>Tulsa</strong> <strong>Public</strong> <strong>Schools</strong> is proud of the many volunteers who provide their time and talent in service<br />
to our schools. During the 2010‐11 school year, a total of 4,642 volunteers worked 173,666<br />
hours. (Fifteen schools did not report volunteer data).<br />
# of volunteers # of hours<br />
<strong>Elementary</strong> schools 3,245 135,232<br />
Middle <strong>Schools</strong> 930 16844<br />
High <strong>Schools</strong> 412 16,711<br />
Alternative 55 4879<br />
Total 4,642 173,666<br />
At the following “priority” schools, here is the available volunteer data from the last two school<br />
years.<br />
2010‐11 2009‐10<br />
# of vol. # of hours # of vol. # of hours<br />
Nathan Hale High School 32 1,377 28 309 *<br />
Central High School 14 1,253 n/a n/a<br />
E. Central High School 35 982 26 1,282<br />
<strong>Anderson</strong> <strong>Elementary</strong> 12 226 * n/a n/a<br />
Burroughs <strong>Elementary</strong> n/a n/a 65 1,865<br />
Celia Clinton <strong>Elementary</strong> n/a n/a 2 17 *<br />
Clinton Middle School 26 896 34 1,302<br />
Lindbergh <strong>Elementary</strong> n/a n/a 128 1,836<br />
MacArthur <strong>Elementary</strong> 55 2,250 57 2,240<br />
Marshall <strong>Elementary</strong> n/a n/a 101 681 *<br />
McClure <strong>Elementary</strong> 154 1,731 * 118 2,112<br />
McKinley <strong>Elementary</strong> 119 1,750 87 3,064<br />
McLain High School 26 624 n/a n/a<br />
Sequoyah <strong>Elementary</strong> 37 1,632 n/a n/a<br />
Springdale <strong>Elementary</strong> n/a n/a 68 1,530<br />
Whitman <strong>Elementary</strong> 44 2,839 35 1,257<br />
Total 554 15,560 749 17,495<br />
* incomplete data
EDUCARE<br />
• <strong>Tulsa</strong> Educare, Incorporated (TEI) is a not‐for‐profit organization created to provide highquality<br />
early childhood education and care to low‐income families living in <strong>Tulsa</strong>. TEI was<br />
created through a partnership with Community Action Project of <strong>Tulsa</strong> County (CAP), Family<br />
and Children's Services, George Kaiser Family Foundation, the <strong>Tulsa</strong> Community<br />
Foundation and Oklahoma University Pediatrics.<br />
• Serving at‐risk children from birth to 5 years, Educare provides <strong>Tulsa</strong>’s most vulnerable<br />
children with programming and instructional support to develop early skills and nurture<br />
strong parent‐child relationships that create the foundation for successful learning.<br />
• <strong>Tulsa</strong> has three Educare sites, including:<br />
• Educare I at Hawthorne <strong>Elementary</strong><br />
• Educare II (serving Kendall‐Whittier)<br />
• Educare III (currently being built, will service Whitney, Hale and MacArthur<br />
communities.<br />
BACKPACK PROGRAMS<br />
• “Backpack” programs – about 50 schools and 350 students served weekly in the TPS<br />
district. The backpack program sends students home with food they can eat over the<br />
weekend.<br />
• 100% funded and run by Food Bank of Eastern Oklahoma<br />
• Contents of the backpacks change weekly. This week, bags contained cereal, toasted corn,<br />
apple sauce, pudding, crackers, juice, grean beans, nuts and milk.<br />
• TPS also has a fresh fruit and vegetable program for 30 sites.<br />
PARTNERS IN EDUCATION<br />
<strong>Tulsa</strong> Metro Chamber and <strong>Tulsa</strong> <strong>Public</strong> <strong>Schools</strong> collaborate to provide the Partners In Education<br />
program, which unites schools and the business community to increase the quality of education<br />
for all students. More than 1,600<br />
community partners are involved in<br />
the program, serving the 41,000<br />
students in the TPS district.The<br />
partners consist of businesses,<br />
community organizations, religious<br />
groups and individuals.<br />
Established in 1983, Partners In Education links students with resources that help provide<br />
knowledge and skills needed for future success. The program connects students and teachers<br />
with corporate, education, volunteer, government and civic leaders. These partnerships help<br />
educators improve the academic and personal growth of all students.
There are a number of ways in which partners are involved with the schools:<br />
• Serving as volunteers by reading to students, mentoring during the lunch hour, or<br />
serving as guest speakers<br />
• Donating school supplies<br />
• Recognizing top‐performers with victory parties and other incentive programs<br />
• Sharing a company's technical expertise with a school<br />
• Awarding attendance or good behavior in the classroom<br />
• Hosting teacher appreciation lunches or providing teacher appreciation awards<br />
• Catering PTA meetings to encourage parent participation<br />
• Many, many other ways!<br />
OKLAHOMA SCHOLARS<br />
• Launched in 2004, in partnership with the <strong>Tulsa</strong> Metro Chamber, Oklahoma Scholars<br />
encourages eighth grade students to enroll in a more rigorous curriculum in high school. The<br />
coursework will better prepare them for post‐secondary education and training, providing<br />
more opportunities as they begin work.<br />
Students participating in the<br />
Oklahoma Scholars course of study<br />
receive incentives to continue the<br />
coursework, and those who complete<br />
the program earn special recognition<br />
at graduation. In Texas and Arkansas,<br />
students in the Scholars program<br />
have higher ACT and SAT scores, take<br />
fewer remedial courses at the college<br />
level, and demonstrate better college completion rates.<br />
Business leaders present the program to eighth grade students by demonstrating a realworld<br />
monthly budget based on a $32,900 per year salary. Students actively participate in<br />
the discussion, and are typically shocked to realize they have no money left at the end of the<br />
month for clothing and entertainment. The presentation illustrates that their job supports<br />
their lifestyle, and their career possibilities are directly linked to the training or education<br />
they receive when they graduate from high school.<br />
Over 50 business representatives have completed the two‐hour training session required to<br />
become a classroom presenter.<br />
The <strong>Tulsa</strong> Metro Chamber has partnered with the OU‐<strong>Tulsa</strong> Community Engagement Center<br />
and <strong>Tulsa</strong> <strong>Public</strong> <strong>Schools</strong> to launch a new program called Career Access College Readiness<br />
(CACR) to help students prepare for college upon graduation.
COLLEGE ACCESS CAREER READINESS<br />
• In partnership with the <strong>Tulsa</strong> Metro Chamber, CACR matches volunteers from the local<br />
business community with small groups of seventh and 10th grade students. The goal is to<br />
help these students learn about and plan for college through a variety of subjects, including<br />
how to apply for college, how to acquire funding for college and knowing which courses to<br />
take.<br />
• The program kicked off last year with about 70 community members. CACR coaches work<br />
with students in five schools in TPS and meet twice a month to discuss their career and life<br />
expectations and how to start making present day decisions to meet their long term goals.<br />
• TPS secondary students are in need of reliable, caring and trained coaches to help develop<br />
workplace and college readiness skills for success beyond high school.<br />
• Coaches’ responsibilities are as follows:<br />
• Complete training for the program<br />
• Participate in two classes each month, January‐May 2011<br />
• Work with and at the direction of the Teacher Adviser<br />
• No personal contact with students outside the classroom<br />
• Listen to students and develop a rapport in order to help them develop a personal plan<br />
for their future<br />
• May help facilitate bringing additional speakers into the classroom as planned with the<br />
Teacher Adviser<br />
ANTI‐BULLYING PROGRAMS/TIPS<br />
• Since Nov. 2011, TPS has teamed up with the <strong>Tulsa</strong> Drillers, Partners In Education and the<br />
Parent Child Center to deliver anti‐bullying curriculum into elementary schools in the<br />
district.<br />
• <strong>Tulsa</strong> Drillers mascot Hornsby visits children in grades K‐6, accompanied by The Parent Child<br />
Center of <strong>Tulsa</strong>’s “Kids on the Block” puppets. These child‐sized puppets, with performer<br />
Jacqueline Gallegos and Hornsby, present a bully awareness skit. Kids on the Block are<br />
frequent visitors to classrooms, teaching children how to protect themselves in difficult<br />
situations, including bullying, “stranger danger” and physical abuse.<br />
• In January 2012, TPS launched a new online incident‐reporting tool called TIPS, in<br />
conjunction with its anti‐bullying efforts. The software was funded by a $22,000 grant from<br />
a private donor group. TIPS allows for the anonymous reporting of weapons possession,<br />
drug/alcohol use, harassment or intimidation, school vandalism, physical assault, threats of<br />
violence, suicide risk, abuse or neglect and other incidents.<br />
• TIPS provides TPS with one more way for students, teachers, parents and members of the<br />
community to alert schools to potential problems – either inside our buildings or outside, in<br />
our neighborhoods.<br />
• TIPS is important because we know that no learning can take place unless students are in an<br />
environment that is safe, including the neighborhoods in which schools reside.<br />
• Threat assessment teams have been created at each school and the district office to be<br />
automatically notified of certain types of incidents. Teams include school counselors, the
principal, other administrators, TPS police, local law enforcement and other valuable<br />
resources.<br />
PROMISE NEIGHBORHOODS/COMMUNITY ACTION PROJECT<br />
• In Dec. 2011, Community Action Project of <strong>Tulsa</strong> received $750,000 in federal grants for the<br />
Promise Neighborhoods initiative, which will fund the development of a plan to provide<br />
educational opportunities to children from birth to career in the Kendall‐Whittier and<br />
Eugene Field neighborhoods.<br />
• In partnership with Community Action Project, <strong>Tulsa</strong> <strong>Public</strong> <strong>Schools</strong>, George Kaiser Family<br />
Foundation, other organizations and community residents.<br />
• The Promise Neighborhoods program aims to address significant challenges faced by<br />
students and families living in high‐poverty communities by providing resources to plan<br />
services from early learning to college and career.<br />
• Plans include a range of services from improving a neighborhood’s health, safety, and<br />
stability to expanding access to learning technology and Internet connectivity, and boosting<br />
family engagement in student learning<br />
• CAP is one of 15 organizations across the U.S. to receive a $500,000 planning grant from the<br />
U.S. Department of Education for the Promise Neighborhoods initiative, with its application<br />
having received the fourth highest score of all applications. The federal funds will be<br />
enhanced by a $250,000 matching grant from GKFF.<br />
• Last year, CAP’s application just barely missed the threshold to receive federal funding.<br />
Executive Director Steven Dow attributed the rise in the score to the phenomenal changes<br />
within TPS, particularly the Teacher Effectiveness Initiative, Project Schoolhouse, and the<br />
transformation of Rogers High School.<br />
• “What clearly distinguished this year’s narrative was the compelling story which we were<br />
able to share about the incredible and rapid changes being instituted by Dr. Ballard, the<br />
TPS Board, and the staff of TPS,” said Dow. “The amount of progress which they have made<br />
on their major initiatives certainly got the attention of the U.S. Department of Education.”<br />
• The Kendall‐Whittier neighborhood, which covers 2.5 square miles near downtown <strong>Tulsa</strong> and<br />
has 14,000 residents, including nearly 3,000 children, is home to Educare I. The<br />
neighborhood is anchored by Kendall‐Whittier <strong>Elementary</strong>, which serves more than 1,000<br />
children.<br />
• Promise Neighborhoods, launched in 2010, made available a total of $10 million for one‐year<br />
planning grants to 21 communities across the country. The 2011 grants announced today will<br />
reach an additional 16 communities. Between both rounds, 18 states and D.C. will have plans<br />
in place to help revitalize disadvantaged neighborhoods. Congress recently passed a fiscal<br />
year 2012 budget, which will include an additional $60 million for Promise Neighborhoods.<br />
TEACH FOR AMERICA/SUMMER INSTITUTE<br />
• From June 18 ‐ July 13, 2012, TPS becomes a Teach For America (TFA) Summer Institute site.<br />
The program – offered by <strong>Tulsa</strong> <strong>Public</strong> <strong>Schools</strong> in partnership with TFA, Community Action<br />
Project (CAP) and The University of <strong>Tulsa</strong> – will provide a comprehensive academic program<br />
for over 3,000 children in <strong>Tulsa</strong>.
• The free summer school will serve TPS children entering grades 1‐12 in the 2012‐13 school<br />
year, with nine different schools serving as host sites for the 2012 Teach For America<br />
Summer Institute.<br />
• For children entering grades 1‐6 in the fall, the program will focus on meeting common core<br />
standards in mathematics and reading. <strong>Elementary</strong> host sites include Hamilton, Hawthorne,<br />
Lewis & Clark, McClure, Robertson and Skelly.<br />
• Students entering grades 7‐9 in the 2012‐13 school year may take free credit recovery<br />
courses in math or language arts. Incoming students in grades 10‐12 may take free credit<br />
recovery in English I, English II, Algebra I, Algebra II, Biology, and Geometry. School sites for<br />
incoming students in grades 7‐12 include Hale, McLain and Will Rogers College High <strong>Schools</strong>.<br />
• Breakfast and lunch will be provided. Free busing will be available to all students.<br />
• In May, <strong>Tulsa</strong> was added as the ninth Teach For America training location, joining Atlanta,<br />
Chicago, Houston, Los Angeles, the Mississippi Delta, New York City, Philadelphia and<br />
Phoenix. During institute training, approximately 650 new TFA teachers, also called corps<br />
members, will teach summer school programs in <strong>Tulsa</strong> <strong>Public</strong> <strong>Schools</strong> and Community Action<br />
Project while attending courses and living at The University of <strong>Tulsa</strong>.<br />
• TFA recruits outstanding recent college graduates and professionals who commit to teach in<br />
urban and rural public schools. TFA invests in the training and professional development<br />
necessary to ensure the success of their teachers in schools serving low‐income<br />
communities.<br />
COMMUNITY SCHOOLS<br />
TPS, through the Foundation for <strong>Tulsa</strong> <strong>Schools</strong>, has received a three‐year financial commitment<br />
from <strong>Public</strong> Service Company of Oklahoma (PSO) for an investment of $195,000 to support the<br />
expansion of the successful Community <strong>Schools</strong> Initiative.<br />
Eighty‐five percent of all students in the TPS district are at or below the poverty level. Students<br />
born into homes of generational poverty often come to school with poor vocabulary, low<br />
motivation to succeed and few supporting adults at home to address their basic needs. These<br />
students often experience a lack of success in elementary school and drop out of school during<br />
the middle school years. When they do make it to high school graduation, they often lack the<br />
skills to be college‐ or career‐ready.<br />
The three‐year commitment from PSO includes: 1) Funding of the Literacy First program at<br />
$35,000 per year; 2) Tutoring at $5,000 per year; and 3) the Community School Institute at<br />
$25,000 per year to teach and train selected TPS personnel and community partners to prepare<br />
for community school leadership.<br />
Other philanthropic partners for community schools include the Chapman Foundation, the Hille<br />
Foundation, George Kaiser Family Foundation, the Oxley Foundation, the Charles and Lynn<br />
Schusterman Family Foundation, the Temple Foundation and the Anne and Henry Zarrow<br />
Foundation. We have also partnered with Arvest Bank, Bank of Oklahoma, QuikTrip and T.D.<br />
Williamson Company.
More than 3000 students and their families are being positively impacted by the five (5) Title I<br />
Community <strong>Schools</strong> in low‐income neighborhoods throughout the City of <strong>Tulsa</strong>, which are<br />
currently operating under the auspices of <strong>Tulsa</strong> <strong>Public</strong> <strong>Schools</strong>. Students, families and their<br />
neighbors have access to unique and innovative programs, services, and opportunities at their<br />
neighborhood elementary Community School, made possible by <strong>Tulsa</strong> <strong>Public</strong> School funding<br />
partners. These comprehensive programs and services create the support, communication and<br />
collaboration needed for successful students, healthy families and engaged communities. Current<br />
research (Forsythe, Adams: OU University, 2010) indicates that the rigor, responsibility and relationships<br />
in community schools has made and is making a huge difference in success.<br />
<strong>Tulsa</strong> <strong>Public</strong> <strong>Schools</strong> ‐ Community <strong>Schools</strong><br />
Sustaining<br />
School Location Students Years/CS<br />
1. Eugene Field 2249 South Phoenix 448 Students 5<br />
2. Kendall‐Whittier 2601 East 5 th Street 1193 Students 5<br />
3. Mark Twain 541 South 43 rd West Ave. 432 Students 5<br />
4. Marshall 1142 East 56 th Street 447 Students 5<br />
5. McClure 1770 East 61 st Street 524 Students 5<br />
Mentoring/Emerging<br />
1. Hawthorne 1105 East 33 rd Street North 559 Students 3‐4<br />
2. McKinley 6703 East King 504 Students 3‐4<br />
3. Bryant 6201 East Virgin 516 Students 3‐4<br />
4. Celia Clinton 1740 North Harvard 529 Students 3‐4<br />
5. Cooper 1808 South 123 rd Street 784 Students 3‐4<br />
Inquiring<br />
1. Academy Central 1789 West Seminole 499 Students 1‐2<br />
2. Remington 2524 West 53 rd Street 345 Students 1‐2<br />
3. Robertson 2721 West 50 th Street 470 Students 1‐2<br />
4. Lindbergh 931 South 89 th Street 443 Students 1‐2<br />
5. Owen 1132 North Vandalia 540 Students 1‐2<br />
6. Gilcrease 5550 North Cincinnati 268 Students 1‐2<br />
Sixteen (16) Community <strong>Schools</strong><br />
8,501 Students
Leadership Development Program<br />
<strong>Tulsa</strong> <strong>Public</strong> <strong>Schools</strong>’ Leadership Development program is an initiative to build the district’s<br />
talent pool by preparing school and district leaders for the challenging landscape of urban<br />
education. Some of the components are partially funded by district funds and other private<br />
donors, as well as the Foundation for <strong>Tulsa</strong> <strong>Schools</strong> at $202,623, which represents a number of<br />
private donors.<br />
Modeled after research‐based programs and best practices, the leadership development<br />
program focuses on five components that are being piloted during the 2011‐2012 school year:<br />
• Assistant principal internships to support learning and development of first year<br />
administrators and build their capacity for future leadership opportunities.<br />
• Novice principal induction and development to provide continuous support for<br />
principals with less than three years of experience.<br />
• Leadership development for current principals to build their leadership skills and<br />
provided targeted training on key areas of student learning.<br />
• Expanded opportunities for both school and central office administrators, focused on<br />
developing leadership skills at every level of the district.<br />
• Staff Development Teachers positions to support on‐site professional development at<br />
school sites and further teachers knowledge in key areas of instructional improvement,<br />
Common Core Standards and data analysis.<br />
Teacher Leader Effectiveness<br />
George Kaiser Family Foundation has been an active partner with <strong>Tulsa</strong> <strong>Public</strong> <strong>Schools</strong> (TPS), as<br />
the district seeks to transform the way teachers and leaders are trained, evaluated and<br />
supported in classrooms and school buildings.<br />
In 2009, through a partnership with the Bill & Melinda Gates Foundation, TPS launched<br />
its Teacher and Leadership Effectiveness Initiative (TLE) after months of research and<br />
collaboration between district administrators, principals, teachers, <strong>Tulsa</strong> Classroom Teachers<br />
Association leadership and the broader community.<br />
Key elements of the Initiative include:<br />
1. Deployment of a thorough and objective teacher and leader five‐tier evaluation process<br />
to measure the effectiveness of all professional staff;<br />
2. Use of student performance data to inform teaching strategies and personalized<br />
professional development;<br />
3. Remediating ineffective teachers and exiting those who fail to improve;<br />
4. Improving the human resources department so that highly effective teachers are<br />
recruited, retained and supported.<br />
As TPS has focused its efforts around TLE and seriously committed to college and career<br />
readiness for all students, GKFF has worked with the broader <strong>Tulsa</strong> community to support this<br />
transformation. The community has warmly responded to the changes. In spring 2011, when TPS
closed 14 schools due to under‐enrollment, the plan (“Project Schoolhouse”) was met with<br />
healthy debate and minimal public discord.<br />
TPS is clearly on a path to improved teaching and learning for all students. Each professional<br />
employee in the district (teachers, leaders, principals and administrators) has had their job<br />
performance thoroughly reviewed. Teachers have received testing results on each student and<br />
can make instructional adjustments based on individual scores.<br />
In fact, <strong>Tulsa</strong> <strong>Public</strong> <strong>Schools</strong>’ new teacher evaluation system beat out two national models in<br />
being selected as the “presumptive state default” as Oklahoma’s primary new model for<br />
evaluating public school educators.<br />
Parents As Teachers<br />
In partnership with Community Action Project, Parents as Teachers (PAT) is a voluntary early<br />
childhood parent education and family support program for parents who have children from<br />
birth to three years of age designed to help all parents give their children the best possible start<br />
in life.<br />
The <strong>Tulsa</strong> Parents as Teachers program serves families with children younger than 3 years old at<br />
no cost, thanks to grants from the state and federal Title I funds.<br />
Services include:<br />
• Personal Visits: A parent educator, knowledgeable about child development and brain<br />
research on early learning, helps parents learn what to expect as their child grows and offers<br />
practical suggestions on encouraging learning and managing challenging behavior.<br />
• Group Meetings: The group meetings allow parents to meet other parents to gain new<br />
insights, share experiences and discuss parenting topics. They also give them the opportunity<br />
to participate in parent‐child activities.<br />
• Screenings: Parent educators administer screenings periodically. They are used to assess a<br />
child’s overall development and to provide early detection of potential problems to prevent<br />
difficulties later in school.<br />
• Resource Network: Families are helped to access other community services that are beyond<br />
the scope of the PAT program.<br />
Mental Health Providers/Partnerships<br />
• Social workers in the high schools: in June 2011, an anonymous donor provided TPS with<br />
$175,000 to fund eight service specialists/social workers in high schools for the 2011‐12<br />
academic year. The eight social workers had been previously eliminated from the budget on<br />
June 14 due to $4.2 million in cuts to the TPS special education budget due to the end of<br />
2009 stimulus funding by ARRA (the American Recovery and Reinvestment Act) and<br />
reductions in state funding by the Oklahoma legislature.
By restoring these eight social worker positions, TPS can continue to help students in difficult<br />
situations such as:<br />
• Those needing help with food, clothing and shelter;<br />
• Suicide or abuse;<br />
• Loss of a friend or parent; or<br />
• Any situation that puts the stress of a crisis on the student.<br />
Other Mental Health Providers/Partnerships include:<br />
• Community Service Council<br />
• Department of Health & Human Services<br />
• A New Way<br />
• Center 4 Change<br />
• Counseling and Recovery Services of Oklahoma (CREOKS)<br />
• Daybreak Family Services<br />
• Day Spring Services of Oklahoma<br />
• Family and Children's Services<br />
• Health Concepts<br />
• Shadow Mountain Center for Therapeutic Interventions<br />
• Volunteers of America<br />
• YouthCare Oklahoma<br />
• Youth Services of <strong>Tulsa</strong>
ESEA Waiver<br />
District Capacity Determination for School Improvement<br />
The following document is responsive, in part, to the OSDE’s request for information regarding:<br />
Historical analysis of data over a period of five years and evidence that historical data has been used to<br />
develop school-level interventions (data should include, but is not limited to, the categories listed above.<br />
Value Added Reporting for Priority <strong>Schools</strong><br />
In the past, the primary method of communicating a school's performance was student achievement data, a<br />
measurement of student knowledge at a single point in time and how well that performance compares against a<br />
standard. Achievement data alone, however, does not reflect the effectiveness of a school. Growth measures like<br />
value-added provide a more complete and accurate picture of a school's impact on student achievement over a school<br />
year. It isolates the effectiveness of the school and its teachers by combining achievement and growth information<br />
with other data sources to statistically control for factors outside of educators’ influence such as students' starting<br />
points, whether they are English language learners, their disability status, etc. Using value-added along with other data<br />
allows us to separate what we think is happening from what is actually happening.<br />
Value-added data is available now for 2009-2010 and 2010-2011. It is being used for information, analysis and<br />
improvement. The statistical modeling and reporting is provided by the Value Added Research Center (VARC) of Univ.<br />
of Wisconsin. In general terms, VARC calculates the gain of scale score points for students at each school using a<br />
prior-test and a post-test. Due to the statistical controls that eliminate the effect of external factors (starting point,<br />
student demographics, etc.), value-added data reveals in which schools students are growing faster than average and in<br />
which schools students are growing slower than average. The District average is set at three. Consequently, schools<br />
and teachers with high value-added are greater than three, and schools/teachers with value added estimates less than 3<br />
are low value-added. 1<br />
1<br />
Please note that value-added data for Burroughs <strong>Elementary</strong> is not available because it would reveal one or more<br />
individual teachers’ value added data, which is confidential and protected from disclosure.
2<br />
The District rolled out its value-added reporting in the fall of 2011, including background information about how<br />
value-added works and detailed reports regarding each school’s value added estimates. This information is available at<br />
the TPS Student Progress Portal. Value-added reporting is a project of the District's Teacher and Leader Effectiveness<br />
initiative made possible by community donor funds and the Bill and Melinda Gates Foundation. At present, <strong>Tulsa</strong><br />
<strong>Public</strong> <strong>Schools</strong> is the only district in the state reporting such information. In 2013-2014, other districts in the state<br />
will be required to calculate and report value-added data.<br />
There are school-level and teacher-level reports. In addition to grade/course reporting, there is rich detail in<br />
each school and teacher-level report regarding the school/teacher’s impact on different subgroups—in particular, their<br />
impact on students of different prior achievement levels, ELL students, and special education students.<br />
TPS data teams of District administrators, school principals, staff development teachers, and teachers are using<br />
value-added analysis to measure the effectiveness of our practices and programs, identify and respond to our strengths<br />
and challenges, and improve student achievement. Value-added analysis is a core strategy being modeled and<br />
developed in the District’s year-long plan for principal development for rollout to the individual school sites.<br />
Value-added data is incorporated into schools’ WISE plans as an indicator related to the selection and retention of<br />
teachers. In In the future, pursuant to state law, TPS also plans to use this value-added data as one of the components<br />
of teachers’ and principals’ evaluations.<br />
Value-added information provides schools and teachers with important diagnostic information that was not<br />
previously available with traditional achievement reporting. Value-added information allows educators to assess their<br />
impact on student learning and can help initiate conversations about the efficacy of curriculum, instructional practices<br />
and programs. Educators can use the information to modify their instruction and practices to maximize student learning.<br />
Value-added information also allows educators to better identify what is working well and areas for improvement to<br />
help individual students and groups of students.<br />
The primary use of value-added data is to help identify the practices that have the greatest impact on student<br />
growth so that they can be replicated elsewhere. Teachers with value-added data use the detail within their individual<br />
reports to identify their strengths and areas for improvement.<br />
In the following pages, there is:<br />
• Value added and achievement data (priority school detail (table) and District-wide detail (scatterplot)<br />
• Example of value-added reporting provided to every school and available to all stakeholders on our TPS Student<br />
Progress Portal (school-level reports for each Priority School are provided within their individual responses<br />
regarding Historical Data Analysis)<br />
• Examples of training on and reflection of value-added data<br />
• Agendas and materials from Principal Leadership Conferences in which value-added data was analyzed and<br />
incorporated into school improvement planning.
3<br />
Priority <strong>Schools</strong>’ Value Added Scores (Math only)<br />
Overall 3-Year<br />
Average<br />
VA Estimate<br />
Math<br />
Overall 2011<br />
VA Estimate<br />
Math<br />
Overall 2010<br />
VA Estimate<br />
ANDERSON ELEMENTARY 2.68 2.53 2.15<br />
CELIA CLINTON ELEMENTARY 1.82 2.79 0.76<br />
CENTRAL HIGH 2.83 2.51 3.07<br />
CLINTON MIDDLE 1.95 2.91 1.53<br />
EAST CENTRAL HIGH 2.31 2.48 2.52<br />
GREELEY ELEMENTARY 0.82 1.02 3.30<br />
HALE HIGH 2.28 2.41 2.26<br />
LINDBERGH ELEMENTARY 2.41 2.19 2.91<br />
MACARTHUR ELEMENTARY 3.23 3.52 3.30<br />
MARSHALL ELEMENTARY 4.11 2.70 5.34<br />
MCCLURE ELEMENTARY 3.21 3.48 3.02<br />
MCKINLEY ELEMENTARY 2.58 1.94 3.05<br />
MCLAIN HIGH 2.62 3.16 2.19<br />
SEQUOYAH ELEMENTARY 2.93 3.19 2.72<br />
SPRINGDALE ELEMENTARY 2.22 2.89 2.29<br />
WEBSTER HIGH 2.98 3.21 2.88<br />
WHITMAN ELEMENTARY 2.91 2.77 2.77<br />
Math
4<br />
Priority <strong>Schools</strong>’ Value Added Scores (Reading/English only)<br />
Overall 3-Year<br />
Average<br />
VA Estimate<br />
Math<br />
Overall 2011<br />
VA Estimate<br />
Reading/English<br />
Overall 2010<br />
VA Estimate<br />
ANDERSON ELEMENTARY 2.63 2.97 1.79<br />
CELIA CLINTON<br />
ELEMENTARY<br />
2.40<br />
CENTRAL HIGH 2.98 2.65 3.00<br />
CLINTON MIDDLE 2.59 2.65 2.46<br />
EAST CENTRAL HIGH 1.85 2.53 2.13<br />
GREELEY ELEMENTARY 0.44 1.42 2.39<br />
HALE HIGH 2.15 1.69 1.83<br />
LINDBERGH ELEMENTARY 2.84 3.26 2.98<br />
MACARTHUR ELEMENTARY 3.38 3.30 3.28<br />
MARSHALL ELEMENTARY 2.55 0.02 4.95<br />
MCCLURE ELEMENTARY 2.96 2.84 3.00<br />
MCKINLEY ELEMENTARY 2.73 2.21 3.50<br />
MCLAIN HIGH 3.07 2.82 2.70<br />
SEQUOYAH ELEMENTARY 2.65 2.62 2.66<br />
SPRINGDALE ELEMENTARY 2.26 2.74 1.00<br />
WEBSTER HIGH 2.95 2.66 3.28<br />
WHITMAN ELEMENTARY 2.46 3.08 1.95<br />
2.90<br />
Math<br />
1.84
Introduction to Value-Added/Achievement Scatter Plots<br />
2010-2011 School Year and 3-Year Average (2009-2011)<br />
In the past, the primary method of communicating a school's performance was student achievement data, a measurement of<br />
student knowledge at a single point in time and how well that performance compares against a standard. Achievement data alone,<br />
however, does not reflect the effectiveness of a school. Growth measures like value-added provide a more complete and accurate<br />
picture of a school's impact on student achievement over a school year. It isolates the effectiveness of the school and its teachers by<br />
combining achievement and growth information with other data sources to statistically control for factors outside of educators’<br />
influence such as students' starting points, whether they are English language learners, their disability status, etc.<br />
The District rolled out its value-added reporting in the fall of 2011, including background information about how value-added<br />
works and detailed reports regarding each school’s value added estimates. This information is still available at the TPS Student<br />
Progress Portal. Value-added reporting is a project of the District's Teacher and Leader Effectiveness initiative made possible by<br />
community donor funds and the Bill and Melinda Gates Foundation. At present, <strong>Tulsa</strong> <strong>Public</strong> <strong>Schools</strong> is the only district in the state<br />
reporting such information. In 2013-2014, other districts in the state will be required to calculate and report value-added data.<br />
Both student achievement and value-added measures are important performance indicators. In the following pages, <strong>Tulsa</strong><br />
<strong>Public</strong> <strong>Schools</strong> is reporting schools’ achievement and value-added data on the same graph for the past school year (2010-2011) as well<br />
as their average performance for the past three years (2009-2011). This information is available with regard to elementary, middle and<br />
high schools and reflects data from all courses and subjects tested by the state. The scatter plots are not a “sorting” or “ranking”<br />
of schools. Identifying schools’ achievement and value added data in the same graphic allows for identification of effective practices<br />
and leveraging those practices across the district. <strong>Schools</strong> and teachers will use the information to create action plans, timelines and<br />
strategies to improve student achievement.<br />
Finally, please note that all of the data reported in these graphics reflect value-added estimates and student<br />
achievement data from schools prior to any changes made as a result of Project Schoolhouse. As indicated on the graphs,<br />
many of the schools have been closed or restructured.
How to Read the Value–Added Scatter Plots<br />
These scatter plots represent the Value-Added (student academic growth) and Attainment (percent proficient and advanced<br />
students) in <strong>Tulsa</strong> <strong>Public</strong> <strong>Schools</strong>. The subject and time span are listed below each scatter plot.<br />
Along the x-axis (horizontal direction) is each school’s Value-Added estimate. Students to the right of “District Average” are<br />
growing faster than predicted. Students to the left of “District Average” are still gaining knowledge, but at a rate slower than predicted.<br />
Along the y-axis (vertical direction) is each school’s attainment. Attainment is measured by the percentage of students who scored in<br />
the proficient or advanced level on the prior year’s test. The purpose of using last year’s test is to facilitate comparisons of schools<br />
based on similar student populations.<br />
Bubble size represents the number of students included in the Value-Added estimate for each school site. The more students<br />
there are in calculation, the tighter the confidence intervals around the Value-Added estimate. Representative confidence interval sizes<br />
are displayed in the upper right of each scatter plot. Especially in the case of small schools, keep these 95% confidence intervals in<br />
mind when interpreting the scatter plots.
<strong>Elementary</strong> <strong>Schools</strong> (2010‐2011)
Key to <strong>Elementary</strong> <strong>Schools</strong>’ Value-Added/Achievement Scatter Plots<br />
NUMBER NAME NUMBER NAME NUMBER NAME<br />
1 ACADEMY CENTRAL 20 GREELEY 40 MCKINLEY<br />
2 ADDAMS (closed) 21 GRIMES 41 MITCHELL<br />
3 ALCOTT (closed) 22 GRISSOM 42 OWEN<br />
4 ANDERSON 23 HAWTHORNE 43 PARK<br />
5 BARNARD (closed) 24 HOOVER 44 P. HENRY<br />
6 BELL 25 HOUSTON (closed) 45 PEARY<br />
7 BRYANT (closed) 26 JACKSON 46 PENN<br />
8 BURROUGHS 27 JONES 47 PHILLIPS (closed)<br />
9 CARNEGIE 28 KENDALL- WHITTIER 48 REMINGTON<br />
10 C. CLINTON 29 KERR 49 ROBERTSON<br />
11 CHEROKEE (closed) 30 KEY 50 ROOSEVELT (closed)<br />
12 CHOUTEAU (moved) 31 KIPP TULSA ACADEMY 51 SALK<br />
13 COLUMBUS 32 LANIER 52 SANDBURG (closed)<br />
14 COOPER 33 LEE 53 SEQUOYAH<br />
15 DISNEY 34 LINDBERGH 54 SKELLY<br />
16 E. FIELD 35 MACARTHUR 55 SPRINGDALE<br />
17 EISENHOWER 36 MARK TWAIN 56 WHITMAN<br />
18 ELIOT 37 MARSHALL 57 WRIGHT<br />
19 EMERSON 38 MAYO 58 ZARROW INTL<br />
39 MCCLURE
Bubble size represents size of the school<br />
These lines are 95% confidence intervals<br />
for representative school sizes<br />
9<br />
17<br />
Percent Proficient on Prior Exam<br />
30 40 50 60 70 80 90<br />
20<br />
3<br />
57<br />
46<br />
40<br />
36<br />
41<br />
5 23<br />
34<br />
54<br />
11<br />
52 45<br />
50<br />
4<br />
18<br />
37<br />
14<br />
30<br />
56<br />
10<br />
25<br />
55<br />
49<br />
29<br />
42<br />
19<br />
7<br />
6<br />
2<br />
26<br />
53<br />
12<br />
51<br />
44<br />
15<br />
27<br />
28 35<br />
39<br />
33<br />
32<br />
43<br />
4738<br />
13<br />
48<br />
1<br />
24<br />
16<br />
22<br />
58<br />
1 2 District Average<br />
4<br />
MATHEMATICS Value Added (2010−2011)
Bubble size represents size of the school<br />
These lines are 95% confidence intervals<br />
for representative school sizes<br />
Percent Proficient on Prior Exam<br />
30 40 50 60 70 80 90 100<br />
37<br />
20<br />
36<br />
43<br />
14<br />
23<br />
40<br />
29<br />
3<br />
45<br />
9<br />
17<br />
18<br />
44<br />
24<br />
22<br />
12 21 49 51<br />
32 57<br />
13<br />
38<br />
7<br />
42<br />
46<br />
2 19<br />
30 35<br />
41<br />
27<br />
54<br />
47<br />
52<br />
16<br />
15<br />
11<br />
28<br />
50 34<br />
56<br />
5<br />
39<br />
53 10<br />
1<br />
55 25 26<br />
4<br />
6<br />
48<br />
33<br />
58<br />
1 2 District Average 4 5<br />
READING Value Added (2010−2011)
Middle <strong>Schools</strong> (2010‐2011)
Bubble size represents size of the school<br />
These lines are 95% confidence intervals<br />
for representative school sizes<br />
Carver<br />
Percent Proficient on Prior Exam<br />
30 40 50 60 70 80<br />
Lewis and Clark<br />
Cleveland<br />
Nimitz<br />
BYRD<br />
Wilson<br />
Clinton<br />
Edison<br />
Whitney<br />
Foster<br />
Madison<br />
Hamilton<br />
Gilcrease<br />
Thoreau<br />
Kipp<br />
2 District Average<br />
MATHEMATICS Value Added (2010−2011)
Bubble size represents size of the school<br />
These lines are 95% confidence intervals<br />
for representative school sizes<br />
Percent Proficient on Prior Exam<br />
30 40 50 60 70 80 90<br />
Wilson<br />
Clinton<br />
Foster<br />
Madison<br />
Carver<br />
Kipp<br />
Lewis and Clark<br />
Nimitz<br />
Whitney<br />
Hamilton<br />
Thoreau<br />
Edison<br />
Byrd<br />
Cleveland<br />
Gilcrease<br />
2.5 District Average<br />
3.5<br />
READING Value Added (2010−2011)
High <strong>Schools</strong> (2010‐2011)
Bubble size represents size of the school<br />
These lines are 95% confidence intervals<br />
for representative school sizes<br />
Washington<br />
Percent Proficient on Prior Exam<br />
20 30 40 50 60 70<br />
East Central<br />
Hale<br />
Central<br />
Memorial<br />
Edison<br />
Webster<br />
McLain<br />
Rogers<br />
2 District Average<br />
4<br />
Algebra I Value Added (2010−2011)
Bubble size represents size of the school<br />
These lines are 95% confidence intervals<br />
for representative school sizes<br />
Washington<br />
Percent Proficient on Prior Exam<br />
40 50 60 70 80<br />
Central<br />
Rogers<br />
McLain<br />
Hale<br />
Webster<br />
Edison<br />
Memorial<br />
East Central<br />
2 District Average<br />
4<br />
Geometry Value Added (2010−2011)
Bubble size represents size of the school<br />
for representative school sizes<br />
Washington<br />
Edison<br />
Percent Proficient on Prior Exam<br />
20 40 60 80<br />
Rogers<br />
Memorial<br />
Hale<br />
McLain<br />
Central<br />
East Central<br />
2 District Average<br />
4<br />
Algebra II Value Added (2010−2011)
Bubble size represents size of the school<br />
These lines are 95% confidence intervals<br />
for representative school sizes<br />
Percent Proficient on Prior Exam<br />
30 40 50 60 70 80 90<br />
Hale<br />
East Central<br />
Central<br />
Rogers<br />
Memorial<br />
Webster<br />
Washington<br />
Edison<br />
McLain<br />
2.5<br />
District Average 3.5<br />
MATHEMATICS Value Added (2010−2011)
Bubble size represents size of the school<br />
for representative school sizes<br />
Washington<br />
Percent Proficient on Prior Exam<br />
20 30 40 50 60 70 80<br />
Hale<br />
Central<br />
East Central<br />
Rogers<br />
Webster<br />
McLain<br />
Edison<br />
Memorial<br />
2<br />
District Average<br />
English II Value Added (2010−2011)<br />
4
Bubble size represents size of the school<br />
for representative school sizes<br />
Washington<br />
Percent Proficient on Prior Exam<br />
50 60 70 80 90<br />
Hale<br />
Webster<br />
East Central<br />
Rogers<br />
Memorial<br />
Central<br />
Edison<br />
McLain<br />
District Average<br />
English III Value Added (2010−2011)<br />
4
Bubble size represents size of the school<br />
for representative school sizes<br />
Percent Proficient on Prior Exam<br />
30 40 50 60 70 80 90<br />
Hale<br />
East Central<br />
Rogers<br />
Webster<br />
Central<br />
McLain<br />
Washington<br />
Edison<br />
Memorial<br />
2 District Average<br />
4<br />
ENGLISH Value Added (2010−2011)
Bubble size represents size of the school<br />
for representative school sizes<br />
Percent Proficient on Proir Exam<br />
40 50 60 70 80 90 100<br />
East Central<br />
Memorial<br />
Hale<br />
Central<br />
Edison<br />
Washington<br />
Webster<br />
Rogers<br />
McLain<br />
District Average<br />
Biology I Value Added (2010−2011)<br />
4
Bubble size represents size of the school<br />
These lines are 95% confidence intervals<br />
for representative school sizes<br />
Washington<br />
Percent Proficient on Prior Exam<br />
50 60 70 80 90<br />
Webster<br />
Hale<br />
Rogers<br />
Central<br />
East Central<br />
Edison<br />
Memorial<br />
McLain<br />
2 District Average<br />
4<br />
U.S. History Value Added (2010−2011)
<strong>Elementary</strong> <strong>Schools</strong> (3 Year Average)
Key to <strong>Elementary</strong> <strong>Schools</strong>’ Value-Added/Achievement Scatter Plots<br />
NUMBER NAME NUMBER NAME NUMBER NAME<br />
1 ACADEMY CENTRAL 20 GREELEY 40 MCKINLEY<br />
2 ADDAMS (closed) 21 GRIMES 41 MITCHELL<br />
3 ALCOTT (closed) 22 GRISSOM 42 OWEN<br />
4 ANDERSON 23 HAWTHORNE 43 PARK<br />
5 BARNARD (closed) 24 HOOVER 44 P. HENRY<br />
6 BELL 25 HOUSTON (closed) 45 PEARY<br />
7 BRYANT (closed) 26 JACKSON 46 PENN<br />
8 BURROUGHS 27 JONES 47 PHILLIPS (closed)<br />
9 CARNEGIE 28 KENDALL- WHITTIER 48 REMINGTON<br />
10 C. CLINTON 29 KERR 49 ROBERTSON<br />
11 CHEROKEE (closed) 30 KEY 50 ROOSEVELT (closed)<br />
12 CHOUTEAU (moved) 31 KIPP TULSA ACADEMY 51 SALK<br />
13 COLUMBUS 32 LANIER 52 SANDBURG (closed)<br />
14 COOPER 33 LEE 53 SEQUOYAH<br />
15 DISNEY 34 LINDBERGH 54 SKELLY<br />
16 E. FIELD 35 MACARTHUR 55 SPRINGDALE<br />
17 EISENHOWER 36 MARK TWAIN 56 WHITMAN<br />
18 ELIOT 37 MARSHALL 57 WRIGHT<br />
19 EMERSON 38 MAYO 58 ZARROW INTL<br />
39 MCCLURE
Bubble size represents size of the school<br />
These lines are approximate 95% confidence<br />
intervals for representative school sizes<br />
9<br />
17<br />
Percent Proficient on Prior Exam<br />
40 50 60 70 80 90<br />
20<br />
10<br />
52<br />
57<br />
30<br />
8<br />
34<br />
55<br />
3<br />
41<br />
45<br />
21<br />
23<br />
40<br />
50<br />
1<br />
11<br />
12<br />
18<br />
46<br />
14<br />
5133<br />
44<br />
29 36 43<br />
13<br />
47<br />
42<br />
7<br />
48 5 15<br />
19<br />
2 6<br />
54<br />
31<br />
26 35<br />
53<br />
56<br />
39<br />
24<br />
49<br />
32<br />
38<br />
28<br />
27<br />
58<br />
22<br />
16<br />
37<br />
25<br />
4<br />
1 2 District Average<br />
4<br />
MATHEMATICS Value Added (3 Year Average)
Bubble size represents size of the school<br />
These lines are approximate 95% confidence<br />
intervals for representative school sizes<br />
9<br />
17<br />
18<br />
58<br />
Percent Proficient on Prior Exam<br />
50 60 70 80 90<br />
20<br />
3<br />
1<br />
31<br />
55<br />
24<br />
21<br />
43<br />
44<br />
12<br />
57<br />
38<br />
36<br />
32<br />
46 14<br />
30<br />
13<br />
42<br />
8<br />
48 7<br />
29<br />
45<br />
40<br />
23<br />
41 2<br />
19<br />
47 28<br />
5 34 54 35<br />
50<br />
16<br />
15<br />
6<br />
52<br />
11<br />
27<br />
10 37<br />
26<br />
56 53<br />
4 25 39<br />
33<br />
51<br />
49<br />
22<br />
1 2 District Average<br />
4<br />
READING Value Added (3 Year Average)
Middle <strong>Schools</strong> (3 Year Average)
Bubble size represents size of the school<br />
These lines are approximate 95% confidence<br />
intervals for representative school sizes<br />
Percent Proficient on Prior Exam<br />
50 60 70 80 90<br />
Clinton<br />
Lewis and Clark<br />
Nimitz<br />
Foster<br />
Carver<br />
Thoreau<br />
Edison<br />
Wilson<br />
Byrd<br />
Whitney<br />
Madison<br />
Kipp<br />
Cleveland<br />
Gilcrease<br />
Hamilton<br />
2 District Average<br />
4 5<br />
MATHEMATICS Value Added (3 Year Average)
Bubble size represents size of the school<br />
These lines are approximate 95% confidence<br />
intervals for representative school sizes<br />
Percent Proficient on Prior Exam<br />
40 50 60 70 80 90<br />
Byrd<br />
Clinton<br />
Madison<br />
Nimitz<br />
Foster<br />
Edison<br />
Whitney<br />
Wilson<br />
Lewis and Clark<br />
Hamilton<br />
Carver<br />
Kipp<br />
Thoreau<br />
Gilcrease<br />
Cleveland<br />
2.5 District Average<br />
3.5<br />
READING Value Added (3 Year Average)
High <strong>Schools</strong> (3 Year Average)
Bubble size represents size of the school<br />
These lines are approximate 95% confidence<br />
intervals for representative school sizes<br />
Washington<br />
Percent Proficient on Prior Exam<br />
40 45 50 55 60 65 70 75<br />
A<br />
Hale<br />
East Central<br />
Memorial<br />
Central<br />
Webster<br />
Edison<br />
McLain<br />
Rogers<br />
2 District Average<br />
4<br />
Algebra I Value Added (3 Year Average)
Bubble size represents size of the school<br />
These lines are approximate 95% confidence<br />
intervals for representative school sizes<br />
Washington<br />
Percent Proficient on Prior Exam<br />
50 60 70 80 90<br />
Rogers<br />
Central<br />
Webster<br />
East Central<br />
Hale<br />
Memorial<br />
Edison<br />
McLain<br />
2 District Average<br />
4<br />
Geometry Value Added (3 Year Average)
Bubble size represents size of the school<br />
These lines are approximate 95% confidence<br />
intervals for representative school sizes<br />
Percent Proficient on Prior Exam<br />
30 40 50 60 70 80 90<br />
Hale<br />
Webster<br />
Rogers<br />
Memorial<br />
Washington<br />
Central<br />
East Central<br />
Edison<br />
McLain<br />
District Average<br />
Algebra II Value Added (3 Year Average)<br />
4
Bubble size represents size of the school<br />
These lines are approximate 95% confidence<br />
intervals for representative school sizes<br />
Washington<br />
Percent Proficient on Prior Exam<br />
40 50 60 70 80<br />
Hale<br />
East Central<br />
Memorial<br />
Central<br />
Webster<br />
Rogers<br />
Edison<br />
McLain<br />
District Average<br />
MATHEMATICS Value Added (3 Year Average)<br />
4
Bubble size represents size of the school<br />
These lines are approximate 95% confidence<br />
intervals for representative school sizes<br />
Washington<br />
Percent Proficient on Prior Exam<br />
40 50 60 70 80 90<br />
A<br />
East Central<br />
Hale<br />
Rogers<br />
Webster<br />
Edison<br />
Central<br />
Memorial<br />
McLain<br />
2 District Average<br />
4<br />
English II Value Added (3 Year Average)
Bubble size represents size of the school<br />
These lines are approximate 95% confidence<br />
intervals for representative school sizes<br />
Washington<br />
Percent Proficient on Prior Exam<br />
50 60 70 80 90<br />
McLain<br />
East Central<br />
Memorial<br />
Hale<br />
Central<br />
Webster<br />
Rogers<br />
Edison<br />
2 District Average<br />
4<br />
English III Value Added (3 Year Average)
Bubble size represents size of the school<br />
These lines are approximate 95% confidence<br />
intervals for representative school sizes<br />
Washington<br />
Percent Proficient on Prior Exam<br />
50 60 70 80 90<br />
A<br />
East Central<br />
Hale<br />
Rogers<br />
Webster<br />
Central<br />
Edison<br />
Memorial<br />
McLain<br />
2 District Average<br />
4<br />
ENGLISH Value Added (3 Year Average)
Bubble size represents size of the school<br />
These lines are approximate 95% confidence<br />
intervals for representative school sizes<br />
Percent Proficient on Prior Exam<br />
50 60 70 80 90<br />
East Central<br />
A<br />
Hale<br />
Memorial<br />
Webster<br />
Edison<br />
Washington<br />
McLain<br />
Central<br />
Rogers<br />
2 District Average<br />
4<br />
Biology I Value Added (3 Year Average)
Bubble size represents size of the school<br />
These lines are approximate 95% confidence<br />
intervals for representative school sizes<br />
Washington<br />
Percent Proficient on Prior Exam<br />
50 60 70 80 90<br />
Webster<br />
Central<br />
Hale<br />
East Central<br />
Edison<br />
Memorial<br />
McLain<br />
Rogers<br />
2 District Average<br />
4<br />
U.S. History Value Added (3 Year Average)
2011 VA SCHOOL REPORT<br />
MACARTHUR ELEMENTARY<br />
2011 VA School Report<br />
This report provides 2011 ValueAdded (VA) data. The results reported here<br />
measure your school's impact on the academic growth of students at both the<br />
school and grade levels for each tested subject. In addition to the overall<br />
results, VA Estimates are also provided for specific groups of students, based<br />
on Prior Student Achievement Level, ELL Status, and Special Education<br />
Status. For each student group, the VA Estimate compares the actual<br />
achievement of students in your school to the predicted achievement of those<br />
students. All VA results account for prior state test scores (OCCT and<br />
OMAAP). A number of demographic variables are also included in the<br />
calculation to ensure the results regarding your school's impact are as fair<br />
and accurate as possible. For more information on the demographic variables,<br />
please see the last page of this report.<br />
Report Contents<br />
Page 1 How to Read the VA<br />
School Report<br />
Page 2 SchoolLevel VA Results<br />
Page 3 4 GradeLevel VA<br />
Results<br />
Page 5 6 SchoolLevel Results<br />
with Student Subgroups<br />
Page 7 13 GradeLevel Results<br />
with Student Subgroups<br />
Page 14 16 SchoolLevel and<br />
GradeLevel VA Graphs<br />
Page 17 Additional Information on<br />
VA<br />
1
2011 VA SCHOOL REPORT<br />
MACARTHUR ELEMENTARY<br />
ValueAdded: SchoolLevel Results<br />
The tables below provide SchoolLevel VA results for Reading and Math. Results are provided both for the 2010–<br />
2011 academic year and for the average of the last three years. Refer to page 1 of this report for tips on how to<br />
read these tables.<br />
NUMBER OF<br />
STUDENTS<br />
(WEIGHTED)<br />
READING SchoolLevel VA<br />
Past Academic Year 2010–2011 3 Year Average 20082011<br />
VA ESTIMATE<br />
NUMBER OF<br />
STUDENTS<br />
(WEIGHTED)<br />
VA ESTIMATE<br />
1 2 District Average 4 5 1 2 District Average 4 5<br />
Overall 67.0 3.3 214.3<br />
3.4<br />
MATH SchoolLevel VA<br />
Overall 67.0 3.5 212.3<br />
3.2<br />
2
2011 VA SCHOOL REPORT<br />
MACARTHUR ELEMENTARY<br />
ValueAdded: GradeLevel Results<br />
The tables below provide GradeLevel VA results for all OCCT subjects. Results are provided both for 2010–2011<br />
academic year and for the average of the last three years. Refer to page 1 of this report for tips on how to read<br />
these tables.<br />
NUMBER OF<br />
STUDENTS<br />
(WEIGHTED)<br />
Past Academic Year 2010–2011 3 Year Average 20082011<br />
VA ESTIMATE<br />
NUMBER OF<br />
STUDENTS<br />
(WEIGHTED)<br />
VA ESTIMATE<br />
1 2 District Average 4 5 1 2 District Average 4 5<br />
READING<br />
GradeLevel VA<br />
Grade 4 28.0 3.1 101.6<br />
3.2<br />
Grade 5 39.0 3.4 112.7<br />
3.6<br />
MATH<br />
GradeLevel VA<br />
Grade 4 28.0 3.9 101.6<br />
3.4<br />
Grade 5 39.0 3.2 110.7<br />
3.0<br />
SCIENCE<br />
GradeLevel VA<br />
Grade 5 39.0 3.2 110.7<br />
3.8<br />
3
2011 VA SCHOOL REPORT<br />
MACARTHUR ELEMENTARY<br />
ValueAdded: GradeLevel Results<br />
The tables below provide GradeLevel VA results for all OCCT subjects. Results are provided both for 2010–2011<br />
academic year and for the average of the last three years. Refer to page 1 of this report for tips on how to read<br />
these tables.<br />
NUMBER OF<br />
STUDENTS<br />
(WEIGHTED)<br />
Past Academic Year 2010–2011 3 Year Average 20082011<br />
VA ESTIMATE<br />
NUMBER OF<br />
STUDENTS<br />
(WEIGHTED)<br />
VA ESTIMATE<br />
1 2 District Average 4 5 1 2 District Average 4 5<br />
SOCIAL STUDIES<br />
GradeLevel VA<br />
Grade 5 39.0 2.4 102.9<br />
3.1<br />
WRITING<br />
GradeLevel VA<br />
Grade 5 35.0 2.6 96.9<br />
2.7<br />
4
READING<br />
2011 VA SCHOOL REPORT<br />
MACARTHUR ELEMENTARY<br />
ValueAdded: SchoolLevel Results with Student Subgroups<br />
The tables below provide SchoolLevel VA results for specific groups of students. Results are provided both for<br />
the 2010–2011 academic year and for the average of the last three years.<br />
By Prior Student Achievement Level: These groups are based on the student's OCCT performance level from the<br />
previous year. Note: does not include OMAAP results.<br />
By ELL Status: Results are based on English Language Learner (ELL) status of students. Note: does not include<br />
OMAAP results.<br />
By SPED Status: Results are based on Special Education (SPED) status of students.<br />
NUMBER OF<br />
STUDENTS<br />
(WEIGHTED)<br />
Past Academic Year 2010–2011 3 Year Average 20082011<br />
VA ESTIMATE<br />
READING By Prior Student Achievement Level<br />
NUMBER OF<br />
STUDENTS<br />
(WEIGHTED)<br />
VA ESTIMATE<br />
1 2 District Average 4 5 1 2 District Average 4 5<br />
Advanced ** Insufficient Data or NA ** Insufficient Data or NA<br />
Proficient 36.0 3.1 114.9<br />
3.4<br />
Limited<br />
Knowledge<br />
** Insufficient Data or NA 36.1<br />
3.2<br />
Unsatisfactory 20.0 3.5 36.0<br />
3.6<br />
READING By ELL Status<br />
ELL 11.0 3.3 38.6<br />
3.4<br />
NonELL 54.0 3.3 153.4<br />
3.4<br />
READING By SPED Status<br />
SPED ** Insufficient Data or NA 34.9<br />
3.2<br />
NonSPED ** Insufficient Data or NA 179.4<br />
3.5<br />
5
MATH<br />
2011 VA SCHOOL REPORT<br />
MACARTHUR ELEMENTARY<br />
ValueAdded: SchoolLevel Results with Student Subgroups<br />
The tables below provide SchoolLevel VA results for specific groups of students. Results are provided both for<br />
the 2010–2011 academic year and for the average of the last three years.<br />
By Prior Student Achievement Level: These groups are based on the student's OCCT performance level from the<br />
previous year. Note: does not include OMAAP results.<br />
By ELL Status: Results are based on English Language Learner (ELL) status of students. Note: does not include<br />
OMAAP results.<br />
By SPED Status: Results are based on Special Education (SPED) status of students.<br />
NUMBER OF<br />
STUDENTS<br />
(WEIGHTED)<br />
Past Academic Year 2010–2011 3 Year Average 20082011<br />
VA ESTIMATE<br />
MATH By Prior Student Achievement Level<br />
NUMBER OF<br />
STUDENTS<br />
(WEIGHTED)<br />
VA ESTIMATE<br />
1 2 District Average 4 5 1 2 District Average 4 5<br />
Advanced ** Insufficient Data or NA 14.0<br />
3.3<br />
Proficient 28.0 3.5 85.5<br />
3.2<br />
Limited<br />
Knowledge<br />
14.0 3.5 52.3<br />
3.2<br />
Unsatisfactory 18.0 3.5 40.2<br />
3.1<br />
MATH By ELL Status<br />
ELL 11.0 3.6 38.6<br />
3.3<br />
NonELL 54.0 3.5 153.4<br />
3.2<br />
MATH By SPED Status<br />
SPED ** Insufficient Data or NA 32.9<br />
3.4<br />
NonSPED ** Insufficient Data or NA 179.4<br />
3.2<br />
6
READING<br />
2011 VA SCHOOL REPORT<br />
MACARTHUR ELEMENTARY<br />
ValueAdded: GradeLevel Results with Student Subgroups<br />
The tables below provide GradeLevel VA results for specific groups of students. Results are provided both for the<br />
2010–2011 academic year and for the average of the last three years.<br />
By Prior Student Achievement Level: These groups are based on the student's OCCT performance level from the<br />
previous year. Note: does not include OMAAP results.<br />
By ELL Status: Results are based on English Language Learner (ELL) status of students. Note: does not include<br />
OMAAP results.<br />
By SPED Status: Results are based on Special Education (SPED) status of students.<br />
NUMBER OF<br />
STUDENTS<br />
(WEIGHTED)<br />
Past Academic Year 2010–2011 3 Year Average 20082011<br />
VA ESTIMATE<br />
Grade 4 By Prior Student Achievement Level<br />
NUMBER OF<br />
STUDENTS<br />
(WEIGHTED)<br />
VA ESTIMATE<br />
1 2 District Average 4 5 1 2 District Average 4 5<br />
Advanced ** Insufficient Data or NA ** Insufficient Data or NA<br />
Proficient 15.0 3.1 56.0<br />
3.3<br />
Limited<br />
Knowledge<br />
** Insufficient Data or NA 21.3<br />
3.0<br />
Unsatisfactory ** Insufficient Data or NA 15.0<br />
3.2<br />
Grade 4 By ELL Status<br />
ELL ** Insufficient Data or NA 23.3<br />
3.0<br />
NonELL ** Insufficient Data or NA 71.0<br />
3.2<br />
Grade 4 By SPED Status<br />
SPED ** Insufficient Data or NA 11.3<br />
3.1<br />
NonSPED ** Insufficient Data or NA 90.3<br />
3.3<br />
7
READING<br />
2011 VA SCHOOL REPORT<br />
MACARTHUR ELEMENTARY<br />
ValueAdded: GradeLevel Results with Student Subgroups<br />
The tables below provide GradeLevel VA results for specific groups of students. Results are provided both for the<br />
2010–2011 academic year and for the average of the last three years.<br />
By Prior Student Achievement Level: These groups are based on the student's OCCT performance level from the<br />
previous year. Note: does not include OMAAP results.<br />
By ELL Status: Results are based on English Language Learner (ELL) status of students. Note: does not include<br />
OMAAP results.<br />
By SPED Status: Results are based on Special Education (SPED) status of students.<br />
NUMBER OF<br />
STUDENTS<br />
(WEIGHTED)<br />
Past Academic Year 2010–2011 3 Year Average 20082011<br />
VA ESTIMATE<br />
Grade 5 By Prior Student Achievement Level<br />
NUMBER OF<br />
STUDENTS<br />
(WEIGHTED)<br />
VA ESTIMATE<br />
1 2 District Average 4 5 1 2 District Average 4 5<br />
Advanced ** Insufficient Data or NA ** Insufficient Data or NA<br />
Proficient 21.0 2.6 58.9<br />
3.5<br />
Limited<br />
Knowledge<br />
** Insufficient Data or NA 14.8<br />
3.6<br />
Unsatisfactory 11.0 4.4 21.0<br />
4.4<br />
Grade 5 By ELL Status<br />
ELL ** Insufficient Data or NA 15.3<br />
4.1<br />
NonELL ** Insufficient Data or NA 82.4<br />
3.5<br />
Grade 5 By SPED Status<br />
SPED ** Insufficient Data or NA 23.6<br />
3.3<br />
NonSPED ** Insufficient Data or NA 89.0<br />
3.8<br />
8
MATH<br />
2011 VA SCHOOL REPORT<br />
MACARTHUR ELEMENTARY<br />
ValueAdded: GradeLevel Results with Student Subgroups<br />
The tables below provide GradeLevel VA results for specific groups of students. Results are provided both for the<br />
2010–2011 academic year and for the average of the last three years.<br />
By Prior Student Achievement Level: These groups are based on the student's OCCT performance level from the<br />
previous year. Note: does not include OMAAP results.<br />
By ELL Status: Results are based on English Language Learner (ELL) status of students. Note: does not include<br />
OMAAP results.<br />
By SPED Status: Results are based on Special Education (SPED) status of students.<br />
NUMBER OF<br />
STUDENTS<br />
(WEIGHTED)<br />
Past Academic Year 2010–2011 3 Year Average 20082011<br />
VA ESTIMATE<br />
Grade 4 By Prior Student Achievement Level<br />
NUMBER OF<br />
STUDENTS<br />
(WEIGHTED)<br />
VA ESTIMATE<br />
1 2 District Average 4 5 1 2 District Average 4 5<br />
Advanced ** Insufficient Data or NA ** Insufficient Data or NA<br />
Proficient 10.0 3.9 39.0<br />
3.5<br />
Limited<br />
Knowledge<br />
** Insufficient Data or NA 25.6<br />
3.4<br />
Unsatisfactory 10.0 4.0 21.8<br />
3.2<br />
Grade 4 By ELL Status<br />
ELL ** Insufficient Data or NA 23.3<br />
3.4<br />
NonELL ** Insufficient Data or NA 71.0<br />
3.4<br />
Grade 4 By SPED Status<br />
SPED ** Insufficient Data or NA 11.3<br />
4.2<br />
NonSPED ** Insufficient Data or NA 90.3<br />
3.4<br />
9
MATH<br />
2011 VA SCHOOL REPORT<br />
MACARTHUR ELEMENTARY<br />
ValueAdded: GradeLevel Results with Student Subgroups<br />
The tables below provide GradeLevel VA results for specific groups of students. Results are provided both for the<br />
2010–2011 academic year and for the average of the last three years.<br />
By Prior Student Achievement Level: These groups are based on the student's OCCT performance level from the<br />
previous year. Note: does not include OMAAP results.<br />
By ELL Status: Results are based on English Language Learner (ELL) status of students. Note: does not include<br />
OMAAP results.<br />
By SPED Status: Results are based on Special Education (SPED) status of students.<br />
NUMBER OF<br />
STUDENTS<br />
(WEIGHTED)<br />
Past Academic Year 2010–2011 3 Year Average 20082011<br />
VA ESTIMATE<br />
Grade 5 By Prior Student Achievement Level<br />
NUMBER OF<br />
STUDENTS<br />
(WEIGHTED)<br />
VA ESTIMATE<br />
1 2 District Average 4 5 1 2 District Average 4 5<br />
Advanced ** Insufficient Data or NA ** Insufficient Data or NA<br />
Proficient 18.0 3.2 46.5<br />
3.0<br />
Limited<br />
Knowledge<br />
** Insufficient Data or NA 26.8<br />
3.1<br />
Unsatisfactory ** Insufficient Data or NA 18.4<br />
3.0<br />
Grade 5 By ELL Status<br />
ELL ** Insufficient Data or NA 15.3<br />
3.2<br />
NonELL ** Insufficient Data or NA 82.4<br />
3.0<br />
Grade 5 By SPED Status<br />
SPED ** Insufficient Data or NA 21.6<br />
3.0<br />
NonSPED ** Insufficient Data or NA 89.0<br />
3.0<br />
10
SCIENCE<br />
2011 VA SCHOOL REPORT<br />
MACARTHUR ELEMENTARY<br />
ValueAdded: GradeLevel Results with Student Subgroups<br />
The tables below provide GradeLevel VA results for specific groups of students. Results are provided both for the<br />
2010–2011 academic year and for the average of the last three years.<br />
By Prior Student Achievement Level: These groups are based on the student's OCCT performance level from the<br />
previous year. Note: does not include OMAAP results.<br />
By ELL Status: Results are based on English Language Learner (ELL) status of students. Note: does not include<br />
OMAAP results.<br />
By SPED Status: Results are based on Special Education (SPED) status of students.<br />
NUMBER OF<br />
STUDENTS<br />
(WEIGHTED)<br />
Past Academic Year 2010–2011 3 Year Average 20082011<br />
VA ESTIMATE<br />
Grade 5 By Prior Student Achievement Level<br />
NUMBER OF<br />
STUDENTS<br />
(WEIGHTED)<br />
VA ESTIMATE<br />
1 2 District Average 4 5 1 2 District Average 4 5<br />
Advanced ** Insufficient Data or NA ** Insufficient Data or NA<br />
Proficient 18.0 3.2 46.5<br />
3.8<br />
Limited<br />
Knowledge<br />
** Insufficient Data or NA 26.8<br />
3.6<br />
Unsatisfactory ** Insufficient Data or NA 18.4<br />
3.8<br />
Grade 5 By ELL Status<br />
ELL ** Insufficient Data or NA 15.3<br />
3.8<br />
NonELL ** Insufficient Data or NA 82.4<br />
3.7<br />
Grade 5 By SPED Status<br />
SPED ** Insufficient Data or NA 21.6<br />
3.7<br />
NonSPED ** Insufficient Data or NA 89.0<br />
3.6<br />
11
SOCIAL STUDIES<br />
2011 VA SCHOOL REPORT<br />
MACARTHUR ELEMENTARY<br />
ValueAdded: GradeLevel Results with Student Subgroups<br />
The tables below provide GradeLevel VA results for specific groups of students. Results are provided both for the<br />
2010–2011 academic year and for the average of the last three years.<br />
By Prior Student Achievement Level: These groups are based on the student's OCCT performance level from the<br />
previous year. Note: does not include OMAAP results.<br />
By ELL Status: Results are based on English Language Learner (ELL) status of students. Note: does not include<br />
OMAAP results.<br />
By SPED Status: Results are based on Special Education (SPED) status of students.<br />
NUMBER OF<br />
STUDENTS<br />
(WEIGHTED)<br />
Past Academic Year 2010–2011 3 Year Average 20082011<br />
VA ESTIMATE<br />
Grade 5 By Prior Student Achievement Level<br />
NUMBER OF<br />
STUDENTS<br />
(WEIGHTED)<br />
VA ESTIMATE<br />
1 2 District Average 4 5 1 2 District Average 4 5<br />
Advanced ** Insufficient Data or NA ** Insufficient Data or NA<br />
Proficient 21.0 2.4 59.9<br />
3.1<br />
Limited<br />
Knowledge<br />
** Insufficient Data or NA 16.0<br />
3.1<br />
Unsatisfactory 13.0 2.4 24.0<br />
3.2<br />
Grade 5 By ELL Status<br />
ELL ** Insufficient Data or NA 16.3<br />
3.2<br />
NonELL ** Insufficient Data or NA 86.7<br />
3.1<br />
Grade 5 By SPED Status<br />
SPED ** Insufficient Data or NA 13.9<br />
2.8<br />
NonSPED ** Insufficient Data or NA 89.0<br />
3.2<br />
12
WRITING<br />
2011 VA SCHOOL REPORT<br />
MACARTHUR ELEMENTARY<br />
ValueAdded: GradeLevel Results with Student Subgroups<br />
The tables below provide GradeLevel VA results for specific groups of students. Results are provided both for the<br />
2010–2011 academic year and for the average of the last three years.<br />
By Prior Student Achievement Level: These groups are based on the student's OCCT performance level from the<br />
previous year. Note: does not include OMAAP results.<br />
By ELL Status: Results are based on English Language Learner (ELL) status of students. Note: does not include<br />
OMAAP results.<br />
By SPED Status: Results are based on Special Education (SPED) status of students.<br />
NUMBER OF<br />
STUDENTS<br />
(WEIGHTED)<br />
Past Academic Year 2010–2011 3 Year Average 20082011<br />
VA ESTIMATE<br />
Grade 5 By Prior Student Achievement Level<br />
NUMBER OF<br />
STUDENTS<br />
(WEIGHTED)<br />
VA ESTIMATE<br />
1 2 District Average 4 5 1 2 District Average 4 5<br />
Advanced ** Insufficient Data or NA ** Insufficient Data or NA<br />
Proficient 21.0 2.6 58.4<br />
2.7<br />
Limited<br />
Knowledge<br />
** Insufficient Data or NA 14.5<br />
2.7<br />
Unsatisfactory 10.0 2.6 21.0<br />
2.7<br />
Grade 5 By ELL Status<br />
ELL ** Insufficient Data or NA 16.3<br />
2.9<br />
NonELL ** Insufficient Data or NA 80.6<br />
2.6<br />
Grade 5 By SPED Status<br />
SPED ** Insufficient Data or NA 10.9<br />
2.6<br />
NonSPED ** Insufficient Data or NA 86.0<br />
2.7<br />
13
2011 VA SCHOOL REPORT<br />
MACARTHUR ELEMENTARY<br />
Your School Compared to the Rest of the District<br />
The charts below compare your school's student growth (ValueAdded) in reading and mathematics to student<br />
attainment (percentage of students who meet or exceed the OCCT proficiency standards). ValueAdded scores<br />
are read along the bottom, and percentage meeting/exceeding standards are read along the lefthand side.<br />
READING<br />
MATH<br />
14
2011 VA SCHOOL REPORT<br />
MACARTHUR ELEMENTARY<br />
Your School Compared to the Rest of the District by Grade<br />
15
2011 VA SCHOOL REPORT<br />
MACARTHUR ELEMENTARY<br />
Your School Compared to the Rest of the District by Grade<br />
16
2011 VA SCHOOL REPORT<br />
MACARTHUR ELEMENTARY<br />
Additional Information on ValueAdded<br />
Differences Between Specific Groups of Students<br />
Readers may want to compare two student subgroups. For example, let's say you see the following on your<br />
report:<br />
In this case, it is not necessarily true that students in the "Unsatisfactory" grouping grew more than students in<br />
the "Proficient" grouping. Instead the table above indicates that your "Unsatisfactory" students grew more, on<br />
average, than similar "Unsatisfactory" students from across TPS. Your "Proficient" students grew, on average,<br />
about the same as similar "Proficient" students from across TPS.<br />
Prior Achievement Level for Student Groups<br />
The prior achievement level groupings in this report are "Advanced", "Proficient", "Limited Knowledge" and<br />
"Unsatisfactory." These groups are based on the student's OCCT performance level from the previous year. The<br />
purpose of this calculation is to measure the impact of teachers on students from across the achievement<br />
spectrum.<br />
Control Variables Used in the VA Model<br />
The VA Model uses statistical techniques to separate the impact of schooling from other factors that may<br />
influence growth; the following variables are controlled for in the VA Model:<br />
1. Prior OCCT Reading Score 5. Race/Ethnicity 9. Mobility<br />
2. Prior OCCT Math Score 6. LowIncome Status 10. Attendance History<br />
3. Grade Level 7. ELL Status 11. Grade Retention<br />
4. Gender 8. Special Education Status<br />
It is important to note that controlling for demographic characteristics does not mean a lowering of expectations<br />
for any grouping of students addressed by a control variable.<br />
For more information on ValueAdded (VA), please refer to the companion professional development piece titled,<br />
"Making Meaning of Your ValueAdded School Report."<br />
Insufficient Data or NA<br />
Results may not be provided for the following reasons:<br />
Too few students to calculate a result (less than 10).<br />
Too few students in the contrasting category to calculate a result.<br />
A grade level or subject was not taught during the given time period.<br />
Only one teacher taught that grade or subject during the given time period.<br />
No districtwide differential effects between student groups.<br />
17
Principal Leadership Conference October 2011<br />
Agenda<br />
October 5, 2011<br />
8:00 a.m. BREAKFAST Cafetorium<br />
8:20 a.m.<br />
Welcome and Opening Remarks<br />
WELCOME AND REFLECTION<br />
Millard House, Deputy Superintendent<br />
Kevin Burr, Associate Superintendent for Secondary<br />
<strong>Schools</strong><br />
Concurrent Morning Sessions<br />
Cafetorium<br />
8:30 a.m. - 10:00 a.m. VALUE ADDED DATA - Part 1 <strong>Elementary</strong> Team 1 Auditorium<br />
VALUE ADDED DATA - Part 1 <strong>Elementary</strong> Team 2 W-2<br />
COMMON CORE All Secondary W-6<br />
10:00 a.m.- 10:15 a.m. BREAK<br />
10:15 a.m. - 11:15 a.m. VALUE ADDED DATA - Part 2 <strong>Elementary</strong> Team 1 Auditorium<br />
VALUE ADDED DATA - Part 2 <strong>Elementary</strong> Team 2 W-2<br />
10:15 a.m.- 11:45 a.m. TLE EVALUATION SYSTEM All Secondary W-6<br />
11:15 a.m. - 12:15 p.m. CULTURAL COMPETENCE All <strong>Elementary</strong> Auditorium<br />
11:45 a.m.- 12:45 p.m. SECONDARY LUNCH Cafetorium<br />
12:15 p.m. - 1:15 p.m. ELEMENTARY LUNCH Cafetorium<br />
Afternoon Sessions<br />
12:45 p.m. - 1:45 p.m. CULTURAL COMPETENCE All Secondary W-6<br />
1:15 p.m. - 2:45 p.m. COMMON CORE All <strong>Elementary</strong> Auditorium<br />
1:45 p.m. - 2:45 p.m. VALUE ADDED DATA - Part 1 M.S./Jr. High W-8<br />
2:45 p.m.- 3:00 p.m. BREAK<br />
VALUE ADDED DATA - Part 1 High School W-6<br />
3:00 p.m.- 4:30 p.m. TLE EVALUATION SYSTEM All <strong>Elementary</strong> Cafetorium<br />
VALUE ADDED DATA - Part 2 M.S./Jr. High W-8<br />
VALUE ADDED DATA - Part 2 High School W-6<br />
NOTE: See back page for your cohort assignment<br />
PLEASE MARK YOUR CALENDARS:<br />
Principal Leadership Conferences: January 4 th , March 7 th and May 2nd (8:00 a.m.-4:30 p.m.)<br />
Superintendent’s Qtly. Meetings (PRINCIPALS ONLY): Monday, November 7th (DATE CHANGE), February 1 st<br />
(8:00-12:00 PM)<br />
June Leadership Conference: TBD
ELEMENTARY TEAM 1:<br />
o Central, Rogers, Hale and McLain Feeder<br />
<strong>Elementary</strong> Sites<br />
o ECDC Sites<br />
ELEMENTARY TEAM 2:<br />
o Memorial, East Central, Edison and<br />
Webster Feeder <strong>Elementary</strong> Sites<br />
o Magnet <strong>Elementary</strong> Sites<br />
SECONDARY TEAM<br />
MIDDLE SCHOOL/JR HIGH<br />
HIGH SCHOOL<br />
COHORT ASSIGNMENTS<br />
Academy Central, Mark Twain, Burroughs,<br />
Emerson, Chouteau, Kendall-Whittier, Sequoyah,<br />
Skelly, McArthur, Jones, Lindbergh, Bell, Hoover,<br />
Hamilton, Owen, McKinley, Celia Clinton,<br />
Hawthorne, Jackson, Gilcrease, Greeley,<br />
Springdale, Whitman, <strong>Anderson</strong>, Penn, ECDC<br />
Houston, ECDC Reed, ECDC Porter, Project Accept<br />
Grissom, Salk, Carnegie, Grimes, Key, McClure,<br />
Marshall, Kerr, Mitchell, Lewis & Clark, Columbus,<br />
Cooper, Disney, Peary, Eliot, Wright, Lanier, Lee,<br />
Patrick Henry, Eisenhower, Mayo, Zarrow, Monroe<br />
Dual Immersion, Park, Robertson, Remington,<br />
Eugene Field<br />
All Secondary Sites<br />
Carver, Clinton, East Central JH, Hale JH, Memorial<br />
JH, Monroe Demonstration, Thoreau, <strong>Tulsa</strong> Met JH<br />
Central, East Central HS, Edison Preparatory, Hale,<br />
McLain, Memorial, Rogers College High,<br />
Washington, Webster HS,<br />
TLA/Virtual/Continuation, TRAICE, <strong>Tulsa</strong> Met HS,<br />
Early College<br />
*ESC and Fulton Personnel may follow any cohort based on the schools with whom they work most closely.
Principal Leadership Conference<br />
August 2011<br />
Agenda<br />
August 15, 2011<br />
8:00 a.m. BREAKFAST Cafetorium<br />
Welcome and Opening Remarks<br />
8:30 a.m.<br />
8:35 a.m-8:55 a.m.<br />
OPENING REMARKS<br />
Dr. Keith E. Ballard, Superintendent<br />
REFLECTION AND THE YEAR AHEAD<br />
Millard House, Deputy Superintendent<br />
Kevin Burr, Associate Superintendent for Secondary <strong>Schools</strong><br />
Concurrent Morning Sessions<br />
Cafetorium<br />
Cafetorium<br />
9:00 a.m. -10:30 a.m. COMMON CORE Cohort 1 Auditorium<br />
COMMON CORE Cohort 2 Room S-1<br />
PROFESSIONAL LEARNING<br />
COMMUNITIES<br />
Cohorts 3 & 4<br />
Cafetorium<br />
10:35 a.m. -12:05 p.m. COMMON CORE Cohort 3 Auditorium<br />
COMMON CORE Cohort 4 Room S-1<br />
PROFESSIONAL LEARNING<br />
COMMUNITIES<br />
Cohorts 1 & 2<br />
Cafetorium<br />
12:05 p.m.-12:55 p.m. LUNCH Cafetorium<br />
Afternoon Sessions<br />
1:00 p.m. -4:30 p.m. VALUE ADDED ANALYSIS RETOOLING<br />
(2:30-2:45 Break with refreshments<br />
provided in Cafetorium)<br />
<strong>Elementary</strong> Team 1 Room S-1<br />
<strong>Elementary</strong> Team 2 Room N-8<br />
Secondary Team Auditorium<br />
NOTE: See back page for your cohort assignment<br />
PLEASE MARK YOUR CALENDARS:<br />
Principal Leadership Conferences: October 5 th , January 4 th , March 7 th and May 2nd (8:00 a.m.-4:30 p.m.)<br />
Superintendent’s Quarterly Meetings (PRINCIPALS ONLY): September 7 th , November 3 rd (Thur.), February 1 st<br />
(8:00-12:00 PM)<br />
June Leadership Conference: TBD
COHORT 1:<br />
o Central, Rogers and Hale Feeder Patterns<br />
COHORT 2:<br />
o McLain and Memorial Feeder Patterns<br />
o ECDC Sites<br />
COHORT 3:<br />
o East Central and Edison Feeder Patterns<br />
o Magnet <strong>Schools</strong><br />
COHORT 4:<br />
o Webster Feeder Pattern<br />
o Innovative <strong>Schools</strong><br />
o ESC and Fulton Personnel*<br />
ELEMENTARY TEAM 1:<br />
o Central, Rogers, Hale and McLain Feeder<br />
<strong>Elementary</strong> Sites<br />
o ECDC Sites<br />
ELEMENTARY TEAM 2:<br />
o Memorial, East Central, Edison and<br />
Webster Feeder <strong>Elementary</strong> Sites<br />
o Magnet <strong>Elementary</strong> Sites<br />
SECONDARY TEAM<br />
MORNING SESSIONS COHORT ASSIGNMENTS<br />
Academy Central, Mark Twain, Burroughs,<br />
Emerson, Chouteau, Central JH/HS, Kendall-<br />
Whittier, Sequoyah, Rogers College High, Skelly,<br />
McArthur, Jones, Lindbergh, Bell, Hoover,<br />
Hamilton, Owen, McKinley, Hale HS, Hale JH<br />
Celia Clinton, Hawthorne, Jackson, Gilcrease,<br />
Greeley, Springdale, Whitman, <strong>Anderson</strong>, Penn,<br />
McLain JH/HS, Grissom, Salk, Carnegie, Grimes,<br />
Key, McClure, Marshall, Memorial HS, Memorial<br />
JH, ECDC Houston, ECDC Reed, ECDC Porter<br />
Kerr, Mitchell, Lewis & Clark, Columbus, Cooper,<br />
Disney, Peary, East Central HS, East Central JH,<br />
Eliot, Wright, Lanier, Lee, Patrick Henry, Edison<br />
Preparatory, Booker T. Washington, Carver,<br />
Thoreau, Eisenhower, Mayo, Zarrow, Monroe Dual<br />
Immersion, Monroe Demonstration<br />
Park, Robertson, Remington, Eugene Field,<br />
Webster JH, Webster HS,<br />
TLA/Virtual/Continuation, TRAICE, <strong>Tulsa</strong> Met HS,<br />
<strong>Tulsa</strong> Met JH, Project Accept, Early College,<br />
Hospital Sites<br />
AFTERNOON SESSIONS COHORT ASSIGNMENTS<br />
Academy Central, Mark Twain, Burroughs,<br />
Emerson, Chouteau, Kendall-Whittier, Sequoyah,<br />
Skelly, McArthur, Jones, Lindbergh, Bell, Hoover,<br />
Hamilton, Owen, McKinley, Celia Clinton,<br />
Hawthorne, Jackson, Gilcrease, Greeley,<br />
Springdale, Whitman, <strong>Anderson</strong>, Penn, ECDC<br />
Houston, ECDC Reed, ECDC Porter<br />
Grissom, Salk, Carnegie, Grimes, Key, McClure,<br />
Marshall, Kerr, Mitchell, Lewis & Clark, Columbus,<br />
Cooper, Disney, Peary, Eliot, Wright, Lanier, Lee,<br />
Patrick Henry, Eisenhower, Mayo, Zarrow, Monroe<br />
Dual Immersion, Park, Robertson, Remington,<br />
Eugene Field<br />
All Secondary Sites<br />
*ESC and Fulton Personnel may follow Cohort 4 or select another cohort based on the schools with whom<br />
they work most closely.
TO:<br />
TPS Principals<br />
SUBJECT LINE: Value-Added Report Access and Resources<br />
DATE: 10/06/11<br />
Principals,<br />
Thank you for attending the training yesterday, designed to prepare you to share results with teachers on October 20. 1 In addition to<br />
viewing your 2010–2011 school-level value-added results, you should now be prepared to provide professional development on the<br />
topic of value-added to teachers, share school-level results with teachers and help teachers know how to respond to their own data.<br />
At the training, you received a wrist-band flash drive with the following materials:<br />
Principal Facilitation Guide<br />
Video Message from Dr. Ballard<br />
An e-learning series of videos, focused on value-added, with supporting PowerPoint files and PDFs with talking points, including the<br />
topics:<br />
• Introduction to Value-Added Measures<br />
• The Oak Tree Analogy<br />
• Interpreting Value-Added Reports<br />
Making Meaning Guides for both <strong>Elementary</strong>/Middle <strong>Schools</strong> and High <strong>Schools</strong><br />
Additional Materials, including:<br />
• An article, authored by Jim Mahoney, Executive Director, Battelle for Kids, focusing on multiple measures, entitled, Home<br />
Runs, RBIs and Batting Averages—How Today’s Educators Measure Up.<br />
• A whitepaper, exploring the challenges and opportunities of defining “great” teaching, entitled, Why Are Some Teachers<br />
More Effective Than Others?<br />
Additional Value-Added Resources, including:<br />
• Report Access Instructions*<br />
• Reflective Questions<br />
• Exit Ticket<br />
• Frequently Asked Questions<br />
• A Value-Added Overview<br />
In addition to yesterday’s training, and ongoing discussion of value-added analysis in the district, this e-toolkit will support your<br />
discussions with teachers later this month. If you have additional questions about your reports, or how to access information, please<br />
visit the TPS Student Progress Portal (www.battelleforkids.org/<strong>Tulsa</strong>) or email valueadded@tulsaschools.org.<br />
Sincerely,<br />
The Office of Teacher and Leader Effectiveness<br />
*Report Access Instructions are attached to this email and have been updated as of 10/06/11. Please disregard the file on the<br />
flash drive.<br />
1 As indicated in previous communications, schools in the McLain and Rogers feeder patterns will provide this value added training<br />
to their teachers in two staff meeting sessions in October (ex: 10/10 and 10/17; or 10/17 and 10/24)—dividing the training into two<br />
parts. If you are a principal of a school within the McLain and Rogers feeder pattern, please wait until the second session of your<br />
training to provide teachers with their school’s value added report, as all other schools in the District will be distributing school-level<br />
value added reports on the 20 th of October.
Hello Teachers,<br />
We want to make you aware of an important opportunity to learn more about how to read and<br />
use value-added reports.<br />
The Opportunity: An “open lab” for you to talk one-on-one with national experts from<br />
Battelle for Kids on how to interpret value-added data and how to use this data to<br />
improve your effectiveness in the classroom. You can talk privately or in groups about your<br />
data.<br />
When/Where:<br />
• Labs are open on February 15 and 16 from 3:30 p.m. to 6:30 p.m.<br />
• The sessions will run approximately one hour in length.<br />
• Sessions will begin at 3:30 p.m., 4:30 p.m. and 5:30 p.m.<br />
• These labs will be held at Fulton.<br />
What to Bring: Bring your school level or teacher-level reports as available. Access<br />
instructions are below.<br />
RSVP: While there is no requirement that you attend or that you RSVP, please email us with<br />
your date/time at valueadded@tulsaschools.org if you plan on attending.<br />
Accessing Reports:<br />
• School-Level Reports: School-level value added reports for 2009–2010 and 2010–<br />
2011 are available at the <strong>Tulsa</strong> Student Progress Portal<br />
at http://valueadded.tulsaschools.org.<br />
• Teacher-Level Reports: As indicated to you in October, teachers of state-tested<br />
grades and subjects, beginning with grade 4, may have individual, teacher-level valueadded<br />
reports. Teacher-level reports were produced for these elementary and middle<br />
school teachers for the 2009–2010 and 2010–2011 school years. Teacher-level reports<br />
were produced with regard to high school teachers only for the 2010–2011 school year.<br />
Teacher-level reports are confidential and not available to the public. Principals will<br />
have access to their teachers’ value-added reports no earlier than May 1, 2012. Feel<br />
free to bring your report to the open lab. You will have opportunities to discuss your<br />
results, in private, with value-added experts.<br />
To access your teacher-level value-added report, visit the <strong>Tulsa</strong> Student Progress<br />
Portal at http://valueadded.tulsaschools.org. Click on the "My Portal" tab and follow the<br />
instructions. Log in using your TPS e-mail address and Portal password. If this is your<br />
first time logging in to the <strong>Tulsa</strong> Student Progress Portal, establish a new password by<br />
clicking “Forgot Password.” After logging in, access your teacher report by clicking on<br />
“View My Value-Added Teacher Report.” You will then see a page with your<br />
documents. Click “View Document” to download your PDF report.<br />
http://valueadded.tulsaschools.org/
Additional Background on Value-Added Analysis at <strong>Tulsa</strong> <strong>Public</strong> <strong>Schools</strong><br />
In October of 2011, the District rolled out school-level and teacher-level value-added reports<br />
for the 2009–2010 and 2010–2011 school years. Your principals provided your sites with<br />
initial training on the topic. We are providing you with this open lab training in response to your<br />
feedback.<br />
Value-added analysis is a statistical, quantitative “student growth” measure that isolates the<br />
impact our schools and teachers have on student achievement from year to year. Value-added<br />
analysis is different from traditional student achievement measures because it measures<br />
student growth over time and controls for factors that are beyond educators’ control. In<br />
particular, TPS’ value-added approach takes into account prior achievement scores,<br />
attendance history, mobility, English Language Learner status, special education status, low<br />
income status, grade level, grade retention, gender, and race/ethnicity.<br />
Value-added data is just ONE component of the overall Teacher Leader Effectiveness initiative<br />
that is focused on making sure we have a great teacher in every classroom, a great leader in<br />
every building, and a great employee in every position. It allows us to identify what practices<br />
are accelerating learning and which need improvement.<br />
At this time, the data collected will be used only for informational purposes to analyze and<br />
improve classroom instruction and is not being used as a component of a teacher’s evaluation.<br />
Beginning with the 2013–2014 school year, however, Oklahoma schools must comply with the<br />
requirements of Oklahoma Senate Bill 2033 that mandate the use of this student growth data<br />
as one component of evaluating teachers’ effectiveness.<br />
Questions about Value Added?<br />
• Any questions regarding value added may now be sent to the following email<br />
address: valueadded@tulsaschools.org.<br />
• Updated FAQs will be available in the next few days! We have added to and updated<br />
them extensively in response to your feedback and questions. The updated FAQs<br />
will be available at http://valueadded.tulsaschools.org.<br />
© 2012, <strong>Tulsa</strong> <strong>Public</strong> <strong>Schools</strong> 2
ESEA Waiver<br />
District Capacity Determination for School Improvement<br />
The following document is responsive to the OSDE’s request for information regarding:<br />
Human resource policies that effectively recruit, hire, induct, and retain effective school personnel<br />
and the release of ineffective personnel in a timely manner.<br />
1
Teacher and Principal Recruitment, Induction, Retention and Release<br />
<strong>Tulsa</strong> <strong>Public</strong> <strong>Schools</strong> has many noteworthy policies and strategies regarding the effective<br />
recruitment, hiring, induction and retention of effective school personnel and the release of ineffective<br />
personnel in a timely manner. As noted below, many of these initiatives began in the 2010 to 2011<br />
timeframe and are already bearing fruit.<br />
I. Recruitment of Teachers<br />
The District uses Teach For America and its Oklahoma higher education partners to recruit<br />
effective teachers. It uses the Teacher Insight screening tool from Gallup to identify the best candidates<br />
for the District’s new workforce and provides financial incentives to assist with the recruitment of hard<br />
to staff subjects.<br />
Teach for America: Teach For America (TFA) is the primary conduit for the District’s new<br />
teaching staff. TFA recruits the country's most promising future leaders in the movement to eliminate<br />
educational inequity and brings them to <strong>Tulsa</strong> to help meet the greatest educational needs of the city.<br />
TFA identifies and inspires thousands of potential corps members on college campuses and from<br />
multiple career sectors. It has ambitious goals for the growth and diversity of its corps along racial,<br />
ethnic, and socioeconomic lines. TFA works with the District’s Human Capital team to place corps<br />
members in the District’s most needy schools in terms of achievement and poverty levels. TFA is able to<br />
recruit an impressive applicant pool because of its prestige and the financial aid it provides its corps<br />
members to help bridge the gap between college and the beginning of the school year.<br />
Beginning with the 2009-2010 school year, TFA has provided the District with an impressive<br />
number of effective teachers. In 2009-2010, TFA provided the District with 67 corps members. In 2010-<br />
2011, the TFA corps class was 53. The class of 2011-2012 corps members is 74, and a similar size class of<br />
corps members is expected 2012-2013.<br />
The organization’s assistance in improving student achievement over the last two years is<br />
significant. For example, even though the corps members were novice teachers, they out-performed<br />
the District’s average value added scores for Math (overall , as well as 7 th and 8 th grade), Biology, Algebra<br />
I, and English III. 1<br />
1<br />
Only 2011 test data was available for this analysis. Additional analysis is underway to compare TFA members’<br />
value-added scores with their non-TFA counterparts (teachers with two or fewer years of experience). Initial data<br />
2
Higher Education Partnerships, including Urban Education Pipelines: The District recruits from<br />
Oklahoma institutes of higher education and uses two specific strategies for recruiting teachers that will<br />
be effective in an urban setting like <strong>Tulsa</strong> <strong>Public</strong> <strong>Schools</strong>.<br />
Like most school districts in the state, the District uses its student-teaching programs to identify<br />
potential teacher candidates. The District works with Oklahoma State University, Northeastern State<br />
University, Langston University, Oral Roberts University and others to provide a hands-on experience for<br />
university students completing their teacher preparation programs. Through the student-teaching<br />
process, school principals and District personnel become acquainted with the strengths and needs of its<br />
future teaching force.<br />
Since the 2010-2011 school year, however, the District has worked with its partners to develop a<br />
more rigorous and effective recruitment program –its Urban Education Pipeline program. This program<br />
works in tandem with the specialty teaching preparation programs now underway at Oklahoma State<br />
University, Northeastern State University and the University of <strong>Tulsa</strong>.<br />
The urban educator pipeline programs of these universities establish a collaborative preparation<br />
model for teacher candidates who wish to teach in an urban, high need school district and to create a<br />
reliable pipeline of well-prepared educators for the school district. Program participants complete a<br />
higher number of hours in their clinical practice than the standard teacher preparation programs. Their<br />
field experience is with effective and experienced teachers in urban, high-needs schools. They also<br />
participate in additional professional development delivered by TPS addressing important topics on<br />
specific to high-poverty, high-minority schools.<br />
TPS’s Urban Educator Pipeline. The District has developed a Steering Committee for its<br />
Urban Educator Pipeline to improve and develop new urban teacher preparation programs<br />
partnerships (“urban teacher pipeline programs”) with Oklahoma universities and teacher<br />
development programs. Working in collaboration with institutes of higher education<br />
(Oklahoma State University, Northeastern State University and the University of <strong>Tulsa</strong>), Teach<br />
for America and the <strong>Tulsa</strong> Classroom Teachers Association, the Steering Committee is making<br />
recommendations regarding the following issues:<br />
• Strategies to encourage the recruitment of the highest quality candidates in the<br />
District’s urban teacher pipeline programs;<br />
appear to show that the TFA corps members’ performance outpaces the growth generated by teachers with similar<br />
years of experience.<br />
3
• Program and participation criteria that will ensure the quality of student participants<br />
and the pipeline programs generally;<br />
• Necessary improvements to the clinical and mentoring experiences of the District’s<br />
urban teacher pipeline programs; and<br />
• Processes to facilitate information sharing, feedback and continuous improvement of<br />
the urban teacher pipeline programs.<br />
Gallup Insight. The District believes that teachers are critical to student success, and it is<br />
committed to placing teachers in positions where they will be most successful with students. As such, it<br />
now requires the web-based assessment designed by Gallup called the “Teacher Insight Assessment” as<br />
a component of its teacher application and uses it as a screening tool.<br />
The Teacher Insight assessment was developed by national experts who studied the job<br />
performance of teachers and the qualities they possessed. Teacher Insight was developed on the basis<br />
of over 40 years of research focused on what characteristics make a teacher successful. Current<br />
research also informs improvements of the screening tool. Namely, Gallup used value-added scores to<br />
identify the talents of teachers whose students demonstrated greater gains. As a result, Teacher Insight<br />
is helping <strong>Tulsa</strong> <strong>Public</strong> <strong>Schools</strong> identify teacher applicants whose students will achieve higher levels of<br />
success in the classroom.<br />
By evaluating applicants’ online survey results, Teacher Insight assesses the talents that result in<br />
teacher excellence that are difficult or nearly impossible to teach. Results are based on the applicant's<br />
responses and include a score that is predictive of an applicant's potential for teaching success based on<br />
his or her talent. The assessment requires approximately 30 minutes to complete.<br />
The Teacher Insight Index is a score that ranges from 0 to 100. The District’s policy is to<br />
recommend only those applicants that score a 72 or better to principals to interview for their possible<br />
openings. In addition to providing a total score that is predictive of an applicant's potential for<br />
producing student growth, the assessment provides other very valuable information. The Talent<br />
Dimension Report contains information regarding the applicant's talents and relative strengths which<br />
help the district make optimal placement decisions.<br />
Stipends for Hard to Staff Subjects. To recruit teachers of hard to staff subjects, the District<br />
provides a $2,000 stipend to teachers with the following certifications:<br />
4
• Special education: special education certification plus one or more core secondary subjects,<br />
elementary education or early childhood education<br />
• Math: Algebra, Calculus, Geometry, Math Analysis, Advanced Math, Intermediate Math,<br />
Statistics, Trigonometry<br />
• Biological Science, Anatomy/Physiology, Biology, Botany, Zoology, Chemistry, Earth Science,<br />
Physical Science, Physics<br />
II.<br />
Induction of Teachers<br />
The District’s induction programs are the TFA induction programs and the New Teacher Center.<br />
Teach for America: Before they start teaching, each new TFA corps member attends an<br />
intensive five-week summer training institute—a working summer school—in one of nine locations<br />
across the United States. (Beginning in the summer of 2012, <strong>Tulsa</strong> will host one of TFA’s summer<br />
training institutes, which is a prized accomplishment.) The institute’s training is designed to help corps<br />
members learn essential teaching frameworks, curricula and lesson planning skills. Corps members work<br />
with experienced teachers who observe and coach them to improve their skills quickly throughout the<br />
summer. By the end of institute, corps members have developed the knowledge, skills, and mindsets<br />
needed to be effective beginning teachers, made an immediate impact on students, and built<br />
relationships that will support them throughout their corps experience.<br />
At the training, corps members teach summer school for four of five weeks and help their<br />
students master critical content for the fall. Corps members teach summer school students for an<br />
average two hours each day and are observed by experienced teachers. For one of the two hours, they<br />
lead an entire class to master academic content, and build their own skills in delivering lessons and<br />
managing a classroom. For the other hour, most corps members work with four to five students to build<br />
skills in math and reading and gain experience in leading group work.<br />
TFA instructional coaches observe each corps member several times a week. They provide<br />
written feedback and discuss areas for development, working with corps members to create concrete<br />
plans to increase student learning and develop teaching knowledge and skills. Veteran district teachers<br />
partner with TFA coaches to provide regular feedback throughout the summer. Corps members meet in<br />
small groups that provide a supportive yet challenging space to practice teaching new lessons, react to<br />
classroom management dilemmas, discuss feedback they’ve received, and analyze student progress.<br />
5
Corps members leave these small group sessions with clear direction they can use to improve their<br />
teaching. Corps members receive extensive lesson planning instruction from Teach For America<br />
instructional coaches. They internalize student learning objectives for the coming week, create<br />
assessments to evaluate student progress, select the right teaching methods to meet their objectives,<br />
and develop their plans in great detail.<br />
Corps members study the fundamentals of teaching and practice teaching techniques to prepare<br />
them for all elements of classroom instruction. Sessions focus on Teaching As Leadership; Instructional<br />
Planning and Delivery; Classroom Management and Culture; Diversity, Community, and Achievement;<br />
and Literacy Development. This training introduces corps members to the principles and specific actions<br />
that successful teachers take to lead their students to success. It presents a goal-oriented, standardsbased<br />
approach to teaching and teaches corps members to diagnose and assess students, plan lessons,<br />
and deliver lessons effectively. TFA corps members are taught how to create and maintain a culture of<br />
achievement in the classroom. They develop the mindsets and skills needed to build relationships and<br />
work effectively with the diverse students, families, educators and others in the communities where<br />
they teach. Plus, they learn how to teach literacy skills to students at all performance levels and across<br />
grade levels and content areas.<br />
Teach For America provides room and board for corps members in local university housing<br />
during institute. Special accommodations are available for corps members with partners and families.<br />
While institute is a rigorous and intensive experience, corps members have free time during weekends<br />
and typically take advantage of opportunities to socialize and explore their institute city.<br />
The New Teacher Project. Beginning this school year (2011-2012), <strong>Tulsa</strong> uses the renowned<br />
<strong>Tulsa</strong> New Teacher Induction program for all new teachers of core subjects who are not TFA corps<br />
members. The New Teacher Project, made possible through the District’s partnership with The New<br />
Teacher Center, focuses on strengthening the practice of beginning first and second year teachers. The<br />
New Teacher Center induction model is nationally recognized in the United States for its promotion of<br />
new educator development and its impact on teacher retention and student learning.<br />
The New Teacher Project’ Induction program encompasses an orientation to the workplace,<br />
socialization, mentoring, and guidance through beginning teacher practice through the use of mentor<br />
teachers. The District’s support is based on a comprehensive, high-quality induction consisting of<br />
several key elements:<br />
• 2-year program<br />
6
• subject-area pairing of mentors and beginning educators<br />
• rigorous mentor selection and mentor training from the New Teacher Center<br />
• sufficient time for mentors to collaborate with and observe new educators<br />
• formative assessment structures and tools that assists beginning educators to advance<br />
along a continuum (rubric) of professional growth and an individual learning plan.<br />
The <strong>Tulsa</strong> New Teacher Induction program is currently engaged with 128 first and second year<br />
teachers. Eight District mentor coaches have completed their third of four Developmental Academy<br />
trainings. The four academies (held each year) allow our veteran teacher mentors to learn and refine<br />
their mentoring skills, problem solving issues of mentoring, stretch their own levels of classroom<br />
practice, and develop their leadership capacity.<br />
III.<br />
Retention of Teachers<br />
Teach for America. TPS recognizes that Teach For America corps members are extremely strong<br />
teachers and are eager to bring in more each year. In a recent survey, roughly 90% of TPS principals<br />
reported that TFA corps members make a positive difference in their school. In addition, 90% of<br />
principals rated corps members as effective as teachers with more experience in terms of student<br />
achievement.<br />
In 2009, the first year of partnership between TPS and TFA, 70 corps members were placed in<br />
TPS schools. Of those 70, nearly 30 corps members remain in a TPS classroom today, and 54 corps<br />
members (72%) remain in education as a whole, even after their initial two-year commitment. This is<br />
well above the national average of 66%. The success has been a product of specific strategies put in<br />
place in the region. TFA has worked with university partners and TPS to create a fast track to school<br />
leadership, connected corps members with leaders of the community to talk through long-term career<br />
interests, and held meetings with principals to stress their importance in retaining corps members. With<br />
new corps members coming in each year, and continued success in retention, TFA will play an integral<br />
role in successful student achievement and future leaders in the district.<br />
Annual Retention Stipends for Occupational Therapists. Because of the District’s significant<br />
need to retain its occupational therapists, the District currently provides these personnel a $5,000<br />
annual retention stipend. This policy has been in effect since 2007-2008.<br />
7
IV.<br />
Recruitment, Induction and Retention of School Leaders<br />
While teacher quality is the single most influential factor in raising student achievement, principal<br />
effectiveness is nearly as important in improving educational outcomes for children. A 2004 report<br />
funded by the Wallace foundation revealed that while teachers account for 33% of a school’s impact on<br />
student achievement, principals account for 25% 2. Indeed, principal leadership is at the cornerstone of<br />
continuous teacher development, improved teacher practices and teacher job retention.<br />
There is growing consensus that process and standards by which traditional principal preparation<br />
programs screen, select, and graduate candidates often do not adequately equip principals for the<br />
complex role of effective instructional leader. Many preparation programs rely upon educational<br />
background credentials for admission and do not consider key individual qualities such as a fundamental<br />
belief in all children’s ability to learn, analytical and results-oriented approach, adaptability and change<br />
management 3. Substantial research supports the further development of principal candidates through<br />
effective preparation programs that offer real-life experiences which allow them to practice and refine<br />
their skills as they learn what it takes to run a school successfully. 4.<br />
One of the core goals of the <strong>Tulsa</strong> <strong>Public</strong> <strong>Schools</strong>’ (TPS) strategic plan is focused on teacher and<br />
leader effectiveness, and the notion that effective leaders and classroom teachers have a profound<br />
effect on children’s lives. The TPS’ Teacher and Leader Effectiveness Initiative is focused on ensuring<br />
there is an effective teacher in every classroom and an effective leader in every building. However,<br />
similar to other urban school districts around the country, TPS is challenged by the shortage of a<br />
qualified talent pool to fill its principal vacancies every year. This immediate need has led the district to<br />
seek ways to expand the leadership capacity of future principals, novice administrators and sitting<br />
principals. The demands of today’s schools requires principals, in particular, to be skillful in studentbased<br />
learning and teaching, a school-wide achievement culture, and personal leadership.<br />
2 Leithwood, K., Louis, K. S., <strong>Anderson</strong>, S., and Wahlstrom, K. (2004). Review of Research: How Leadership nfluences<br />
Student Learning. Wallace Foundation<br />
3 Educational Research Service. (2000). The Principal, Keystone of a High-Achieving School: Attracting and Keeping<br />
the Leaders we Need. Arlington, VA.<br />
4 Leithwood, K., Louis, K. S., <strong>Anderson</strong>, S., and Wahlstrom, K. (2004). Review of Research: How Leadership<br />
Influences Student Learning. Wallace Foundation<br />
8
The TPS Leadership Development program builds on the framework of research based programs and<br />
best-practices that have proven to prepare leaders who can have a dramatic impact on student<br />
achievement and closing the achievement gap.<br />
The proposed Leadership Development program, focusing on the recruitment and induction of<br />
school principals includes the following components:<br />
• Assistant principal Internships<br />
• Induction and support for novice principals<br />
• Emerging Leadership Academy.<br />
• Principal Leadership Conference Leadership development program<br />
• Market-Based Compensation<br />
Assistant Principal Internship Program Pilot. Modeled after the New Leaders/New <strong>Schools</strong><br />
Aspiring Principals program, this pilot will inform the development of a comprehensive two-year<br />
internship program for aspiring principals/assistant principals. A small group of first-year and second<br />
year assistant principals are currently receiving intensive and continuous professional development<br />
focused on the skills, strategies and practices s correlated with effective school leadership. Key areas<br />
include: organizational and school management, instructional leadership, leadership skills, etc.<br />
Components of this program include:<br />
• Monthly training sessions provided by TPS in conjunction with the University of Oklahoma<br />
Professional Development and Leadership Academy (OUPDLA) focused on the domains and<br />
indicators of the principal evaluation system.<br />
• School-based projects that allow participants to demonstrate and further develop their skill level<br />
at designing, implementing and evaluating strategies that address student needs.<br />
• Quarterly development team meetings where participants have the opportunity to present<br />
relevant documentation of professional growth in a particular area.<br />
• On the job-coaching provided by a principal trainer and a mentor (Planned for 2012-2013)<br />
Participants are selected based on the following criteria:<br />
• Track record of success in challenging educational programs as identified by student<br />
achievement, value-added data, etc.<br />
• Leadership skills<br />
• Level of energy, determination and perseverance to act as an agent of change in a demanding<br />
organization<br />
• Analytical, problem-solving and project management skills<br />
• Oral and written communication skills<br />
9
• Passion for improving urban public education and a long-term commitment to the K-12<br />
education sector<br />
Expected Outcomes And Metrics For Evaluation: As part of the district’s performance management<br />
initiative, the office of Teacher and Leader Effectiveness will track the following indicators and establish<br />
benchmarks to inform the further development of the internship program:<br />
• Participants’ annual performance evaluation ratings: The expectation is that program<br />
participants will receive at minimum a highly effective rating (4) in their Leader Effectiveness<br />
evaluation.<br />
• Successful implementation of school-based projects: Projects implemented by participants will<br />
result in measurable gains in student achievement.<br />
• Program Design Delivery: Completed design for a principal internship for full implementation in<br />
2012-2013 that is based on best practices, current research and district’s overall goals for its<br />
principal leadership pipeline program.<br />
• Participant satisfaction: Survey feedback from interns and their principals about quality of<br />
monthly trainings—90% or more report training was highly relevant to developing their skills as<br />
instructional leaders.<br />
Induction and Support For Novice Principals Program Pilot. This program provides induction<br />
support and development for first, second and third-year administrators. Similar to the Assistant<br />
Principal Internship component, this pilot will inform the design and implementation of a<br />
comprehensive induction program. The components of the program include:<br />
• A two-day induction session focused on essential information needed by new principals as they<br />
begin their new assignment.<br />
• Monthly training sessions designed by TPS and consulting experts (New Leaders/New <strong>Schools</strong>)<br />
and provided by the University of Oklahoma Professional Development and Leadership<br />
Academy. The sessions will focus on:<br />
o Instructional leadership and successful school management (as defined by the Leader<br />
Evaluation rubric).<br />
o The shift from operations/management to data driven analysis of student achievement;<br />
o The alignment of goals, supports and supervision and evaluation of teachers<br />
• Ongoing coaching provided by a mentor and a member of the TPS executive team (Planned for<br />
2012-2013).<br />
Expected Outcomes And Metrics For Evaluation: As part of the district’s performance<br />
management initiative, the office of Teacher and Leader Effectiveness will track the following indicators<br />
and establish benchmarks to inform the further development of the induction program:<br />
• Participants’ annual performance evaluation ratings: Program participants will receive at<br />
minimum a highly effective rating (4) in their Leader Effectiveness evaluation.<br />
10
• Participants demonstrated improvement on particular indicators identified as areas of growth in<br />
their prior year Leader Effectiveness evaluation.<br />
• Program Design Delivery: Completed design for a principal induction program for full<br />
implementation in 2011-2012 that is based on best practices, current research and District’s<br />
overall goals for its principal leadership pipeline program.<br />
• Participant satisfaction: Survey feedback from novice principals quality of monthly trainings—<br />
90% or more report training was highly relevant to developing their skills as instructional<br />
leaders.<br />
Emerging Leadership Academy. This academy, rolling out in 2012-2013 and focusing primarily<br />
on developing the pipeline of elementary-level principals, will provide teacher-leaders with a rich<br />
experience to explore the role of the principalship and to assist them in determining future career goals.<br />
Participants will learn leadership skills through hands-on professional development, problem-based<br />
learning and cohort study group opportunities to better understand the function of being a successful<br />
principal in <strong>Tulsa</strong> <strong>Public</strong> <strong>Schools</strong>. The foundation of the Academy is based on the District’s six domains<br />
of Teacher Leader Effectiveness; Organization and Management, Instructional Support, Professional<br />
Growth and Continuous Improvement, Interpersonal Skills, and Leadership. Each domain study will<br />
provide the participants an opportunity to apply District expectations, to engage with recognized<br />
principal talent and identify protocols to support future success.<br />
Principal Leadership Conference Development Program . To recruit, induct and retain new and<br />
existing school leaders, this program provides current principals, assistant principals and staff<br />
development teachers with relevant support to develop and refine their skills in five key areas aligned<br />
with the district’s initiatives and core goals: Data analysis and value added, curriculum implementation<br />
based on Common Core standards, teacher/leadership effectiveness, cultural competence and<br />
professional learning communities.<br />
Professional development opportunities will be delivered via bimonthly leadership conferences<br />
that will be content rich and allow for collaboration and alignment between school levels and feeder<br />
patterns.<br />
Expected Outcomes: By the end of the year, participants will have:<br />
1. Data Analysis And Value Added:<br />
• Identified the key data points that will change student achievement and progress through value<br />
added and other measures.<br />
• Learned how to use data to take action for improvement.<br />
11
• Utilized multiple data sources to build a data-driven culture in their schools where evidence is<br />
being used to make all decisions.<br />
• Implemented a system to track school-based data which will lead to increased accountability<br />
2. Curriculum Implementation Based On Common Core Standards:<br />
• Learned to supervise the new curriculum for each grade level in order to observe and evaluate<br />
implementation.<br />
• Observed for implementation and worked with colleagues to reflect on consistency and<br />
pervasive implementation of new standards across the district.<br />
• Provided feedback to the curriculum office on how to improve the curriculum.<br />
• Practiced providing quality feedback to teachers about curriculum implementation.<br />
3. Teacher/Leadership Effectiveness:<br />
• Analyzed emerging trends from observations and evaluations from the previous year and plan<br />
appropriate interventions that lead to improvement.<br />
• Utilized best practices when observing and evaluating teachers with the goal of improving<br />
teaching strategies.<br />
• Continue to improve<br />
4. Cultural Competence:<br />
• Learned more about what it means to lead a school in an urban school district and acquired a<br />
shared understanding of what cultural competence means in TPS.<br />
• Begun a long-range study of how race, poverty, and culture intersect with student achievement.<br />
• Implemented specific school-wide strategies that build high expectations for all students.<br />
5. Professional Learning Communities:<br />
• Learned systems, structures, processes, and practices to utilize professional learning<br />
communities in their schools.<br />
• Worked in professional learning communities with other principals to learn promising practices<br />
and share implementation challenges and results.<br />
Market-Based Compensation. In an effort to ensure the district offers fair and competitive<br />
compensation to all employees and improve recruiting and retention rates, <strong>Tulsa</strong> <strong>Public</strong> <strong>Schools</strong><br />
commissioned Battelle for Kids to conduct a salary study that includes school principals and assistant<br />
principals. As part of the study, jobs were evaluated based on updated job descriptions that reflect clear<br />
job analysis factors. A large sample of jobs were compared to salary data from over 35 external<br />
organizations of similar structure and size for a comprehensive market analysis. As the study nears<br />
completion this spring, preliminary data reveals the district's job evaluation points are highly correlated<br />
12
with market pay resulting in a competitive and fair pay structure. Key school leadership positions such as<br />
principals at every level, were a special focus of the compensation study as the district is committed to<br />
remain competitive with market pay and enhance its ability to attract and retain the most highly<br />
qualified candidates. <strong>Tulsa</strong> <strong>Public</strong> <strong>Schools</strong> plans to review compensation practices on our regular basis<br />
to ensure internal and external market equity.<br />
V. Release of Ineffective Teachers and Principals in a Timely Manner<br />
Teacher/Leader Effectiveness System and Related Supports. The District’s successful evaluation<br />
system (the TLE Observation and Evaluation System) provides teachers and principals with a<br />
performance ranking on a scale from 1-5. The TLE evaluation system provides teachers and principals<br />
with a five-tier support system for improvement, but when they fail to improve, the District’s<br />
performance-based exit procedures go into effect and provide for their timely release from the District.<br />
In the months following the district-wide implementation of the TLE evaluation system in 2010-<br />
2011, the Human Capital personnel successfully exited 57 teachers and 12 principals from the District for<br />
poor performance through recommendations for non-renewal and termination proceedings. These<br />
exits targeted teachers and principals whose performance rankings were 1 or 2 (Ineffective or Needs<br />
Improvement). At least 7 principals were demoted (removed from their principalship) but not exited<br />
from the District. Due process hearings, as applicable, were held throughout the summer of 2011 and<br />
all recommendations for non-renewal and termination were adopted by the Board. Many other<br />
teachers were counseled out of the District for performance reasons prior to this time.<br />
The District is aggressive in seeking performance-based exits, but it also recognizes that<br />
teachers/principals must be supported and provided a chance to improve prior to any removal from the<br />
District. As a precursor to the District’s support/release program , over 130 Personal Development Plans<br />
(plans for improvement) were issued for teachers and 31 for principals. At least 29 teachers were also<br />
placed in an intensive remediation-based mentoring program lasting 8 weeks.<br />
It is notable that prior to the implementation of the TLE Evaluation System in 2010-2011, there<br />
had been no performance-based exiting of teachers or principals and a very small number of personal<br />
development plans. A significant support for this occurrence was the complete reorganization of the<br />
District’s entire human capital department and the addition of Human Capital Partners. The human<br />
resource function at the District has been completely restructured, with a new approach to recruitment,<br />
13
etention, and development. The addition of the Human Capital Partner position has provided a cadre<br />
of HC liaisons to quickly respond to the staffing needs of every building principal, as well as support the<br />
implementation of the new evaluation system and the necessary exiting procedures.<br />
Performance-Based Reductions in Force. Another significant achievement that will support the<br />
continued improvements in the District’s Human Capital initiatives is the successful negotiation of<br />
changes to its agreement with the <strong>Tulsa</strong> Classroom Teachers Association that has eliminated the<br />
traditional “first-in-last-out” reduction in force policy. In short, teachers will no longer be released as a<br />
reduction in force due to their lack of seniority. Instead, a teacher’s performance on the TLE<br />
Observation and Evaluation system determines which teacher is laid off in the event of a reduction of<br />
force (RIF).<br />
Due to statutory constraints, the full effect of this policy will not be in place until July 1, 2012.<br />
Until that time, there will be performance-based “bumping” only within a teacher’s classification<br />
(probationary or career). Beginning July 1, 2012, however, the District’s negotiated agreement with<br />
TCTA provides for performance-based RIFs, not tenure-based RIFs. This remarkable policy change will<br />
allow principals to retain their most effective teachers in the event of a RIF, regardless of their years of<br />
experience at the District.<br />
Principals’ Mid-Year Reviews. As explained in more detail in other sections of this response to<br />
the State’s request for information regarding the District’s capacity for school improvement, the<br />
individual mid-year reviews conducted between District leaders and each school’s principal allow for<br />
timely analysis and response to student-focused data—creating a performance-based culture in which<br />
the performance and placement of principals are under constant review.<br />
Among other items, District leaders require that principals present analysis and plans regarding<br />
the following points:<br />
1. Data related to achievement and Career and College Readiness (“CACR”)<br />
• End of Instruction data<br />
• Value Added (school level)<br />
• SRI data (proficient / advanced analysis for OCCT – and for Common Core)<br />
• Explore / PLAN (percentages on track for “CACR”) (3 year trend)<br />
• ACT (percentage on track for CACR – 3 year trend)<br />
• ACE (number of students not meeting ACE in each area)<br />
14
• 11 Steps to CACR data (relevant to grade level)<br />
• Read 180 implementation<br />
2. Strategies that have been implemented to meet the needs of students who are not on<br />
pace for CACR and / or EOI success, including re-grouping of students at semester for intensive<br />
intervention.<br />
3. Communication of meeting AYP and understanding the process (as well as the data) as<br />
a priority to the building staff.<br />
4. Evidence of and participation in the Ramp Up/Navigator, AVID, TAA.<br />
5. Explore and PLAN longitudinal data (Evidence of presentation to staff)<br />
6. TLE progress within the building, including timeline for completion of all evaluations by<br />
monthly progress charts. Staff highlights and concerns.<br />
7. ACE and Title expenditures.<br />
8. School discipline data analysis...including strategies for reduction of suspension.<br />
9. Plan for Testing - including test coordinator training and training of faculty. Timeline for<br />
spring enrollment<br />
15
ESEA Waiver<br />
District Capacity Determination for School Improvement<br />
The following document is responsive, in part, to the OSDE’s request for information regarding:<br />
Information technology supports aligned with district/school academic goals.<br />
Throughout the District’s response to the OSDE, there is extensive reference to the District’s<br />
Strategic Plan and its value-added reporting initiative—a strategy within the District’s goal of teacher<br />
and leader effectiveness. The value-added initiative is supported by impressive information technology<br />
tools, including a Student Progress Portal with entire informational and training libraries as well as<br />
school-level reporting. The strategic plan is also located on this portal.<br />
Select screen shots , including highlights regarding the system’s value-added supports, are<br />
included below. The public at large has access to most of the information on this site: TPS Student<br />
Progress Portal or http://portal.battelleforkids.org/tulsa/Home.html?sflang=en .
TPS Student Progress Portal<br />
Screen Shots and Sitemap
TPS Student Progress Portal<br />
Screen Shots and Sitemap
TPS Student Progress Portal<br />
Screen Shots and Sitemap
TPS Student Progress Portal<br />
Screen Shots and Sitemap
ESEA Waiver<br />
District Capacity Determination for School Improvement<br />
The following document is responsive, in part, to the OSDE’s request for information regarding:<br />
Details of how performance of a current principal or a new principal (with a proven track record for<br />
turning around schools) will be reviewed for hiring, retention, or dismissal.<br />
1
How Performance is Reviewed for Hiring, Retention, or Dismissal.<br />
Assessing Performance<br />
As noted in the District’s response within the Organizational Supports section, the District’s<br />
successful evaluation system (the TLE Observation and Evaluation System) provides teachers and<br />
principals with a performance ranking on a scale from 1-5. The TLE evaluation system provides teachers<br />
and principals with a multi-tier support system for improvement, but when they fail to improve, the<br />
District’s performance-based exit procedures go into effect and provide for their timely release from the<br />
District. In the months following the district-wide implementation of the TLE evaluation system in 2010-<br />
2011, the Human Capital personnel successfully exited 12 principals from the District for poor<br />
performance through recommendations for non-renewal and termination proceedings. These exits<br />
targeted principals whose performance rankings were 1 or 2 (Ineffective or Needs Improvement). At<br />
least 7 principals were demoted (removed from their principalship) but not exited from the District.<br />
Due process hearings, as applicable, were held throughout the summer of 2011 and all<br />
recommendations for non-renewal and termination were adopted by the Board. Many other teachers<br />
were counseled out of the District for performance reasons prior to this time.<br />
The District is aggressive in seeking performance-based exits, but it also recognizes that<br />
principals must be supported and provided a chance to improve prior to any removal from the District.<br />
As a precursor to the District’s support/release program , over 30 Personal Development Plans (plans for<br />
improvement) were issued for principals in 2010.<br />
It is notable that prior to the implementation of the TLE Evaluation System in 2010-2011, there<br />
had been no performance-based exiting of principals and a very small number of personal development<br />
plans. A significant support for this occurrence was the complete reorganization of the District’s entire<br />
human capital department and the addition of Human Capital Partners. The human resource function at<br />
the District has been completely restructured, with a new approach to recruitment, retention, and<br />
development.<br />
Principals’ Performance Rubric. The criteria for assessing principals’ performance ranking are<br />
found at the end of this document. The rubric and its weights instructional leadership and teacher<br />
support. Like the evaluation for teachers, their evaluation process is aligned with Senate Bill 2033.<br />
Principals and Vice Principals are evaluated by the associate superintendents using the rubric and are<br />
rated on a scale from 1 to 5.<br />
2
In general, Principals and Vice Principals are evaluated once a year; however, a Principal or Vice<br />
Principal with less than three years in his or her position is evaluated twice a year. Their Evaluation<br />
Form is guided by a performance rubric addressing:<br />
• Organizational and School Management, including retention and development of<br />
effective teachers and dismissal of ineffective teachers,<br />
• Instructional Leadership,<br />
• Professional Growth and Responsibility,<br />
• Interpersonal Skills,<br />
• Leadership Skills, and<br />
• Stakeholder Perceptions.<br />
Principals’ Mid-Year Reviews. As explained in more detail in other sections of this response to<br />
the State’s request for information regarding the District’s capacity for school improvement, the<br />
individual mid-year reviews conducted between District leaders and each school’s principal allow for<br />
timely analysis and response to student-focused data—creating a performance-based culture in which<br />
the performance and placement of principals are under constant review.<br />
Among other items, District leaders require that principals present analysis and plans regarding<br />
the following points:<br />
1. Data related to achievement and Career and College Readiness (“CACR”)<br />
• End of Instruction data<br />
• Value Added (school level)<br />
• SRI data (proficient / advanced analysis for OCCT – and for Common Core)<br />
• Explore / PLAN (percentages on track for “CACR”) (3 year trend)<br />
• ACT (percentage on track for CACR – 3 year trend)<br />
• ACE (number of students not meeting ACE in each area)<br />
• 11 Steps to CACR data (relevant to grade level)<br />
• Read 180 implementation<br />
3
2. Strategies that have been implemented to meet the needs of students who are not on<br />
pace for CACR and / or EOI success, including re-grouping of students at semester for intensive<br />
intervention.<br />
3. Communication of meeting AYP and understanding the process (as well as the data) as<br />
a priority to the building staff.<br />
4. Evidence of and participation in the Ramp Up/Navigator, AVID, TAA.<br />
5. Explore and PLAN longitudinal data (Evidence of presentation to staff)<br />
6. TLE progress within the building, including timeline for completion of all evaluations by<br />
monthly progress charts. Staff highlights and concerns.<br />
7. ACE and Title expenditures.<br />
8. School discipline data analysis...including strategies for reduction of suspension.<br />
9. Plan for Testing - including test coordinator training and training of faculty. Timeline for<br />
spring enrollment<br />
Use of Performance Data for Hiring, Retention of Dismissal<br />
With the information gained from the TLE Observation and Evaluation System and the<br />
principals’ Mid-Year Review, associate superintendents are armed with the relevant and rich data they<br />
need to make retention, placement decisions and dismissal decisions.<br />
As mentioned above, last year, 12 principals were exited for performance and at least 7<br />
principals were demoted (removed from their principalship) but not exited from the District. This level<br />
of scrutiny and fortitude will continue. For purposes of dismissal decisions, associate superintendents<br />
will review the information from the TLE system and focus their analysis on those principals who scored<br />
between a 1 and 2 on their evaluation and who failed to improve after receiving their PDPs. In addition<br />
to the information in the evaluation record, they will also review the evidence revealed in the Mid-Year<br />
Reviews. The same information will also be used for purposes of new placements (hires with a track<br />
record at TPS).<br />
4
ESEA Waiver<br />
District Capacity Determination for School Improvement<br />
The following document is responsive to the OSDE’s request for information regarding:<br />
Strategic, yet attainable, goals at the district and school level ( including goals for each<br />
subgroup).<br />
The following documents consist:<br />
• Introduction to the District’s plan for identifying and measuring its goals<br />
• TPS Strategic Plan;<br />
• Overview of the District’s Shared Accountability System<br />
• District’s Measures of Success<br />
• Departments’ Balanced Scorecards, as available (draft versions only)
Introduction to District’s plan for identifying targets, collecting performance<br />
data and then analyzing/using the measures of success.<br />
As part of the development of the district’s strategic plan, <strong>Tulsa</strong> <strong>Public</strong> <strong>Schools</strong> embarked upon a<br />
comprehensive performance management initiative to create a shared accountability system where<br />
every district employee, including non-instructional staff, is responsible for supporting student<br />
achievement. <strong>Tulsa</strong> <strong>Public</strong> School’s strategic plan outlined five core goals:<br />
• Student achievement,<br />
• Teacher and leader effectiveness<br />
• Performance-based culture<br />
• Financial Sustainability<br />
• Safe and Secure <strong>Schools</strong><br />
Under each of these core goals, strategic objectives were developed and used to derive at a set of<br />
district-level measures which are tracked and monitored. Similarly, the strategic objectives also provided<br />
a roadmap for departments to develop goals and metrics to quantify performance.<br />
District-level measures: Measures of Success<br />
The executive team identified key performance indicators under each of the district’s five core goals.<br />
These measures of success contain the most pertinent indicators the district will track to monitor its<br />
continuous improvement process. Following the development of the measures of success, departments<br />
began collecting baseline information and setting targets, a process that is currently underway and will<br />
be completed by the summer of 2012. Some of the data collected through the district’s accountability<br />
department and the student management system is currently housed in a data warehouse that<br />
produces daily reports for principals and administrators. The district plans on this data warehouse to be<br />
the repository for most of the district performance data once it is collected. The ongoing data collection<br />
process will be automated in early summer with the purchase of a longitudinal data system (LDS) which<br />
will link data from relevant existing systems to produce advanced analytical reports. The district expects<br />
the LDS system to greatly facilitate the process of collecting, reporting and analyzing leading and lagging<br />
indicators, and provide departments and schools with immediate feedback on progress against target<br />
goals.<br />
Department and individual-level measures: Balanced scorecards<br />
Concurrently, departments also began the process of developing balanced scorecards to align individual<br />
and team goals to the strategic core goals. Departments will use scorecards to transform the district’s
strategic plan from a high level document into their daily marching orders. Following a similar process,<br />
departments are currently identifying the measures to be tracked in order to effectively identify<br />
performance targets, process gaps and opportunities for continuous improvement. Department<br />
scorecards will be part of each individual’s performance evaluation, similar to how school-level results<br />
(achievement and growth) will be part of teachers and principals’ evaluations (see graph below).<br />
SHARED ACCOUNTABILITY SYSTEM
2010–2015<br />
Strategic Plan<br />
03.28.2011
FROM THE BOARD OF EDUCATION<br />
TULSA BOARD OF EDUCATION<br />
Mr. Gary Percefull–District 1<br />
Mrs. Oma Jean Copeland–District 2<br />
Dr. Lana Turner-Addison (President)–District 3<br />
Ms. Anna America–District 4<br />
Mr. Brian Hunt (Vice President)–District 5<br />
Ms. Ruth Ann Fate–District 6<br />
Dr. Lois Jacobs–District 7<br />
Mrs. Peggy Young (Clerk)<br />
Dear <strong>Tulsa</strong> Community,<br />
The Members of the Board of Education for <strong>Tulsa</strong> <strong>Public</strong> <strong>Schools</strong> (TPS), Independent School<br />
District Number One of <strong>Tulsa</strong> County, <strong>Tulsa</strong>, Oklahoma, hereby join and express our support for<br />
the “2010–2015 Strategic Plan” for <strong>Tulsa</strong> <strong>Public</strong> <strong>Schools</strong>.<br />
It is the mission of <strong>Tulsa</strong> <strong>Public</strong> <strong>Schools</strong> “to provide a quality learning experience for every<br />
student, every day, without exception.” We know that quality learning experiences require an<br />
effective teacher and leader at every site. The “2010–2015 Strategic Plan” provides a concrete<br />
plan for completing that critical component in pursuit of our Vision, Mission, Core Goals and<br />
Core Beliefs. We are committed to closing achievement gaps and to serving all students in their<br />
pursuit of educational success.<br />
While this statement of support for the “2010–2015 Strategic Plan” is important, it is also<br />
important that we express our commitment that the successful implementation of this plan will<br />
include, where necessary and appropriate:<br />
• Policy change;<br />
• Focused, consistent and courageous decision-making;<br />
• Building community and legislative support; and,<br />
• Continuing, outspoken and unwavering advocacy for these reforms and for continuous<br />
improvement in our schools.<br />
We offer our thanks to all supporters and stakeholders for the generous commitment to<br />
high quality education.<br />
Dr. Lana Turner-Addison<br />
President<br />
1
FROM THE SUPERINTENDENT<br />
Dear Friends of <strong>Tulsa</strong> <strong>Public</strong> <strong>Schools</strong>,<br />
This is a challenging time for urban districts. The bar on student achievement has<br />
been elevated and will continue to increase at a time when families are struggling<br />
financially (85 percent of students qualify for free or reduced lunch) and state<br />
resources are declining. However, addressing these and other externally-imposed<br />
challenges cannot justify a position or acceptance that students need less. We will<br />
not use excuses. It is an understatement to suggest that the world students will be<br />
entering upon graduation is a globally competitive one. We know that students<br />
need to graduate from high school fully ready for work-force entry or college, and<br />
subsequent career decision-making, regardless of their background.<br />
Our work with the <strong>Tulsa</strong> community and the Bill & Melinda Gates Foundation has been transformational<br />
for this District. It has crystallized our thinking and focused our actions. We know that the single greatest<br />
influence on student academic growth is effective teaching and that teachers do their best when they<br />
are part of a high-performing professional team. We know that in order to build a performance culture<br />
across the District and a service culture at the District office, we must increase the use of data to inform<br />
instruction and assure that measurement drives results. We have extreme clarity for our direction: great<br />
teachers, great leaders and accountability for student growth and achievement.<br />
There is a sense of urgency to all that we do in the pursuit of optimizing educational opportunities and<br />
advantages for every student in the District. Therefore, via the Strategic Plan, we make the following<br />
implementation commitments to you:<br />
• We will do what is best for children. We will assess every strategy by how it will help students succeed in<br />
our classrooms and subsequently in the work-force environment and/or college setting.<br />
• We will be prioritized and focused. We will focus attention on issues that must be addressed now and we<br />
will apply the proper resources and time to be successful.<br />
• We will work within our means. We will commit to those things for which we have resources. We will<br />
identify funding gaps and propose solutions to address them.<br />
• We will measure progress and report back frequently to the community. Each strategy we propose is<br />
based on clear, specific goals so that we can measure progress. We will commit to clear and timely<br />
communication so that staff, families and community members are informed of our plans and have the<br />
opportunity to share their suggestions for the future.<br />
The approval of the “2010–2015 Strategic Plan” is the beginning of a process that provides performancebased,<br />
timely reviews by the Board of Education to take measure of our achievements and announce<br />
actions needed to address those areas that need bolstering. I look forward to working together to<br />
implement this plan on behalf of the more than 41,000 young people in <strong>Tulsa</strong> <strong>Public</strong> <strong>Schools</strong>.<br />
Thank you in advance for your deliberate and thoughtful efforts to help guide <strong>Tulsa</strong> <strong>Public</strong> <strong>Schools</strong><br />
to a bright, successful future.<br />
Sincerely,<br />
Keith E. Ballard, Ed.D.<br />
Superintendent of <strong>Schools</strong><br />
2
ABOUT THE DISTRICT<br />
Who We Are<br />
TULSA PUBLIC SCHOOLS (TPS) was founded in 1904 to provide public education to <strong>Tulsa</strong> area<br />
students from kindergarten through grade 12. Since the District’s inception, TPS has grown to<br />
encompass 85 accredited sites spread over 173 square miles.<br />
Total enrollment in the District exceeds 41,000 students from the city of <strong>Tulsa</strong>, the county<br />
seat of <strong>Tulsa</strong> County and the surrounding area in <strong>Tulsa</strong>, Creek, Osage and Wagoner counties.<br />
TPS provides early childhood (pre-kindergarten for four-year old students), primary<br />
(kindergarten through grade 3) and intermediate (grades 4 and 5) elementary schools, middle<br />
schools (grades 6–8) and high schools (grades 9–12).<br />
The governing body of the District is the Board of Education, which is composed of seven<br />
elected members who serve four-year terms. The appointed Superintendent is the executive<br />
officer of the District.<br />
The District has a<br />
$558 million<br />
annual budget with a<br />
$326.5 million<br />
general fund.<br />
TPS employs 6,729 staff<br />
members of whom 3,459<br />
are certified teachers and<br />
administrators and<br />
3,270 are support personnel.<br />
About 15,000 volunteers<br />
offer their services within<br />
TPS each year.<br />
An Urgent Challenge<br />
College and/or work-force readiness and career preparedness must be our unwavering<br />
goals, and the academic achievement gaps along racial/ethnic and socioeconomic lines<br />
must be eliminated. We must deliver upon the spirit and intent of our Mission:<br />
To provide a quality learning experience for every student, every day, without exception.<br />
The time to act is now. Our work thus far has been met with enthusiastic support throughout<br />
the <strong>Tulsa</strong> community—local government, philanthropic, business and community groups, staff<br />
and parents. That support gives us both the momentum needed to undertake a comprehensive<br />
transformation plan and the foundation upon which to secure its success.<br />
TPS currently uses ACT’s College Readiness Benchmark Scores as one measure of college and<br />
career readiness. Currently 14 percent of TPS students taking the ACT test are proficient in all<br />
four areas as compared to 19 percent for the state and 24 percent nationally. At this time we<br />
cannot compare ethnicity in ACT scores but we can identify achievement gaps within TPS using<br />
End-of-Instruction (EOI) test data.<br />
3
For the 2009–2010 school year, the gap from the highest achieving students by ethnicity is as<br />
follows: (The goal is to reduce the numeric value of the percentages.)<br />
Algebra I: African American 36%, American Indian 29%, Hispanic/Latino 24%, Caucasian 12%<br />
Algebra II: African American 55%, Hispanic/Latino 45%, American Indian 38%, Caucasian 16%<br />
Geometry: African American 41%, Hispanic/Latino 27%, American Indian 24%, Caucasian 10%<br />
English II: African American 28%, Hispanic/Latino 28%, American Indian 15%, Caucasian 1%<br />
English III: African American 36%, Hispanic/Latino 31%, American Indian 15%, Caucasian 8%<br />
Biology I: African American 39%, Hispanic/Latino 37%, American Indian 22%, Caucasian 5%<br />
U.S. History: African American 41%, Hispanic/Latino 36%, American Indian 17%, Asian 8%<br />
The above statistics are a “high school-level snapshot in time;” however, the above performance<br />
disparities have their long-seeded origins in early childhood, elementary and middle school<br />
educational conduits. In other words, the challenge must be addressed from early childhood on<br />
through high school.<br />
4
SUBSTANTIVE FRAMEWORK<br />
Vision<br />
Mission<br />
Excellence and High Expectations with a Commitment to All<br />
To provide a quality learning experience for every student, every day, without exception<br />
Core Goals<br />
• Student Achievement–Each student will meet or exceed state and national standards by<br />
demonstrating mastery of a rigorous curriculum that provides a foundation for success in<br />
career readiness or college preparedness and beyond.<br />
• Teacher and Leader Effectiveness–Assure that <strong>Tulsa</strong> <strong>Public</strong> <strong>Schools</strong> has an effective teacher<br />
in every classroom, an effective principal in every building and an effective employee in<br />
every position.<br />
• Performance-Based Culture–Create an environment for sustainable performance<br />
improvement and accomplishment of the District’s Vision, Mission, Core Goals and<br />
Core Beliefs.<br />
• Financial Sustainability–Seek, organize and optimize resources for improved<br />
academic results.<br />
• Safe and Secure <strong>Schools</strong>–Ensure the safety and security of all students and staff throughout<br />
the District.<br />
Core Beliefs<br />
• Effective leaders and classroom teachers have a profound impact on children’s lives.<br />
• All children can learn and TPS can close the achievement gap.<br />
• TPS can be an efficient, effective, performance-based organization.<br />
• Community collaboration is fundamental to achieving and sustaining excellence.<br />
• TPS should provide a safe, healthy learning environment for students and staff.<br />
5
PROCESS FRAMEWORK<br />
The Process Framework is the vehicle that will be used to check progress on the achievement<br />
of Core Goals. The process will be managed by the Chief of Staff with each Core Goal assigned<br />
to an individual Strategic Planning Facilitator. Within a 12-month period each Core Goal will<br />
be presented twice before the Board of Education for update/review that provides specific<br />
opportunities for monitoring and tracking of progress. Specific details of the process reside<br />
within a separate document.<br />
The Strategic Plan SUBSTANCE presented as CORE GOALS<br />
Student Achievement<br />
Safe and Secure<br />
<strong>Schools</strong><br />
Teacher and Leader<br />
Effectiveness<br />
Financial Sustainability<br />
Performance-Based<br />
Culture<br />
The Strategic Plan PROCESS will be operationalized by Strategic Planning<br />
Facilitators, with comprehensive oversight provided by the Chief of Staff.<br />
Student Achievement<br />
Assistant Superintendent for<br />
Curriculum and Instruction/Special<br />
Education and Student Services<br />
Safe and Secure <strong>Schools</strong><br />
Associate Superintendents (or<br />
designees) and the Campus<br />
Police Chief<br />
Teacher and Leader<br />
Effectiveness<br />
Executive Director of Teacher/<br />
Leadership Effectiveness Initiative<br />
Financial Sustainability<br />
Chief Financial Officer<br />
Performance-Based Culture<br />
Chief Human Capital Officer<br />
6
CORE GOALS<br />
1<br />
Student Achievement–Each student will meet or exceed state and national standards by<br />
demonstrating mastery of a rigorous curriculum that provides a foundation for success in career readiness<br />
or college preparedness and beyond.<br />
Strategic Objectives:<br />
A. Create an exceptional learning environment, via enhanced curricular and instructional<br />
offerings and practices, that prepares students to pursue college and work-force ready<br />
opportunities and to subsequently become effective, productive and contributing citizens.<br />
B. Develop a learning culture within our students that focuses on a love for learning, problem<br />
solving ability, intellectual curiosity, passion for the arts and a valuing of physical wellness.<br />
C. Examine District programs needed to deliver academic excellence with a focus on the<br />
elimination of achievement gaps among all subgroups of students.<br />
D. Analyze facility utilization. Consolidation of schools will simultaneously be considered with<br />
parallel planning to optimize student learning and performance opportunities.<br />
E. Expand the concept of community schools to appropriate scales of growth within the District.<br />
A community school is both a place and a set of partnerships between the school and other<br />
community resources. Community schools combine the best educational practices with a<br />
wide range of vital in-house health and social services to ensure that children are physically,<br />
emotionally and socially prepared to learn.<br />
2<br />
Teacher and Leader Effectiveness–Assure that <strong>Tulsa</strong> <strong>Public</strong> <strong>Schools</strong> has an effective<br />
teacher in every classroom, an effective principal in every building and an effective employee in<br />
every position.<br />
Strategic Objectives:<br />
A. Implement a new, innovative and fair evaluation system for all TPS staff that is based upon<br />
feedback and support and is aligned to enacted Oklahoma legislation.<br />
B. Continue the enhancement of human capital functions that assures: 1) a pipeline of high<br />
quality principals, teachers and staff, prepared to be effective in an urban setting; 2)<br />
targeted and coordinated evidence-based development of leaders and teachers.<br />
C. Structure central administration and human capital resources and establish systems and<br />
processes to support schools and enable campus leadership to focus on student growth<br />
and achievement.<br />
D. Create a culture of high expectations for academic achievement and conduct that makes no<br />
excuses based on the student’s demographics and/or socioeconomic status.<br />
7
E. Explore opportunities for increasing academic learning time so students have more time in<br />
the classroom to acquire the academic knowledge and skills that will prepare them for workforce<br />
entry or college, and subsequent career decision making.<br />
F. Develop, track and communicate clear outcome measures for student learning goals and<br />
organizational goals in order to precisely monitor work that will make a difference in student<br />
achievement. Develop a system for shared accountability for results.<br />
3<br />
Performance-Based Culture–Create an environment for sustainable performance<br />
improvement and accomplishment of the District’s Vision, Mission, Core Goals and<br />
Core Beliefs.<br />
Strategic Objectives:<br />
A. Improve alignment of District leadership and community focus on the most critical District<br />
aspirations while fostering an environment of innovation based upon data-driven decisions.<br />
B. Diligently monitor and report staff and student progress on Strategic Plan initiatives to<br />
enhance trust via transparency, promote productive dialogue and determine success via<br />
observable and measurable standards.<br />
C. Develop coherent professional development content and delivery systems that support the<br />
strategic initiatives (examples illustrated on page 6) and build professional learning in all<br />
work environments.<br />
D. Replicate success models and turn around low-performing schools.<br />
E. Adopt a District-wide accountability system to ensure the success of all schools with progress<br />
reporting/sharing via data walls, data dashboards, etc. Inherent in this accountability system<br />
will be the expansion of successful schools, programs and practices, and holding schools<br />
accountable for dramatic, documentable and sustainable improvement.<br />
4<br />
Financial Sustainability–Seek, organize and optimize resources for improved<br />
academic results.<br />
Strategic Objectives:<br />
A. Be prudent stewards of District resources through rigorous planning and budgeting, and<br />
build further resources by enhancing public and private support for public education.<br />
B. Effectively manage fiscal resources in compliance with internal and external accountability<br />
requirements and deliver the highest quality financial services to all stakeholders.<br />
C. Maximize revenue from state, local, other governmental sources and private/foundation support.<br />
D. Support the efforts of Partners in Education, PTA, foundations, individual donors, business<br />
groups, and other community groups and agencies to augment existing District resources.<br />
8
5<br />
Safe and Secure <strong>Schools</strong>–Ensure the safety and security of all students and staff<br />
throughout the District.<br />
Strategic Objectives:<br />
A. Create a caring, safe and secure environment that enables teaching and learning to<br />
take place.<br />
B. Ensure that policies and procedures are in place that identify and promote strategies,<br />
promising practices and programs that support positive climate and safe schools for all<br />
students and staff as part of the total academic mission.<br />
9
CORE GOALS<br />
Imagine the TPS Core Goals as the lanes of a multi-lane highway that provides the direction<br />
and focus to close achievement gaps, prevent students from dropping out and raise the level<br />
of achievement for all students so that every student graduates ready for college, work-force<br />
entry, and career and life decisions in an ever-changing world. The vehicles that we employ to<br />
achieve Core Goals are the partnerships, initiatives and programs that drive us down the path of<br />
success. At times a single vehicle “accelerates” and moves to a different lane, yet the direction,<br />
forward progress and alignment is always clear. At other times a “caravan” of vehicles is used<br />
to move our precious passengers, our students, to new levels of knowledge and understanding.<br />
Along the way billboards are viewed. They include messages of:<br />
• Loves to learn, views the world as a classroom without walls and thinks critically about the<br />
issues within it.<br />
• Masters verbal and written expression and uses mathematical skill, scientific inquiry<br />
and state-of-the-art technology to invent new solutions to persistent or unanticipated<br />
challenges.<br />
• Exhibits growth, self-discipline and reflection through innovative expression and artistry.<br />
• Acknowledges and respects people with diverse backgrounds, histories and perspectives.<br />
• Assumes personal responsibility for physical and emotional well-being by making<br />
healthy choices.<br />
• Contributes confidently and positively in professional and social settings, both<br />
independently and as a member of a team.<br />
• Demonstrates resourcefulness and resilience in the face of setbacks and obstacles, relying<br />
on personal assets and support from others to achieve goals.<br />
• Participates actively in a democratic society as a responsible, courageous leader who<br />
challenges injustice.<br />
Our District is home to some of the most talented young people in our nation. They also are<br />
astonishingly different, with vast variations in preparation for school, academic interests,<br />
passions and learning needs. Our challenge is to create an environment that makes the most of<br />
every day for each student so that school is always a place where learning is valued, creativity is<br />
nurtured and celebrated and every student graduates with numerous opportunities.<br />
Strategic Plan Process Framework<br />
The following is NOT part of the Strategic Plan but provides “background” information regarding<br />
the Strategic Plan Review Process for use by the Strategic Planning Facilitators and for review by<br />
the Board of Education.<br />
Process Framework<br />
(The Process Framework is the vehicle that will be used to check progress on the achievement<br />
of Core Goals.)<br />
The Process will be managed by the Chief of Staff.<br />
10
Responsibilities include:<br />
• Assure the continued progress of Strategic Plan components via regular meetings,<br />
communications and sharing between Core Goal Strategic Planning Facilitators.<br />
• Review, analyze and screen all current programs, initiatives, projects,<br />
etc. and assign them to the appropriate Core Goal.<br />
• Collaborate with individual Strategic Planning Facilitators to review, analyze and screen ALL<br />
proposed programs, initiatives, projects, etc. and forward a written recommendation to<br />
the Superintendent of <strong>Schools</strong> for incorporation and/or rejection of same. If incorporation<br />
is recommended, then assignment to a specific Core Goal is an inherent responsibility.<br />
• Review progress reports, provide direction and/or redirection, from the individual<br />
Core Goal Strategic Planning Facilitators.<br />
Each Core Goal will be assigned to an individual Strategic Planning Facilitator. The<br />
Facilitators by Core Goal are:<br />
• Student Achievement–Assistant Superintendent for Curriculum and Instruction/Special<br />
Education and Student Services<br />
• Teacher and Leader Effectiveness–Executive Director of Teacher/Leadership Effectiveness<br />
Initiative<br />
• Performance-Based Culture–Chief Human Capital Officer<br />
• Financial Sustainability–Chief Financial Officer<br />
• Safe and Secure <strong>Schools</strong>–Associate Superintendents (or designees) and the Campus<br />
Police Chief<br />
Responsibilities of the individual Core Goal Strategic Planning Facilitators include:<br />
• Provide and present twice annually a written progress report by individual Core Goal<br />
(on a prescribed template) to the Board of Education.<br />
• Collaborate with the Chief of Staff regarding current and proposed programs, initiatives<br />
and projects that fall or may fall within the province of a specific Core Goal.<br />
• Review the effectiveness of specific programs, initiatives, projects and actions<br />
within a specific Core Goal and forward a recommendation to the Chief of Staff<br />
regarding continuation, modification and or abandonment of the specific program,<br />
initiative, project and/or action.<br />
• Design, fully and completely, key actions that are needed to assure the efficacy of the<br />
Core Goal.<br />
11
Timeline<br />
The individual Core Goal presentations may be reordered based upon data availability<br />
and/or reporting requirements of statute; however, within a 12-month period of time each<br />
Core Goal will be presented twice for Board of Education update and review.<br />
• April 2011–Presentation by the Chief of Staff to the Board of Education that includes:<br />
• Objectives by Core Goal<br />
• Key actions within each objective<br />
• Programs, initiatives, projects, etc. that fall within the province of the Core Goal<br />
• Linkages between programs, initiatives and projects that may overlap Core Goals<br />
May 2011–Teacher and Leader Effectiveness<br />
June 2011–Performance-Based Culture<br />
July 2011–Financial Sustainability<br />
August 2011–Student Achievement<br />
September 2011–Safe and Secure <strong>Schools</strong><br />
October 2011–Strategic Plan Update by the Chief of Staff<br />
November 2011–Teacher and Leader Effectiveness<br />
December 2011–Performance-Based Culture<br />
January 2012–Financial Sustainability<br />
February 2012–Student Achievement<br />
March 2012–Safe and Secure <strong>Schools</strong><br />
April 2012–Strategic Plan Update by the Chief of Staff<br />
Reporting cycle begins again.<br />
12
Strategic Plan<br />
Core Goal Update<br />
<strong>Tulsa</strong> <strong>Public</strong> <strong>Schools</strong><br />
© Copyright <strong>Tulsa</strong> <strong>Public</strong> © <strong>Tulsa</strong> <strong>Schools</strong> <strong>Public</strong> 2011 <strong>Schools</strong> 2011
Strategic Objectives Review – January 2012<br />
CURRENT OBJECTIVES<br />
Core Goal: Student Achievement<br />
A. Create an exceptional learning environment, via<br />
enhanced curricular and instructional offerings and<br />
practices that prepares students to pursue college and<br />
work-force ready opportunities and to subsequently<br />
become effective, productive and contributing citizens.<br />
B. Develop a learning culture within our students that<br />
focuses on a love for learning, problem solving ability,<br />
intellectual curiosity, passion for the arts and a valuing of<br />
physical wellness.<br />
C. Examine District programs needed to deliver academic<br />
excellence with a focus on the elimination of achievement<br />
gaps among all subgroups of students.<br />
D. Analyze facility utilization. Consolidation of schools will<br />
simultaneously be considered with parallel planning to<br />
optimize student learning and performance opportunities.<br />
E. Expand the concept of community schools to appropriate<br />
scales of growth within the District. A community school is<br />
both a place and a set of partnerships between the school<br />
and other community resources. Community schools<br />
combine the best educational practices with a wide range<br />
of vital in-house health and social services to ensure that<br />
children are physically, emotionally and socially prepared<br />
to learn.<br />
F. Explore opportunities for increasing academic learning<br />
time so students have more time in the classroom to<br />
acquire the academic knowledge and skills that will<br />
prepare them for work-force entry or college, and<br />
subsequent career decision making.<br />
PROPOSED REVISIONS<br />
Each student will meet or exceed state and national standards by<br />
demonstrating mastery of a rigorous curriculum that provides a<br />
foundation for success in career readiness or college<br />
preparedness and beyond.<br />
A. Create an exceptional learning environment, via enhanced<br />
curricular and instructional offerings as well as improved systems<br />
and structures, that prepare students to pursue college and workforce<br />
ready opportunities and to subsequently become effective and<br />
productive citizens<br />
MOVE D. TO SECTION 4 (FINANCIAL SUSTAINABILITY)<br />
E. Expand the concept of community schools to appropriate scales of<br />
growth within the District. Community schools combine the best<br />
educational practices with a wide range of vital in-house health and<br />
social services to ensure that children are physically, emotionally<br />
and socially prepared to learn.<br />
ADDED (from #2g)<br />
F. Replicate success models and turn around lowperforming<br />
schools.<br />
ADDED (from #3d)<br />
Strategic Objectives Review Page 1
Strategic Objectives Review – January 2012<br />
CURRENT OBJECTIVES<br />
Core Goal: Teacher and Leader Effectiveness<br />
A. Implement a new, innovative and fair evaluation system<br />
for all TPS staff that is based upon feedback and support<br />
and is aligned to enacted Oklahoma legislation.<br />
B. Continue the enhancement of human capital functions<br />
that assures: 1) a pipeline of high quality principals,<br />
teachers and staff, prepared to be effective in an urban<br />
setting; 2) targeted and coordinated evidence-based<br />
development of leaders and teachers.<br />
C. Structure central administration and human capital<br />
resources and establish systems and processes to<br />
support schools and enable campus leadership to focus<br />
on student growth and achievement.<br />
D. Create a culture of high expectations for academic<br />
achievement and conduct that makes no excuses based<br />
on the student’s demographics and/or socioeconomic<br />
status.<br />
G. Explore opportunities for increasing academic learning<br />
time so students have more time in the classroom to<br />
acquire the academic knowledge and skills that will<br />
prepare them for work-force entry or college, and<br />
subsequent career decision making.<br />
H. Develop, track and communicate clear outcome<br />
measures for student learning goals and organizational<br />
goals in order to precisely monitor work that will make a<br />
difference in student achievement. Develop a system for<br />
shared accountability for results.<br />
Core Goal: Performance-Based Culture<br />
A. Improve alignment of District leadership and community<br />
focus on the most critical District aspirations while<br />
fostering an environment of innovation based upon datadriven<br />
decisions.<br />
PROPOSED REVISIONS<br />
Assure that <strong>Tulsa</strong> <strong>Public</strong> <strong>Schools</strong> has an effective teacher in every<br />
classroom, an effective principal in every building and an effective<br />
employee in every position.<br />
B. Continue the enhancement of human capital functions that<br />
assures the effective recruitment, development and retention<br />
of a high-performing workforce prepared to be successful in<br />
an urban setting.<br />
C. Structure central administration and human capital systems to<br />
effectively support schools and enable campus leadership to<br />
focus on student growth and achievement.<br />
F. Create a culture of high expectations for academic<br />
achievement and conduct that makes no excuses based on<br />
students’ demographics and/or socioeconomic status.<br />
MOVE UNDER GOAL 1 STUDENT ACHIEVEMENT<br />
F. Develop, track and communicate clear outcome measures for<br />
student learning and organizational goals in order to precisely<br />
monitor work that will positively affect student achievement.<br />
Create an environment for sustainable performance improvement and<br />
accomplishment of the District’s Vision, Mission, Core Goals and<br />
Core Beliefs.<br />
A. Improve alignment of district goals and objectives to focus on the<br />
most critical District priorities while fostering an environment of<br />
innovation based upon data-driven decisions.<br />
Strategic Objectives Review Page 2
Strategic Objectives Review – January 2012<br />
CURRENT OBJECTIVES<br />
B. Diligently monitor and report staff and student progress<br />
on Strategic Plan initiatives to enhance trust via<br />
transparency, promote productive dialogue and determine<br />
success via observable and measurable standards.<br />
C. Develop coherent professional development content and<br />
delivery systems that support the strategic initiatives and<br />
build professional learning in all work environments.<br />
D. Replicate success models and turn around lowperforming<br />
schools.<br />
E. Adopt a District-wide accountability system to ensure the<br />
success of all schools with progress reporting/sharing via<br />
data walls, data dashboards, etc. Inherent in this<br />
accountability system will be the expansion of successful<br />
schools, programs and practices, and holding schools<br />
accountable for dramatic, documentable and sustainable<br />
improvement.<br />
Core Goal: Financial Sustainability<br />
PROPOSED REVISIONS<br />
B. Diligently monitor and report staff and student progress on Strategic<br />
Plan initiatives to enhance trust through transparency, promote<br />
continuous improvement and determine success via observable<br />
and measurable standards.<br />
MOVE UNDER GOAL 1 STUDENT ACHIEVEMENT<br />
E. Adopt a District-wide accountability system to ensure the success of<br />
all schools.<br />
Seek, organize and optimize resources for improved academic<br />
results.<br />
A. Be prudent stewards of District resources through<br />
rigorous planning and budgeting, and build further<br />
resources by enhancing public and private support for<br />
public education.<br />
B. Effectively manage fiscal resources in compliance with<br />
internal and external accountability requirements and<br />
deliver the highest quality financial services to all<br />
stakeholders.<br />
C. Maximize revenue from state, local, other governmental<br />
sources and private/foundation support.<br />
D. Support the efforts of Partners in Education, PTA,<br />
foundations, individual donors, business groups, and<br />
other community groups and agencies to augment<br />
existing District resources.<br />
E. Evaluate facility utilization to optimize the allocation of<br />
resources that will meet the changing needs of the<br />
community and support student learning.<br />
ADDED (from #1d)<br />
Strategic Objectives Review Page 3
Strategic Objectives Review – January 2012<br />
CURRENT OBJECTIVES<br />
PROPOSED REVISIONS<br />
Core Goal: Safe and Secure <strong>Schools</strong><br />
A. A. Create a caring, safe and secure environment that<br />
enables teaching and learning to take place.<br />
B. Ensure that policies and procedures are in place that<br />
identify and promote strategies, promising practices and<br />
programs that support positive climate and safe schools<br />
for all students and staff as part of the total academic<br />
mission.<br />
Ensure the safety and security of all students and staff throughout<br />
the District.<br />
B. Ensure policies, procedures, strategies and programs support a<br />
positive climate and safe schools for all students and staff as part of<br />
the total academic mission.<br />
Strategic Objectives Review Page 4
Strategic Plan<br />
Core Goal Update<br />
<strong>Tulsa</strong> <strong>Public</strong> <strong>Schools</strong><br />
© Copyright <strong>Tulsa</strong> <strong>Public</strong> © <strong>Tulsa</strong> <strong>Schools</strong> <strong>Public</strong> 2011 <strong>Schools</strong> 2011
© <strong>Tulsa</strong> <strong>Public</strong> <strong>Schools</strong> 2011<br />
Strategic Plan
Measures of Success Framework<br />
• Provides a vehicle that will be used to check progress<br />
on the achievement of Core Goals (benchmark year is<br />
2010–2011).<br />
• Provides linkages between programs, initiatives and<br />
projects that overlap Core Goals.<br />
• Aligns work to district goals so that every employee<br />
understands and knows their direct impact on student<br />
achievement.<br />
• Creates transparency and simplifies communication.<br />
© <strong>Tulsa</strong> <strong>Public</strong> <strong>Schools</strong> 2011
Developing Measures of Success<br />
Strategic<br />
Planning<br />
Facilitator<br />
Metric<br />
Development<br />
with Cross<br />
Functional Group<br />
Measures of<br />
Success<br />
© <strong>Tulsa</strong> <strong>Public</strong> <strong>Schools</strong> 2011
Measures of Success:<br />
Key Performance Indicators<br />
© <strong>Tulsa</strong> <strong>Public</strong> <strong>Schools</strong> 2011
Monitoring Progress<br />
• This is the bi-annual overview of all Core Goals<br />
as set forth in the Strategic Plan.<br />
• Select measures from each of the Core Goals<br />
will be discussed during this presentation.<br />
• Additional data will be provided in the<br />
accompanying written report.<br />
• Some data is not reported as final student<br />
performance data is pending OK SDE<br />
certification.<br />
© <strong>Tulsa</strong> <strong>Public</strong> <strong>Schools</strong> 2011
Student Achievement<br />
% students scoring at/or above grade level in<br />
Math (PRELIMINARY)*<br />
2010 Preliminary 2011<br />
3 rd Grade 57 % 56%<br />
4 th Grade 56% 56%<br />
5 th Grade 60% 58%<br />
6 th Grade 46% 51%<br />
7 th Grade 49% 53%<br />
*Pending OK SDE certification<br />
© <strong>Tulsa</strong> <strong>Public</strong> <strong>Schools</strong> 2011
Student Achievement<br />
% students scoring at or above grade level in<br />
Reading (PRELIMINARY)*<br />
2010 Preliminary 2011<br />
3 rd Grade 60% 58%<br />
4 th Grade 54% 51%<br />
5 th Grade 52% 53%<br />
6 th Grade 48% 50%<br />
7 th Grade 52% 57%<br />
*Pending OK SDE certification<br />
© <strong>Tulsa</strong> <strong>Public</strong> <strong>Schools</strong> 2011
Teacher & Leader Effectiveness<br />
Personal Development Plans (resulting from evaluations)<br />
2010–2011 Number of PDPs<br />
Teachers 136*<br />
Principals 31<br />
*29 teachers placed in intensive mentoring<br />
Number Exited for performance<br />
2010–2011 # Exited for performance<br />
Teachers 57<br />
Principals 12<br />
© <strong>Tulsa</strong> <strong>Public</strong> <strong>Schools</strong> 2011
Teacher and Leader Effectiveness<br />
90.0%<br />
Evaluation Score Distribution 2010-2011<br />
80.0%<br />
70.0%<br />
76.4%<br />
73.3%<br />
71.7%<br />
60.0%<br />
50.0%<br />
Elem<br />
40.0%<br />
Middle<br />
High<br />
30.0%<br />
20.0%<br />
20.1%<br />
22.7%<br />
23.4%<br />
10.0%<br />
0.0%<br />
1.8%<br />
2.5%<br />
2.2%<br />
1's-2's 3's 4's-5's<br />
© <strong>Tulsa</strong> <strong>Public</strong> <strong>Schools</strong> 2011<br />
1's-2's 3's 4's-5's<br />
Elem 1.8% 76.4% 20.1%<br />
Middle 2.5% 73.3% 22.7%<br />
High 2.2% 71.7% 23.4%
Performance Management<br />
© <strong>Tulsa</strong> <strong>Public</strong> <strong>Schools</strong> 2011<br />
PDP Distribution<br />
Indicator Description Percent (includes<br />
Stand –Alone<br />
PDP’s)<br />
2 Clearly defines expected student behavior 20.20%<br />
6a<br />
Engages learners in active learning 80% or<br />
more of class time 12.50%<br />
1<br />
Plans for delivery of the lesson relative to<br />
short term and long term objectives 9.50%<br />
4<br />
Develops daily lesson plans designed to<br />
achieve the identified objectives 9.50%<br />
7<br />
Teaches the objectives through a variety of<br />
methods 5.90%<br />
6b<br />
Uses cooperative learning activities, learning<br />
styles, multiple intelligences 4.80%
Financial Sustainability<br />
% Instructional Expenditure Level as a % of the<br />
Total General Fund expenditure<br />
Instructional Expenditures as % of General<br />
Fund Expenditures<br />
Fiscal Year<br />
57.2% 2010–2011<br />
57.3% 2009–2010<br />
57.5% 2008–2009<br />
58.8% 2007–2008<br />
58.1% 2006–2007<br />
© <strong>Tulsa</strong> <strong>Public</strong> <strong>Schools</strong> 2011
Financial Sustainability<br />
TPS Interest Earnings vs. Industry Indicators<br />
Year<br />
TPS Average<br />
Portfolio<br />
Rate<br />
2-Year<br />
Treasury<br />
Note<br />
90-Day<br />
Treasury<br />
Security<br />
1-Year<br />
Treasury<br />
Note<br />
Oklahoma<br />
Liquid<br />
Assets Pool<br />
(OLAP)<br />
2010–2011 0.68% 0.54% 0.12% 0.25% 0.09%<br />
2009–2010 0.50% 0.90% 0.13% 0.38% 0.14%<br />
2008–2009 1.25% 1.32% 0.51% 1.01% 0.89%<br />
2007–2008 3.49% 2.99% 2.80% 2.95% 3.51%<br />
2006–2007 5.20% 4.77% 4.99% 4.97% 4.84%<br />
© <strong>Tulsa</strong> <strong>Public</strong> <strong>Schools</strong> 2011
Safe and Secure <strong>Schools</strong><br />
Truancy:<br />
Year<br />
2010–2011 884<br />
2009–2010 640<br />
Dropout and/or Attendance<br />
Letters Mailed<br />
Year<br />
Number Pursued in Court<br />
2010–2011 237<br />
2009–2010 167<br />
© <strong>Tulsa</strong> <strong>Public</strong> <strong>Schools</strong> 2011
Safe and Secure <strong>Schools</strong><br />
Student Attendance<br />
96%<br />
94%<br />
94%<br />
93.70%<br />
93.30%<br />
92.60%<br />
92%<br />
90%<br />
88%<br />
87.30%<br />
86.50%<br />
2011<br />
2010<br />
86%<br />
84%<br />
82%<br />
<strong>Elementary</strong> Middle School High School<br />
LEVEL 2011 2010<br />
<strong>Elementary</strong> 94.00% 93.70%<br />
Middle School 93.30% 92.60%<br />
High School 87.30% 86.50%<br />
© <strong>Tulsa</strong> <strong>Public</strong> <strong>Schools</strong> 2011
How will we measure success?<br />
TPS PERFORMANCE MANAGEMENT WILL BE<br />
SUCCESSFUL WHEN ALL DEPARTMENTS AND<br />
EMPLOYEES…<br />
• Align their work to district goals<br />
• Know their direct impact on student achievement<br />
• Use data to learn and improve<br />
• Have support/feedback on clear job expectations<br />
• Provide outstanding customer service<br />
• Optimize efficiency to maximize resources<br />
© <strong>Tulsa</strong> <strong>Public</strong> <strong>Schools</strong> 2011
Questions?<br />
Amy Polonchek<br />
polonam@tulsaschools.org<br />
© Copyright <strong>Tulsa</strong> <strong>Public</strong> © <strong>Tulsa</strong> <strong>Schools</strong> <strong>Public</strong> 2011 <strong>Schools</strong> 2011
© <strong>Tulsa</strong> <strong>Public</strong> <strong>Schools</strong> 2011
Student Achievement<br />
Measures of Success<br />
Board of Education Update<br />
August 2011
Core Goal: Student Achievement<br />
Each student will meet or exceed state and national standards by demonstrating mastery<br />
of a rigorous curriculum that provides a foundation for success in career readiness or<br />
college preparedness and beyond.<br />
Strategic Objective A<br />
Create an exceptional learning environment, via enhanced curricular and instructional<br />
offerings and practices, that prepares students to pursue college and work-force ready<br />
opportunities and to subsequently become effective, productive and contributing citizens.<br />
Progress and Accomplishments<br />
Sixteen of the 24 TPS schools on last year’s School Improvement list increased their total API<br />
scores this year. Their average growth was 154 total API points, an increase of 28 percent.<br />
Needs to improve list schools ,Academy Central, Walt Whitman, and McClure elementary<br />
schools; Clinton Middle School; and Central, Hale and Rogers high schools made AYP.<br />
A total of 45 TPS sites achieved AYP this year, compared with 29 last year.<br />
9 more elementary schools made AYP than last year<br />
Nearly 56 percent of TPS schools improved their total API scores.<br />
<strong>Elementary</strong> schools improved the percentage of students scoring “satisfactory or above” in both<br />
math and reading.<br />
At the middle school and high school level, 19 of 26 schools experienced an increase in total API<br />
scores -- an average increase of nearly 130 points.<br />
‣ Students taking Plan and Explore<br />
o EXPLORE prepares help eighth- and ninth-graders for their high school coursework and their<br />
post–high school choices. EXPLORE includes four multiple-choice tests covering English,<br />
mathematics, reading, and science. EXPLORE tests have content similar to the PLAN and<br />
the ACT<br />
o PLAN serves as the midpoint check of academic progress in high school. It is designed to<br />
improve students' preparation for education, training, and work after high school while they<br />
still have time to adjust their high school courses. PLAN has content similar to the ACT.<br />
‣ WorkKeys ® skills tests—for high school students<br />
‣ WorkKeys measures skills such as reading, math, listening, locating information, and teamwork to<br />
help students understand how they can improve their skills for better-paying jobs. Students who take<br />
the WorkKeys tests have a clear way to demonstrate their abilities to future employers.<br />
‣ Teachers received training in the new DIBELS Next which assesses reading fluency for elementary<br />
students<br />
‣ TPS students completed more than 1600 AP tests<br />
‣ The Course of Study was approved offering a wide-range of courses required for graduation as<br />
well as requested courses by campus to enhance student opportunities for choices.<br />
‣ Increased number of students participating in Concurrent Enrollment in 2010-11.<br />
‣ Preparing an 11 Step to College Readiness plan for TPS which addresses reading readiness in early<br />
grades, preparing for advance mathematics, and challenges students to prepare for rigorous<br />
curriculum.<br />
2 |<strong>Tulsa</strong> <strong>Public</strong> <strong>Schools</strong> Board of Education Update August, 2011
Core Goal: Student Achievement<br />
‣ Approximately 200 teachers attended summer PD as TPS began to write curriculum maps in<br />
reading, English, mathematics, social studies and science. The writing process continues in 2011-<br />
12. This is a major step as we move toward Common Core State Standards by 2014.<br />
‣ Staff Development Teacher Project currently begins with 39 teachers serving in that capacity for<br />
2011-12. We expect to hire all 70 SDTs by 2012-13.<br />
Measures of Success – results data not available<br />
% 8 th graders taking Explore<br />
Avg. Explore score<br />
% 10 th graders taking Plan<br />
Avg. Plan score<br />
% 8 th graders meeting the College Readiness Index (CRI)<br />
% 10 th graders meeting the CRI<br />
% students taking SAT/ACT<br />
Avg. composite SAT/ACT score<br />
% students > 24 composite on the ACT<br />
% high school students on track to graduate<br />
% students graduating on time with their cohort<br />
% students graduating outside their cohort<br />
% campuses with majority grades/subjects with positive<br />
value-added growth<br />
Preliminary Results<br />
% students above/at/below grade level in math & reading Above At Below<br />
Grade 3<br />
Grade 4<br />
Grade 5<br />
Grade 6<br />
Grade 7<br />
Grade 8<br />
Grade Level K 1 2 3 4 5 6 7 8 9 10 11<br />
% completion/promotion<br />
Key Issues<br />
‣ Review and monitoring of AP courses for rigor with the expectation that we will increase the<br />
number of students successfully scoring 3, 4 and 5 on AP exams.<br />
Strategic Objective B<br />
Develop a learning culture within our students that focuses on a love for learning,<br />
problem solving ability, intellectual curiosity, passion for the arts and a valuing of physical<br />
wellness.<br />
3
Core Goal: Student Achievement<br />
Progress and Accomplishments<br />
‣ AVID—Advancement Via Individual Determination challenges students to higher levels of<br />
achievement while supporting them along the way<br />
‣ AP and AP Incentive opportunities<br />
‣ Virtual Learning<br />
‣ Concurrent enrollment<br />
‣ Rogers Early College<br />
‣ Magnet <strong>Schools</strong> and specialized themes on numerous campuses provide rich opportunities for our<br />
students throughout the district<br />
‣ TPS is committed to developing the fine arts and physical education opportunities for all children<br />
and has made this a priority during Project Schoolhouse<br />
‣ TPS students excel in the arts; expanding those opportunities for all children is important<br />
‣ Dual Language Immersion Program at Monroe<br />
‣ Monroe Demonstration Academy—MicroSociety and Tribes. Tribe’s philosophy subscribes to<br />
“making every school a model home, a complete community actively developing future compassionate<br />
citizens capable of creating, leading and contributing to the kind of democratic communities - in which we all<br />
long to live”.<br />
Measures of Success – results data not available<br />
Student attendance rate<br />
<strong>Elementary</strong> Middle High<br />
% students identified and served as gifted<br />
% students participating in extracurricular activities<br />
(Arts & Athletics)<br />
% students taking/completing a world language<br />
% 5 th graders scoring advanced on the OCCT<br />
% 8 th graders taking and passing Algebra I<br />
% 11 th graders taking and passing Algebra II<br />
% students taking/completing AP/IB course(s)<br />
% students scoring > 3 on AP exam<br />
% students scoring > “X” on IB exam<br />
% students taking/completing concurrent enrollment courses<br />
Gallup Student Poll Results<br />
% student attending their zoned campus (elementary)<br />
% students attending an interest focused High School that matches<br />
their interest area (determined by Explore/Plan)<br />
Preliminary Results<br />
4
Core Goal: Student Achievement<br />
Key Issues<br />
‣ Assuring that all fine arts programs are outstanding throughout the district<br />
Strategic Objective C<br />
Examine District programs needed to deliver academic excellence with a focus on the<br />
elimination of achievement gaps among all subgroups of students.<br />
Progress and Accomplishments<br />
‣ Pending Board approval, during the 2011-12 school year The Leadership and Learning Center will<br />
conduct an Implementation Audit on TPS’ work on literacy (K-6), readers and writers workshop (6-<br />
10 th ), Read 180 and Professional Learning Communities.<br />
‣ The Common Core State Standards Implementation Plan will take us through a 3-year process to<br />
prepare for the standards which are to be fully developed by 2014.<br />
‣ Curriculum writing during Oct. 2010 and in June and July, 2011 is building the internal capacity of<br />
staff to write and review curriculum.<br />
‣ The School Improvement Office has worked with individual schools to determine root causes<br />
‣ The Office of Accountability has monitored the use of Read 180 and has provided reports to assist<br />
schools in making decisions regarding instruction<br />
‣ Students in middle and high school have a SRI (Scholastic Reading Inventory) assessment; these<br />
students have Lexile scores which offer meaningful information regarding their ability to read and<br />
comprehend complex text.<br />
‣ In 2011-12, students in grades 2 through 12 th will have a Lexile score.<br />
‣ Building Capacity around 1.TLE 2.Common Core 3.Cultural Competence 4.Value Added through<br />
PLC's<br />
Measures of Success – results data not available<br />
Completion/Promotion/Graduation rate by subgroup<br />
OK Core Curriculum Tests by grade/subgroup<br />
Preliminary Results<br />
High achieving student gap by ethnicity/content area<br />
5
Core Goal: Student Achievement<br />
Algebra I<br />
Algebra II<br />
Geometry<br />
English II<br />
English III<br />
Biology I<br />
US History<br />
African<br />
American<br />
American<br />
Indian<br />
Hispanic/<br />
Latino<br />
Caucasian<br />
Asian<br />
Key Issues<br />
Using Lexile scores to drive instruction based on students’ needs is critical; we must use this resource<br />
through Reading Counts and/or Read 180<br />
Removing students from remediation into acceleration and on-grade level learning<br />
Strategic Objective D<br />
Analyze facility utilization. Consolidation of schools will be simultaneously be considered<br />
with parallel planning to optimize student learning and performance opportunities.<br />
Progress and Accomplishments<br />
‣ Project Schoolhouse trade-ups and facility utilization is ongoing.<br />
‣ Construction and building optimal space is ongoing<br />
Measures of Success – results data not available<br />
% campuses utilized at<br />
< 70% capacity 75 – 85% capacity 100 % capacity<br />
6
Core Goal: Student Achievement<br />
% portable square footage (as compared to total district sq. ft.)<br />
Preliminary Results<br />
Key Issues<br />
Strategic Objective E<br />
Expand the concept of community schools to appropriate scales of growth within the<br />
District. A community school is both a place and a set of partnerships between the school<br />
and other community resources. Community schools combine the best educational<br />
practices with a wide range of vital in-house health and social services to ensure that<br />
children are physically, emotionally and socially prepared to learn.<br />
Progress and Accomplishments<br />
‣ A Community <strong>Schools</strong> Office has been created.<br />
‣ Approximately 8,000 students are being served in ten mentoring community schools with 50% of the<br />
schools committed to the continuous learning calendar.<br />
Meeting the serious challenges and barriers to success families face daily, demands supportive<br />
community partnerships and creative best practices which nurture the whole child and family<br />
unselfishly within their own neighborhood. Administrators, staff and coordinators are empowering<br />
and enriching the school cultures with home visits, daily lunch and recess with teacher mentorship,<br />
daily sidewalk conversations with parents, etc. which bring strong communication and involvement<br />
with parents and family, the first steps in building a foundation for success<br />
‣<br />
Measures of Success – results data not available<br />
% students served by community schools<br />
% students participating in after school programs<br />
% campuses conducting parent/community outreach events<br />
Avg. # volunteers/campus (ES/MS/HS)<br />
% community school students attending a Mentoring or Sustaining<br />
level campus<br />
% student participating in Continuous Learning <strong>Schools</strong> Intercession<br />
Avg. value added scores community schools as compared to<br />
District scores<br />
Preliminary Results<br />
Key Issues<br />
7
Teacher and Leader Effectiveness<br />
Measures of Success<br />
Board of Education Update<br />
May 2011
Core Goal: Teacher and Leader Effectiveness<br />
Assure that <strong>Tulsa</strong> <strong>Public</strong> <strong>Schools</strong> has an effective teacher in every classroom, an effective<br />
principal in every building and an effective employee in every position.<br />
Strategic Objective A<br />
Implement a new, innovative and fair evaluation system for all TPS staff that is based upon<br />
feedback and support and is aligned to enacted Oklahoma legislation.<br />
Progress and Accomplishments<br />
‣ A new 5-tier evaluation system with feedback and support for teachers and principals has been<br />
implemented for the 2010-11 school year. The evaluation system parallels SB 2033 (2010 session).<br />
‣ The teacher evaluation instrument was designed collaboratively with the union, and was field<br />
tested. The teacher evaluation process was bargained and overwhelmingly ratified, even in a year<br />
where not step increases were awarded.<br />
‣ Sample calibrations of the teacher evaluation instrument have been conducted jointly in 100<br />
classrooms by our lead evaluation consultant and the corresponding principal to assure consistent<br />
application of the ratings, and provide coaching to principals as they began the new process. The<br />
results show a real differentiation: 19% received ratings of 1 or 2, 61% are rated “effective”, and<br />
20% received ratings of 4 or 5.<br />
‣ An extensive system of feedback and support has been included as part of the teacher evaluation<br />
process, including professional development plans for every teacher with a “needs improvement” or<br />
“ineffective” rating. An intensive peer mentoring process is available for low performing career<br />
teachers.<br />
‣ Over thirty low-performing teachers have been receiving intense peer intervention assistance.<br />
‣ Principals have received over 35 hours of training and mentoring on the teacher evaluation,<br />
feedback and support process.<br />
‣ Non-renewal letters based on evaluation results for teachers on temporary contracts were<br />
distributed at the end of April.<br />
‣ Evaluations for approximately 2300 career teachers and 700 probationary teachers have been<br />
completed. Results are being analyzed and compiled.<br />
‣ Complete principal evaluation results are due in June.<br />
‣ Plans are in place to complete an update and re-design of the evaluation process before next<br />
year. We will analyze the evaluation results, and gather feedback from teachers and other<br />
stakeholders through surveys and other methods. That process has begun.<br />
Measures of Success – not available<br />
Teacher/principal appraisal distribution (% teachers/principals scoring in each rating category)<br />
1 2 3 4 5<br />
Teachers<br />
Principals<br />
2 |<strong>Tulsa</strong> <strong>Public</strong> <strong>Schools</strong> Board of Education Update May 16, 2011
Core Goal: Teacher and Leader Effectiveness<br />
Teacher Measures<br />
# teachers on Professional Development Plans (PDPs)<br />
# teachers on PDPs with improved appraisal ratings<br />
# teachers on PIMs<br />
# temporary teachers non-renewed<br />
# teachers exited for performance<br />
Principal Measures<br />
# principals on PDPs<br />
# principals on PDPs with improved appraisal ratings<br />
# principals exited for performance<br />
Other Measures<br />
% alignment of performance levels with appraisal rating<br />
% evaluations completed on time<br />
Preliminary Results<br />
Preliminary Results<br />
Preliminary Results<br />
Key Issues<br />
‣ This new evaluation system is part of an early adoption of SB 2033 by <strong>Tulsa</strong> <strong>Public</strong> <strong>Schools</strong>. Ideally,<br />
the state will take advantage of the work TPS has done, and adopt a statewide evaluation system<br />
that aligns with <strong>Tulsa</strong>’s system.<br />
‣ Technology solutions for the entry, analysis and data reporting in year one have been inadequate. A<br />
technology solution that will interface with the new Munis Finance and HR system is desired and<br />
being pursued.<br />
‣ Human Capital is determining the number of board hearings that will be required for performancebased<br />
terminations. The schedule could be challenging.<br />
Strategic Objective B<br />
Continue the enhancement of human capital functions that assures: 1) a pipeline of highquality<br />
principals, teachers and staff, prepared to be effective in an urban setting; 2)<br />
targeted and coordinated evidence-based development of leaders and teachers.<br />
Progress and Accomplishments<br />
‣ Two urban teacher pipeline agreements have been executed with local universities, and a third is<br />
under construction.<br />
‣ Evidence-based Gallup screening instruments have been put in place as part of the teacher and<br />
principal recruiting process. Applicants must take these surveys online as part of the application<br />
process, and threshold scores have been established.<br />
‣ A TPS conference for building leaders⎯Great Educators Make Great <strong>Schools</strong>⎯will take place in<br />
June, to kick off a year of focused professional development for district leadership.<br />
‣ A new evidence-based leadership development plan is under development, with plans to implement<br />
during the 2011–12 school year.<br />
3
Core Goal: Teacher and Leader Effectiveness<br />
‣ A third corps of Teach for America teachers will be brought on board for the 2011 school year.<br />
‣ An evidence-based teacher induction program, in partnership with the New Teacher Center, will be<br />
in place during the fall of 2011.<br />
‣ TLE Indicator-specific workshops and sessions have been held on the following topics:<br />
o INSTRUCTIONAL EFFECTIVENESS – A Six (6) Part Series on the “How To” of Differentiated<br />
Instruction<br />
o CLASSROOM MANAGEMENT – Successful Strategies for Working with the Defiant Child<br />
INSTRUCTIONAL EFFECTIVENESS – Differentiating Reading Instruction in the Content Areas –<br />
<strong>Elementary</strong> and Secondary).<br />
‣ Summer 2011 professional development has been designed and scheduled to improve performance<br />
in specific areas identified frequently as low-performing in the evaluations. Specifically:<br />
o 13a. & 11b.* Use of data to modify instruction and guide intervention. Methods for students<br />
to track their own effort and accomplishments & collaboration.<br />
o 11g. Re-teaches learning that is not mastered in different ways<br />
o 13c. Appropriately and consistently adheres to IEPs and modifies assignments for special<br />
education populations if required in the IEP.<br />
o 12a. & 10b. Summarizes or teaches students to summarize new learning in a variety of ways.<br />
Uses different types of student response techniques, both individual and group. 2. & 3b.<br />
Clearly defines expected student behavior. Follows the procedures to protect the health and<br />
safety of all students & Moves around the room while students are working independently.<br />
o 4. & 6a. Plans for the delivery of the lesson relative to short term and long term objective.<br />
Require participation of all students and engages learners in active learning 80% or more of<br />
the time.<br />
*notations in underlined italics refer to specific indicators in the teacher evaluation instrument that need<br />
improvement<br />
Measures of Success<br />
Teacher retention – years of service<br />
1 2 3 4 5<br />
Teachers<br />
Teacher effectiveness & retention – years of service scoring > 3 on most recent appraisal<br />
1 2 3 4 5<br />
Teachers<br />
Pipeline Measures<br />
% applicants scoring > 72 on Gallup Insight<br />
% staff transferring/promoting scoring > 72 on Gallup Insight<br />
Average time to fill teacher positions<br />
Preliminary Results<br />
4
Core Goal: Teacher and Leader Effectiveness<br />
Development Measures<br />
% new teachers assigned a mentor<br />
% beginning teachers completing comprehensive new<br />
teacher induction program<br />
# hours professional development offered that are aligned to<br />
TLE results<br />
Preliminary Results<br />
Key Issues<br />
Strategic Objective C<br />
Structure central administration and human capital resources and establish systems and<br />
processes to support schools and enable campus leadership to focus on student growth<br />
and achievement.<br />
Progress and Accomplishments<br />
‣ Human Capital and Finance have begun a pilot to develop balanced scorecards that connect their<br />
individual and department goals to district core goals, including student achievement<br />
‣ This balanced scorecard process includes professional development activities for identifying key<br />
processes, analyzing root causes, and optimizing performance.<br />
Measures of Success – not available<br />
% central services departments with Key Performance<br />
Indicators<br />
% central services departments with service scorecards<br />
% job descriptions that are reviewed annually<br />
# process improvement projects<br />
Preliminary Results<br />
Key Issues<br />
Strategic Objective D<br />
Create a culture of high expectations for academic achievement and conduct that makes<br />
no excuses based on the student’s demographics and/or socioeconomic status.<br />
Progress and Accomplishments<br />
‣ A student progress data model (sometimes called “value-added”) is being finalized. This new type<br />
of data will be disaggregated to identify achievement gaps, and will provide a basis for improved<br />
and targeted instruction.<br />
‣ District leadership professional development will have a focus during the 11-12 school year on<br />
5
Core Goal: Teacher and Leader Effectiveness<br />
CULTURAL COMPETENCE: Infusing actions focused on Cultural Competence that build high<br />
expectations for all students by understanding what it means to lead an urban school.<br />
Measures of Success – not available<br />
% core teachers retained in each grade/area with positive value-added results<br />
Reading Math Science Social Studies<br />
3 rd Grade<br />
4 th Grade<br />
5 th Grade<br />
6 th Grade<br />
7 th Grade<br />
8 th Grade<br />
% campuses with positive value-added results for all areas by grade and subgroup<br />
3 rd Grade 4 th Grade 5 th Grade 6 th Grade 7 th Grade 8 th Grade<br />
African<br />
American<br />
American<br />
Indian<br />
Hispanic/Latino<br />
Caucasian<br />
Asian<br />
Econ.<br />
Disadvantaged<br />
Special Ed.<br />
ELL<br />
GT<br />
% teachers with positive value-added results – Reading<br />
% teachers with positive value-added results – Math<br />
Avg. teacher appraisal rating (5 highest performing campuses)<br />
Avg. teacher appraisal rating (5 lowest performing campuses)<br />
Preliminary Results<br />
Key Issues<br />
6
Core Goal: Teacher and Leader Effectiveness<br />
Strategic Objective E<br />
Explore opportunities for increasing academic learning time so students have more time in<br />
the classroom to acquire the academic knowledge and skills that will prepare them for<br />
work-force entry or college, and subsequent career decision making.<br />
Progress and Accomplishments<br />
‣ Extended learning time in the six School Improvement Grant (SIG) schools has been in place this<br />
school year, and data is being analyzed and revised to inform future plans for extended learning<br />
time. These schools include Will Rogers, East Central, Central, Nathan Hale, Clinton and Gilcrease.<br />
Measures of Success<br />
% campuses > 95% teacher attendance rate<br />
% lost instructional days due to teacher absences<br />
Avg. score Extended Learning Time Teacher Survey<br />
SIG campuses as compared to district results<br />
SIG Campus Average<br />
API<br />
Composite ACT score<br />
Overall campus value-added<br />
Preliminary Results<br />
District Average<br />
Key Issues<br />
Strategic Objective F<br />
Develop, track and communicate clear outcome measures for student learning goals and<br />
organizational goals in order to precisely monitor work that will make a difference in<br />
student achievement. Develop a system for shared accountability for results.<br />
Progress and Accomplishments<br />
‣ Development of student achievement and college readiness measures of success as part of the<br />
Board Reporting for the Strategic Plan.<br />
Measures of Success<br />
% students meeting district identified achievement goals<br />
% teachers meeting district identified achievement goals<br />
% campuses meeting district identified achievement goals<br />
Preliminary Results<br />
Key Issues<br />
7
Safe <strong>Schools</strong><br />
Measures of Success<br />
Board of Education Update<br />
July 2011
Core Goal: Safe and Secure <strong>Schools</strong><br />
Ensure the safety and security of all students and staff throughout the District.<br />
Strategic Objective A<br />
Create a caring, safe and secure environment that enables teaching and learning to take<br />
place.<br />
Progress and Accomplishments<br />
‣<br />
Measures of Success – data not available<br />
Weapons incidents per 1000 students<br />
Arrests per 1000 students<br />
Part 1 Crime incidents per 1000 students<br />
% campuses that pass an internal safety audit<br />
Bus accidents per 100,000 miles<br />
Alarm calls – actual calls/false alarms<br />
% emergency drills completed per state statute<br />
% safe school plans submitted on time<br />
% emergency drills that identified a problem<br />
Bullying/harassment incidents per 1000 students<br />
Breakfast participation rate<br />
Preliminary Results<br />
<strong>Elementary</strong> Middle High<br />
Key Issues<br />
‣<br />
2 |<strong>Tulsa</strong> <strong>Public</strong> <strong>Schools</strong> Board of Education Update July 2011
Core Goal: Safe and Secure <strong>Schools</strong><br />
Strategic Objective B<br />
Ensure policies, procedures, strategies, and programs support a positive climate and safe<br />
schools for all students and staff as part of the total academic mission.<br />
Progress and Accomplishments<br />
‣<br />
Measures of Success – data not available<br />
Truancy rate<br />
# referrals to Alternative Education Programs for disciplinary reasons per 1000 students<br />
# suspensions per 1000 students<br />
Student Attendance Rate API<br />
% students meeting state required mandates for immunizations<br />
Avg. time to complete facilities/maintenance work orders<br />
Avg. on time performance (transportation)<br />
% campuses convening Safe School Committee meetings as required<br />
Preliminary Results<br />
Value of lost/stolen/misplaced assets reported<br />
<strong>Elementary</strong> Middle High<br />
Key Issues<br />
‣<br />
3
Financial Sustainability<br />
Measures of Success<br />
Board of Education Update<br />
September 2011
Core Goal: Financial Sustainability<br />
Seek, organize and optimize resources for improved academic results.<br />
Strategic Objective A<br />
Be prudent stewards of District resources through rigorous planning and budgeting, and<br />
build further resources by enhancing public and private support for public education.<br />
Progress and Accomplishments<br />
‣ Project Schoolhouse, which resulted in the closing of 14 school sites, is estimated to result in annual<br />
savings of $5.3 million, under the assumption that all vacant schools are eventually sold. Further,<br />
the Project Schoolhouse format will be revisited annually to evaluate facility utilization and<br />
enrollment trends districtwide.<br />
‣ Implement budget planning process for 2012-13 to capture district-level priorities that are tied to<br />
the 2010-2015 Strategic Plan.<br />
‣ Developed system of planning and managing staff allocations that provides improved budgetary<br />
control.<br />
‣ The Energy Education program has captured savings of $3.3 million in utility costs since<br />
implementation. By focusing efforts during the summer months, July 2011 energy costs were<br />
reduced by 29.95%.<br />
‣ Despite record low interest earnings averaging $2.4 million less than pre-2008-09, TPS maintained<br />
consistent interest earnings in excess of 1- and 2-year Treasury Notes and the Oklahoma Liquid<br />
Asset Pool.<br />
‣ Development of Key Performance Indicators (KPI) will provide measurable comparative data to<br />
monitor progress and identify weaknesses.<br />
‣ Purchasing natural gas through third-party suppliers resulted in savings of $136,683 during FY 2010-<br />
11.<br />
‣ Rebates received by the District through participation in the P-card system were $372,474 during<br />
calendar 2010.<br />
Measures of Success – results data not yet available<br />
Instructional expenditure level as a % of Total General Fund<br />
Expenditures<br />
Current spend vs. encumbered funds as compared to prior year<br />
% bond projects completed on time per bond package<br />
% construction contracts completed + 10% budgeted amount<br />
% campuses who spend “X” % of discretionary funds by<br />
November<br />
% campuses who spend “X”% of discretionary funds by<br />
February<br />
% campuses forfeiting discretionary funds<br />
% campuses forfeiting bond funds<br />
Annual value of negotiated contract savings/additional services<br />
Preliminary Results<br />
2 |<strong>Tulsa</strong> <strong>Public</strong> <strong>Schools</strong> Board of Education Update September, 2011
Core Goal: Financial Sustainability<br />
Key Issues<br />
TPS interest earnings vs. industry indicators<br />
1. Provide support, evaluate recommendations, and implement decisions based on results of<br />
Curriculum & Instruction Implementation Audit.<br />
2. Continue to emphasize the importance of reducing and managing the district’s utility costs.<br />
3. Implementation of new position control system that will streamline the staffing allocation<br />
process.<br />
4. Savings from solicitation activities may be calculated in a variety of ways and we are<br />
evaluating a national initiative in public procurement to standardize on methodology. A<br />
consistent measurement must be identified and manual tracking initiated as there is no<br />
automated mechanism available to collect this data. Data will be only representative as not<br />
all transactions flow through Finance before they are substantially complete. Staffing and<br />
process are challenges.<br />
Strategic Objective B<br />
Effectively manage fiscal resources in compliance with internal and external accountability<br />
requirements and deliver the highest quality financial services to all stakeholders.<br />
Progress and Accomplishments<br />
‣ Received national awards for excellence in financial reporting from the Association of School<br />
Business Officials International (ASBO) and Government Finance Officers’ Association (GFOA); each<br />
for the third consecutive year.<br />
‣ Implemented a new financial reporting system to provide enhanced reporting and monitoring<br />
capabilities. The new system allows users to have real time budget and expense reports along with<br />
the ability to “drill down” to transactional data. The system is a fully integrated Finance/Human<br />
Capital product, which will reduce redundancy of data entry and provide improved internal controls.<br />
‣ The District’s annual audit for 2009-10 reported no instances of material weaknesses and no<br />
questioned costs.<br />
‣ All monthly and annual financial reports and budget documents are available on the District’s web<br />
page.<br />
Measures of Success – results data not available<br />
Fund Balance – General Fund as a % of General Fund revenue<br />
% vendor invoices paid on time<br />
% recurring items on auditors management letter<br />
% accounts receivable for non grant district billing over 60 days<br />
% payroll processed correctly<br />
Preliminary Results<br />
3
Core Goal: Financial Sustainability<br />
Avg. # manual payroll checks issued monthly<br />
Avg. days to submit grant claims from end of period<br />
Key Issues<br />
1. The new financial system provides challenges and opportunities for tracking and evaluating<br />
performance data. We are still in the first months of implementation, so communication and<br />
training continue to be important. However, the system provides a number of opportunities for<br />
improved service delivery through employee self serve and vendor self serve functionality.<br />
2. There is a need for a district-wide customer service survey that would incorporate levels of<br />
service from Finance and all other District support areas.<br />
3. Continuing to balance high quality customer service with the need for efficiency with both<br />
internal and external customers.<br />
4. As school finance becomes more compliance-driven, there is an increasing need for training and<br />
development of departmental employees.<br />
5. Ongoing training for users of the new financial system will be essential to long-term success.<br />
Strategic Objective C<br />
Maximize revenue from state, local, other governmental sources and private/foundation<br />
support.<br />
Progress and Accomplishments<br />
‣ Improve tracking and timeliness of federal and state reimbursement claims. A system of tracking<br />
spreadsheets feed into the master file, providing “at a glance” information on claims paid and those<br />
filed but not paid.<br />
‣ The functionality of the new financial system will streamline the preparation of monthly<br />
reimbursement requests.<br />
Measures of Success – results data not available<br />
% General Fund budget funded by grant dollars<br />
% repeat private funders/partners annually<br />
$ new grants/private funds awarded annually as a % of total grant<br />
Funds<br />
Preliminary Results<br />
Key Issues<br />
1. Develop processes within the Federal Programs department to evaluate grant opportunities<br />
4
Core Goal: Financial Sustainability<br />
with respect to alignment with district priorities, obligation of district resources, and<br />
sustainability.<br />
2. Incorporate state and federal grant programs into the district budget and planning processes.<br />
Strategic Objective D<br />
Support the efforts of Partners in Education, PTA, foundations, individual donors, business<br />
groups, and other community groups and agencies to augment existing District resources.<br />
Progress and Accomplishments<br />
‣ Developed Board Policy and procedures for organizations wishing to be sanctioned by the District,<br />
such as booster clubs, PTA’s, etc.<br />
‣ Developed process for handling major donor contributions to provide budget tracking,<br />
reimbursement claims, and accountability with respect to the donor’s wishes.<br />
Measures of Success – results data not available<br />
Timely access to grant budget<br />
Value of unspent grant funds lost<br />
% grant reports submitted on time<br />
Preliminary Results<br />
Key Issues<br />
1. Clear communication of expectations with donor groups will continue to be important.<br />
2. The new financial system will provide easier tracking of timely grant spending.<br />
5
Performance-Based Culture<br />
Measures of Success<br />
Board of Education Update<br />
June 2011
Core Goal: Performance-Based Culture<br />
Create an environment for sustainable performance improvement and accomplishment of<br />
the District’s Vision, Mission, Core Goals and Core Beliefs.<br />
Strategic Objective A<br />
Improve alignment of District leadership and the community focus on the most critical<br />
District aspirations while fostering an environment of innovation based upon data-driven<br />
decisions.<br />
Progress and Accomplishments<br />
‣ Successful implementation of Project Schoolhouse in partnership with stakeholders and community<br />
‣ Community forums, parent and stakeholder surveys, and public hearings provided extensive<br />
feedback in the district reconfiguration through Project Schoolhouse.<br />
‣ A comprehensive communications plan is under development to effectively build stakeholder<br />
understanding of key initiatives aligned to the strategic plan.<br />
Measures of Success – data not available<br />
% campuses conducting parent/community forums<br />
Avg. response time to complaints/issues reported to Assistant<br />
Superintendents' office<br />
Avg. # Partners in Education (PIE) per campus<br />
Preliminary Results<br />
% campuses with monthly updated websites<br />
<strong>Elementary</strong> Middle High<br />
Key Issues<br />
‣ Implementing change and effectively communicating all aspects of the process to all stakeholders.<br />
Strategic Objective B<br />
Diligently monitor and report staff and student progress on Strategic Plan initiatives to<br />
enhance trust via transparency, promote productive dialogue and determine success via<br />
observable and measureable standards.<br />
Progress and Accomplishments<br />
‣ The first phase of MUNIS implementation is underway with a target completion date of July 1, 2011<br />
for the financial application. The MUNIS system will enhance reporting and data collection functions<br />
that will assist us in monitoring achievement of performance targets. Human Capital department<br />
implementation will follow early next year.<br />
‣ Development of District-Level Measures of Success aligned to the Strategic Plan. This collection of<br />
carefully crafted, developed, and vetted metrics will describe the District's progress toward the<br />
2 |<strong>Tulsa</strong> <strong>Public</strong> <strong>Schools</strong> Board of Education Update June 20, 2011
Core Goal: Performance-Based Culture<br />
accomplishment of the strategic objectives and core goals of the Strategic Plan. Each month, the<br />
Board will be presented with a report regarding the District's progress toward a different core goal.<br />
Twice a year, the Board will receive a report detailing the District's overall progress regarding its<br />
Strategic Plan.<br />
‣ Human Capital and Finance have created department-level scorecards (Measures of Success) that<br />
connect individual and department objectives to district core goals, including student achievement.<br />
Departments began to develop a framework focused on continuous improvement that will be<br />
refined and later replicated by other departments. Ultimately, these scorecards will assist in the<br />
development of performance metrics that will be tied to central office staff performance evaluation.<br />
‣ Value-added reports for the 2009–10 school year have been developed and distributed to<br />
principals. Training has been provided to leadership teams to promote a basic understanding of<br />
value-added analysis. Additional training on how to read, analyze and respond to their reports has<br />
also been delivered. A new 5-tier evaluation system with feedback and support for teachers and<br />
principals was implemented for the 2010–11 school year. The evaluation system parallels SB 2033<br />
(2010 session).<br />
Measures of Success – data not available<br />
Name or describe the survey so others will know what it is measuring?<br />
OU Survey Results*<br />
Teachers Students <strong>Public</strong><br />
Avg. annual score<br />
Avg. volunteer hours per campus<br />
<strong>Elementary</strong> Middle High<br />
Project/Initiative Implemented on Time Within Budget Reported on Time<br />
Munis<br />
Value-Added<br />
Evaluations<br />
% all projects/initiatives<br />
Project/Initiative Implemented on Time Within Budget Reported on Time<br />
*The OU Survey measures collective trust in schools from the parent, student, and faculty perspective.<br />
Collective trust is a key component of school effectiveness and educational improvement.<br />
Key Issues<br />
‣ Technology solutions for the entry, analysis and data reporting of performance metrics as well as<br />
evaluation data are currently inadequate. The Finance and HC Departments are pursuing a technology<br />
solution that will interface with the new MUNIS system.<br />
3
Core Goal: Performance-Based Culture<br />
Strategic Objective C<br />
Develop coherent professional development content and delivery systems that support the<br />
strategic initiatives and build professional learning in all work environments.<br />
Progress and Accomplishments<br />
‣ A TPS conference for building leaders⎯Great Educators Make Great <strong>Schools</strong>⎯ took place in June to<br />
kick off a year of focused professional development for district leadership. Training provided during<br />
this conference included the following focus areas:<br />
o Value-Added – an introduction to value-added as well as in depth analysis of campus<br />
reports<br />
o Cultural Competencies<br />
o Common Core<br />
o Formative Instruction Practices – Descriptive Feedback<br />
o Formative Instructional Practices – Clear Learning Targets<br />
‣ A new evidence-based leadership development plan is under development, with plans to implement<br />
during the 2011–12 school year. Plan will include: a staff development teacher (master<br />
teacher/coach) program; a principal development (pipeline) program; a new principal induction<br />
program; continuing support and training for veteran principals in the above mentioned focus areas;<br />
and expanded learning opportunities for central office staff.<br />
‣ Value-Added Roll Out<br />
o Targeted training for schools' leadership teams was provided at the June leadership<br />
conference to promote a basic understanding of value-added analysis as well as how to read,<br />
analyze and respond to their school-level value added reports. Additional training on the use<br />
of value-added data and reports will be provided in 2011–12.<br />
o The core team of central office administrators involved with value-added scoring was<br />
provided training in value-added modeling and reporting.<br />
o<br />
Teacher training in value-added will be provided during 2011–12 and will include group<br />
sessions, open labs, online instruction, etc.<br />
‣ TLE Indicator-specific workshops and sessions have been held on the following topics:<br />
o INSTRUCTIONAL EFFECTIVENESS – A Six-Part Series on the “How To” of Differentiated<br />
Instruction<br />
o CLASSROOM MANAGEMENT – Successful Strategies for Working with the Defiant Child<br />
o INSTRUCTIONAL EFFECTIVENESS – Differentiating Reading Instruction in the Content Areas<br />
‣ Summer 2011 professional development has been designed and scheduled to improve performance<br />
in specific areas identified frequently as low-performing in the evaluations. Specifically:<br />
o 13a. & 11b. Use of data to modify instruction and guide intervention. Methods for students<br />
to track their own effort and accomplishments & collaboration.<br />
o 11g. Re-teaches learning that is not mastered in different ways<br />
o 13c. Appropriately and consistently adheres to IEPs and modifies assignments for special<br />
education populations if required in the IEP.<br />
o 12a. & 10b. Summarizes or teaches students to summarize new learning in a variety of ways.<br />
4
Core Goal: Performance-Based Culture<br />
Uses different types of student response techniques, both individual and group. 2. & 3b.<br />
Clearly defines expected student behavior. Follows the procedures to protect the health and<br />
safety of all students & Moves around the room while students are working independently.<br />
o 4. & 6a. Plans for the delivery of the lesson relative to short term and long term objective.<br />
Require participation of all students and engages learners in active learning 80% or more of<br />
the time.<br />
Measures of Success – data not available<br />
TLE Professional Development hours/staff<br />
# strategic initiative trainings offered to staff<br />
% campuses with > 85% staff completing value-added professional<br />
development<br />
Preliminary Results<br />
Key Issues<br />
Strategic Objective D<br />
Replicate success models and turn around low-performing schools.<br />
Progress and Accomplishments<br />
‣ Campus level value added data for the 2009–10 school year is currently available. Campus and<br />
district leaders have been trained in the evaluation and analysis of their data. Planned responses to<br />
the data can be developed and implemented to improve success at low-performing schools.<br />
‣ Performance results for School Improvement Grant (SIG) schools are being analyzed to inform<br />
future plans to increase student achievement.<br />
‣ Campuses will use student performance data including API and value-added to develop action plans<br />
to improve student achievement.<br />
Measures of Success – data not available<br />
Avg. value-added score of campuses<br />
identified as low performing<br />
Avg. value-added score of the district<br />
+/- difference in avg. value-added score<br />
between low-performing schools and the<br />
District.<br />
Avg. API score of campuses<br />
identified as low performing<br />
Avg. API score of District/State campuses<br />
Math Reading Science Social Studies Writing<br />
Preliminary Results<br />
5
Core Goal: Performance-Based Culture<br />
+/- difference in avg. API scores between low-performing schools<br />
and District/State.<br />
% campuses identified as low performing<br />
Preliminary Results<br />
Key Issues<br />
Strategic Objective E<br />
Adopt a District-wide accountability system to ensure the success of all schools with<br />
progress reporting/sharing via data walls, data dashboards, etc. Inherent in this<br />
accountability system will be the expansion of successful schools, programs and practices,<br />
and holding schools accountable for dramatic, documentable and sustainable<br />
improvement.<br />
Progress and Accomplishments<br />
‣ The District's data dashboards will be evaluated and redesigned in 2011–12 to improve their<br />
usefulness to teachers and leaders in their efforts to improve student and school achievement.<br />
‣ Campus' use of data dashboards and other data sources will be tracked.<br />
‣ School-level value-added reports for the 2009–10 school year have been distributed to principals.<br />
School leaders have also been provided access to an online portal regarding value-added data<br />
school-level reports.<br />
‣ The District's automated evaluation system in 2011–12 will generate reports on key points of<br />
information (aggregate performance scores by indicator, distribution of scores within and among<br />
campuses, etc.) The District's accountability/reporting systems (data walls, dashboards, etc.) will<br />
link with and report this evaluation information.<br />
‣ The District's automated evaluation system in 2011–12 will identify district, school, principal and<br />
teacher-level professional development needs based upon teacher and leaders' evaluation results,<br />
allowing for professional development to be aligned with teacher and leaders’ performance on each<br />
evaluation indicator. The District's accountability/reporting systems (data walls, dashboards, etc.)<br />
will link with and report this professional development needs data.<br />
Measures of Success – data not available<br />
% District accountability measures reported on time<br />
% campuses utilizing data dashboards monthly<br />
% campuses with an increased API score<br />
Preliminary Results<br />
Key Issues<br />
6
2011–2012 Balanced Scorecard<br />
Finance Department<br />
Chief Financial Officer: Trish Williams<br />
Core Goal: Student Achievement<br />
STRATEGIC OBJECTIVE: Create an exceptional learning environment, via enhanced<br />
curricular and instructional offerings and practices, that prepares students to pursue<br />
college and work-force ready opportunities and to subsequently become effective,<br />
productive and contributing citizens.<br />
DEPT. GOAL: Establish and standardize practices to ensure prompt response to all<br />
requests to ensure necessary resources are available on time.<br />
Results Actual Target<br />
% warehouse orders filled accurately<br />
Avg. number of manual add on warehouse orders processed/month<br />
Avg. time to complete RFP process (approved requisition to<br />
encumbrance date)<br />
Meets or exceeds target Does not meet target by 20% Does not meet target by more than 20%<br />
Core Goal: Teacher and Leader Effectiveness<br />
STRATEGIC OBJECTIVE: Structure central administration and human capital resources and<br />
establish systems and processes to support schools and enable campus leadership to focus<br />
on student growth and achievement.<br />
DEPT. GOAL: Deliver excellent service and customer service to correct problems<br />
in a timely manner.<br />
Results Actual Target<br />
Avg. approval time in requisition workflow (Req. created to approved<br />
Avg. time to issue a P.O. (Approved req. to encumbrance)<br />
Avg. customer service score from customer survey<br />
Avg. # manual/off cycle payroll checks monthly<br />
Meets or exceeds target Does not meet target by 20% Does not meet target by more than 20%<br />
Core Goal: Performance Based Culture<br />
STRATEGIC OBJECTIVE: Develop coherent professional development content and delivery<br />
systems that support the strategic initiatives and build professional learning in all work<br />
environments.<br />
DEPT. GOAL: Identify and support appropriate professional development for<br />
finance staff.<br />
Results Actual Target<br />
% ES campuses with > 2 active system users<br />
% secondary campuses with > 3 active system users<br />
% staff completing > 4 hrs. job specific professional development<br />
% department staff evaluations completed on time<br />
Meets or exceeds target Does not meet target by 20% Does not meet target by more than 20%<br />
Profile<br />
Mission<br />
To provide a quality learning<br />
experience for every student,<br />
every day, without exception.<br />
Vision<br />
Excellence and High<br />
Expectations with a<br />
Commitment to All<br />
Core Beliefs<br />
• Effective leaders and<br />
classroom teachers have a<br />
profound impact on<br />
children’s lives.<br />
• All children can learn and<br />
TPS can close the<br />
achievement gap.<br />
• TPS can be an efficient,<br />
effective, performancebased<br />
organization.<br />
• Community collaboration is<br />
fundamental to achieving<br />
and sustaining excellence.<br />
• TPS should provide a safe,<br />
healthy learning<br />
environment for all<br />
students and staff.<br />
Location<br />
3027 S New Haven Ave.<br />
<strong>Tulsa</strong>, OK 74117<br />
918.746.6800<br />
www.tulsaschools.org<br />
District Overview<br />
<strong>Tulsa</strong> <strong>Public</strong> <strong>Schools</strong> is<br />
Northeastern Oklahoma’s<br />
largest and most dynamic school<br />
district with nearly 42,000<br />
thousand students, 7,000<br />
employees, 75 campuses, 250<br />
school buses and about 173<br />
square miles.<br />
© 2011, <strong>Tulsa</strong> <strong>Public</strong> <strong>Schools</strong> www.<strong>Tulsa</strong><strong>Schools</strong>.org
2011–2012 Balanced Scorecard<br />
Finance Department<br />
Chief Financial Officer: Trish Williams<br />
STRATEGIC OBJECTIVE: Adopt a District-wide accountability system to ensure the success<br />
of all schools with progress reporting/sharing via data walls, data dashboards, etc.<br />
DEPT. GOAL: Implement a comprehensive financial system, examine TPS<br />
practices, and adopt and communicate best practices throughout the district.<br />
Results Actual Target<br />
% school allocations completed within 2 weeks of final forecast<br />
% campuses who spend 40% of unrestricted funds by Dec. 1<br />
% campuses who spend 80% of unrestricted funds by March 1<br />
% campuses/departments attending an annual Finance training<br />
% unrestricted fund dollars swept from campuses (as a % of total<br />
unrestricted funds allocated)<br />
% bond fund dollars swept from campuses (as a % of total bond<br />
funds allocated)<br />
Meets or exceeds target Does not meet target by 20% Does not meet target by more than 20%<br />
Core Goal: Financial Stability<br />
STRATEGIC OBJECTIVE: Be prudent stewards of District resources through rigorous<br />
planning and budgeting, and build further resources by enhancing public and private<br />
support for public education.<br />
DEPT. GOAL: Provide timely and accurate implementation and administration of<br />
annual district budgets.<br />
Results Actual Target<br />
Actual to budget (by fund – expenditures and revenue)<br />
# budget amendments per year<br />
Annual value of negotiated contract savings/ additional services<br />
% over/under department operating budget (all funds)<br />
Meets or exceeds target Does not meet target by 20% Does not meet target by more than 20%<br />
STRATEGIC OBJECTIVE: Effectively manage fiscal resources in compliance with internal and<br />
external accountability requirements and deliver the highest quality financial services to<br />
all stakeholders.<br />
DEPT. GOAL: Benchmark financial performance against industry standards.<br />
Results Actual Target<br />
District administrative costs compared to OK statute requirements<br />
Avg. # days to process a vendor payment (receipt to payment)<br />
Fund Balance – General fund as a % of general fund revenue<br />
% of invoices paid > 60 days from invoice date<br />
Instructional expenditure level as a % of total general fund<br />
expenditures.<br />
Meets or exceeds target Does not meet target by 20% Does not meet target by more than 20%<br />
© 2011, <strong>Tulsa</strong> <strong>Public</strong> <strong>Schools</strong> www.<strong>Tulsa</strong><strong>Schools</strong>.org
2011–2012 Balanced Scorecard<br />
Finance Department<br />
Chief Financial Officer: Trish Williams<br />
STRATEGIC OBJECTIVE: Maximize revenue from state, local, other governmental sources<br />
and private/foundation support.<br />
DEPT. GOAL: Monitor claims and allocations to maximize impact to the district.<br />
Results Actual Target<br />
% eligible grant claims submitted within 2 weeks of month end close<br />
% grant claims filed that are paid without submitting additional<br />
information/corrections (i.e. “one and done”)<br />
Meets or exceeds target Does not meet target by 20% Does not meet target by more than 20%<br />
STRATEGIC OBJECTIVE: Support the efforts of Partners in Education, PTA, foundations,<br />
individual donors, business groups, and other community groups and agencies to augment<br />
existing district resources.<br />
DEPT GOAL: Accept and track donated funds in accordance with donor directions.<br />
Results Actual Target<br />
% gifts spent during the fiscal year donated<br />
Meets or exceeds target Does not meet target by 20% Does not meet target by more than 20%<br />
Core Goal: Safe and Secure <strong>Schools</strong><br />
STRATEGIC OBJECTIVE: Ensure that policies and procedures are in place that identify and<br />
promote strategies, promising practices and programs that support positive climate and<br />
safe schools for all students and staff as part of the total academic mission.<br />
DEPT. GOAL: Implement policies and procedures to ensure excellent customer<br />
service.<br />
Results Actual Target<br />
% of vendor payments that are returned<br />
% misplaced/lost/stolen inventory within schools as a total cost of<br />
fixed assets<br />
% misplaced/lost/stolen inventory within central office departments<br />
as a total cost of fixed assets<br />
Meets or exceeds target Does not meet target by 20% Does not meet target by more than 20%<br />
© 2011, <strong>Tulsa</strong> <strong>Public</strong> <strong>Schools</strong> www.<strong>Tulsa</strong><strong>Schools</strong>.org
2011–2012 Balanced Scorecard<br />
Human Capital<br />
Executive Director of Human Capital: Ken Calhoun<br />
Core Goal: Teacher and Leader Effectiveness<br />
STRATEGIC OBJECTIVE: Implement a new, innovative and fair evaluation system for all TPS<br />
staff that is based upon feedback and support and is aligned to enacted Oklahoma<br />
legislation.<br />
DEPT. GOAL: Implement and maintain a comprehensive evaluation system for all<br />
district staff.<br />
EVALUATION PROCESS Results Actual Target<br />
% department staff evaluations completed on time 100%<br />
% evaluations completed on time – teachers 100%<br />
% evaluations completed on time – principals 100%<br />
% evaluations completed on time – non instructional staff 100%<br />
Avg. time to assign a performance support mentor (PDP date to<br />
assignment)<br />
3 days<br />
Avg. time to implement a performance support mentor (PDP date<br />
to first meeting)<br />
% teachers on a improvement plan (Quest) with an improved<br />
rating<br />
Meets or exceeds target Does not meet target by 20% Does not meet target by more than 20%<br />
10 wkg.<br />
days<br />
Benchmark<br />
STRATEGIC OBJECTIVE: Continue the enhancement of human capital functions that<br />
assures: 1) a pipeline of high quality principals, teachers and staff, prepared to be effective<br />
in an urban setting; 2) targeted and coordinated evidence-based development of leaders<br />
and teachers.<br />
DEPT. GOAL: Develop, explore and leverage opportunities to provide a<br />
continuous qualified pipeline for district staff.<br />
PIPELINE/INDUCTION Results Actual Target<br />
% of teacher applicants scoring >72 on Gallup instrument<br />
% participants in partnership programs scoring > 72 on the<br />
Gallup instrument<br />
% of teachers scoring >3 on evaluation who graduated from<br />
TPS recruited higher education programs (after 2 years)<br />
% teachers scoring > 3 on evaluation who completed an urban<br />
teacher preparation program (after 2 yrs)<br />
% teachers scoring > 3 on evaluation (after 2 years)<br />
Average evaluation score of new teachers assigned NTC mentors<br />
(New Teacher Center mentoring program for 1 st and 2 nd year teachers )<br />
Avg. length of time lapsed to assign a new teacher to a mentor<br />
% leaders scoring > 3 on evaluation who completed the revised<br />
leadership development program<br />
Meets or exceeds target Does not meet target by 20% Does not meet target by more than 20%<br />
Profile<br />
Mission<br />
To provide a quality learning<br />
experience for every student,<br />
every day, without exception.<br />
Vision<br />
Excellence and High<br />
Expectations with a<br />
Commitment to All<br />
Core Beliefs<br />
• Effective leaders and<br />
classroom teachers have a<br />
profound impact on<br />
children’s lives.<br />
• All children can learn and<br />
TPS can close the<br />
achievement gap.<br />
• TPS can be an efficient,<br />
effective, performancebased<br />
organization.<br />
• Community collaboration is<br />
fundamental to achieving<br />
and sustaining excellence.<br />
• TPS should provide a safe,<br />
healthy learning<br />
environment for all<br />
students and staff.<br />
Location<br />
3027 S New Haven Ave.<br />
<strong>Tulsa</strong>, OK 74117<br />
918.746.6800<br />
www.tulsaschools.org<br />
District Overview<br />
<strong>Tulsa</strong> <strong>Public</strong> <strong>Schools</strong> is<br />
Northeastern Oklahoma’s<br />
largest and most dynamic school<br />
district with nearly 42,000<br />
thousand students, 7,000<br />
employees, 75 campuses, 250<br />
school buses and about 173<br />
square miles.<br />
© 2011, <strong>Tulsa</strong> <strong>Public</strong> <strong>Schools</strong> www.<strong>Tulsa</strong><strong>Schools</strong>.org
2011–2012 Balanced Scorecard<br />
Human Capital<br />
Executive Director of Human Capital: Ken Calhoun<br />
STRATEGIC OBJECTIVE: Structure central administration and human capital resources and<br />
establish systems and processes to support schools and enable campus leadership to focus<br />
on student growth and achievement.<br />
DEPT. GOAL: Manage systems and processes to support campuses by providing<br />
essential services and resources.<br />
Recruiting/Retention Results Actual Target<br />
Avg. time to complete hiring process (recommendation to position<br />
filled)<br />
Avg. time to fill a job opening (vacancy to fill)<br />
Avg. time to recommend candidates for job openings (vacancy<br />
notification/occurrence to recommendation)<br />
Ratio of early contracts as compared to resignations/retirements<br />
Staff turnover rate (certified, support, administration)<br />
% teacher positions open on the first day of school<br />
Number of grievances filed<br />
% formal grievances resolved prior to TPS Board involvement<br />
Teacher Retention rate by evaluation score<br />
% teachers exited for performance<br />
% teachers scoring >4 on their evaluation leaving TPS<br />
Meets or exceeds target Does not meet target by 20% Does not meet target by more than 20%<br />
STRATEGIC OBJECTIVE: Create a culture of high expectations for academic achievement<br />
and conduct that makes no excuses based on the student’s demographics and/or<br />
socioeconomic status.<br />
DEPT. GOAL: Ensure that hiring, evaluation and mentoring processes support the<br />
equitable distribution of talent to the highest identified needs areas/campuses.<br />
Results Actual Target<br />
% teachers scoring > 3 on evaluation indicator #9 (regarding<br />
involvement of all learners)<br />
Comparison – evaluation scores 5 high/5 low performing campuses<br />
(ES/MS/HS)<br />
Comparison – evaluation scores SIG campuses/district average<br />
% teachers scoring > 4 on evaluation retained at high needs<br />
campuses<br />
% teachers/leaders/mentors receiving professional development<br />
focused on supporting high academic achievement of minority<br />
and low income students<br />
% teachers scoring > 4 who transfer to a lower performing campus<br />
Meets or exceeds target Does not meet target by 20% Does not meet target by more than 20%<br />
© 2011, <strong>Tulsa</strong> <strong>Public</strong> <strong>Schools</strong> www.<strong>Tulsa</strong><strong>Schools</strong>.org
2011–2012 Balanced Scorecard<br />
Human Capital<br />
Executive Director of Human Capital: Ken Calhoun<br />
STRATEGIC OBJECTIVE: Explore opportunities for increasing academic learning time so<br />
students will have more time in the classroom to acquire the academic knowledge and skills<br />
that will prepare them for work-force or college entry, and subsequent career decision<br />
making.<br />
DEPT. GOAL: In collaboration with stakeholders improve hiring policies and<br />
practices that will increase students’ academic learning time in the classroom.<br />
Leave Management /Staff Improvement Results Actual Target<br />
% instructional days lost due to teacher absences<br />
% instructional days lost due to teacher professional development<br />
% approved Leaves of Absence (LOA) that contain all required<br />
documentation<br />
% employees returning from LOA on time<br />
% teachers absent > 10 instructional days (NOT due to approved LOA)<br />
Annual rate substitutes requested/substitutes filled<br />
(by high needs & ES/MS/HS)<br />
Meets or exceeds target Does not meet target by 20% Does not meet target by more than 20%<br />
Core Goal: Performance Based Culture<br />
STRATEGIC OBJECTIVE: Diligently monitor and report staff and student progress on<br />
Strategic Plan initiatives to enhance trust via transparency, promote productive dialogue<br />
and determine success via observable and measureable standards.<br />
DEPT. GOAL: Increase positive visibility and public awareness by providing timely,<br />
relevant and accurate information to all stakeholders.<br />
Results Actual Target<br />
% HC initiative updates provided on time (i.e. measures of success)<br />
% pipeline related performance results distributed to partners<br />
on time<br />
Principal Survey – Customer Responsiveness; Knowledge; etc.<br />
% quarterly attendance information reports distributed to<br />
campuses on time<br />
Meets or exceeds target Does not meet target by 20% Does not meet target by more than 20%<br />
STRATEGIC OBJECTIVE: Develop coherent professional development content and delivery<br />
systems that support the strategic initiatives and build professional learning in all work<br />
environments.<br />
DEPT. GOAL: Coordinate and align programs and systems that increase the<br />
knowledge base of department and campus staff.<br />
Professional Development Results Actual Target<br />
% teachers participating in professional development aligned to<br />
evaluation<br />
% leaders participating in professional development aligned to<br />
evaluation<br />
© 2011, <strong>Tulsa</strong> <strong>Public</strong> <strong>Schools</strong> www.<strong>Tulsa</strong><strong>Schools</strong>.org
2011–2012 Balanced Scorecard<br />
Human Capital<br />
Executive Director of Human Capital: Ken Calhoun<br />
% staff participating in > “X” hours of job specific professional<br />
development annually<br />
% professional development classes offered outside of the<br />
instructional day<br />
# hours of professional development (aligned to TEI indicators)<br />
provided to teachers scoring 2 or below<br />
# hours of professional development focused on strategic<br />
initiatives completed by ESC staff<br />
Avg. hrs professional development for teachers in the NTC (hours<br />
completed vs. hours recommended)<br />
% teachers/principals with improved evaluation score that attended<br />
professional development<br />
Meets or exceeds target Does not meet target by 20% Does not meet target by more than 20%<br />
Core Goal: Financial Stability<br />
STRATEGIC OBJECTIVE: Effectively manage fiscal resources in compliance with internal and<br />
external accountability requirements and deliver the highest quality financial services to all<br />
stakeholders.<br />
DEPT. GOAL: Efficiently manage department resources to provide the highest,<br />
most effective level of service with the funding provided.<br />
Results Actual Target<br />
Percentage of new hires on payroll for first pay period without error<br />
Percentage of teachers hired that matched allocations<br />
% over/under department operating budget<br />
# processes converted to an on-line format<br />
% teachers required transferred at the start of each school year<br />
Meets or exceeds target Does not meet target by 20% Does not meet target by more than 20%<br />
Core Goal: Safe and Secure <strong>Schools</strong><br />
STRATEGIC OBJECTIVE: Ensure that policies and procedures are in place that identify and<br />
promote strategies, promising practices and programs that support positive climate and<br />
safe schools for all students and staff as part of the total academic mission.<br />
DEPT. GOAL: Utilize preventive planning and increase safety awareness through<br />
policies and procedures to minimize risks to students, staff and the community.<br />
Results Actual Target<br />
Accident frequency rate<br />
Lost time accident frequency rate<br />
% of staff completing safety training (by department)<br />
Approved workers’ compensation claims<br />
% campuses with > 3 average on classroom management<br />
evaluation indicators<br />
Meets or exceeds target Does not meet target by 20% Does not meet target by more than 20%<br />
© 2011, <strong>Tulsa</strong> <strong>Public</strong> <strong>Schools</strong> www.<strong>Tulsa</strong><strong>Schools</strong>.org
2011–2012 Balanced Scorecard<br />
Department: Campus Police<br />
Department Leader: Chief Gary Rudick<br />
Core Goal: Student Achievement<br />
STRATEGIC OBJECTIVE: Examine District programs needed to deliver academic excellence<br />
with a focus on the elimination of achievement gaps among all subgroups of students.<br />
DEPT. GOAL: Collaborate with community and TPS Partners to improve student<br />
attendance.<br />
Results Actual Target<br />
Improve % of reduction in annual truancy (as defined by the<br />
5%<br />
District) rates using district measurements of truancy<br />
Improve % student attendance rates by truancy enforcement and<br />
5%<br />
Home visits when necessary.<br />
Avg. number of home visits per month for purposes of<br />
6<br />
assessing absence reasons and to check well-being of students.<br />
Meets or exceeds target Does not meet target by 20% Does not meet target by more than 20%<br />
Core Goal: Teacher and Leader Effectiveness<br />
STRATEGIC OBJECTIVE: Structure central administration and human capital resources and<br />
establish systems and processes to support schools and enable campus leadership to focus<br />
on growth and achievement.<br />
DEPT. GOAL: Attract and the retrain regularly the most highly qualified public safety<br />
personnel to serve within the unique demands of an educational environment.<br />
Results Actual<br />
% of sworn employees exceeding the State requirements for<br />
continuing education as mandated by the State of Oklahoma on an<br />
annual basis.<br />
% of personnel including contract employees who are certified and<br />
Retrained annually on the District’s mandate for interaction with<br />
Special Needs students, specifically MANDT training.<br />
Target<br />
100%<br />
100%<br />
DRAFT<br />
STRATEGIC OBJECTIVE: Create a culture of high expectations for academic achievement and<br />
Conduct that makes no excuses based on the student’s demographics and/or socio-<br />
Economic status.<br />
DEPT. GOAL: Reduce Disproportionate Minority Contact (DMC) levels as it relates to<br />
students placed under arrest and referred to Juvenile Bureau District Court.<br />
Results Actual Target<br />
DMC infers disproportionate treatment of youth within the criminal<br />
5%<br />
Justice system. TPS PD will work to reduce the ratio of DMC within<br />
the City of <strong>Tulsa</strong> in compliance with the request of the State DMC<br />
initiative and the programs sponsored by the U.S. Attorney’s<br />
Office for the Northern District of Oklahoma.<br />
Reduce the % of criminal cases declined annually by the District<br />
25%<br />
Attorney’s office due to officer error.<br />
Profile<br />
Mission<br />
The Mission of the <strong>Tulsa</strong> <strong>Public</strong><br />
<strong>Schools</strong> Campus Police is to provide<br />
a safe environment, free from fear<br />
and with emphasis on an improved<br />
quality of life within the School<br />
District for all students, faculty, staff<br />
and authorized visitors.<br />
We do so with pride, integrity and a<br />
commitment to quality services<br />
within the policing profession.<br />
Fast Facts:<br />
The Campus Police Department is<br />
comprised of 21 sworn police<br />
officers, 20 security officers and 14<br />
non-sworn employees. We are a<br />
certified law enforcement agency<br />
will full police powers under<br />
statute of the State of Oklahoma.<br />
Description:<br />
Officers of the TPS Campus Police<br />
Department are stationed at each<br />
High School site and are<br />
responsible for supervising the<br />
security staff and working in<br />
concert and cooperation with the<br />
building principal and school staff<br />
to provide a safe school<br />
environment. Campus Police<br />
administration maintain private<br />
security contracts that support our<br />
employees at schools across the<br />
district on a regular basis. We are<br />
also responsible for security<br />
services at over 600 special events,<br />
including all athletic events,<br />
throughout the school year.<br />
In addition to policing services, the<br />
campus police are responsible for<br />
monitoring and maintaining over<br />
44,000 alarm sensors for<br />
monitoring on a 24/7 basis, nearly<br />
2400 surveillance cameras, and<br />
issues related to Emergency<br />
Management and safety.<br />
Location<br />
3027 S New Haven Ave.<br />
<strong>Tulsa</strong>, OK 74117<br />
918.746.6800<br />
www.tulsaschools.org<br />
Awards/Recognitions<br />
None<br />
© 2011, <strong>Tulsa</strong> <strong>Public</strong> <strong>Schools</strong> www.<strong>Tulsa</strong><strong>Schools</strong>.org
2011–2012 Balanced Scorecard<br />
Department: Campus Police<br />
Department Leader: Chief Gary Rudick<br />
Core Goal: Performance Based Culture<br />
STRATEGIC OBJECTIVE: Improve alignment of District leadership and the community focus<br />
on the most critical District aspirations while fostering an environment of innovation<br />
based upon data-driven decisions.<br />
DEPT. GOAL: Respond effectively and efficiently to calls for service as it relates<br />
to repairs and service on surveillance cameras, fire and intrusion alarms and the<br />
open options door access systems.<br />
Results Actual Target<br />
% of completed work orders on Surveillance Cameras in 15 days 100%<br />
% of fire and intrusion alarm work orders completed in 30 days 100%<br />
% of door access work orders completed in 10 days 100%<br />
Meets or exceeds target Does not meet target by 20% Does not meet target by more than 20%<br />
Core Goal: Financial Stability<br />
STRATEGIC OBJECTIVE: Maximize revenue from state, local, other governmental sources<br />
and private/foundation support.<br />
DEPT. GOAL: Implement processes and procedures to utilize allocated financial<br />
resources efficiently and effectively.<br />
Results Actual Target<br />
Over/under department operating budget<br />
within<br />
% of security contracts reviewed and renewed or amended annually 100%<br />
# of grant or private funding support obtained specific to safety or<br />
1<br />
Policing in an educational environment.<br />
Meets or exceeds target Does not meet target by 20% Does not meet target by more than 20%<br />
Core Goal: Safe and Secure <strong>Schools</strong><br />
STRATEGIC OBJECTIVE: Create a caring, safe and secure environment that enables<br />
teaching and learning to take place.<br />
DEPT. GOAL: Provide specialized instruction to students and staff via scheduled<br />
seminars and special programs.<br />
Results Actual Target<br />
Criminal Street Gang seminars for faculty/staff annually 4<br />
Participate in City sponsored Youth Initiatives 2<br />
Coordinate district sponsored Emergency Response training events,<br />
1<br />
either live exercise or tabletop exercise, annually<br />
DRAFT<br />
Meets or exceeds target Does not meet target by 20% Does not meet target by more than 20%<br />
STRATEGIC OBJECTIVE: Ensure that policies and procedures are in place that identify and<br />
promote strategies, promising practices and programs that support positive climate and<br />
safe schools for all students and staff as part of the total academic mission.<br />
DEPT. GOAL: Review and refine policies and procedures for the Campus Police.<br />
Results Actual Target<br />
Annual Campus Police Policy review and update 100%<br />
Annual Emergency Management policy review and update 100%<br />
Annual Alarm and Camera policy reviews and update 100%<br />
# of policy violations by personnel recorded annually 0<br />
Meets or exceeds target Does not meet target by 20% Does not meet target by more than 20%<br />
© 2011, <strong>Tulsa</strong> <strong>Public</strong> <strong>Schools</strong> www.<strong>Tulsa</strong><strong>Schools</strong>.org
2011–2012 Balanced Scorecard<br />
Department: Communications/<strong>Public</strong> Information<br />
Department Leader: Chris Payne<br />
Core Goal: Student Achievement<br />
STRATEGIC OBJECTIVE: Develop a learning culture within our students that focuses on a<br />
love for learning, problem solving ability, intellectual curiosity, passion for the arts and a<br />
valuing of physical wellness.<br />
DEPT. GOAL: Be supportive of TPS departments that affect student achievement<br />
and inform internal and external audiences to broaden their understanding of<br />
our initiatives.<br />
Metrics (Measures that show progress toward identified goal) Results Actual Target<br />
Media usage (+/-) content analysis<br />
Comments at public forums and board meetings<br />
Social media channels – conversation/feedback<br />
Parental support for key programs<br />
# people subscribed to e-news<br />
Avg. time to distribute messages/post information to the web<br />
Survey/comments from TPS departments w/ direct impact on<br />
student achievement<br />
Meets or exceeds target Does not meet target by 20% Does not meet target by more than 20%<br />
Core Goal: Teacher and Leader Effectiveness<br />
STRATEGIC OBJECTIVE: Create a culture of high expectations for academic achievement<br />
and conduct that makes no excuses based on the student’s demographics and/or<br />
socioeconomic status.<br />
STRATEGIC OBJECTIVE: Develop, track and communicate clear outcome measures for<br />
student learning goals and organizational goals in order to precisely monitor work that<br />
will make a difference in student achievement. Develop a system for shared accountability<br />
for results.<br />
DRAFT<br />
DEPT. GOAL: Actively support the efforts of the TLE Department and the district<br />
at large by communicating the latest trends, improvements and programs that<br />
TPS is undertaking to improve teacher/leader effectiveness.<br />
Metrics (Measures that show progress toward identified goal) Results Actual Target<br />
Measure internal teacher/employee support for TLE<br />
Media coverage (positive/negative)<br />
<strong>Public</strong>/partner support – editorials in support of the new system<br />
Legislative support – in terms of voting outcomes<br />
Social media – public comments on Facebook/Twitter<br />
Meets or exceeds target Does not meet target by 20% Does not meet target by more than 20%<br />
Profile<br />
Mission:<br />
2. Develop and maintain<br />
positive, collaborative<br />
relationships with all<br />
stakeholders to<br />
strengthen support for<br />
<strong>Tulsa</strong> <strong>Public</strong> <strong>Schools</strong> and<br />
improve student<br />
achievement.<br />
Fast Facts: Responsible for<br />
internal/external communications,<br />
including the TPS<br />
website, social media, digital TV<br />
Channel 107.20 and many other<br />
communication channels.<br />
Description<br />
Location<br />
3027 S New Haven Ave.<br />
<strong>Tulsa</strong>, OK 74117<br />
918.746.6800<br />
www.tulsaschools.org<br />
Awards/Recognitions<br />
© 2011, <strong>Tulsa</strong> <strong>Public</strong> <strong>Schools</strong> www.<strong>Tulsa</strong><strong>Schools</strong>.org
2011–2012 Balanced Scorecard<br />
Department: Communications/<strong>Public</strong> Information<br />
Department Leader: Chris Payne<br />
Core Goal: Performance Based Culture<br />
STRATEGIC OBJECTIVE: Improve alignment of District leadership and the community focus<br />
on the most critical District aspirations while fostering an environment of innovation<br />
based upon data-driven decisions.<br />
DEPT. GOAL: Improve TPS’ reputation among parents, students, teachers,<br />
administrators, district employees and the community at large by showing them<br />
what we are doing to change performance and ultimately the positive impact on<br />
student achievement.<br />
Metrics (Measures that show progress toward identified goal) Results Actual Target<br />
Employee survey – climate/engagement<br />
External feedback – Dr. Ballard’s advisory groups; comments<br />
Parent/community perceptions – online survey results<br />
Improved student test scores<br />
Fewer teachers on probation<br />
News media stories (positive/negative)<br />
Meets or exceeds target Does not meet target by 20% Does not meet target by more than 20%<br />
Core Goal: Financial Sustainability<br />
STRATEGIC OBJECTIVE: Be prudent stewards of District resources through rigorous planning<br />
and budgeting, and build further resources by enhancing public and private support for<br />
public education.<br />
STRATEGIC OBJECTIVE: Support the efforts of Partners in Education, PTA, foundations,<br />
individual donors, business groups, and other community groups and agencies to augment<br />
existing District resources.<br />
DEPT. GOAL: Improve the reputation of TPS in the <strong>Tulsa</strong> community to showcase<br />
the district’s keen ability to leverage all financial resources efficiently in tough<br />
economic times.<br />
Metrics (Measures that show progress toward identified goal) Results Actual Target<br />
<strong>Public</strong> perception of how well we manage our finances<br />
Partner support of our programs – financial<br />
Legislative support – increased $ if they think we are effective<br />
<strong>Public</strong> forums/building meetings – informal feedback<br />
Media stories –finance related (positive/negative)<br />
Meets or exceeds target Does not meet target by 20% Does not meet target by more than 20%<br />
Core Goal: Safe and Secure <strong>Schools</strong><br />
DRAFT<br />
STRATEGIC OBJECTIVE: Create a caring, safe and secure environment that enables<br />
teaching and learning to take place.<br />
DEPT. GOAL: Communicate and illustrate to parents, employees, and the <strong>Tulsa</strong><br />
community all of the ways in which TPS works to keep staff and students safe<br />
both en route and in our schools.<br />
Metrics (Measures that show progress toward identified goal) Results Actual Target<br />
Growth in students/parents using TIPS online reporting system<br />
Decrease in # of incidents (assaults, guns, etc.)<br />
Meets or exceeds target Does not meet target by 20% Does not meet target by more than 20%<br />
© 2011, <strong>Tulsa</strong> <strong>Public</strong> <strong>Schools</strong> www.<strong>Tulsa</strong><strong>Schools</strong>.org
2011–2012 Balanced Scorecard<br />
Department: Special Education<br />
Department Leader: Kay Sandschaper<br />
Core Goal: Student Achievement<br />
STRATEGIC OBJECTIVE: Examine District programs needed to deliver academic excellence<br />
with a focus on the elimination of achievement gaps among all subgroups of students.<br />
DEPT. GOAL: Support school teams and stakeholders to develop and provide<br />
appropriate services for students.<br />
Metrics (Measures that show progress toward identified goal) Results Actual Target<br />
% of Special Education (SPED) students scoring proficient on<br />
EOI/OCCT/OMAAP<br />
% of SPED students with increased scores on OCCT/OMMAP<br />
% of SPED students graduating with diploma<br />
Number of parent trainings offered throughout the year 4<br />
Number of parents participating in trainings<br />
Meets or exceeds target Does not meet target by 20% Does not meet target by more than 20%<br />
Core Goal: Teacher and Leader Effectiveness<br />
STRATEGIC OBJECTIVE: Structure central administration and human capital resources and<br />
establish systems and processes to support schools and enable campus leadership to focus<br />
on student growth and achievement.<br />
DEPT. GOAL: Provide annual updates for special education teachers<br />
which include information on state/federal requirements and district procedures.<br />
Metrics (Measures that show progress toward identified goal) Results Actual Target<br />
% of SPED teachers who attend procedural training<br />
% of attendees who rate training 3 or higher<br />
Meets or exceeds target Does not meet target by 20% Does not meet target by more than 20%<br />
Core Goal: Performance Based Culture<br />
DRAFT<br />
STRATEGIC OBJECTIVE: Develop coherent professional development content and delivery<br />
systems that support the strategic initiatives and build professional learning in all work<br />
environments.<br />
DEPT. GOAL: Survey all special education teachers/para-professionals to<br />
determine the most critical professional development needs.<br />
Metrics (Measures that show progress toward identified goal) Results Actual Target<br />
% current special ed/para-professionals responding to annual survey<br />
Meets or exceeds target Does not meet target by 20% Does not meet target by more than 20%<br />
DEPT. GOAL: Plan and provide professional development that meets special<br />
education/para-professional needs.<br />
Metrics (Measures that show progress toward identified goal) Results Actual Target<br />
% of critical needs reported addressed in PD opportunities<br />
% current SPED teachers/paras participating in PD above the required<br />
% of attendees who rate training 3 or higher<br />
Meets or exceeds target Does not meet target by 20% Does not meet target by more than 20%<br />
Profile<br />
Mission<br />
The mission of the Department<br />
of Special Education is to<br />
provide a free appropriate<br />
public education to all students<br />
who are determined to be<br />
eligible to receive special<br />
education services in order for<br />
each student to be ready for<br />
life after their public school<br />
career.<br />
Fast Facts<br />
The department of Special Education<br />
serves approximately 6100 students<br />
Description<br />
Location<br />
3027 S New Haven Ave.<br />
<strong>Tulsa</strong>, OK 74117<br />
918.746.6800<br />
www.tulsaschools.org<br />
Awards/Recognitions<br />
© 2011, <strong>Tulsa</strong> <strong>Public</strong> <strong>Schools</strong> www.<strong>Tulsa</strong><strong>Schools</strong>.org
2011–2012 Balanced Scorecard<br />
Department: Special Education<br />
Department Leader: Kay Sandschaper<br />
Core Goal: Financial Sustainability<br />
STRATEGIC OBJECTIVE: Effectively manage fiscal resources in compliance with internal and<br />
external accountability requirements and deliver the highest quality financial services to all<br />
stakeholders.<br />
DEPT. GOAL: Allocate staff to school sites based on student needs as reflected<br />
by IEP services.<br />
Metrics (Measures that show progress toward identified goal) Results Actual Target<br />
% of schools whose SPED paperwork is sent to ESC within 5 days of<br />
the meeting<br />
% of schools whose Service Delivery Codes (SDC) are entered<br />
correctly when submitted<br />
% of schools whose rosters reflect the correct SDCs resulting in<br />
appropriate allocations<br />
Meets or exceeds target Does not meet target by 20% Does not meet target by more than 20%<br />
DEPT. GOAL: Effectively and efficiently use the resources provided to maximize<br />
student achievement.<br />
Metrics (Measures that show progress toward identified goal) Results Actual Target<br />
% of budget encumbered by December 1<br />
% of budget encumbered by March 1<br />
Meets or exceeds target Does not meet target by 20% Does not meet target by more than 20%<br />
Core Goal: Safe and Secure <strong>Schools</strong><br />
STRATEGIC OBJECTIVE: Create a caring, safe and secure environment that enables<br />
teaching and learning to take place.<br />
DRAFT<br />
DEPT. GOAL: Provide effective Positive Behavior Intervention Support (PBIS)<br />
services to schools on an ongoing basis.<br />
Metrics (Measures that show progress toward identified goal) Results Actual Target<br />
% of schools participating in school wide PBIS<br />
% of schools represented at trainings designed to build behavioral expertise<br />
Meets or exceeds target Does not meet target by 20% Does not meet target by more than 20%<br />
© 2011, <strong>Tulsa</strong> <strong>Public</strong> <strong>Schools</strong> www.<strong>Tulsa</strong><strong>Schools</strong>.org
2011–2012 Balanced Scorecard<br />
Department: Title III Office<br />
Department Leader:<br />
Laura Grisso<br />
Core Goal: Student Achievement<br />
STRATEGIC OBJECTIVE: Examine District programs needed to deliver academic excellence<br />
with a focus on the elimination of achievement gaps among all subgroups of students.<br />
DEPT. GOAL: Provide curriculum and support to increase the linguistic and<br />
Academic achievement of English Language Learner (ELL) students within the<br />
Title III Annual Measurable Achievement Objectives (AMAO) framework<br />
Results Actual Target<br />
AMAO 1: Percentage of ELL students showing progress on the<br />
62%<br />
ACCESS for ELLs Test<br />
AMAO 2: Percentage of ELL students attaining proficiency on the<br />
19%<br />
ACCESS for ELLs Test<br />
AMAO 3: ELL students meeting Annual Yearly Progress (AYP) in<br />
Yes<br />
Reading and Math on the Oklahoma Core Curriculum Tests<br />
Meets or exceeds target Does not meet target by 20% Does not meet target by more than 20%<br />
Core Goal: Teacher and Leader Effectiveness<br />
STRATEGIC OBJECTIVE: Structure central administration and human capital resources and<br />
establish systems and processes to support schools and enable campus leadership to focus<br />
on student growth and achievement.<br />
DEPT. GOAL: Provide effective and embedded ELL coaching, consultation, or<br />
training for teachers, administrators and other school staff<br />
Results Actual Target<br />
Percentage of on-site requests for ELL coaching, consultation or training<br />
80%<br />
with schedule confirmation by English Language Development (ELD)<br />
specialists within 10 school days<br />
Percentage of ELL Professional Development survey responses with<br />
100%<br />
an overall score of ≥ 4 (scale of 1 to 5, 5=High)<br />
Meets or exceeds target Does not meet target by 20% Does not meet target by more than 20%<br />
Core Goal: Performance Based Culture<br />
DRAFT<br />
STRATEGIC OBJECTIVE: Develop coherent professional development content and delivery<br />
systems that support the strategic initiatives and build professional learning in all work<br />
environments.<br />
DEPT. GOAL: Provide ongoing professional development opportunities focused on<br />
the teaching and learning of ELL students<br />
Results Actual Target<br />
Number of hours presented of ELD Professional<br />
3<br />
Development for ELL teachers per semester<br />
Percentage of ELD teachers exceeding average number of ELD<br />
30%<br />
Professional Development hours for ELD teachers per semester<br />
Number of hours presented per month of ELD Professional<br />
3<br />
Development for general education staff per semester<br />
Meets or exceeds target Does not meet target by 20% Does not meet target by more than 20%<br />
Profile<br />
Mission<br />
To provide a quality learning<br />
experience for every student,<br />
every day, without exception.<br />
Fast Facts<br />
As of January 2012, <strong>Tulsa</strong><br />
<strong>Schools</strong> has 6,317 students who<br />
are identified as English<br />
Language Learners in<br />
PreKindergarten through 12 th<br />
grade and represent 47 different<br />
languages.<br />
Description<br />
The Title III Office provides:<br />
• supplemental<br />
instructional services<br />
for immigrant students<br />
and/or students who<br />
are identified as<br />
English Language<br />
Learners;<br />
• targeted professional<br />
development<br />
opportunities for all<br />
school staff and<br />
parents;<br />
• interpretation and<br />
translation services in<br />
a variety of languages.<br />
Location<br />
3027 S New Haven Ave.<br />
<strong>Tulsa</strong>, OK 74117<br />
918.746.6800<br />
www.tulsaschools.org<br />
Awards/Recognitions<br />
© 2011, <strong>Tulsa</strong> <strong>Public</strong> <strong>Schools</strong> www.<strong>Tulsa</strong><strong>Schools</strong>.org
2011–2012 Balanced Scorecard<br />
Department: Title III Office<br />
Department Leader:<br />
Laura Grisso<br />
Core Goal: Financial Sustainability<br />
STRATEGIC OBJECTIVE: Maximize revenue from state, local, other governmental sources<br />
and private/foundation support.<br />
DEPT. GOAL: Ensure proper identification and reporting of ELL students,<br />
immigrant students and bilingual students for maximized and accurate federal<br />
and state funding allocations<br />
Results Actual Target<br />
Percentage of ELL students with qualifying documentation recorded<br />
accurately in PowerSchool within the first 30 days of school<br />
Percentage of bilingual students with qualifying documentation<br />
recorded accurately in PowerSchool by October 1st<br />
Percentage of immigrant students with qualifying documentation<br />
recorded accurately in PowerSchool by the Title III Limited English<br />
Proficient Survey reporting date<br />
Meets or exceeds target Does not meet target by 20% Does not meet target by more than 20%<br />
Core Goal: Safe and Secure <strong>Schools</strong><br />
STRATEGIC OBJECTIVE: Create a caring, safe and secure environment that enables teaching and<br />
learning to take place.<br />
DEPT. GOAL: Respond effectively and efficiently to school and department<br />
requests for interpretation or translation services<br />
Results Actual Target<br />
Percentage of interpretation requests scheduled within 5 school days 100%<br />
Percentage of translation requests fulfilled within 10 school days 100%<br />
Number of calls to Language Line Services per month 10<br />
Average number of document views per user in TransAct Parent<br />
Notifications<br />
6<br />
Meets or exceeds target Does not meet target by 20% Does not meet target by more than 20%<br />
DEPT. GOAL: Provide parent involvement activities and resources to parents of<br />
ELL students in order to facilitate active engagement and participation in their<br />
students’ education<br />
Results Actual Target<br />
Average number of home visits made monthly to parents of ELL students<br />
8<br />
ELL Parent Outreach Case Managers<br />
Number of ELL Parent Involvement workshops and/or trainings<br />
8<br />
held at elementary schools by ELL Parent Outreach Case Managers<br />
Number of ELL Parent Involvement workshops and/or trainings<br />
8<br />
held at secondary schools by ELL Parent Outreach Case Managers<br />
Meets or exceeds target Does not meet target by 20% Does not meet target by more than 20%<br />
STRATEGIC OBJECTIVE: Ensure that policies and procedures are in place that identify and<br />
promote strategies, promising practices and programs that support positive climate and<br />
safe schools for all students and staff as part of the total academic mission.<br />
DEPT. GOAL: Review and revise Title III district policies and procedures to align<br />
with federal, state and local laws as well as best practice to support compliance<br />
and efficiency<br />
Results Actual Target<br />
Annual review and update of Title III district policies and procedures 100%<br />
100%<br />
100%<br />
100%<br />
DRAFT<br />
Meets or exceeds target Does not meet target by 20% Does not meet target by more than 20%<br />
© 2011, <strong>Tulsa</strong> <strong>Public</strong> <strong>Schools</strong> www.<strong>Tulsa</strong><strong>Schools</strong>.org
2011–2012 Balanced Scorecard<br />
Department: Transportation<br />
Department Leader:<br />
Rosalyn Vann-Jackson<br />
Core Goal: Student Achievement<br />
STRATEGIC OBJECTIVE: Develop a learning culture within our students that focuses on a<br />
love for learning, problem solving ability, intellectual curiosity, passion for the arts and a<br />
valuing of physical wellness.<br />
DEPT. GOAL: To provide prompt and efficient transportation services to support<br />
a positive learning environment.<br />
Metrics (Measures that show progress toward identified goal) Results Actual Target<br />
% of on-time performance - bus routes<br />
% of on-time performance - field trips<br />
Average student ride time (in minutes)<br />
Meets or exceeds target Does not meet target by 20% Does not meet target by more than 20%<br />
Core Goal: Teacher and Leader Effectiveness<br />
STRATEGIC OBJECTIVE: Create a culture of high expectations for academic achievement<br />
and conduct that makes no excuses based on the student’s demographics and/or<br />
socioeconomic status.<br />
DEPT. GOAL: Empower employees and ensure they are provided the knowledge<br />
and tools to care for a diverse student population in transport.<br />
Metrics (Measures that show progress toward identified goal) Results Actual Target<br />
% of positive annual school evaluations<br />
Patron Correspondence/Complaint analysis – positive/negative ratio<br />
Meets or exceeds target Does not meet target by 20% Does not meet target by more than 20%<br />
Core Goal: Performance Based Culture<br />
STRATEGIC OBJECTIVE: Develop coherent professional development content and delivery<br />
systems that support the strategic initiatives and build professional learning in all work<br />
environments.<br />
DRAFT<br />
DEPT. GOAL: Provide a training and development program to ensure trained<br />
skilled employees and high performing leaders are produced within the<br />
transportation workforce.<br />
Metrics (Measures that show progress toward identified goal) Results Actual Target<br />
% of employees that met job specific requirements<br />
% of drivers that met required hours of safety training<br />
Average annual hours of training per driver<br />
Meets or exceeds target Does not meet target by 20% Does not meet target by more than 20%<br />
DEPT GOAL: Retain motivated high performing workers and teams by recognizing<br />
and rewarding their contributions to the department’s and the district’s Visions,<br />
Missions, Core Goals and Core Beliefs.<br />
Metrics (Measures that show progress toward identified goal) Results Actual Target<br />
Driver turnover analysis<br />
Average daily driver attendance rate<br />
% of employee evaluations completed on time<br />
Average tenure of drivers (OVERALL)<br />
Meets or exceeds target Does not meet target by 20% Does not meet target by more than 20%<br />
Profile<br />
Mission<br />
“To ensure a quality school bus<br />
ride to and from school so as to<br />
support a<br />
positive learning experience for<br />
every student, every day,<br />
without exception.”<br />
Fast Facts:<br />
TPS Transportation is the second<br />
largest pupil transportation<br />
operation in the state of Oklahoma.<br />
TPS transports over 15,000<br />
students daily on the largest fleet<br />
of CNG Vehicles in the state. More<br />
than 300 staff members effectively<br />
support the following five major<br />
department business functions:<br />
1. Transportation<br />
Services<br />
2. Student Routing and<br />
scheduling<br />
3. Safety and training<br />
4. Fleet maintenance<br />
5. Fiscal accountability<br />
Description:<br />
Quality School Bus Ride:<br />
• On schedule pick-up and<br />
delivery for all students every<br />
time.<br />
• A safe and secure school bus<br />
stop and ride.<br />
• An orderly school bus at all<br />
times.<br />
• Consistency of action for all<br />
student management on the<br />
school bus.<br />
Location<br />
1815 N 77 th East Ave.<br />
<strong>Tulsa</strong>, OK 74115<br />
918.833.8100<br />
www.tulsaschools.org<br />
4 Area Transportation offices<br />
Awards/Recognitions<br />
Henry Bellmon Awards Partner<br />
Oklahoma Association of Pupil<br />
Transportation<br />
National Association of Pupil<br />
Transportation<br />
© 2011, <strong>Tulsa</strong> <strong>Public</strong> <strong>Schools</strong> www.<strong>Tulsa</strong><strong>Schools</strong>.org
2011–2012 Balanced Scorecard<br />
Department: Transportation<br />
Department Leader:<br />
Rosalyn Vann-Jackson<br />
Core Goal: Financial Sustainability<br />
STRATEGIC OBJECTIVE: Be prudent stewards of District resources through rigorous planning<br />
and budgeting, and build further resources by enhancing public and private support for<br />
public education.<br />
DEPT. GOAL: Develop innovative approaches in transportation planning to<br />
reduce costs while, maintaining a high level of service.<br />
Metrics (Measures that show progress toward identified goal) Results Actual Target<br />
Number of days vehicles are out of service<br />
% of daily breakdowns<br />
% of parts inventory used annually<br />
Average repair time per bus<br />
Average age of fleet<br />
% of on time preventative maintenance<br />
% of positive annual vehicle (white fleet) evaluations<br />
Transportation cost per mile<br />
Transportation cost per student<br />
Meets or exceeds target Does not meet target by 20% Does not meet target by more than 20%<br />
Core Goal: Safe and Secure <strong>Schools</strong><br />
STRATEGIC OBJECTIVE: Ensure that policies and procedures are in place that identify and<br />
promote strategies, promising practices and programs that support positive climate and<br />
safe schools for all students and staff as part of the total academic mission.<br />
DEPT. GOAL: Provide safe and secure transport of students with an increased<br />
focus on behavior management and student tracking.<br />
Metrics (Measures that show progress toward identified goal) Results Actual Target<br />
PBIS bus participation (% of campuses)<br />
% of elementary schools requesting safety instruction<br />
% of accidents with student injuries<br />
% of preventable/chargeable accidents<br />
% of accidents per 100,000 miles driven<br />
% of student conduct reports per run<br />
Meets or exceeds target Does not meet target by 20% Does not meet target by more than 20%<br />
DRAFT<br />
© 2011, <strong>Tulsa</strong> <strong>Public</strong> <strong>Schools</strong> www.<strong>Tulsa</strong><strong>Schools</strong>.org
2011–2012 Balanced Scorecard<br />
Department: District Accountability &<br />
Program Management<br />
Department Leader: Larry Smith<br />
Core Goal: Student Achievement<br />
STRATEGIC OBJECTIVE: Examine District programs needed to deliver academic excellence<br />
with a focus on the elimination of achievement gaps among all subgroups of students.<br />
DEPT. GOAL: To identify specific data and develop timelines for dissemination of<br />
information.<br />
Complete analysis of TPS performance on the most recent State<br />
NCLB (OCCT, EOI, OMAAP) assessments by disaggregation of specific<br />
variables to determine achievement gaps and achievement gains to<br />
be uploaded to the Dashboard by September 1 of each year or<br />
within 10 working days after the release of the data whichever<br />
occurs first.<br />
Complete analysis of each school’s performance on the most recent<br />
State NCLB (OCCT, EOI OMAAP) assessments by disaggregation of<br />
specific variables to determine achievement gaps and achievement<br />
gains to be uploaded to the Dashboard by September 1 of each<br />
year or within 10 working days after the release of the data<br />
whichever occurs first.<br />
Complete annual needs assessment of principals, teachers,<br />
department heads and senior leadership to identify and prioritize<br />
the collection, dissemination and use of Dashboard/Warehouse<br />
data to drive instruction by January of each school year for the<br />
coming year.<br />
Utilize the Data Coordination Work group to create and implement<br />
action plans with specific task and deadlines for the completion the<br />
identified priorities (goal 3) by the first day of teacher report time.<br />
Complete an annual survey of senior leadership by September 1 to<br />
identify three district specific areas for review. Complete a<br />
comprehensive program evaluation of each of the three areas<br />
with findings reported in April .<br />
Meets or exceeds target Does not meet target by 20% Does not meet target by more than 20%<br />
Results Actual Target<br />
100%<br />
100%<br />
100%<br />
DRAFT<br />
100%<br />
100%<br />
Profile<br />
Mission<br />
To provide a quality learning<br />
experience for every student,<br />
every day, without exception.<br />
Vision<br />
Excellence and High<br />
Expectations with a<br />
Commitment to All<br />
Core Beliefs<br />
• Effective leaders and<br />
classroom teachers have a<br />
profound impact on<br />
children’s lives.<br />
• All children can learn and<br />
TPS can close the<br />
achievement gap.<br />
• TPS can be an efficient,<br />
effective, performancebased<br />
organization.<br />
• Community collaboration is<br />
fundamental to achieving<br />
and sustaining excellence.<br />
• TPS should provide a safe,<br />
healthy learning<br />
environment for all<br />
students and staff.<br />
Location<br />
3027 S New Haven Ave.<br />
<strong>Tulsa</strong>, OK 74117<br />
918.746.6800<br />
www.tulsaschools.org<br />
District Overview<br />
<strong>Tulsa</strong> <strong>Public</strong> <strong>Schools</strong> is<br />
Northeastern Oklahoma’s<br />
largest and most dynamic school<br />
district with nearly 42,000<br />
thousand students, 7,000<br />
employees, 75 campuses, 250<br />
school buses and about 173<br />
square miles.<br />
© 2011, <strong>Tulsa</strong> <strong>Public</strong> <strong>Schools</strong> www.<strong>Tulsa</strong><strong>Schools</strong>.org
2011–2012 Balanced Scorecard<br />
Department: District Accountability &<br />
Program Management<br />
Department Leader: Larry Smith<br />
Core Goal: Teacher and Leader Effectiveness<br />
STRATEGIC OBJECTIVE: Develop, track and communicate clear outcome measures for<br />
student learning goals and organizational goals in order to precisely monitor work that<br />
will make a difference in student achievement. Develop a system for shared accountability<br />
for results.<br />
DEPT. GOAL: Develop, track and communicate student achievement and other<br />
data in order to precisely monitor district, site and staff effectiveness that make a<br />
difference in student achievement.<br />
Provide state student test results for all tested students to ISS for<br />
posting within 2 weeks of receiving accurate test results.<br />
Report discipline (referrals, suspensions, bullying), student and staff<br />
attendance, truancy, membership, holding, mobility and transfer<br />
data annually.<br />
Monitor and report accreditation data such as (class size, highly<br />
qualified teacher, membership) by state deadlines.<br />
Meets or exceeds target Does not meet target by 20% Does not meet target by more than 20%<br />
Core Goal: Performance Based Culture<br />
Results Actual Target<br />
STRATEGIC OBJECTIVE: Adopt a District-wide accountability system to ensure the success<br />
of all schools with progress reporting/sharing via data walls, data dashboards, etc.<br />
DEPT. GOAL: Construct, implement, and sustain systemic processes for the<br />
annual deployment of information via the district dashboard.<br />
DRAFT<br />
Convert data points from identifed department goals and objectives<br />
into data presentations on the data warehouse prior to required<br />
date(s).<br />
Report State student test results for all tested students.<br />
Report data elements such as discipline referrals , suspensions,<br />
bullying, student and staff attendance, truancy, membership,<br />
holding, mobility and transfer data .<br />
Report accreditation data , such as class size, membership.<br />
Meets or exceeds target Does not meet target by 20% Does not meet target by more than 20%<br />
Results Actual Target<br />
100%<br />
© 2011, <strong>Tulsa</strong> <strong>Public</strong> <strong>Schools</strong> www.<strong>Tulsa</strong><strong>Schools</strong>.org
2011–2012 Balanced Scorecard<br />
Department: District Accountability &<br />
Program Management<br />
Department Leader: Larry Smith<br />
Core Goal: Financial Sustainability<br />
STRATEGIC OBJECTIVE: Maximize revenue from state, local, other governmental sources<br />
and private/foundation support.<br />
DEPT. GOAL: Maximize state aid revenue derived from ADM, bilingual funding,<br />
and class size penalties.<br />
Results Actual Target<br />
Avg. # student enrollment errors annually 5%<br />
reduction<br />
Avg. bilingual funding annually 1%<br />
increase<br />
# class size penalties annually 0<br />
Meets or exceeds target Does not meet target by 20% Does not meet target by more than 20%<br />
DEPT. GOAL: Ensure district and department staff are effectively trained.<br />
Results Actual Target<br />
% monthly registrar professional development meetings with a<br />
1% increase in attendance over the prior month<br />
Avg. number of quarterly counselor training session opportunities<br />
Avg. number of quarterly school administrative training session<br />
opportunities<br />
Meets or exceeds target Does not meet target by 20% Does not meet target by more than 20%<br />
DEPT. GOAL: Collect, analyze and distribute data requests to meet deadlines for<br />
funding source applications.<br />
Results Actual Target<br />
% of all data requests delivered within 3 days of receiving the<br />
100%<br />
approved request form<br />
Meets or exceeds target Does not meet target by 20% Does not meet target by more than 20%<br />
Core Goal: Safe and Secure <strong>Schools</strong><br />
DRAFT<br />
STRATEGIC OBJECTIVE: Create a caring, safe and secure environment that enables<br />
teaching and learning to take place.<br />
DEPT. GOAL: Provide timely data to schools and district departments to be used<br />
for developing strategies to ensure a caring, safe and secure environment that<br />
enables teaching and learning to take place.<br />
Results Actual Target<br />
Annually work with school and district leaders to identify important<br />
100<br />
data to be collected i.e. bullying.<br />
Provide an end of year analysis to be delivered to school and district<br />
100<br />
leadership by July 1 to be used for planning for the upcoming<br />
school year.<br />
Meets or exceeds target Does not meet target by 20% Does not meet target by more than 20%<br />
© 2011, <strong>Tulsa</strong> <strong>Public</strong> <strong>Schools</strong> www.<strong>Tulsa</strong><strong>Schools</strong>.org
2011–2012 Balanced Scorecard<br />
Department: District Accountability &<br />
Program Management<br />
Department Leader: Larry Smith<br />
DRAFT<br />
© 2011, <strong>Tulsa</strong> <strong>Public</strong> <strong>Schools</strong> www.<strong>Tulsa</strong><strong>Schools</strong>.org
2011–2012 Balanced Scorecard<br />
Department: Health Services<br />
Department Leader:<br />
Pam Butler<br />
Core Goal: Student Achievement<br />
STRATEGIC OBJECTIVE: Develop a learning culture within our students that focuses on a<br />
love for learning, problem solving ability, intellectual curiosity, passion for the arts and a<br />
valuing of physical wellness.<br />
DEPT. GOAL: Offer developmentally appropriate health education classes for<br />
students Pre-K thru 12 th grade to increase or improve health practices.<br />
Results Actual Target<br />
% 5 th ,7 th and 10 th grade students attending HIV/AIDS education<br />
80%<br />
classes<br />
% elementary students who attend growth and development and<br />
80%<br />
hand washing classes<br />
Meets or exceeds target Does not meet target by 20% Does not meet target by more than 20%<br />
Core Goal: Teacher and Leader Effectiveness<br />
STRATEGIC OBJECTIVE: Implement a new, innovative and fair evaluation system for all TPS<br />
staff that is based upon feedback and support and is aligned to enacted Oklahoma<br />
legislation.<br />
DEPT. GOAL: Implement new evaluation rubric, observation and evaluation for<br />
nurses who rotate to various sites.<br />
Results Actual Target<br />
% rotating nurses with 1 st observation complete by 11/30/11 99% 100%<br />
% rotating nurses with 2 nd observation complete by 2/14/12 100%<br />
% rotating nurses with evaluations completed by 5/1/12 100%<br />
% rotating nurses receiving immediate feedback after<br />
observations<br />
100%<br />
Meets or exceeds target Does not meet target by 20% Does not meet target by more than 20%<br />
Core Goal: Performance Based Culture<br />
DRAFT<br />
STRATEGIC OBJECTIVE: Develop coherent professional development content and delivery<br />
systems that support the strategic initiatives and build professional learning in all work<br />
environments.<br />
DEPT. GOAL: Provide relevant professional development to assist staff and<br />
students with health needs.<br />
Results Actual Target<br />
% health assistants participating in professional development sessions 90%<br />
% nurses participating in professional development sessions 90%<br />
Meets or exceeds target Does not meet target by 20% Does not meet target by more than 20%<br />
Profile<br />
Mission<br />
Fast Facts<br />
Description<br />
Location<br />
3027 S New Haven Ave.<br />
<strong>Tulsa</strong>, OK 74117<br />
918.746.6800<br />
www.tulsaschools.org<br />
Awards/Recognitions<br />
© 2011, <strong>Tulsa</strong> <strong>Public</strong> <strong>Schools</strong> www.<strong>Tulsa</strong><strong>Schools</strong>.org
2011–2012 Balanced Scorecard<br />
Department: Health Services<br />
Department Leader:<br />
Pam Butler<br />
Core Goal: Financial Sustainability<br />
STRATEGIC OBJECTIVE: Support the efforts of Partners in Education, PTA, foundations,<br />
individual donors, business groups, and other community groups and agencies to augment<br />
existing District resources.<br />
DEPT. GOAL: Collaborate with community health partners to provide services<br />
for students and staff.<br />
Results Actual Target<br />
% school sites receiving community health partner services<br />
80%<br />
under the auspices of Health Services such as dental screenings.<br />
Meets or exceeds target Does not meet target by 20% Does not meet target by more than 20%<br />
Core Goal: Safe and Secure <strong>Schools</strong><br />
STRATEGIC OBJECTIVE: Ensure that policies and procedures are in place that identify and<br />
promote strategies, promising practices and programs that support positive climate and<br />
safe schools for all students and staff as part of the total academic mission.<br />
DEPT. GOAL: Review and revise health related district policies and procedures<br />
using state law and best practices to support safety, efficacy and consistency.<br />
Results Actual Target<br />
% biannual policy reviews conducted by October 1 of School<br />
100%<br />
Board policies related Health Services<br />
Meets or exceeds target Does not meet target by 20% Does not meet target by more than 20%<br />
DRAFT<br />
© 2011, <strong>Tulsa</strong> <strong>Public</strong> <strong>Schools</strong> www.<strong>Tulsa</strong><strong>Schools</strong>.org
2011–2012 Balanced Scorecard<br />
Department: ISS<br />
Department Leader:<br />
Ben Stout, CIOO<br />
Core Goal: Student Achievement<br />
STRATEGIC OBJECTIVE: Create an exceptional learning environment, via enhanced<br />
curricular and instructional offerings and practices, that prepares students to pursue college<br />
and work-force ready opportunities and to subsequently become effective, productive, and<br />
contributing citizens.<br />
DEPT. GOAL: Provide accurate and timely information to show how well prepared<br />
students are for college and the work force.<br />
Results Actual Target<br />
Percentage of assessment results loaded to the Data Warehouse<br />
within 15 business days of receipt of the data from Accountability<br />
Percentage of assessments loaded to the Data Warehouse<br />
within 30 business days of receipt of the data from Accountability<br />
Meets or exceeds target Does not meet target by 20% Does not meet target by more than 20%<br />
≥80%<br />
≥99%<br />
Core Goal: Teacher and Leader Effectiveness<br />
STRATEGIC OBJECTIVE: Explore opportunities for increasing academic learning time so<br />
students will have more time in the classroom to acquire the academic knowledge and skills<br />
that will prepare them for work-force or college entry, and subsequent career decision<br />
making.<br />
DEPT. GOAL: Provide timely support of IT issues to minimize downtime of<br />
technology equipment in the classroom.<br />
Results Actual<br />
Target<br />
Percentage of work orders within scope closed within one week ≥75%<br />
Percentage of work orders within scope closed within 30 days ≥95%<br />
Percentage of ISS Help Desk calls abandoned by the caller
2011–2012 Balanced Scorecard<br />
Department: ISS<br />
Department Leader:<br />
Ben Stout, CIOO<br />
Core Goal: Financial Sustainability<br />
STRATEGIC OBJECTIVE: Be prudent stewards of District resources through rigorous planning<br />
and budgeting, and build further resources by enhancing public and private support for<br />
public education.<br />
DEPT. GOAL: Submit zero-based budget for each fiscal year.<br />
Percent variance of actual to budget figures for the year, excluding<br />
Erate-funded items<br />
Meets or exceeds target Does not meet target by 20% Does not meet target by more than 20%<br />
Results Actual<br />
Target<br />
≤10%<br />
Core Goal: Safe and Secure <strong>Schools</strong><br />
STRATEGIC OBJECTIVE: Create a caring, safe and secure environment that enables<br />
teaching and learning to take place.<br />
DEPT. GOAL: Provide network support to maintain high availability for door<br />
access, IP video surveillance, applications, and Internet access.<br />
Results Actual Target<br />
Percentage availability of District network services/month,<br />
≥99%<br />
excluding scheduled outages<br />
Percentage availability of network services to all sites/month,<br />
≥95%<br />
excluding scheduled outages<br />
Meets or exceeds target Does not meet target by 20% Does not meet target by more than 20%<br />
DRAFT<br />
© 2011, <strong>Tulsa</strong> <strong>Public</strong> <strong>Schools</strong> www.<strong>Tulsa</strong><strong>Schools</strong>.org
2010–2011 Balanced Scorecard<br />
Department: Child Nutrition Services<br />
Department Leader: Kit Hines, R. D., L. D.<br />
Core Goal: Student Achievement<br />
STRATEGIC OBJECTIVE: Create an exceptional learning environment, via enhanced<br />
curricular and instructional offerings and practices, that prepares students to pursue college<br />
and work-force ready opportunities and to subsequently become effective, productive and<br />
contributing citizens.<br />
DEPT. GOAL: Provide nutritious and quality meals for breakfast and lunch to<br />
maximize student achievement.<br />
Results Actual Target<br />
Breakfast participation rate (% of students participating) 51 %<br />
Lunch participation rate(% of students participating) 70 %<br />
Annual Parent Survey Above Average Rating 75 %<br />
Menu meets USDA requirements 100%<br />
Food testing conducted with students annually 100%<br />
Meets or exceeds target Does not meet target by 20% Does not meet target by more than 20%<br />
Core Goal: Teacher and Leader Effectiveness<br />
STRATEGIC OBJECTIVE: Continue the enhancement of human capital functions that<br />
assures: 1) a pipeline of high quality principals, teachers and staff, prepared to be effective<br />
in an urban setting; 2) targeted and coordinated evidence-based development of leaders<br />
and teachers.<br />
DEPT. GOAL: Attract and retain the most highly trained specialized staff in the<br />
Child Nutrition department.<br />
Results Actual Target<br />
Annual Retention rate of employees 87%<br />
% Annual employee performance evaluations are at exceed<br />
Expectations.<br />
Meets or exceeds target Does not meet target by 20% Does not meet target by more than 20%<br />
Core Goal: Performance Based Culture<br />
DRAFT<br />
STRATEGIC OBJECTIVE: Develop coherent professional development content and delivery<br />
systems that support the strategic initiatives and build professional learning in all work<br />
environments.<br />
DEPT. GOAL: Provide support and professional training to assure professional<br />
development of child nutrition staff and teachers.<br />
Results Actual Target<br />
Monthly food safety and physical training provided at all sites 100%<br />
All Personal development plans have follow-up 100%<br />
% of employees who participate in training 80 %<br />
Training classes include leadership, culinary skills, nutrition<br />
100%<br />
standards, food safety and physical safety and customer service<br />
% <strong>Schools</strong> that receive nutrition education classes for students or<br />
75%<br />
teachers<br />
Meets or exceeds target Does not meet target by 20% Does not meet target by more than 20%<br />
75%<br />
Profile<br />
Mission<br />
To contribute to Student<br />
Achievement by providing meal<br />
service and nutrition education<br />
for every student, everyday<br />
without exception.<br />
Fast Facts<br />
Serve 28,000 lunches per day.<br />
Serve 21,000 breakfast meals<br />
per day.<br />
Centralized Bakery provided<br />
freshly baked items for all sites.<br />
Provide meals for all Community<br />
Action Sites in City of <strong>Tulsa</strong>.<br />
Summer Café – Provide Summer<br />
Feeding meals at 80 community<br />
sites.<br />
Description<br />
We are committed to operate<br />
a Child Nutrition Program that<br />
is "Best in the Class" for food<br />
and customer service. In doing<br />
this, we strive to create a great<br />
working environment for our<br />
employees; that provides the<br />
time, tools and the training<br />
needed to be the "Best in the<br />
Class"!<br />
Location<br />
8934 East Latimer<br />
<strong>Tulsa</strong>, OK 74115<br />
918.833. 8670<br />
www.tulsaschools.org.<br />
Awards/Recognitions<br />
All schools are Team Nutrition<br />
<strong>Schools</strong>.<br />
All schools are Enrolled as Fuel<br />
to Play <strong>Schools</strong>.<br />
Fruit and Vegetable Program at<br />
30 elementary sites.<br />
© 2011, <strong>Tulsa</strong> <strong>Public</strong> <strong>Schools</strong> www.<strong>Tulsa</strong><strong>Schools</strong>.org
2010–2011 Balanced Scorecard<br />
Department: Child Nutrition Services<br />
Department Leader: Kit Hines, R. D., L. D.<br />
Core Goal: Financial Stability<br />
STRATEGIC OBJECTIVE: Maximize revenue from state, local, other governmental sources<br />
and private/foundation support.<br />
DEPT. GOAL: Maximize state and federal funding to assure that all funding is<br />
Received.<br />
Results Actual Target<br />
% of students that complete free/reduced application 80%<br />
Variance in free/reduced status for the district 3 %<br />
On site reviews conducted at 100 % of sites indicate that all proper<br />
100%<br />
procedures are in place for counting and recording meals.<br />
Meets or exceeds target Does not meet target by 20% Does not meet target by more than 20%<br />
Core Goal: Safe and Secure <strong>Schools</strong><br />
STRATEGIC OBJECTIVE: Create a caring, safe and secure environment that enables<br />
teaching and learning to take place.<br />
DEPT. GOAL: Implement hazard analysis critical control plan that assures safe<br />
food service for all customers.<br />
Results Actual Target<br />
% of schools that score 80 % or better on comprehensive inspection<br />
% of schools with more than one health inspection violation<br />
Meets or exceeds target Does not meet target by 20% Does not meet target by more than 20%<br />
STRATEGIC OBJECTIVE: Create a caring, safe and secure environment that enables<br />
teaching and learning to take place.<br />
DEPT. GOAL: Implement safety program that assures safe work environment for<br />
Child Nutrition employees<br />
Results Actual Target<br />
Accident prevention checklist reviewed annually with all employees 100%<br />
Child Nutrition orientation includes safety training, all new<br />
100%<br />
Employees attend.<br />
% employees on workers compensation annual variance less than 5%<br />
Meets or exceeds target Does not meet target by 20% Does not meet target by more than 20%<br />
DRAFT<br />
© 2011, <strong>Tulsa</strong> <strong>Public</strong> <strong>Schools</strong> www.<strong>Tulsa</strong><strong>Schools</strong>.org
Menu of Strategies for Turnaround School Implementation<br />
<strong>Tulsa</strong> <strong>Public</strong> <strong>Schools</strong><br />
Strategic Moves and Menu of Possible<br />
Implementation Strategic Approaches<br />
Note: Budget implications need to be addressed<br />
Note: This is a menu of researched and effective<br />
practice based approaches to be matched to the<br />
turnaround school needs<br />
Strategic Focus Area; Teacher and Leader<br />
Effectiveness<br />
Recruit and place effective/highly effective teachers<br />
in turnaround schools<br />
• Utilize Gallup scores to identify applicants<br />
new to the district who are a match for<br />
turnaround schools<br />
• Identify teachers with highly effective TLE<br />
scores and high value added scores to<br />
recruit to turnaround schools<br />
• Recruit teachers who have an interest in<br />
serving in turnaround schools<br />
• Seek ways to provide differentiated pay for<br />
teachers who will work additional<br />
planning/student teaching hours<br />
• Redistribute existing mentoring resources to<br />
provide additional support to priority<br />
schools with high numbers of novice<br />
teachers.<br />
Metric<br />
Gallup scores of<br />
applicants new to the<br />
district in turnaround<br />
schools<br />
# of teachers with high<br />
TLE and value-added<br />
scores in pool for<br />
turnaround schools<br />
# of teachers in pool to<br />
serve in turnaround<br />
schools<br />
Amount of<br />
differentiated pay for<br />
teachers in turnaround<br />
schools<br />
Assignment of mentors<br />
to novice teachers<br />
Lead Office<br />
(note: many of<br />
these strategies<br />
are crossfunctional,<br />
but<br />
to show<br />
capacity to<br />
deliver, lead<br />
office is noted)<br />
HC<br />
1
• Schedule opportunities for teachers to work<br />
collaboratively in PLCs for a block of 90<br />
minutes (outside of regular planning time).<br />
• Determine and select appropriate turnaround<br />
model based upon the menu of interventions<br />
and supports as supplied in OK’s NCLB<br />
Waiver.(Attachment 12)<br />
Identify and place principals with quantifiable<br />
student achievement gains and the desire to work in<br />
a turnaround school into turnaround sites<br />
• Utilize a research-based rubric (see Gallup<br />
and other expert rubrics) for identifying<br />
turnaround school principals to identify best<br />
match for turnaround schools<br />
School schedules<br />
List of priority<br />
schools and selected<br />
interventions and/ or<br />
supports<br />
Rubric scores of<br />
principals at all schools<br />
and at turnaround<br />
schools<br />
Associate Supts<br />
• Recruit principals who have had<br />
demonstrable success in turnaround schools<br />
# of highly effective<br />
principals<br />
• Provide differentiated reward (pay/learning<br />
opportunities/decision-making) for highly<br />
effective principals who commit to<br />
turnaround schools for a three year time<br />
period<br />
Recruit and place highly effective teachers into<br />
school turnarounds to fill leadership team roles<br />
• Design leadership teams in turnaround<br />
schools to address school needs<br />
• Provide professional learning opportunities<br />
for turnaround leadership teams<br />
• Provide pay differential for serving on<br />
leadership team<br />
Provide professional learning opportunities on<br />
turnaround strategies for staff<br />
• Develop differentiated learning<br />
opportunities through key partners in the<br />
city and through Gates Foundation<br />
connections<br />
Amount of<br />
pay/opportunities per<br />
principal at turnaround<br />
vs pay/opportunities at<br />
all schools<br />
Leadership Team<br />
descriptions<br />
Program evaluation<br />
results<br />
Cost of team<br />
development and<br />
differential<br />
# of opportunities;<br />
participant response;<br />
student achievement<br />
gains<br />
HC<br />
C&I<br />
2
• Provide professional development support<br />
on specific turnaround models such as<br />
BRIDGES (Blending Research, Instruction,<br />
and Data to Grow Effective <strong>Schools</strong>)<br />
• Develop the skills, strategies, practices, and<br />
beliefs of Staff Development Teachers to<br />
provide job-embedded support at each<br />
turnaround schools<br />
Strategic Focus Area:<br />
Support for Student Learning Through Datadriven<br />
Decision-making<br />
Develop a system to provide a Pyramid of<br />
Interventions<br />
• Build school level skills in DuFour’s<br />
Pyramid of Interventions<br />
• Build school level skills in Response to<br />
Intervention Model<br />
School Pyramid of<br />
Intervention systems<br />
aligned to specific<br />
approach<br />
C&I<br />
Provide Extended Learning Opportunities for<br />
identified students so that they have more time in<br />
study skills and key learning areas<br />
• Pursue partnerships with funding entities to<br />
provide extended learning opportunities<br />
such as Citizen <strong>Schools</strong><br />
Develop teachers’ skills in Instructional Strategies<br />
that reach diverse learners<br />
• Provide cultural competence training and<br />
training of effective effort such as The<br />
Skillful Teacher<br />
Provide Support for English Language Learners and<br />
Special Education Students<br />
• Provide staffing models to support diverse<br />
student learners<br />
Interim Diagnostic Assessments<br />
• Assess students regularly on both formative<br />
and summative assessments to determine<br />
continuous improvement<br />
# of students in ELO<br />
opportunities<br />
# of teachers<br />
participating<br />
Results of teacher<br />
observation/evaluations<br />
Movement toward the<br />
goal staffing model of<br />
1:70 ratio for ELL<br />
teachers<br />
Student learning gains<br />
School<br />
Turnaround<br />
Officers<br />
C&I<br />
Associate Supts<br />
Data Office<br />
3
Formulate processes to continuously analyze<br />
student learning data<br />
• Develop school-level and district-level data<br />
review teams<br />
• Develop data review team skills in dataanalysis<br />
content<br />
Strategic Focus Area:<br />
Curriculum: Support for English Language<br />
Arts; Support for Mathematics; Support for<br />
College and Career Readiness<br />
Revise standards to ensure alignment to Common<br />
Core<br />
Identify needs and processes to ensure time is<br />
provided for Literacy and math blocks<br />
Provide College and Career planning support for all<br />
students<br />
• Develop career and college planning tools<br />
that begin when students are in elementary<br />
school consistent with the Eleven Steps to<br />
College and Career Readiness<br />
• Provide professional development to<br />
support the 11 Steps to College and Career<br />
Readiness.<br />
•<br />
• Provide C3 counselors at every level to<br />
deliver college, career, and citizenship<br />
planning services to students as guided by<br />
the ACT 8 Components of College and<br />
Career Readiness.<br />
Strategic Focus Area:<br />
Use of Time<br />
Provide processes to determine best use of<br />
instructional time at elementary and secondary<br />
schools<br />
• Assess and implement course scheduling<br />
that optimizes time in core subjects and<br />
appropriate remedial classes.<br />
Strategic Focus Area: Safe, Secure, and<br />
Supported <strong>Schools</strong><br />
• Assess the current level of safety and<br />
security at each priority school and develop<br />
a plan for each school in response to the<br />
data.<br />
4<br />
Make-up of data teams<br />
Observation/Evaluation<br />
data about dataanalysis<br />
skills<br />
Revised standards<br />
Data of student<br />
progress towards C3 as<br />
measured by the 11<br />
Steps to College and<br />
Career Readiness<br />
# of C3 counselors<br />
Framework in evidence<br />
Turnaround <strong>Schools</strong><br />
have a clear<br />
instructional model<br />
Baseline safety and<br />
security data<br />
School<br />
Turnaround<br />
Officers<br />
C&I<br />
C&I<br />
C&I<br />
Turnaround<br />
Office<br />
Turnaround<br />
Office
• Identify culturally competent models for<br />
behavior support<br />
Provide support for Community Engagement in<br />
Turnaround <strong>Schools</strong><br />
• Identify models of parent and community<br />
engagement that work in Turnaround<br />
<strong>Schools</strong><br />
Monthly data and<br />
continuous<br />
improvement strategies<br />
Model is identified<br />
5
Timely district interventions when a school is not making progress<br />
Focus on Results‐ In the fall of 2010, Associate Superintendent Millard House and his Executive<br />
Assistant Jean Swanson, with the assistance of the <strong>Elementary</strong> Leadership team, carefully<br />
reviewed the OCCT and AYP data of the elementary schools in <strong>Tulsa</strong> <strong>Public</strong> <strong>Schools</strong> (TPS). Based<br />
on this data and observations made during visits to each campus, the schools were prioritized<br />
in three tiers, indicating the level of need for each school. At the conclusion of this process, six<br />
schools were identified as the highest priority for district intervention: Academy Central,<br />
Alcott, Houston, Jackson, McClure, and Whitman.<br />
Because these six schools had been unable to facilitate reform through existing leadership,<br />
professional development, and student progressing monitoring efforts, the district determined<br />
that the time for a systemic “turnaround” using an external facilitating team has come. The<br />
intent of this decision was to move beyond triage and intervention in these schools to<br />
developing learning organizations that “reform” and “recover” from prior limiting practices,<br />
expectations, and poor capacity to do the required work, it was necessary that each of the six<br />
priority schools develop systemic competence. TPS was seeking coherence from policy,<br />
pedagogy, and programs leading to student achievement evidenced by summative proficiency<br />
data. This project was built on the following tenets that were expressed in the stakeholder<br />
relationships and action:<br />
1) The learning organization is responsible to create the conditions in which students<br />
learn.<br />
2) Children are best engaged in meaningful work that is intellectually, emotionally, and<br />
physically charged.<br />
3) Students must be involved in assessing their progress, monitoring on‐going growth<br />
and checking for mastery of objectives.<br />
4) Adult role models can provide support and validation for learning for anybody’s<br />
child.<br />
5) Student success or failure is a consequence of community investment and<br />
responsibility.<br />
6) Collaboration, consistency in curriculum, standards based instruction, data<br />
collection, frequent assessment, data analysis, professional development and<br />
constant feedback are the organizational “basics” in a reform process.<br />
After considering the proposals of several consulting groups, Focus on Results was contracted<br />
to begin work with the six schools beginning in January 2011. When Project Schoolhouse<br />
resulted in the closing of Alcott and Houston <strong>Elementary</strong> <strong>Schools</strong>, MacArthur and Emerson
<strong>Elementary</strong> <strong>Schools</strong> were added to the group. The following timeline summarizes Focus on<br />
Results’ work with these schools from January 2011 until the present time.<br />
January 2011 – June 2011<br />
Creating a Culture of Improvement<br />
Engaged entire staff in the identification of an Instructional Focus:<br />
■ Created a student friendly slogan<br />
■ Made the focus visible<br />
■ Relentless communication of the focus<br />
■ School begins to align decisions around the instructional focus.<br />
The Instructional Leadership Team begins to lead the improvement effort:<br />
■ ILT team meets regularly – twice monthly<br />
■ ILT had developed norms, agendas and minutes<br />
■ ILT had established two‐way communication systems<br />
■ ILT plan and leads teacher collaboration meetings and staff meetings<br />
■ ILT assumes responsibility for professional development in the building.<br />
The staff has identified a narrow set of best teaching practices in the instructional focus:<br />
■ Narrow set of best practices are communicated<br />
■ Targeted professional development is planned and implemented to build teacher expertise.<br />
Teacher collaboration teams meet regularly to carry out the improvement effort:<br />
■ ILT members plan and lead the collaboration meetings.<br />
Data is displayed in classrooms and hallways to keep the focus on the improvement effort:<br />
■ Students are setting individual improvement goals<br />
■ Grade level teams determine appropriate data displays.<br />
1 day per month of Professional Development for the ILT<br />
2 coaching days per month by a coach who has been a building principal and led a successful<br />
improvement effort with results to show.<br />
August 2011 – May 2012<br />
Living A Culture of Improvement<br />
Entire staff is “living” the Instructional Focus:<br />
■ The instructional focus is the lens for decision making gains in achievement are reached in<br />
the instructional focus area and beyond.
The Instructional Leadership Team strongly and confidently leads the improvement effort:<br />
■ ILT works in collaboration with the Staff Development Teacher to provide a targeted,<br />
focused professional development plan to build teacher expertise in the selected best<br />
practices.<br />
The staff is building expertise in the narrow set of best teaching practices:<br />
■ Staff is held mutually accountable for the implementation of solid teaching practices<br />
■ Staff is using instructional walk throughs as a strategy to build expertise and mutual<br />
accountability.<br />
Teacher collaboration teams focus on the improvement of teaching and learning:<br />
■ Teacher teams engage in Looking At Student Work and Building Better Assignment<br />
Protocols to improve teaching and learning<br />
■ Teams create and communicate action plans for improving teaching.<br />
Data systems are created for internal accountability:<br />
■ Data is analyzed and action is taken to improve student learning.<br />
■ Student and families know individual student data, have set goals and have a plan of<br />
improvement and support.<br />
1 day per month of Professional Development for the ILT<br />
1 coaching day per month by a coach who has been a building principal and led a successful<br />
improvement effort with results to show.
Flippen/Learning Keys: Following a similar process, in January 2011, <strong>Tulsa</strong> <strong>Public</strong> <strong>Schools</strong><br />
contracted with The Flippen Group to conduct school improvement with the next seven priority<br />
schools in Tier I of TPS elementary schools. The Flippen Group utilized the District by Design<br />
process, taking a comprehensive approach when working with the 7 priority elementary schools<br />
(<strong>Anderson</strong>, Celia Clinton, Springdale, Remington, Hamilton, Sequoyah and Lindbergh) that<br />
were identified by their OCCT data and AYP data. The design for school improvement began<br />
with training for the leadership of the building. The leadership comprised of the principal and<br />
identified teacher leaders. The professional development and information was shared with the<br />
rest of their school’s staff. The Flippen Group aligned their work with the <strong>Tulsa</strong> <strong>Public</strong> <strong>Schools</strong><br />
Teacher Leader Effectiveness rubric. Below is a summary of the work conducted with the<br />
selected schools.<br />
• NEEDS ASSESSMENT‐ All 7 schools participated in a Needs Assessment in March 7‐12,<br />
2011 which included:<br />
o Curriculum and Planning<br />
o Instruction and Assessment<br />
o Professional development<br />
o Analysis of OCCT standardized state scores<br />
o Analysis of classroom instructional time.<br />
The Needs Assessment summary and findings for each of the 7 schools were reviewed by the<br />
Deputy Superintendent and his team as well as each of the principals. Monitoring and coaching<br />
for the principals and teachers were conducted to support each of the schools by Learning Keys<br />
consultants, Mr. House and his Executive Assistants, Wise Coach and other Curriculum and<br />
Instruction members.<br />
• Leadership Blueprint – This was a three day workshop held on April 5‐7, 2011. The<br />
principals and members of the Curriculum and Instruction team members discovered<br />
that relationships are at the core of performance; trust and respect are essential in any<br />
organization to help them grow and improve. The principals and other participants<br />
practiced specific techniques that helped them make clear and candid communication<br />
possible, in their personal and professional lives.<br />
• Organization Blueprint – This was a three day workshop held on October 11‐13, 2011.<br />
The principals of the 7 schools worked through systemic elements of their school<br />
(mission, core principles, vision, and capacity for change, alignment tools, accountability<br />
and internal communication. The principals learned essential facilitation skills that<br />
helped them guide their school through effective strategic‐planning process.<br />
• Capturing Kids’ Hearts ‐ This was a three day workshop in which the principals and<br />
their teachers attended in August 9‐11, 2011. The principals and their teachers
attended. The principals and teachers learned tools to build positive, productive,<br />
trusting relationships among themselves and their students. Principals and the teacher<br />
have a Capturing Kids Hearts rubric to measure their progress on meeting their<br />
classroom climate goals.<br />
LEARNING KEYS ‐ Learning Keys is the curriculum and instruction side of Flippen Group.<br />
Learning Keys provided needs assessment, training, and consulting services for the district and<br />
7 schools. Their team of consultants, all experienced professionals, assisted with identifying<br />
areas for improvement and implemented effective research‐based solutions for instructional<br />
leaders which are listed below:<br />
• SOLUTIONS FOR INSTRUCTIONAL LEADERS<br />
o Data Walks I and II‐ Data Walks I was conducted on April 25‐26, 2011 and Data<br />
Walks II training was conducted on May 12‐13, 2011. The 7 principals and their<br />
teacher leaders increased their visibility in the classrooms as well as focused<br />
them on specific instructional practices. The Data Walks I and II were aligned<br />
with the district’s TLE process. (Data Walks alignment with TLS process is<br />
attached.)<br />
o Data Walks Coaching – The Data Walks Coaching was conducted on September<br />
22, 2011, November 10, 2011, November 29, 2011 and December 13, 2011. A<br />
Learning Key consultant coached the 7 principals their teacher leaders on how to<br />
maximize the data walk process. (Samples of classroom data walk is attached.)<br />
o Engaging Students in the Right Work‐ The 7 principals and their teacher leaders<br />
participated in the training on August 15, 2011. The training provided a process<br />
to ensure that work given to the students meet the state’s grade level<br />
expectations and the work is relevant.<br />
o Level of Thinking – The training was conducted on November 29, 2011. The<br />
principals and their teacher leaders reviewed effective methods for coaching<br />
their staff toward designing lessons that promote students working and thinking<br />
at higher levels.<br />
o Student‐Friendly Learning Objectives‐ The training was conducted on<br />
September 22, 2011. Principals and their teacher leaders reviewed the criteria<br />
of writing student‐friendly learning objectives and practiced using the OCCT<br />
standards to write these objectives. The Core Curriculum was also aligned with<br />
the OCCT standards.<br />
o Data Walks Rubric ‐ This training was conducted on December 6, 2011. The<br />
principal and their teacher leader utilized the rubric that provide them with the<br />
direction to guide their staff in what instructional focus needs to occur in the<br />
classroom to promote student learning.
• CURRICULUM DEVELOPMENT‐ Learning Keys consultants worked with teachers across<br />
the district and Curriculum and Instruction with Math curriculum writing. This was<br />
conducted in June 2011.<br />
o Safety Net Curriculum‐Selected teachers from each grade level PK‐6 identified a<br />
very limited set of learning objectives that was aligned for each grade in Reading,<br />
Math, Social Studies and Science. This process empowered teachers to make<br />
wise decisions about which learning objectives are most important in a<br />
curriculum, and to ensure those topics are covered in a limited amount of time<br />
prior to state testing. (Reading Safety Nets work for reading was conducted at<br />
Springdale on October 5‐6, 2011. Math Safety Nets works was conducted at<br />
Hamilton on November 7‐8, 2011. Social Studies Safety Net work was conducted<br />
on November 15‐16, 201. Science Safety Net work was conducted on December<br />
13‐14 at Remington.)<br />
o Designing Engaging Lessons‐This training was conducted on June 7, 2011.<br />
Principals and teacher leaders were trained on how to design student‐friendly<br />
lessons that engage the students and prepare them for the state assessment.<br />
o Designing Engaging Student Work – This training was conducted on the morning<br />
of August 15, 2011. Principals and teacher leaders identified the five levels of<br />
student engagement and how the level of engagement impact learning<br />
retention.<br />
o Delivering Engaging Lessons – This training was conducted on the afternoon of<br />
August 15, 2011. Principals and teachers learned how to take a quality lesson<br />
they prepared in the design module and then plan how to effectively teach it in a<br />
way that maximizes the students’ understanding and retention.<br />
• District Conference Call Consulting – Beginning in April and ending in May, 2011 (6)<br />
conference calls were conducted with Flippen Group consultants to address any district<br />
or school needs. The participants in the conference calls were Mr. House and his<br />
Executive Assistants and members of Curriculum and Instruction.<br />
• District Consulting –A Flippen Group consultant met with Mr. House and his Executive<br />
Assistants and members of Curriculum and Instruction (7) times to gauge the<br />
professional development and progress of the schools toward school improvement.<br />
CONTINUATION OF SUPPORT TO THE 7 FLIPPEN GROUP SCHOOLS<br />
• Mr. House, School Improvement Office, <strong>Elementary</strong> Administrative Team members,<br />
<strong>Elementary</strong> Transformation and Turnaround Officer and principals wrote a 100 day plan<br />
on how to continue the school improvement work in the 7 schools. The Transformation<br />
and Turnaround Officer is continuing to provide support to principals and Staff<br />
Development Teachers on a monthly basis.
BRIDGES (Blending Research, Instruction, and Data to Grow Effective <strong>Schools</strong>)‐ In August<br />
2011, the Deputy Superintendent decided to identify a third cohort of schools to receive<br />
support in implementing turnaround principles. The newly created Office of School<br />
Improvement assumed the responsibility of facilitating the turnaround process through the<br />
BRIDGES process, which follows research ‐proven principles of effective turnaround models.<br />
The next nine schools on the district’s priority list were identified based upon newly‐received<br />
Spring 2011 OCCT results: McKinley, Burroughs, Kendall‐Whittier, Kerr, Gilcrease, Marshall,<br />
Skelly, Greeley, and Webster High School.<br />
Principals and Staff Development Teachers attend a full day of professional development every<br />
month with their instructional leadership teams. School sites are visited by members of the<br />
School Improvement Office throughout the month to support teams in the implementation<br />
process. The BRIDGES ILTs receive training in the following areas:<br />
Setting Expectations<br />
• Use multiple data sources to identify academic achievement gaps<br />
• Watch for student learning patterns<br />
• Use higher questions to examine why particular instructional practices are not working<br />
• Discussions about teaching and learning grounded in evidence and analysis rather than<br />
opinion and preconceptions<br />
• Shift accountability from the individual teacher to the teaching community<br />
Providing Research‐Based and Effective Instruction<br />
• Use Program of Studies and Core Curriculum Maps<br />
• Grade level team discussions/selection of research‐ based intervention programs in<br />
reading and math<br />
• Discussion/selection of research‐based programs to support higher‐achieving students<br />
Supporting Instruction in the Classroom<br />
• Attend weekly collaborative team meetings<br />
• Analyze student work and student data by asking the 4 questions: What do students<br />
need to learn? How will we know if they have learned it? What will we do if they don’t?<br />
What will we do if they already have?<br />
• Develop an intervention program using research‐based materials<br />
• Plan for embedded professional development to support programs<br />
• Allocate funding to support identified goals<br />
• Schedule daily common planning times<br />
Supervision and Monitoring of Instruction<br />
• Principal does walkthroughs to observe instruction and gives feedback<br />
• Teachers participate in peer observation and feedback<br />
• Teachers participate in collaborative teaching and assessment<br />
• Principal routinely reviews lesson plans and gives feedback<br />
Engaging Families and Community<br />
• Providing academic updates for parents regarding progress
• Monthly publication to families and community<br />
• Classroom teacher provides regular communication to parents<br />
• Coordinate regular activities to bring families and community to the building<br />
Using Data for Planning and Accountability<br />
• Use multiple data sources to identify academic achievement gaps<br />
• Watch for student learning patterns<br />
• Use higher questions to examine why particular instructional practices are not working<br />
• Discussions about teaching and learning grounded in evidence and analysis rather than<br />
opinion and preconceptions<br />
• Shift accountability from the individual teacher to the teaching community<br />
The following timeline chronicles the professional development topics in BRIDGES for the 2011‐<br />
2012 school year:<br />
September 21‐22, 2011<br />
• The Transformation Process<br />
• Establishing Professional Learning Communities<br />
• Creating a Collaborative Culture<br />
• The Role of the Instructional Leadership Team<br />
• Communication Styles and the Change Process<br />
• Accepting Data<br />
• School‐based Data Reflection<br />
• Creating a Powerful School Vision<br />
October 12, 2011<br />
• Understanding Scholastic Reading Inventory Data<br />
• Understanding WIDA/ACCESS Data for ELL students<br />
• Creating a Data Inventory of Multiple Data Sources<br />
• Writing SMART Goals for the school improvement plan (WISE plan)<br />
November 16, 2011<br />
• The Purpose of an Instructional Focus<br />
• Identifying an Instructional Focus<br />
• Effective Instructional Strategies<br />
• Needs Assessment to Identify Threats to the Turnaround Process
January 18, 2012<br />
• Success Analysis<br />
• The Value of a Clear and Shared Focus<br />
• The Implementation and Communication of an Instructional Focus<br />
• Implementation of Best Practices<br />
February 15, 2012<br />
• The Continuous Improvement Cycle<br />
• Characteristics of Effective Professional Development<br />
• Approaches to Professional Development<br />
• Understanding Change
TLE Objectives and Progress Report – January 31, 2012<br />
TEACHER AND LEADER EFFECTIVENESS (TLE) INITIATIVE<br />
OVERARCHING INITIATIVE GOALS<br />
• Every student will have a quantifiably effective teacher.<br />
• Effective teachers will be supported by effective leadership in a district that is<br />
centered on a performance-based culture.<br />
• Every student will be college and career-ready.<br />
Objectives- Year 1 (2010-2011) Objectives- Year 2 (2011-2012) Objectives-Year 3 (2012-2013)<br />
Collect baseline data for<br />
outcomes and milestones (see<br />
college readiness measures<br />
below)<br />
Design and calibrate<br />
performance rubric for<br />
teachers<br />
Set district performance<br />
standards<br />
Reduce the shortfall of<br />
students scoring at satisfactory<br />
or above on state tests by 12%<br />
Raising college-readiness<br />
from 7-10%.<br />
Reduce the racial/ethnic<br />
achievement gap by 2%.<br />
Reduce the socio-economic<br />
achievement gap by 2%.<br />
Reduce the shortfall of<br />
students scoring at<br />
satisfactory or above on state<br />
tests by 25%.<br />
Raising college-readiness from<br />
10-15%.<br />
Reduce the racial/ethnic<br />
achievement gap by 3%.<br />
Reduce the socio-economic<br />
achievement gap by 3%.<br />
Reduce the shortfall of<br />
students scoring at<br />
satisfactory or above on state<br />
tests by 40%.<br />
Increase graduation rate from<br />
69% to 70%<br />
Increase the graduation rate<br />
from 70-73%.<br />
Increase the graduation rate<br />
from 73-77%.<br />
Set teacher performance<br />
standards<br />
Quantify that 85% of teachers<br />
meet or exceed district<br />
performance standards.<br />
Quantify that 90% of teachers<br />
meet or exceed district<br />
performance standards.<br />
Receive first year of value<br />
added data<br />
Streamline allocation and<br />
hiring timelines<br />
Begin linking student data for<br />
purposes of value-added data<br />
analysis<br />
Receive 3 years of valuedadded<br />
data.<br />
Demonstrate that 100% of<br />
LIM (low-income/minority)<br />
schools are 90% staffed with<br />
effective teachers.<br />
Link student achievement<br />
data for value added analysis<br />
Receive value-added data<br />
Demonstrate that 100% of LIM<br />
schools are 95% staffed with<br />
effective teachers.<br />
Link student achievement data<br />
for value added analysis<br />
Page 1
TLE Objectives and Progress Report – January 31, 2012<br />
PROGRESS TO-DATE<br />
Progress is reported under each of the stated objectives:<br />
Student levels of college readiness<br />
TPS has adopted 11 steps to college readiness, a more comprehensive, gradual way to define<br />
college readiness at several points in a student’s academic life. We proposed the used of these<br />
metrics as more accurate measures for defining college readiness (see revised Appendix A):<br />
1. Advanced reading: Grades K-5<br />
2. Advanced Math: 5 th Grade<br />
3. Advanced Reading: 6 th -8 th Grade<br />
4. Pre-Algebra I: 7 th Grade<br />
5. Algebra I: “C” or higher by 8 th Grade<br />
6. Explore: 18<br />
7. Plan: 21<br />
8. Algebra II: “C” or Higher by 11 th Grade<br />
9. AP Exam: 3<br />
10. Concurrent Enrollment<br />
11. ACT 24<br />
Principals incorporated the college readiness measures into their individual dashboards this<br />
school year and are tracking their progress towards these goals.<br />
Design and calibrate the performance rubric<br />
• In addition to fully implementing observation-based evaluations during 2010-2011, the<br />
district revised and improved the rubric during the summer of 2011 based on teacher,<br />
administrator and stakeholder feedback.<br />
• TPS also developed rubrics for counselors, nurses, deans, speech pathologists and<br />
librarians which will be used this year.<br />
Create a system of feedback and support for teachers<br />
The district has created a web of supports for teachers via targeted professional development<br />
aligned with the evaluation rubric, new teacher supports through the New Teacher Center,<br />
intensive mentoring and coaching for struggling teachers, and site-based professional<br />
development.<br />
Quantified that 85% of teachers meet or exceed performance<br />
• <strong>Tulsa</strong> <strong>Public</strong> <strong>Schools</strong> fully implemented an observation-based evaluation system which<br />
affected all teachers.<br />
• The district was able to collect baseline data which revealed 2% of teachers were rated<br />
as ineffective or in need of improvement. This may seem to be a low percentage,<br />
Page 2
TLE Objectives and Progress Report – January 31, 2012<br />
however when compared to the previous year’s total (5 teachers, or less than 1%), the<br />
district has made remarkable improvements in differentiating performance and<br />
identifying teachers in need of improvement. In addition, 2011 was also the first year of<br />
implementation and principals’ understanding of the rubric varied across sites. Rater<br />
agreement and accuracy will be a focus for this school year.<br />
Receive three years of valued-added data<br />
• Teacher level data for 2010 and 2011 was released this past October. By fall of 2012,<br />
TPS will have 3 years of teacher-linked value added data available for all teachers in<br />
tested subjects, grades 4-11. (Note: We have already received three-year school level<br />
value added data).<br />
• In October 2011, the district shared value added estimates with principals and teachers<br />
in a low-stakes fashion as value added is not yet part of the evaluation. This intentional<br />
and gradual rollout provides value added estimates to principals and teachers to assist<br />
them in identifying best practices, encourage collaboration within and across schools,<br />
and discover areas for improvement. In order to promote teacher trust, the district<br />
embargoed teacher level reports to all but the individual teachers. TPS would like to<br />
ensure principals will not be prematurely biased by single year results. The district<br />
believes that as teachers and principals become more comfortable with the use of value<br />
added data for these purposes, they will be more likely to embrace it as one of the<br />
measures used to evaluate their effectiveness in the near future. Plans are currently in<br />
place to share teacher-level value added reports with their respective principals in May<br />
of 2012.<br />
• Teacher feedback collected upon rollout of value added reports(n=385):<br />
o 63% perceived value added data as very useful<br />
o 68% felt comfortable with the approach the district has taken to use value added<br />
analysis for instructional purposes prior to using it for evaluation<br />
o 57% perceived they had a good understanding of value added after the first<br />
round of trainings.<br />
• Continuous training is under way to ensure full understanding of value added measures<br />
by not only teachers and principals but also the entire district (web portal, continuous<br />
professional development, plans for additional support on how to respond to data, etc.)<br />
Set district performance standards<br />
In addition to teacher performance standards, principal performance standards were<br />
established and used in the evaluation of school administrators in May of 2011. Furthermore,<br />
the Board approved district-level metrics to gauge progress made on the five strategic core<br />
goals and the board receives monthly updates on each.<br />
Page 3
TLE Objectives and Progress Report – January 31, 2012<br />
Streamline allocation and hiring timeline<br />
• The trim and transfer process used in 2010-2011 included the new requirement that any<br />
teachers scoring less than a 3 (effective) would not be placed on the trim list but moved<br />
toward resignation, retirement or board action.<br />
• The new staff allocation process was completed ahead of schedule in the spring of 2012.<br />
However, due to school closures in late May, allocations had to be recalculated based<br />
on new school boundaries, new grade configurations, certification requirements (middle<br />
school vs. junior high – 6 th grade) and hiring took place through the first weeks of the<br />
school year.<br />
• Low-income/minority (LIM) schools received first priority in filling staffing allocations<br />
and access to effective teacher placements.<br />
Contract with Battelle for Kids to begin linking student achievement to program<br />
design and implementation and value added data measurements.<br />
Student achievement data for 2009-2010 and 2010-2011 is complete. Battelle provided support<br />
in the linkage of teacher-student data, planning and roll out of value added data, and<br />
subsequent professional development during the summer and fall.<br />
Performance Management<br />
The district began the first phase of its central office performance management initiative with<br />
Battelle for Kids. The Human Capital and Finance Department were the first to develop<br />
balanced scorecards which will eventually be linked to individual performance. Both<br />
departments are continuing on to the next phase of learning how to respond to the data and<br />
address process gaps. A Battelle for Kids contract is part of this year’s budget request to fund<br />
the replication of this process with all other central office departments during 2012.<br />
KEY ACCOMPLISHMENTS<br />
<strong>Tulsa</strong> <strong>Public</strong> <strong>Schools</strong> has continued to gain momentum and make significant strides over the<br />
past 18 months in the implementation of the Teacher and Leader Effectiveness initiative and<br />
the district overall strategic priorities. Despite undergoing major reorganization and<br />
approaching levels of change fatigue, TPS embarked upon the consolidation of 14 school sites<br />
during 2011 and implemented recommended changes with significant stakeholder support.<br />
While in the midst of these dramatic changes TPS was able to make headway in the following<br />
areas:<br />
Page 4
TLE Objectives and Progress Report – January 31, 2012<br />
Support for ineffective teachers/leaders<br />
• 136 teacher Personal Development Plans (PDP) issued in 2010-2011 (compared to 5 in<br />
‘09-’10)<br />
• 29 teachers placed in intensive mentoring program [QUEST: An intensive mentoring<br />
program focused on teachers scoring 1’s and 2’s. Learning facilitators (master coaches)<br />
spend at minimum 84 hours with a struggling teacher over an 8 week period providing<br />
specific support and targeted professional development]<br />
• 31 (35%) principals received PDPs in 2010-2011 (compared to 2 in ‘09-’10)<br />
Exit of ineffective teachers/principals<br />
• 57 teachers exited from District for performance in 2010-2011 (compared to 0 in ‘09-<br />
’10)<br />
• 12 principals exited from District for performance in 2010-2011 (compared to 0 in‘09-<br />
’10)<br />
• 7 principals removed (demoted) from principal positions in 2010-2011 (compared to 0 in<br />
‘09-’10)<br />
Performance-based RIF Policy<br />
Garner full support and approval of a performance-based reduction-in-force policy, negotiated<br />
and approved by 98% of the union membership (measures are currently in place and more<br />
comprehensive language takes effect in July 2012).<br />
Evaluation system state model<br />
<strong>Tulsa</strong>’s experience as an early implementer influenced the State Commission for Teacher and<br />
Leader Effectiveness to recommend <strong>Tulsa</strong> as the state default system. The State Board of<br />
Education named <strong>Tulsa</strong>’s TLE evaluation system the presumptive default for the pilot<br />
implementation year of 2012-2013. The Marzano and Danielson models (both national<br />
commercial frameworks) were approved as acceptable models as well and districts will have a<br />
choice to implement one of the three during the pilot year.<br />
Teacher recruitment<br />
The Urban Education Committee was formed with participation from Oklahoma State<br />
University, Northeastern State University, University of <strong>Tulsa</strong> and Teach for America. Goals<br />
include:<br />
a.) Increase the recruitment of the highest quality candidates for teacher<br />
preparation programs;<br />
b.) Align current teacher effectiveness efforts with the curriculum and<br />
preparation provided in the programs;<br />
c.) Facilitate sharing of best practices among participants.<br />
Initial data analysis of the evaluation data by teacher preparation program and by traditional vs.<br />
alternative certification will be completed in the next few months. We expect to share the<br />
results with our teacher preparation program partners and use them to evaluate and improve<br />
the pipeline. In addition, TPS has developed a strong partnership with Teach for America for the<br />
Page 5
TLE Objectives and Progress Report – January 31, 2012<br />
past 3 years, as evidence by the fact that the district was selected as the ninth regional site for<br />
TFA Summer institute. Over 650 corps members will be in <strong>Tulsa</strong> and along with TPS faculty<br />
advisors will teach summer school to an estimated 2500 to 3000 students in June 2012.<br />
Creation of 2 new teacher leader roles (Staff Development Teacher and New Teacher<br />
Mentors)<br />
These expanded teacher leader career opportunities have placed highly effective teachers in<br />
coaching, staff development and mentoring positions. The district placed 40 Staff Development<br />
teachers at priority sites to embed professional development at the building level. The New<br />
Teacher Mentors are supporting first and second year teachers. As the district prioritizes key<br />
initiatives that must be funded, the full expansion of these 2 positions rises to the top of the<br />
list.<br />
Value added rollout success<br />
The District rolled out its first value-added reporting in June 2011. Principals, assistant<br />
principals and lead teachers received their 2009-2010 school-level reports only after receiving<br />
several hours of intensive training on value-added methodology and on how this information<br />
should be used as an important tool for identifying effective instructional practices. Teacher<br />
level reports and 2010-2011 school level reports were released in October of 2011. Surveys<br />
conducted after the rollout of the reports revealed that this delivery method was successful in<br />
all respects. On the whole, participants felt comfortable with their understanding of how valueadded<br />
works, and, most importantly, agreed that value-added reports would help them identify<br />
and replicate the practices and programs proven to be real drivers in increasing student<br />
achievement. Plans are underway to release three-year school level reports in early 2012.<br />
NEXT YEAR OBJECTIVES AND ACTIVITIES - MAJOR ACTIVITIES FOR 2012<br />
In addition to the objectives referenced above (see Page 1), the following strategic activities are<br />
also planned for 2012:<br />
• Wider alignment of district wide professional development to teacher evaluation<br />
results. Currently, only targeted professional development is provided to<br />
struggling teachers according to their areas of need. The district plans on making<br />
aligned and relevant professional development a priority for all teachers.<br />
• Develop of a comprehensive rater certification process to ensure rater<br />
agreement and prevent rater drift. Based on the first year experience and<br />
supported by the findings of other Gates partner districts, principals and<br />
assistant principals need continuous training on using the rubric and<br />
differentiating levels of performance. A rater certification process would require<br />
principals to demonstrate mastery prior to evaluating teachers.<br />
Page 6
TLE Objectives and Progress Report – January 31, 2012<br />
• Develop a comprehensive plan to measure student growth in non-tested grades<br />
and subjects. Value added data is only available for teachers in tested grades and<br />
subjects. The district plans on leveraging what is learned from other Gates sites<br />
and technical assistance from our value added provider to develop a way to<br />
measure student growth for other grades and subjects.<br />
• Follow up with recommendations from curriculum implementation audit. The<br />
independent audit was conducted in the fall of 2011 to evaluate how well<br />
district-wide curricular initiatives have been implemented. This information will<br />
assist district leadership which initiatives provide a sizable return on investment,<br />
which may need to be reassessed and/or phased out.<br />
LESSONS LEARNED<br />
• Importance of the collaboration and constant communication with stakeholders is a key<br />
lesson learned. The district would not have been able to garner overwhelming support<br />
for the performance based reduction in force provisions, the exit of ineffective teachers,<br />
and the higher levels of accountability without some carefully cultivated relationships.<br />
• The impact of human capital practices and policies especially during periods of district<br />
restructuring proved to be a significant lesson learned this year. In the midst of school<br />
closures, principals were faced with the complexities of maintaining effective teaching<br />
teams and responding to personnel changes. Our work to improve Human Capital<br />
processes has to continue if we are to effectively support schools.<br />
• As 12 principals exited this year, the district faced a shortage of job ready<br />
administrators. The district is keenly aware of the need for a solid principal pipeline and<br />
has made great strides in developing the talent pool for future positions. With the newly<br />
designed Assistant Principal Leadership Academy, first and second year assistant<br />
principals receive targeted leadership development support and the opportunity to be<br />
considered for future principal posts. Based upon research based models from New<br />
Leaders/New <strong>Schools</strong>, this pilot will inform the design of a full principal preparation<br />
program.<br />
Page 7
<strong>Anderson</strong> <strong>Elementary</strong> School<br />
Comprehensive Plan Report<br />
Key Indicators are shown in RED.<br />
School Leadership Team CI<br />
Academic Learning and Performance<br />
Essential Element 1 - Curriculum<br />
Indicator<br />
EEIA-1.01 - Instructional teams align the curriculum with state and national academic<br />
content and process standards that identify the depth of knowledge, skills, and abilities<br />
needed for student success. (233)<br />
Status In Plan / No Tasks Created<br />
Rubric Score Initial: 1<br />
Assessment Level of Development: Initial: No development or Implementation 08/05/2010<br />
Index: 3 (Priority Score x Opportunity Score)<br />
Priority Score: 1 (3 - highest, 2 - medium, 1 - lowest)<br />
Opportunity Score: 3 (3 - relatively easy to address, 2 - accomplished<br />
within current policy and budget conditions, 1 -<br />
requires changes in current policy and budget<br />
conditions)<br />
Describe current level of<br />
development:<br />
Plan Assigned to: Marcus Moore<br />
How it will look when fully met:<br />
Target Date: 05/31/2012<br />
Note: In the new site improvement plan learning and writing<br />
process, this indicator was inadvertently chosen and therefore<br />
we will not create a plan for this objective at this time, but will<br />
instead focus on the required indicators and identified areas of<br />
greatest need or interest.<br />
Teams will work together across all grade levels to determine<br />
and align the PASS being taught in the classrooms.<br />
Page: 1 of 41
Indicator<br />
EEIA-1.02 - Instructional teams articulate the learning standards through grade level<br />
objectives. (234)<br />
Status Tasks completed: 0 of 2 (0%)<br />
Rubric Score Initial: 2<br />
Assessment Level of Development: Initial: Limited Development 10/31/2011<br />
Index: 9 (Priority Score x Opportunity Score)<br />
Priority Score: 3 (3 - highest, 2 - medium, 1 - lowest)<br />
Opportunity Score: 3 (3 - relatively easy to address, 2 - accomplished<br />
within current policy and budget conditions, 1 -<br />
requires changes in current policy and budget<br />
conditions)<br />
Describe current level of<br />
development:<br />
Plan Assigned to: Valerie Thomas-Wooden<br />
How it will look when fully met:<br />
Target Date: 01/01/2012<br />
Tasks:<br />
At this time 25% of teachers are posting objectives in kidfriendly<br />
verbiage in their classrooms. This data was obtained<br />
through the implementation of Flippen Group Data Walks<br />
performed by the principal and staff development teacher.<br />
All teachers will have a specific space in their classroom which<br />
will display the objectives that the students are working on<br />
each day. The objectives will be written in kid-friendly<br />
verbiage and will change as the lessons change.<br />
1. An exemplar board will be created to show teachers the expectation.<br />
Assigned to:<br />
Target Completion Date: 12/20/2011<br />
Comments:<br />
Valerie Thomas-Wooden<br />
2. Data walks will be conducted in order to determine which teachers have their objectives<br />
posted and which teachers have not yet met the expectation.<br />
Assigned to:<br />
Target Completion Date: 12/20/2011<br />
Comments:<br />
Valerie Thomas-Wooden<br />
Implement Percent Task Complete: Tasks completed: 0 of 2 (0%)<br />
Indicator<br />
EEIA-1.03 - Instructional teams engage in discussions within the school which result in<br />
the elimination of unnecessary overlaps and close curricular gaps. (235)<br />
Status In Plan / No Tasks Created<br />
Rubric Score Initial: 2<br />
Assessment Level of Development: Initial: Limited Development 09/22/2010<br />
Index: 6 (Priority Score x Opportunity Score)<br />
Priority Score: 3 (3 - highest, 2 - medium, 1 - lowest)<br />
Opportunity Score: 2 (3 - relatively easy to address, 2 - accomplished<br />
within current policy and budget conditions, 1 -<br />
requires changes in current policy and budget<br />
conditions)<br />
Page: 2 of 41
Describe current level of<br />
development:<br />
Plan Assigned to: Marcus Moore<br />
How it will look when fully met:<br />
Target Date: 05/31/2012<br />
Note: In the new site improvement plan learning and writing<br />
process, this indicator was inadvertently chosen and therefore<br />
we will not create a plan for this objective at this time, but will<br />
instead focus on the required indicators and identified areas of<br />
greatest need or interest.<br />
Limited Development - The instructional teams develop and<br />
sometimes implement a process to eliminate unnecessary<br />
overlaps and close curricular gaps. Staff at <strong>Anderson</strong> need<br />
further development in analysis of data to eliminate curricular<br />
gaps. All staff must utilize different forms of data to<br />
determine where the gaps are and then strategies must be put<br />
in place to fill those gaps.<br />
Indicator<br />
EEIA-1.04 - Instructional teams identify key curriculum vertical transition points between<br />
and among early childhood and elementary school; elementary and middle school; and<br />
middle school and high school to eliminate unnecessary overlaps and close curricular<br />
gaps (236)<br />
Status Tasks completed: 1 of 5 (20%)<br />
Rubric Score Initial: 1<br />
Assessment Level of Development: Initial: No development or Implementation 09/22/2010<br />
Index: 4 (Priority Score x Opportunity Score)<br />
Priority Score: 2 (3 - highest, 2 - medium, 1 - lowest)<br />
Opportunity Score: 2 (3 - relatively easy to address, 2 - accomplished<br />
within current policy and budget conditions, 1 -<br />
requires changes in current policy and budget<br />
conditions)<br />
Describe current level of<br />
development:<br />
Plan Assigned to: Nina Eccles<br />
How it will look when fully met:<br />
Target Date: 05/01/2012<br />
Tasks:<br />
As a result of principal observation and teacher survey,<br />
currently we have limited vertical articulation between grade<br />
levels and no articulation between elementary and middle<br />
school teachers.<br />
At <strong>Anderson</strong> <strong>Elementary</strong>, our instructional teams will<br />
implement and communicate an established process within our<br />
grade level teams to identify curricular gaps and overlaps. Our<br />
teams will plan with seventh grade teachers from area junior<br />
highs in order to better prepare our students for the junior<br />
high school experience.<br />
1. After each benchmarking period, part of a regularly scheduled grade level collaboration<br />
meeting will be devoted to data analysis.<br />
Assigned to:<br />
Target Completion Date: 03/01/2012<br />
Comments:<br />
Valerie Thomas-Wooden<br />
2. After discussion with entire faculty, grade level teams will meet to review information shared<br />
and to investigate the possibility of supplementing curriculum, reteaching, or designing units of<br />
study in order to meet the curricular needs of the students for the next grade level.<br />
Page: 3 of 41
Assigned to:<br />
Target Completion Date: 12/31/2011<br />
Comments:<br />
Task Completed: 04/01/2011<br />
Valerie Thomas-Wooden<br />
The instructional teams meet weekly with school leadership for<br />
this very purpose all year, as evidenced in agendas and<br />
principal schedule.<br />
3. Reteaching or newly designed units of study will be included in lesson plans and will be<br />
observed in principal and facilitator walk-throughs and collaboration.<br />
Assigned to:<br />
Marcus Moore<br />
Target Completion Date: 04/01/2012<br />
Comments:<br />
4. Re-establish the practice of our 6th grade teachers meeting in the spring with McLain Junior<br />
High School 7th grade teachers. Ask McLain to investigate the possibility of inviting all feeder<br />
school 6th grade teachers for a formal meeting as we had in the past.<br />
Assigned to:<br />
Michael Stick<br />
Target Completion Date: 05/01/2012<br />
Comments:<br />
5. Invesitgate the possibility of the fifth grade students visiting the magnet/charter sixth grade<br />
opportunities within the district.<br />
Assigned to:<br />
Ashley Cromwell<br />
Target Completion Date: 05/15/2012<br />
Comments:<br />
Implement Percent Task Complete: Tasks completed: 1 of 5 (20%)<br />
Indicator<br />
EEIA-1.05 - Instructional teams ensure curriculum provides effective links to career,<br />
postsecondary education, and life options. (237)<br />
Status Tasks completed: 0 of 3 (0%)<br />
Rubric Score Initial: 1<br />
Assessment Level of Development: Initial: No development or Implementation 10/31/2011<br />
Index: 4 (Priority Score x Opportunity Score)<br />
Priority Score: 2 (3 - highest, 2 - medium, 1 - lowest)<br />
Opportunity Score: 2 (3 - relatively easy to address, 2 - accomplished<br />
within current policy and budget conditions, 1 -<br />
requires changes in current policy and budget<br />
conditions)<br />
Describe current level of<br />
development:<br />
Plan Assigned to: Kathleen Jeffries<br />
How it will look when fully met:<br />
Target Date: 05/31/2012<br />
Tasks:<br />
Currently classroom teachers are incorporating this indicator<br />
into their daily lessons in the third through sixth grades but it<br />
is not formally assessed or listed in teacher leson plans.<br />
Teachers will include daily life applications to the objectives<br />
being taught. The counselor will also provide resources such<br />
as guest speaker, career counseling and collaboration with<br />
other agencies (TCC) for teachers and students.<br />
Page: 4 of 41
1. Teachers will incorporate real life links to the daily lessons. This will entail creating meaningful<br />
experiences that show students how the objective they are working on can be applied to their<br />
daily life when they finish school.<br />
Assigned to:<br />
Ashley Cromwell<br />
Target Completion Date: 05/31/2012<br />
Comments:<br />
2. Fifth (possibly sixth) grade students will attend college day at <strong>Tulsa</strong> Community College in an<br />
effort to expose them to the benefits of furthering their education past high school.<br />
Assigned to:<br />
Kathleen Jeffries<br />
Target Completion Date: 05/31/2012<br />
Comments:<br />
3. Teachers will use technology (the internet) to expose students to various careers and college<br />
opportunities as part of the social studies curriculum.<br />
Assigned to:<br />
Leah Allison<br />
Target Completion Date: 05/31/2012<br />
Comments:<br />
Implement Percent Task Complete: Tasks completed: 0 of 3 (0%)<br />
Indicator<br />
EEIA-1.06 - Instructional teams review alignment to standards and revise site-level<br />
curriculum accordingly. (238)<br />
Status Tasks completed: 0 of 4 (0%)<br />
Rubric Score Initial: 2<br />
Assessment Level of Development: Initial: Limited Development 10/31/2011<br />
Index: 6 (Priority Score x Opportunity Score)<br />
Priority Score: 3 (3 - highest, 2 - medium, 1 - lowest)<br />
Opportunity Score: 2 (3 - relatively easy to address, 2 - accomplished<br />
within current policy and budget conditions, 1 -<br />
requires changes in current policy and budget<br />
conditions)<br />
Describe current level of<br />
development:<br />
Plan Assigned to: Lizzie Godwin<br />
How it will look when fully met:<br />
Target Date: 05/31/2012<br />
Tasks:<br />
Teachers are using the standards during collaboration<br />
meetings to create team lesson plans each week.<br />
Teachers will meet in collaborative meetings to plan and then<br />
as a whole group to plan across the grade levels using current<br />
Oklahoma PASS objectives as well as intergrating Common<br />
Core when appropriate. This will help teachers begin the<br />
process of transitioning to full implimentation of the Common<br />
Core curriculum by 2014.<br />
1. Teachers will be provided with a template to take notes during their collaboration meetings.<br />
Assigned to:<br />
Marcus Moore<br />
Target Completion Date: 12/20/2011<br />
Comments:<br />
2. Teachers will be provided with a template for their lesson plans<br />
Page: 5 of 41
Assigned to:<br />
Marcus Moore<br />
Target Completion Date: 11/30/2011<br />
Comments:<br />
3. Teachers will be asked to turn in their lessons and notes from their collaboration meetings<br />
each week.<br />
Assigned to:<br />
Marcus Moore<br />
Target Completion Date: 12/20/2011<br />
Comments:<br />
4. As the alignment of Common Core becomes available for each grade level, we will begin using<br />
those objectives to direct classroom instruction.<br />
Assigned to:<br />
Target Completion Date: 05/15/2012<br />
Comments:<br />
Valerie Thomas-Wooden<br />
Implement Percent Task Complete: Tasks completed: 0 of 4 (0%)<br />
Indicator<br />
EEIA-1.07 - School leadership and instructional teams ensure all students have access to<br />
the common academic core curriculum. (239)<br />
Status In Plan / No Tasks Created<br />
Rubric Score Initial: 1<br />
Assessment Level of Development: Initial: No development or Implementation 09/22/2010<br />
Index: 1 (Priority Score x Opportunity Score)<br />
Priority Score: 1 (3 - highest, 2 - medium, 1 - lowest)<br />
Opportunity Score: 1 (3 - relatively easy to address, 2 - accomplished<br />
within current policy and budget conditions, 1 -<br />
requires changes in current policy and budget<br />
conditions)<br />
Describe current level of<br />
development:<br />
Plan Assigned to: Marcus Moore<br />
How it will look when fully met:<br />
Target Date: 05/31/2012<br />
Note: In the new site improvement plan learning and writing<br />
process, this indicator was inadvertently chosen and therefore<br />
we will not create a plan for this objective at this time, but will<br />
instead focus on the required indicators and identified areas of<br />
greatest need or interest.<br />
Teachers will be using research based materials as well as<br />
state adopted curriculum to create lesson plans.<br />
Page: 6 of 41
Academic Learning and Performance<br />
Essential Element 2 - Classroom Evaluation and Assessment<br />
Indicator<br />
EEIB-2.01 - All teachers provide multiple classroom assessments that are frequent,<br />
rigorous, and aligned to standards. (240)<br />
Status Tasks completed: 0 of 2 (0%)<br />
Rubric Score Initial: 1<br />
Assessment Level of Development: Initial: No development or Implementation 11/02/2011<br />
Index: 6 (Priority Score x Opportunity Score)<br />
Priority Score: 3 (3 - highest, 2 - medium, 1 - lowest)<br />
Opportunity Score: 2 (3 - relatively easy to address, 2 - accomplished<br />
within current policy and budget conditions, 1 -<br />
requires changes in current policy and budget<br />
conditions)<br />
Describe current level of<br />
development:<br />
Plan Assigned to: Julie Bloch<br />
How it will look when fully met:<br />
Target Date: 05/31/2012<br />
Tasks:<br />
Currently only a handful of teachers are using teacher created<br />
assessments and assessments provided through state adopted<br />
curriculum in their classrooms.<br />
All teachers will use weekly assessments to monitor student<br />
schievement.<br />
1. Teachers will use teacher created assessments as well as assessments provided by state<br />
adopted curriculum in their classrooms.<br />
Assigned to:<br />
Julie Bloch<br />
Target Completion Date: 05/31/2012<br />
Comments:<br />
Teachers will be given support for assessment development<br />
during PLCs.<br />
2. Teachers will be provided with sample assessments to use as a guide when creating their own<br />
assessments.<br />
Assigned to:<br />
Target Completion Date: 05/31/2012<br />
Comments:<br />
Valerie Thomas-Wooden<br />
The Staff Development Teacher will work one on one with<br />
teachers to determine their assessment needs.<br />
Implement Percent Task Complete: Tasks completed: 0 of 2 (0%)<br />
Indicator<br />
EEIB-2.02 - All teachers collaborate to develop common formative assessments and<br />
authentic assessment tasks (such as portfolios or projects) that are aligned with state<br />
standards. (241)<br />
Status In Plan / No Tasks Created<br />
Rubric Score Initial: 2<br />
Assessment Level of Development: Initial: Limited Development 11/02/2011<br />
Index: 6 (Priority Score x Opportunity Score)<br />
Priority Score: 3 (3 - highest, 2 - medium, 1 - lowest)<br />
Page: 7 of 41
Opportunity Score: 2 (3 - relatively easy to address, 2 - accomplished<br />
within current policy and budget conditions, 1 -<br />
requires changes in current policy and budget<br />
conditions)<br />
Describe current level of<br />
development:<br />
Plan Assigned to: Leah Allison<br />
How it will look when fully met:<br />
Target Date: 05/31/2012<br />
Teachers currently attend collaborative planning meetings<br />
however assessments are not often the focus of these<br />
meetings. Weekly planning and student behavior are the main<br />
focus of these meetings.<br />
This is not a required indicator and will not be addressed at<br />
this time.<br />
Indicator<br />
EEIB-2.04 - All students can articulate expectations in each class and know what is<br />
required to be proficient. (243)<br />
Status Tasks completed: 0 of 3 (0%)<br />
Rubric Score Initial: 2<br />
Assessment Level of Development: Initial: Limited Development 11/02/2011<br />
Index: 6 (Priority Score x Opportunity Score)<br />
Priority Score: 3 (3 - highest, 2 - medium, 1 - lowest)<br />
Opportunity Score: 2 (3 - relatively easy to address, 2 - accomplished<br />
within current policy and budget conditions, 1 -<br />
requires changes in current policy and budget<br />
conditions)<br />
Describe current level of<br />
development:<br />
Plan Assigned to: Valerie Thomas-Wooden<br />
How it will look when fully met:<br />
Target Date: 05/31/2012<br />
Tasks:<br />
Teachers are working toward this goal by incorporating the<br />
use of the Flippen Group's strategies.<br />
Students will be able to talk to the objectives they are<br />
currently working on in the classroom.<br />
1. The staff development teacher will provide a professional learning community on creating kid<br />
friendly objectives.<br />
Assigned to:<br />
Target Completion Date: 05/31/2012<br />
Comments:<br />
Valerie Thomas-Wooden<br />
2. Teachers will use the methods provided by the Flippen Group to post and display objectives.<br />
Assigned to:<br />
Target Completion Date: 05/31/2012<br />
Comments:<br />
Valerie Thomas-Wooden<br />
3. Data walks will be as a method of collecting data to ensure that all teachers are meeting the<br />
expectation.<br />
Assigned to:<br />
Target Completion Date: 05/31/2012<br />
Valerie Thomas-Wooden<br />
Page: 8 of 41
Comments:<br />
Implement Percent Task Complete: Tasks completed: 0 of 3 (0%)<br />
Indicator<br />
EEIB-2.05 - All teachers use test scores, including pre- and post-test results, to identify<br />
instructional and curriculum gaps, modify units of study, and reteach as appropriate.<br />
(244)<br />
Status Tasks completed: 1 of 4 (25%)<br />
Rubric Score Initial: 2<br />
Assessment Level of Development: Initial: Limited Development 12/13/2010<br />
Index: 6 (Priority Score x Opportunity Score)<br />
Priority Score: 3 (3 - highest, 2 - medium, 1 - lowest)<br />
Opportunity Score: 2 (3 - relatively easy to address, 2 - accomplished<br />
within current policy and budget conditions, 1 -<br />
requires changes in current policy and budget<br />
conditions)<br />
Describe current level of<br />
development:<br />
Plan Assigned to: Marcus Moore<br />
How it will look when fully met:<br />
Target Date: 05/31/2012<br />
Tasks:<br />
At <strong>Anderson</strong> <strong>Elementary</strong>,as a result of current scores and<br />
principal observations, we know that some teachers do<br />
analyze data to the point of reteaching and unit modification;<br />
however, while data is thoroughly analyzed, time restraints<br />
and new teacher capacity sometimes limits the appropriate<br />
follow-up to the analysis in every day teaching.<br />
At <strong>Anderson</strong> <strong>Elementary</strong>, all teachers will analyze test scores<br />
to identify curricular and instructional gaps and will use these<br />
results to re-teach as appropriate and to modify units of study.<br />
1. Upper grade level teams will continue to meet after each benchmarking period and when<br />
OCCT results are available to analyze strengths and weaknesses in student achievement.<br />
Assigned to:<br />
Ashley Cromwell<br />
Target Completion Date: 05/31/2012<br />
Comments:<br />
2. Time during lower grade level team meetings will be established for the purpose of analyzing<br />
data (DIBELS, early childhood screening, 2nd grade pre- and post- tests, Scott Foresman and<br />
enVision Math, mastery tests for SRA).<br />
Assigned to:<br />
Marcus Moore<br />
Target Completion Date: 05/31/2012<br />
Comments:<br />
Task Completed: 04/30/2011<br />
This has occurred all year. All teams meet with school<br />
leadership weekly.<br />
3. Collaborative meeting time will be devoted to in-house inservice on accessing the online preand<br />
post- tests provided by Scott Foresman and enVision programs which would then be utilized<br />
appropriately by all grade levels.<br />
Assigned to:<br />
Marcus Moore<br />
Page: 9 of 41
Target Completion Date: 05/31/2012<br />
Comments:<br />
4. Reteaching and the use of newly designed units of study will be included in lesson plans and<br />
will be observed in principal walk-throughs and collaboration.<br />
Assigned to:<br />
Marcus Moore<br />
Target Completion Date: 05/31/2012<br />
Comments:<br />
Implement Percent Task Complete: Tasks completed: 1 of 4 (25%)<br />
Indicator<br />
EEIB-2.06 - Instructional teams use student learning data to identify students in need of<br />
tiered instructional support or enhancement. (245)<br />
Status Tasks completed: 2 of 3 (67%)<br />
Rubric Score Initial: 2<br />
Assessment Level of Development: Initial: Limited Development 09/22/2010<br />
Index: 9 (Priority Score x Opportunity Score)<br />
Priority Score: 3 (3 - highest, 2 - medium, 1 - lowest)<br />
Opportunity Score: 3 (3 - relatively easy to address, 2 - accomplished<br />
within current policy and budget conditions, 1 -<br />
requires changes in current policy and budget<br />
conditions)<br />
Describe current level of<br />
development:<br />
Plan Assigned to: Valerie Thomas-Wooden<br />
How it will look when fully met:<br />
Target Date: 12/31/2012<br />
Tasks:<br />
Note: In the new site improvement plan learning and writing<br />
process, this indicator was inadvertently chosen and therefore<br />
we will not create a plan for this objective at this time, but will<br />
instead focus on the required indicators and identified areas of<br />
greatest need or interest.<br />
When the objective is fully met we will have tiered intervention<br />
in both reading and math with fidelity in every classroom.<br />
Teachers will differentiate in both reading and math instruction<br />
and students will be grouped in flexible groups for both<br />
reading and math. Teachers will manage all groups effectively<br />
and students will travel to the appropriate group during the<br />
math block just as they do for reading.<br />
1. 1. Thea school leadership team will investigate math intervention programs for possible<br />
purchase.<br />
Assigned to:<br />
Marcus Moore<br />
Target Completion Date: 12/31/2011<br />
Comments:<br />
Task Completed: 11/10/2010<br />
2. 2. Teachers will review and vote on intervention programs prior to purchase to decide on<br />
usability and effectiveness.<br />
Assigned to:<br />
Target Completion Date: 12/31/2011<br />
Valerie Thomas-Wooden<br />
Page: 10 of 41
Comments:<br />
Task Completed: 09/30/2010<br />
The tutoring teachers met in order to do this. Programs were<br />
presented and reviewed and the appropriate programs were<br />
chosen.<br />
3. Teachers will submit needs based on classroom assessments and student progress to the<br />
leadership team for consideration/purchase.<br />
Assigned to:<br />
Marcus Moore<br />
Target Completion Date: 05/31/2012<br />
Comments:<br />
Implement Percent Task Complete: Tasks completed: 2 of 3 (67%)<br />
Indicator<br />
EEIB-2.07 - School leadership and instructional teams examine student work for evidence<br />
that instruction is aligned to state standards. (246)<br />
Status Tasks completed: 0 of 2 (0%)<br />
Rubric Score Initial: 2<br />
Assessment Level of Development: Initial: Limited Development 11/02/2011<br />
Index: 6 (Priority Score x Opportunity Score)<br />
Priority Score: 3 (3 - highest, 2 - medium, 1 - lowest)<br />
Opportunity Score: 2 (3 - relatively easy to address, 2 - accomplished<br />
within current policy and budget conditions, 1 -<br />
requires changes in current policy and budget<br />
conditions)<br />
Describe current level of<br />
development:<br />
Plan Assigned to: Marcus Moore<br />
How it will look when fully met:<br />
Target Date: 05/31/2012<br />
Tasks:<br />
Currently the teachers are asked to turn in student work<br />
samples to the Staff Development Teacher. The SDT then<br />
reviews the student samples and conferences with teachers<br />
regarding her findings.<br />
The leadership team will meet with each grade level to<br />
examine student work and use that information to formulate<br />
lesson plans and guide instruction.<br />
1. The leadership team will determine a time to meet with each grade level team.<br />
Assigned to:<br />
Marcus Moore<br />
Target Completion Date: 05/31/2012<br />
Comments:<br />
2. An agenda will be created for each meeting in order to keep the team on task.<br />
Assigned to:<br />
Target Completion Date: 05/31/2012<br />
Comments:<br />
Valerie Thomas-Wooden<br />
Implement Percent Task Complete: Tasks completed: 0 of 2 (0%)<br />
Page: 11 of 41
Indicator<br />
EEIB-2.09 - All teachers and instructional teams analyze student work to target and<br />
revise instruction and curriculum, and to obtain information on student progress. (815)<br />
Status Tasks completed: 0 of 2 (0%)<br />
Rubric Score Initial: 2<br />
Assessment Level of Development: Initial: Limited Development 11/02/2011<br />
Index: 6 (Priority Score x Opportunity Score)<br />
Priority Score: 3 (3 - highest, 2 - medium, 1 - lowest)<br />
Opportunity Score: 2 (3 - relatively easy to address, 2 - accomplished<br />
within current policy and budget conditions, 1 -<br />
requires changes in current policy and budget<br />
conditions)<br />
Describe current level of<br />
development:<br />
Plan Assigned to: Valerie Thomas-Wooden<br />
How it will look when fully met:<br />
Target Date: 05/31/2012<br />
Tasks:<br />
Teachers currently discuss student work in an informal setting.<br />
All teachers and instructional teams will analyze student work<br />
to target and revise instruction and curriculum, and to obtain<br />
information on student progress.<br />
1. Teachers will turn in student work to the Staff Development Teacher who will then review the<br />
samples and meet with teachers during PLCs to discuss.<br />
Assigned to:<br />
Target Completion Date: 05/31/2012<br />
Comments:<br />
Valerie Thomas-Wooden<br />
2. Teachers will meet with the Staff Development Teacher weekly and discuss the data/feedback<br />
from the student work samples.<br />
Assigned to:<br />
Target Completion Date: 05/31/2012<br />
Comments:<br />
Valerie Thomas-Wooden<br />
Implement Percent Task Complete: Tasks completed: 0 of 2 (0%)<br />
Page: 12 of 41
Academic Learning and Performance<br />
Essential Element 3 - Instruction<br />
Indicator<br />
EEIC-3.01 - All teachers use varied instructional strategies that are scientifically researchbased.<br />
(248)<br />
Status Tasks completed: 0 of 2 (0%)<br />
Rubric Score Initial: 2<br />
Assessment Level of Development: Initial: Limited Development 11/02/2011<br />
Index: 6 (Priority Score x Opportunity Score)<br />
Priority Score: 3 (3 - highest, 2 - medium, 1 - lowest)<br />
Opportunity Score: 2 (3 - relatively easy to address, 2 - accomplished<br />
within current policy and budget conditions, 1 -<br />
requires changes in current policy and budget<br />
conditions)<br />
Describe current level of<br />
development:<br />
Plan Assigned to: Valerie Thomas-Wooden<br />
How it will look when fully met:<br />
Target Date: 05/31/2012<br />
Tasks:<br />
1. PLC will be conducted regarding differientiated instruction.<br />
Assigned to:<br />
Target Completion Date: 05/31/2012<br />
Comments:<br />
Teachers currently use strategies such as Thinking Maps,<br />
differientiated instruction and small group instruction in their<br />
classrooms.<br />
All teachers will use varied instructional strategies that are<br />
scientifically research-based in order to meet the learning<br />
needs of all the students in their classrooms.<br />
Valerie Thomas-Wooden<br />
2. Teachers will preform presentations to other teachers in an effort to share new<br />
ideas/strategies during faculty meetings.<br />
Assigned to:<br />
Marcus Moore<br />
Target Completion Date: 05/31/2012<br />
Comments:<br />
During September 2011 the Kindergarten team presented a<br />
powerpoint on what has been happening in their classrooms<br />
and we discussed how their work impacts the upper grade<br />
levels. We also discussed how their classroom management<br />
could be adapted and used for the upper grades.<br />
Implement Percent Task Complete: Tasks completed: 0 of 2 (0%)<br />
Page: 13 of 41
Indicator<br />
EEIC-3.02 - All teachers use instructional strategies and activities that are aligned with<br />
learning objectives. (249)<br />
Status Tasks completed: 1 of 4 (25%)<br />
Rubric Score Initial: 2<br />
Assessment Level of Development: Initial: Limited Development 12/13/2010<br />
Index: 6 (Priority Score x Opportunity Score)<br />
Priority Score: 3 (3 - highest, 2 - medium, 1 - lowest)<br />
Opportunity Score: 2 (3 - relatively easy to address, 2 - accomplished<br />
within current policy and budget conditions, 1 -<br />
requires changes in current policy and budget<br />
conditions)<br />
Describe current level of<br />
development:<br />
Plan Assigned to: Michael Stick<br />
How it will look when fully met:<br />
Target Date: 05/31/2012<br />
Tasks:<br />
While most teachers currently align their instructional<br />
strategies and activities to the learning objectives, Flippen's<br />
"Safety Net" will provide a means with which teachers are able<br />
to enhance the alignement of the learning objectives with their<br />
learning.<br />
At <strong>Anderson</strong> <strong>Elementary</strong> School teachers will develop weekly<br />
grade level lesson plans using research-based instructional<br />
strategies and activities that are aligned with Oklahoma PASS<br />
Objectivies in order to promote student success. In addition<br />
based on the Flippen "Safety Net" the teachers will utilize the<br />
Top Ten Standards in reading, writing, math, science and<br />
social studies<br />
1. Grade level team leaders will offer ongoing support for team teachers to impliment effective<br />
lesson plans that are aligned with Oklahoma PASS Objectives.<br />
Assigned to:<br />
Target Completion Date: 12/31/2011<br />
Comments:<br />
Valerie Thomas-Wooden<br />
2. All teachers will continue to submit weekly lesson plans to principal, vice principal and staff<br />
development teacher that will outline the Oklahoma PASS Objectives.<br />
Assigned to:<br />
Marcus Moore<br />
Target Completion Date: 05/31/2012<br />
Comments:<br />
Task Completed: 10/01/2010<br />
3. Staff Development Teacher will provide in service training for new teachers in order to develop<br />
an understanding of the Oklahoma PASS objectives.<br />
Assigned to:<br />
Target Completion Date: 12/31/2011<br />
Comments:<br />
Valerie Thomas-Wooden<br />
4. The teachers will be provided with the Flippen "Safety Net" Top Ten Standards to incorporate<br />
into their lessons.<br />
Assigned to:<br />
Target Completion Date: 12/31/2011<br />
Valerie Thomas-Wooden<br />
Page: 14 of 41
Comments:<br />
Implement Percent Task Complete: Tasks completed: 1 of 4 (25%)<br />
Indicator<br />
EEIC-3.03 - All teachers use instructional strategies and activities that are differentiated<br />
to meet specific student learning needs. (250)<br />
Status Tasks completed: 0 of 3 (0%)<br />
Rubric Score Initial: 2<br />
Assessment Level of Development: Initial: Limited Development 12/13/2010<br />
Index: 6 (Priority Score x Opportunity Score)<br />
Priority Score: 3 (3 - highest, 2 - medium, 1 - lowest)<br />
Opportunity Score: 2 (3 - relatively easy to address, 2 - accomplished<br />
within current policy and budget conditions, 1 -<br />
requires changes in current policy and budget<br />
conditions)<br />
Describe current level of<br />
development:<br />
Plan Assigned to: Ashley Cromwell<br />
How it will look when fully met:<br />
Target Date: 05/31/2012<br />
Tasks:<br />
Based upon leadership walk throughs, some teachers are<br />
lacking in the area of differentiated instruction. Teachers will<br />
attend Flippen's "Designing Engaging Lessons" and "Student<br />
Engagement".<br />
At <strong>Anderson</strong> <strong>Elementary</strong> School, teachers will formulate<br />
differentiated instructional strategies to meet the various<br />
learning style of each student, as evidenced in principal walkthroughs<br />
and evaluations, lesson plans, and student work and<br />
assessments.<br />
1. Teachers experiencing success in this area, as identified by the principal, will be provided with<br />
the opportunity to share out strategies and ideas in a portion of faculty meeting, as evidenced by<br />
meeting agendas.<br />
Assigned to:<br />
Marcus Moore<br />
Target Completion Date: 05/31/2012<br />
Comments:<br />
2. Teachers who wish to observe other teachers as they model differentiation strategies will be<br />
allowed to do so on their plan time. Model teachers will be identified by the prinicipal and/or will<br />
have the opportunity to volunteer. A schedule will be distributed at faculty meeting.<br />
Assigned to:<br />
Traci Hunter<br />
Target Completion Date: 05/31/2012<br />
Comments:<br />
3. Teachers will incorporate strategies learned during Flippen Group trainings "Designing<br />
Engaging Lessons" and "Engaging Students" into their daily lessons.<br />
Assigned to:<br />
Marcus Moore<br />
Target Completion Date: 12/31/2011<br />
Page: 15 of 41
Comments:<br />
Lesson plans are turned in on a weekly basis to the leadership<br />
team.<br />
Implement Percent Task Complete: Tasks completed: 0 of 3 (0%)<br />
Indicator<br />
EEIC-3.04 - All teachers demonstrate the content knowledge necessary to challenge and<br />
motivate students to high levels of learning. (251)<br />
Status In Plan / No Tasks Created<br />
Rubric Score Initial: 2<br />
Assessment Level of Development: Initial: Limited Development 11/02/2011<br />
Index: 6 (Priority Score x Opportunity Score)<br />
Priority Score: 3 (3 - highest, 2 - medium, 1 - lowest)<br />
Opportunity Score: 2 (3 - relatively easy to address, 2 - accomplished<br />
within current policy and budget conditions, 1 -<br />
requires changes in current policy and budget<br />
conditions)<br />
Describe current level of<br />
development:<br />
Plan Assigned to: Not yet assigned<br />
Teachers currently attend professional development(Thinking<br />
Maps, Flippen, etc.) to ensure that they are current on<br />
research based pratices.<br />
Indicator<br />
Status<br />
EEIC-3.05 - All teachers incorporate the use of technology in their classrooms when it<br />
enhances instruction. (252)<br />
Full Implementation<br />
Rubric Score Initial: 3<br />
Assessment Level of Development: Initial: Full Implementation 11/02/2011<br />
Evidence:<br />
Teachers currently use Smart/Promethean Boards in their<br />
classrooms on a daily basis. Teachers also provide time for<br />
students to have access to computers in an effort to enhance<br />
and engage student learning.<br />
Page: 16 of 41
Indicator<br />
EEIC-3.06 - School leadership provides sufficient instructional resources that are used by<br />
teachers and students for standards-aligned learning activities. (253)<br />
Status Tasks completed: 0 of 3 (0%)<br />
Rubric Score Initial: 2<br />
Assessment Level of Development: Initial: Limited Development 11/02/2011<br />
Index: 6 (Priority Score x Opportunity Score)<br />
Priority Score: 3 (3 - highest, 2 - medium, 1 - lowest)<br />
Opportunity Score: 2 (3 - relatively easy to address, 2 - accomplished<br />
within current policy and budget conditions, 1 -<br />
requires changes in current policy and budget<br />
conditions)<br />
Describe current level of<br />
development:<br />
Plan Assigned to: Valerie Thomas-Wooden<br />
How it will look when fully met:<br />
Target Date: 05/31/2012<br />
Tasks:<br />
Teachers currently have access to resources and materials as<br />
well as a Staff Development Teacher, a Reading Resource<br />
Teacher and an English Language Learner Teacher.<br />
Teachers will have the necessary resources to ensure mastery<br />
of the objectives.<br />
1. Teachers will have a staff development teacher, a reading resource teacher and an ELL<br />
teacher to assist with planning and implementation in the classroom.<br />
Assigned to:<br />
Marcus Moore<br />
Target Completion Date: 05/31/2012<br />
Comments:<br />
2. The leadership team will research curriculum for whole group instruction as well as<br />
differientiated instruction according to teacher needs based on data.<br />
Assigned to:<br />
Target Completion Date: 05/31/2012<br />
Comments:<br />
Valerie Thomas-Wooden<br />
3. In an attempt to assist with the inclusion process we will invite the district ELL specialists to<br />
lead a PLC on interupting the WIDA scores and presenting the teachers with a can do list of<br />
strategies to support the ELL students while in the regular classroom.<br />
Assigned to:<br />
Target Completion Date: 12/31/2011<br />
Comments:<br />
Valerie Thomas-Wooden<br />
Implement Percent Task Complete: Tasks completed: 0 of 3 (0%)<br />
Page: 17 of 41
Professional Learning Environment-Effective Teachers<br />
Essential Element 4 - School Culture<br />
Indicator<br />
EEIIA-4.04 - All teachers and nonteaching staff are involved in decision-making processes<br />
related to teaching and learning. (259)<br />
Status Tasks completed: 2 of 3 (67%)<br />
Rubric Score Initial: 2<br />
Assessment Level of Development: Initial: Limited Development 12/13/2010<br />
Index: 4 (Priority Score x Opportunity Score)<br />
Priority Score: 2 (3 - highest, 2 - medium, 1 - lowest)<br />
Opportunity Score: 2 (3 - relatively easy to address, 2 - accomplished<br />
within current policy and budget conditions, 1 -<br />
requires changes in current policy and budget<br />
conditions)<br />
Describe current level of<br />
development:<br />
Plan Assigned to: Marcus Moore<br />
How it will look when fully met:<br />
Target Date: 05/31/2012<br />
Tasks:<br />
Teachers currently include teacher aides, paraprofessionals<br />
and other staff members in the lesson planning process.<br />
At <strong>Anderson</strong> <strong>Elementary</strong> School, teachers and nonteaching<br />
staff members will meet and collaborate weekly to discuss<br />
areas related to teaching and learning.<br />
1.<br />
Teachers and nonteaching staff members will continue to participate in Child Study Team<br />
Meetings to provide effective teaching strategies.<br />
Assigned to:<br />
Kathleen Jeffries<br />
Target Completion Date: 05/31/2012<br />
Comments:<br />
Task Completed: 01/31/2011<br />
Our Child Study Team has become a strong and effective part<br />
of our instructional organization. The team meets weekly<br />
every Thursday. Teachers make recommendations to the<br />
counselor and notifies the counselor that they have a case to<br />
present to the team and the counselor coordinates and<br />
schedules the teachers and their alloted times at the meeting.<br />
The team has functioned well and has proven to be effective in<br />
strategies and information presented to the teachers and in<br />
procuring the proper info necessary for testing children, etc.<br />
2. Staff will collaborate in open forum staff meetings regarding scheduling of progress monitoring<br />
(DIBELS) and will share strategies and ideas as to how to use the information gained in this<br />
monitoring.<br />
Assigned to:<br />
Traci Hunter<br />
Target Completion Date: 05/31/2012<br />
Comments:<br />
Task Completed: 01/31/2011<br />
The Reading Interventionist, Evelyn Rayes, oversees the<br />
progress monitoring for Title I and has provided this<br />
information.<br />
Page: 18 of 41
3. The Child Study Team will assist teacher in completing the necessary forms and paperwork for<br />
recommending students to the CST.<br />
Assigned to:<br />
Kathleen Jeffries<br />
Target Completion Date: 12/31/2012<br />
Comments:<br />
Implement Percent Task Complete: Tasks completed: 2 of 3 (67%)<br />
Indicator<br />
EEIIA-4.07 - All teachers communicate regularly with families about individual student<br />
progress. (262)<br />
Status Tasks completed: 0 of 6 (0%)<br />
Rubric Score Initial: 2<br />
Assessment Level of Development: Initial: Limited Development 12/15/2010<br />
Index: 6 (Priority Score x Opportunity Score)<br />
Priority Score: 3 (3 - highest, 2 - medium, 1 - lowest)<br />
Opportunity Score: 2 (3 - relatively easy to address, 2 - accomplished<br />
within current policy and budget conditions, 1 -<br />
requires changes in current policy and budget<br />
conditions)<br />
Describe current level of<br />
development:<br />
Plan Assigned to: Kathleen Jeffries<br />
How it will look when fully met:<br />
Target Date: 04/30/2012<br />
Tasks:<br />
It has been the experience of staff that communication<br />
between teachers and parents are limited due to a lack of<br />
updated information.<br />
At <strong>Anderson</strong> <strong>Elementary</strong> School, all teachers will have access<br />
to updated parent information in order to communicate each<br />
student's progress. At <strong>Anderson</strong>, teachers contact parents<br />
regularly and frequently to discuss student progress through a<br />
variety of means.<br />
<strong>Anderson</strong> teachers are learning to actively involve students in<br />
student-led conferences, journals, portfolios, etc. in reporting<br />
student progress to families. <strong>Anderson</strong> keeps a maintained list<br />
of students identified for risk of failure and students are<br />
provided additional assistance.<br />
1. Teachers will allow students to call parents and give both negative and positive report<br />
regarding their academic behaviors, as evidenced by the phone calling log kept in the classroom.<br />
Assigned to:<br />
Marcus Moore<br />
Target Completion Date: 01/31/2012<br />
Comments:<br />
2. Registrar/Secretary will be assigned the duty of updating parent contact information on a<br />
monthly basis, due to the high mobility at <strong>Anderson</strong> <strong>Elementary</strong> School.<br />
Assigned to:<br />
Target Completion Date: 01/31/2012<br />
Comments:<br />
Valerie Thomas-Wooden<br />
3. A uniform phone log will be developed, distributed, and reviewed by the principal at teacher<br />
evaluation in order to increase effective parental contact.<br />
Page: 19 of 41
Assigned to:<br />
Target Completion Date: 03/30/2012<br />
Comments:<br />
Valerie Thomas-Wooden<br />
The staff development teacher provided the teachers with a<br />
template to use for the call log.<br />
4. The <strong>Anderson</strong> website will be updated and each teacher will update their webpage at least<br />
twice a year.<br />
Assigned to:<br />
Target Completion Date: 03/30/2012<br />
Comments:<br />
Valerie Thomas-Wooden<br />
5. At the first conference time of the year, information will be given to each parent regarding<br />
access to the parent portal on PowerSchool.<br />
Assigned to:<br />
Kathleen Jeffries<br />
Target Completion Date: 12/09/2011<br />
Comments:<br />
6. The webmasters will present professional development in SharpSchool and in developing<br />
individual teacher web pages at a faculty meeting, as evidenced by meeting agendas.<br />
Assigned to:<br />
Dee Dee Crooms<br />
Target Completion Date: 03/30/2012<br />
Comments:<br />
Implement Percent Task Complete: Tasks completed: 0 of 6 (0%)<br />
Page: 20 of 41
Professional Learning Environment-Effective Teachers<br />
Essential Element 5 - Student, Family, and Community Support<br />
Indicator<br />
EEIIB-5.02 - All students have access to academic and behavioral supports including<br />
tutoring, co- and extra-curricular activities, and extended learning opportunities (e.g.,<br />
summer bridge programs, Saturday school, counseling services, Positive Behavior<br />
Intervention Supports [PBIS] and competitive and noncompetitive teams). (268)<br />
Status Tasks completed: 3 of 4 (75%)<br />
Rubric Score Initial: 2<br />
Assessment Level of Development: Initial: Limited Development 12/14/2010<br />
Index: 6 (Priority Score x Opportunity Score)<br />
Priority Score: 3 (3 - highest, 2 - medium, 1 - lowest)<br />
Opportunity Score: 2 (3 - relatively easy to address, 2 - accomplished<br />
within current policy and budget conditions, 1 -<br />
requires changes in current policy and budget<br />
conditions)<br />
Describe current level of<br />
development:<br />
Plan Assigned to: Kemba Wright<br />
How it will look when fully met:<br />
As a result of the implementation of tutoring, co and extracurricular<br />
activities, competetive sports, PBIS and other going<br />
counciling services, some students have made progress in the<br />
areas of academics and behavior.<br />
<strong>Anderson</strong> <strong>Elementary</strong> School, staff will recruit parents for<br />
participation in ongoing activities including both academic and<br />
behavior for positive reinforcement. <strong>Anderson</strong> will continue to<br />
offer tutoring, Girl/Boy scouts, basketball teams, Students<br />
Council, PBIS, and onsite counseling services provided by the<br />
school counselor and DaySpring.<br />
Target Date: 05/30/2011<br />
Tasks:<br />
1. Afterschool tutoring will continue for the purpose of strengthing math and reading skills for<br />
OCCT test as well as acheiving mastery overall.<br />
Assigned to:<br />
Target Completion Date: 01/31/2011<br />
Comments:<br />
Task Completed: 01/31/2011<br />
Valerie Thomas-Wooden<br />
2. Counselor will continue to seek outside resourses such as our partners in education in an effort<br />
to receive more volunteers, mentors, and funding/donations which would promote family<br />
involvement and enhance parent participation.<br />
Assigned to:<br />
Kathleen Jeffries<br />
Target Completion Date: 01/31/2011<br />
Comments:<br />
Task Completed: 01/31/2011<br />
As a result of this work, parent participation has skyrocketed<br />
this year. We have documented over 50 active mentors and<br />
office volunteers this year.<br />
Page: 21 of 41
3. Parent Facilitator will continue to serve as a liasion for faculty and parents in order to create a<br />
culture of volunteerism among the parents.<br />
Assigned to:<br />
Kemba Wright<br />
Target Completion Date: 04/30/2011<br />
Comments:<br />
Task Completed: 04/30/2011<br />
Between the work of the counselor and the parent facilitator,<br />
volunteers have greatly increased from 3 the previous year to<br />
over 50 for the 2010-2011 school year.<br />
4. Resources will be researched and provided to the teachers involved in the afterschool tutoring<br />
program.<br />
Assigned to:<br />
Target Completion Date: 05/31/2012<br />
Comments:<br />
Valerie Thomas-Wooden<br />
Implement Percent Task Complete: Tasks completed: 3 of 4 (75%)<br />
Indicator<br />
EEIIB-5.03 - School leadership and all teachers implement strategies such as family<br />
literacy to increase effective parental involvement. (269)<br />
Status Tasks completed: 1 of 5 (20%)<br />
Rubric Score Initial: 2<br />
Assessment Level of Development: Initial: Limited Development 12/14/2010<br />
Index: 6 (Priority Score x Opportunity Score)<br />
Priority Score: 3 (3 - highest, 2 - medium, 1 - lowest)<br />
Opportunity Score: 2 (3 - relatively easy to address, 2 - accomplished<br />
within current policy and budget conditions, 1 -<br />
requires changes in current policy and budget<br />
conditions)<br />
Describe current level of<br />
development:<br />
Plan Assigned to: Kemba Wright<br />
How it will look when fully met:<br />
Target Date: 03/30/2012<br />
Tasks:<br />
Based on past and current PTA Meetings, Parent-Teacher<br />
Conferences, and other school sponsored events, parental<br />
involvement is lacking in both primary and itermediate grades.<br />
At <strong>Anderson</strong> <strong>Elementary</strong> School teachers will ensure that<br />
parents receive information about how to become involved in<br />
their child's education and/or in the volunteer process at<br />
<strong>Anderson</strong> through increased communications. <strong>Anderson</strong> will<br />
have an active PTA organization and in order to get<br />
participation from parents across the grade levels, parents will<br />
be invited to activities such as literacy nights, school musical<br />
programs, and learning demonstrations.<br />
1. Teachers will increase level of communication with parents through monthly classroom<br />
newsletter.<br />
Assigned to:<br />
Michael Stick<br />
Target Completion Date: 03/30/2012<br />
Comments:<br />
Page: 22 of 41
2. Counselor will design and implement program that would provide necessary training for parent<br />
education as a result of parent survey needs.<br />
Assigned to:<br />
Kathleen Jeffries<br />
Target Completion Date: 12/01/2011<br />
Comments:<br />
3. Continue parent involvement through school connect, weekly folders, and other resources.<br />
Assigned to:<br />
Kemba Wright<br />
Target Completion Date: 04/30/2011<br />
Comments:<br />
Task Completed: 04/30/2011<br />
Our parent facilitator has assisted in the process of "Thursday<br />
folders." Each Thursday, newsletters, notes for parents,<br />
classroom newsletters, schoolwork, papers to sign, etc., are<br />
sent home with each student.<br />
4. A survey will be developed and sent home to parents at Back to School night which will guage<br />
interest in areas where parents are interested in parent education and in strategies to help their<br />
child in homework, school discipline, and study skills.<br />
Assigned to:<br />
Kathleen Jeffries<br />
Target Completion Date: 12/01/2011<br />
Comments:<br />
5. The parent facilitator will contact concerned and active parents to institute a charter PTA board<br />
and will ilicit ideas regarding the utilization of PTA meetings and ideas for parent involvement.<br />
Assigned to:<br />
Kemba Wright<br />
Target Completion Date: 12/01/2011<br />
Comments:<br />
Implement Percent Task Complete: Tasks completed: 1 of 5 (20%)<br />
Page: 23 of 41
Indicator<br />
EEIIB-5.06 - School leadership and staff actively pursue relationships to support students<br />
and families as they transition from grade to grade, building to building, and beyond high<br />
school. (817)<br />
Status Tasks completed: 0 of 5 (0%)<br />
Rubric Score Initial: 2<br />
Assessment Level of Development: Initial: Limited Development 12/15/2010<br />
Index: 6 (Priority Score x Opportunity Score)<br />
Priority Score: 3 (3 - highest, 2 - medium, 1 - lowest)<br />
Opportunity Score: 2 (3 - relatively easy to address, 2 - accomplished<br />
within current policy and budget conditions, 1 -<br />
requires changes in current policy and budget<br />
conditions)<br />
Describe current level of<br />
development:<br />
Plan Assigned to: Kathleen Jeffries<br />
How it will look when fully met:<br />
The communication gap from grade to grade, building to<br />
building, and beyond lacks cohesion based on the OCCT and<br />
DIBELS data.<br />
At <strong>Anderson</strong> <strong>Elementary</strong> School, staff will keep open<br />
comunication with families to create a smoother transition<br />
from grade to grade and from building to building. Activities<br />
such as Back to School night and Middle School presentations<br />
to 6th grade will continue.<br />
Target Date: 06/01/2012<br />
Tasks:<br />
1. Conduct placement of all students during faculty/grade-level team meetings with school<br />
leadership facilitating.<br />
Assigned to:<br />
Marcus Moore<br />
Target Completion Date: 05/31/2012<br />
Comments:<br />
2.<br />
Sixth grade teachers and counselors will meet and collaborate with Middle School Staff to ensure<br />
smoother transition.<br />
Assigned to:<br />
Lois Diggs<br />
Target Completion Date: 05/31/2012<br />
Comments:<br />
3. Information on <strong>Tulsa</strong> <strong>Public</strong> School's Parents as Teachers program will be distributed through<br />
the website, flyers from the Pre-K class during screening at the beginning of the year, and on<br />
SchoolConnects so that parents may be better informed about this service for presechoolers.<br />
Assigned to:<br />
Nina Eccles<br />
Target Completion Date: 05/30/2012<br />
Comments:<br />
Parents as Teachers (PAT) is a voluntary early childhood<br />
parent education and family support program for parents who<br />
have children from birth-three years of age designed to help<br />
all parents give their children the best possilbe start in life.<br />
4. During spring parent teacher conferences teachers will share expectations for the next grade<br />
level and provide the parents with activities that can be utilized during the summer months to<br />
help prepare the students for the following year.<br />
Page: 24 of 41
Assigned to:<br />
Nina Eccles<br />
Target Completion Date: 05/31/2012<br />
Comments:<br />
5. We will invite a representive from Rogers College Junior High to present information to the<br />
sixth grade students informing them of the opportunities offered at Rogers.<br />
Assigned to:<br />
Target Completion Date: 05/31/2012<br />
Comments:<br />
Valerie Thomas-Wooden<br />
Implement Percent Task Complete: Tasks completed: 0 of 5 (0%)<br />
Indicator<br />
EEIIB-5.07 - School leadership ensures that appropriate stakeholders (e.g., school staff,<br />
students, parents, family members, guardians, community organizations and members,<br />
business partners, postsecondary education institutions, and workforce) are involved in<br />
critical planning and decision-making activities. (818)<br />
Status Tasks completed: 0 of 4 (0%)<br />
Rubric Score Initial: 2<br />
Assessment Level of Development: Initial: Limited Development 12/15/2010<br />
Index: 6 (Priority Score x Opportunity Score)<br />
Priority Score: 3 (3 - highest, 2 - medium, 1 - lowest)<br />
Opportunity Score: 2 (3 - relatively easy to address, 2 - accomplished<br />
within current policy and budget conditions, 1 -<br />
requires changes in current policy and budget<br />
conditions)<br />
Describe current level of<br />
development:<br />
Plan Assigned to: Marcus Moore<br />
How it will look when fully met:<br />
Target Date: 05/31/2012<br />
Tasks:<br />
School leadership continues to involve some stakeholders in<br />
the critical planning and decision-making process.<br />
Research shows that community involvement can have a<br />
positive impact on the learning environment. At <strong>Anderson</strong><br />
<strong>Elementary</strong> School school leadership will design a plan that<br />
will involve all stakeholders in the critical planning and<br />
decision-making process regarding the education, physical and<br />
emotional needs of the students as well as the extra curricular<br />
opportunities available.<br />
1. School leadership will hold monthly community meetings in conjunction with regularly<br />
scheduled PTSA Meetings to inform stakeholders of planning and progress.<br />
Assigned to:<br />
Kemba Wright<br />
Target Completion Date: 02/20/2012<br />
Comments:<br />
2. School leadership will invite partners in education to attend planning sessions involving<br />
decision making activities biannually.<br />
Assigned to:<br />
Marcus Moore<br />
Target Completion Date: 12/31/2011<br />
Comments:<br />
Page: 25 of 41
3. The parent facilitator will contact parents to institute a charter PTA board and will ilicit ideas<br />
regarding the utilization of PTA meetings and ideas for parent involvement.<br />
Assigned to:<br />
Kemba Wright<br />
Target Completion Date: 10/01/2011<br />
Comments:<br />
4. We will create a list of students and teacher based needs and present that list to our Partners<br />
in Education.<br />
Assigned to:<br />
Target Completion Date: 05/31/2012<br />
Comments:<br />
Valerie Thomas-Wooden<br />
Implement Percent Task Complete: Tasks completed: 0 of 4 (0%)<br />
Indicator<br />
EEIIB-5.08 - School leadership and all staff incorporate multiple communication<br />
strategies that are culturally and linguistically appropriate and support two-way<br />
communications with families and other stakeholders. (819)<br />
Status Tasks completed: 0 of 3 (0%)<br />
Rubric Score Initial: 2<br />
Assessment Level of Development: Initial: Limited Development 12/15/2010<br />
Index: 6 (Priority Score x Opportunity Score)<br />
Priority Score: 3 (3 - highest, 2 - medium, 1 - lowest)<br />
Opportunity Score: 2 (3 - relatively easy to address, 2 - accomplished<br />
within current policy and budget conditions, 1 -<br />
requires changes in current policy and budget<br />
conditions)<br />
Describe current level of<br />
development:<br />
Plan Assigned to: Kemba Wright<br />
How it will look when fully met:<br />
Target Date: 05/30/2012<br />
Tasks:<br />
Based on parent input, communication is limited and<br />
infrequent in some areas.<br />
<strong>Anderson</strong> <strong>Elementary</strong> School will enhance communication with<br />
families and other stakeholders by contnuing the use of school<br />
connects, compiling an email list and distributing more written<br />
communication. Our updated website is helpful to parents.<br />
Currently, our Hispanic population is small. <strong>Anderson</strong> will<br />
continue to call on the ELL teacher for help in communicating<br />
with parents as necessary.<br />
1.<br />
Parent Facilitator will compile a list with updated information including all stakeholders to support<br />
two way communication.<br />
These communications will be available in english as well as spanish and any other language<br />
deemed necessary by current student enrollment information.<br />
Assigned to:<br />
Kemba Wright<br />
Target Completion Date: 01/30/2012<br />
Comments:<br />
2. Information regarding conferences, programs, literacy nights, etc. will be disseminated<br />
through SchoolConnects in English as well as Spanish when available.<br />
Assigned to:<br />
D'Andria Crooms<br />
Page: 26 of 41
Target Completion Date: 05/30/2012<br />
Comments:<br />
3. The <strong>Anderson</strong> website will be updated and each teacher will update their webpage at least<br />
once a month.<br />
Assigned to:<br />
Target Completion Date: 02/20/2012<br />
Comments:<br />
Valerie Thomas-Wooden<br />
Implement Percent Task Complete: Tasks completed: 0 of 3 (0%)<br />
Professional Learning Environment-Effective Teachers<br />
Essential Element 6 - Professional Growth, Development, Evaluation<br />
Indicator<br />
EEIIC-6.06 - School planning team designs professional development that has a direct<br />
connection to the analysis of student achievement data. (277)<br />
Status Tasks completed: 1 of 4 (25%)<br />
Rubric Score Initial: 1<br />
Assessment Level of Development: Initial: No development or Implementation 09/28/2010<br />
Index: 2 (Priority Score x Opportunity Score)<br />
Priority Score: 2 (3 - highest, 2 - medium, 1 - lowest)<br />
Opportunity Score: 1 (3 - relatively easy to address, 2 - accomplished<br />
within current policy and budget conditions, 1 -<br />
requires changes in current policy and budget<br />
conditions)<br />
Describe current level of<br />
development:<br />
Plan Assigned to: Valerie Thomas-Wooden<br />
How it will look when fully met:<br />
Target Date: 05/31/2012<br />
Tasks:<br />
At <strong>Anderson</strong> <strong>Elementary</strong>, professional development needs<br />
have not been determined based on the student achievement<br />
indicators. Student scores have not been utilized to determine<br />
specific professional development needs. Professional<br />
development needs have been previously based on schoolwide<br />
needs rather than specific curricular gaps. To date there<br />
is no data relating to the impact of professional development<br />
on student achievement.<br />
At <strong>Anderson</strong> <strong>Elementary</strong>, all teachers, along with the principal,<br />
will analyze student test score data and student class work<br />
and participate in professional development opportunities such<br />
as Flippen "Engaging Students", "Data Walks" "Designing<br />
Engaging Lessons", Thinking Maps on-site as needed.<br />
<strong>Anderson</strong> will also use Value Added to analyze student/school<br />
achievement.<br />
1. Beginning in April 2011, teachers at <strong>Anderson</strong> <strong>Elementary</strong> will spend time during faculty<br />
meetings looking for curricular gaps between the grade levels.<br />
Assigned to:<br />
Marcus Moore<br />
Target Completion Date: 05/31/2011<br />
Comments:<br />
This was accomplished through a series of faculty meetings as<br />
evidenced in meeting agendas.<br />
Page: 27 of 41
Task Completed: 05/31/2011<br />
2. In August of 2011, during our opening inservice dates, <strong>Anderson</strong> <strong>Elementary</strong> teachers will<br />
analyze OCCT data from the 2009 - 2010 and the 2010 - 2011 school years to determine trends<br />
in curricular gaps.<br />
Assigned to:<br />
Target Completion Date: 11/30/2011<br />
Comments:<br />
Valerie Thomas-Wooden<br />
3. Teachers will be given guidance and professional development at a series of faculty meetings<br />
as to how best to use the pre- and post- Scott Foresman and enVision tests, benchmark unit<br />
tests, and DIBELS test data to determine instructional gaps.<br />
Assigned to:<br />
Kathleen Jeffries<br />
Target Completion Date: 12/31/2011<br />
Comments:<br />
4. The identified gaps will determine professional development for the 2011 - 2012 school year.<br />
These recommendations will be taken to leadership to procure the appropriate professional<br />
development.<br />
Assigned to:<br />
Nina Eccles<br />
Target Completion Date: 12/20/2012<br />
Comments:<br />
Implement Percent Task Complete: Tasks completed: 1 of 4 (25%)<br />
Page: 28 of 41
Indicator<br />
EEIIC-6.11 - School leadership provides opportunities for teachers to actively participate<br />
in collaboration and to engage in peer observations to improve classroom practice across<br />
disciplines and programs. (282)<br />
Status Tasks completed: 0 of 3 (0%)<br />
Rubric Score Initial: 2<br />
Assessment Level of Development: Initial: Limited Development 12/13/2010<br />
Index: 2 (Priority Score x Opportunity Score)<br />
Priority Score: 2 (3 - highest, 2 - medium, 1 - lowest)<br />
Opportunity Score: 1 (3 - relatively easy to address, 2 - accomplished<br />
within current policy and budget conditions, 1 -<br />
requires changes in current policy and budget<br />
conditions)<br />
Describe current level of<br />
development:<br />
Plan Assigned to: Marcus Moore<br />
How it will look when fully met:<br />
Target Date: 03/30/2012<br />
Tasks:<br />
At <strong>Anderson</strong> <strong>Elementary</strong>, our faculty meetings are held in<br />
teacher's classrooms in an effort to provide opportunities for<br />
peer observations and sharing and teachers are encouraged to<br />
observe in other teacher's classrooms during the school day.<br />
Teachers share a common plan time to collaborate on grade<br />
level strategies while vertical articulation is addressed in staff<br />
meetings. Opportunities for collaboration beyond a teacher's<br />
discipline or grade level is limited due to time constraints and<br />
lack of available staff for coverage.<br />
At <strong>Anderson</strong> <strong>Elementary</strong>, teachers will have opportunities to<br />
actively collaborate through observations in their peers'<br />
classrooms during different disciplines throughout the school<br />
day in order to improve classroom instruction and<br />
management.<br />
1. A rotating quarterly schedule will be established in order for teachers to observe in other grade<br />
levels, thereby increasing knowledge of vertical articulation and improving classroom instruction.<br />
Prior to developing the schedule, teachers will discuss the plan in a faculty meeting in an effort to<br />
increase ownership of the process.<br />
Assigned to:<br />
Marcus Moore<br />
Target Completion Date: 12/31/2012<br />
Comments:<br />
2. <strong>Anderson</strong> teachers will be able to spend time throughout the day observing in the classrooms<br />
of fellow grade level teachers as well as teachers in other disciplines.<br />
Assigned to:<br />
Marcus Moore<br />
Target Completion Date: 03/30/2012<br />
Comments:<br />
3. The principal will look into alternate funding from the district for sub coverage of classrooms<br />
and/or the parent facilitator will investigate the possibility of parent volunteers covering the<br />
classrooms so teachers can observe other classroom instruction in their grade level teams.<br />
Assigned to:<br />
Kemba Wright<br />
Target Completion Date: 03/30/2012<br />
Page: 29 of 41
Comments:<br />
Implement Percent Task Complete: Tasks completed: 0 of 3 (0%)<br />
Indicator<br />
EEIIC-6.13 - School leadership uses the evaluation process to provide teachers with<br />
follow-up and support to change behavior and instructional practices. (820)<br />
Status Tasks completed: 1 of 3 (33%)<br />
Rubric Score Initial: 2<br />
Assessment Level of Development: Initial: Limited Development 12/13/2010<br />
Index: 3 (Priority Score x Opportunity Score)<br />
Priority Score: 3 (3 - highest, 2 - medium, 1 - lowest)<br />
Opportunity Score: 1 (3 - relatively easy to address, 2 - accomplished<br />
within current policy and budget conditions, 1 -<br />
requires changes in current policy and budget<br />
conditions)<br />
Describe current level of<br />
development:<br />
Plan Assigned to: Marcus Moore<br />
How it will look when fully met:<br />
Target Date: 12/31/2012<br />
Tasks:<br />
As a result of leadership and teacher survey,at <strong>Anderson</strong><br />
professional development is being directly linked to those<br />
teachers on a Personal Development Plan as per the new<br />
Teacher Effectiveness Initiative. With district cuts in the<br />
professional development department, former access to<br />
facilitators and specialists is more limited at this time.<br />
Principal currently provides teachers with feedback after<br />
observations and walk-throughs.<br />
At <strong>Anderson</strong>, the principal will continue to provide teachers<br />
with feedback after observations and walk-throughs as an<br />
integral part of the evaluation process to challenge teacher<br />
thinking and to change behavior, and will continue to use the<br />
leadership and teacher survey, to directly link professional<br />
development to those teachers on a Personal Development<br />
Plan as per the new Teacher Effectiveness Intiative. The<br />
<strong>Anderson</strong> school leadership will work with teachers to<br />
integrate their individual professional development goals in the<br />
evaluation process. <strong>Anderson</strong> leadership will provide teachers<br />
with adequate follow-up and support to ensure that the<br />
evaluation process results in improved instructional practice<br />
and higher student achievement.<br />
1. At <strong>Anderson</strong> the principal provides an immmediate evaluation from any walk throughs or<br />
observations and meets with the teacher within three days to review lessons and reflect on<br />
outcomes and ways to integrate or enhance the next lesson.<br />
Assigned to:<br />
Marcus Moore<br />
Target Completion Date: 03/01/2011<br />
Page: 30 of 41
Comments:<br />
Task Completed: 03/01/2011<br />
Leadership is in every classroom in the building at least once a<br />
week and as the work with the Flippen group progressed, each<br />
classroom received at least two walkthroughs weekly.<br />
Feedback sessions and reflection and written observation<br />
notes were given after each observation.<br />
2. The district placed a staff development teacher in the building for professional development.<br />
She will provide learning opportunities for teachers through PLCs as well as one on one<br />
interaction on varied strategies and classroom practices.<br />
Assigned to:<br />
Target Completion Date: 01/20/2012<br />
Comments:<br />
Valerie Thomas-Wooden<br />
3. Data will be collected using the Flippin "Data Walk" process to collect information. That data<br />
will then be shared with the teachers.<br />
Assigned to:<br />
Marcus Moore<br />
Target Completion Date: 11/30/2011<br />
Comments:<br />
Implement Percent Task Complete: Tasks completed: 1 of 3 (33%)<br />
Collaborative Leadership-Effective Leaders<br />
Essential Element 7 - Leadership<br />
Indicator<br />
EEIIIA-7.06 - School leadership ensures that instructional time is protected and allocated<br />
to focus on curricular and instructional issues, including adding time to the school day as<br />
necessary. (289)<br />
Status Tasks completed: 0 of 3 (0%)<br />
Rubric Score Initial: 2<br />
Assessment Level of Development: Initial: Limited Development 11/02/2011<br />
Index: 6 (Priority Score x Opportunity Score)<br />
Priority Score: 3 (3 - highest, 2 - medium, 1 - lowest)<br />
Opportunity Score: 2 (3 - relatively easy to address, 2 - accomplished<br />
within current policy and budget conditions, 1 -<br />
requires changes in current policy and budget<br />
conditions)<br />
Describe current level of<br />
development:<br />
Plan Assigned to: Marcus Moore<br />
How it will look when fully met:<br />
Target Date: 05/31/2012<br />
Tasks:<br />
Instructional time is scheduled and protected from interuptions<br />
such as intercom announcements, classroom visitors, phone<br />
calls, school programs, etc.<br />
There will be no interuptions in the classrooms throughout the<br />
day.<br />
1. The office will keep intercom communication to a minimum and only use the intercom system<br />
in emergency situations.<br />
Assigned to:<br />
Wakel Ousley<br />
Target Completion Date: 05/31/2012<br />
Page: 31 of 41
Comments:<br />
2. A policy was in place however it was not being enforced regarding visitors in the classroom.<br />
Assigned to:<br />
Kemba Wright<br />
Target Completion Date: 05/31/2012<br />
Comments:<br />
This year the policy has been enforced. Parents are being<br />
asked to retun to office to sign in and receive visitor passes<br />
before entering classrooms.<br />
3. Programs will be scheduled two weeks in advance and will take place within the last hour of<br />
the school day in an effort to protect the reading and math block.<br />
Assigned to:<br />
Marcus Moore<br />
Target Completion Date: 05/31/2012<br />
Comments:<br />
Implement Percent Task Complete: Tasks completed: 0 of 3 (0%)<br />
Indicator<br />
EEIIIA-7.07 - School leadership provides effective organizational structures in order to<br />
allocate resources, monitor progress, and remove barriers to sustain continuous school<br />
improvement. (290)<br />
Status Tasks completed: 0 of 4 (0%)<br />
Rubric Score Initial: 1<br />
Assessment Level of Development: Initial: No development or Implementation 11/02/2011<br />
Index: 6 (Priority Score x Opportunity Score)<br />
Priority Score: 3 (3 - highest, 2 - medium, 1 - lowest)<br />
Opportunity Score: 2 (3 - relatively easy to address, 2 - accomplished<br />
within current policy and budget conditions, 1 -<br />
requires changes in current policy and budget<br />
conditions)<br />
Describe current level of<br />
development:<br />
Plan Assigned to: Marcus Moore<br />
How it will look when fully met:<br />
Target Date: 05/31/2012<br />
Tasks:<br />
There is currently no or very minimal activity on this indicator.<br />
Teachers will be provided with all resources and structures<br />
needed to be successful and ensure student schievement.<br />
1. The principal will create a budget and include monies for necessary resources.<br />
Assigned to:<br />
Marcus Moore<br />
Target Completion Date: 12/31/2011<br />
Comments:<br />
2. The leadership team will provide teachers with PBIS information as well as Flippen Group<br />
strategies for organizational and management skills.<br />
Assigned to:<br />
Target Completion Date: 05/31/2012<br />
Comments:<br />
Valerie Thomas-Wooden<br />
3. The sire test coordinator will provide teachers with data regarding the benchmark assessments<br />
Assigned to:<br />
Kathleen Jeffries<br />
Page: 32 of 41
Target Completion Date: 05/31/2012<br />
Comments:<br />
4. Teachers will be provided with a copy of the Safe School Plan.<br />
Assigned to:<br />
Marcus Moore<br />
Target Completion Date: 12/31/2012<br />
Comments:<br />
Implement Percent Task Complete: Tasks completed: 0 of 4 (0%)<br />
Indicator<br />
EEIIIA-7.08 - School leadership provides organizational policies and resources necessary<br />
for implementation and maintenance of a safe and effective learning environment. (291)<br />
Status Tasks completed: 1 of 5 (20%)<br />
Rubric Score Initial: 2<br />
Assessment Level of Development: Initial: Limited Development 11/02/2011<br />
Index: 6 (Priority Score x Opportunity Score)<br />
Priority Score: 3 (3 - highest, 2 - medium, 1 - lowest)<br />
Opportunity Score: 2 (3 - relatively easy to address, 2 - accomplished<br />
within current policy and budget conditions, 1 -<br />
requires changes in current policy and budget<br />
conditions)<br />
Describe current level of<br />
development:<br />
Plan Assigned to: Marcus Moore<br />
How it will look when fully met:<br />
Target Date: 05/31/2012<br />
Tasks:<br />
The school currently has a Positive Behavior Intervention<br />
System in place as well as a Safe School Plan.<br />
The adminstration will provide clear expectations to each<br />
teacher for the year and will provide necessary resources for<br />
teachers to be successful in achieving the expectations.<br />
1. Teachers will be provided with lesson plan/collaborative planning templates.<br />
Assigned to:<br />
Marcus Moore<br />
Target Completion Date: 08/31/2011<br />
Comments:<br />
Task Completed: 08/18/2011<br />
2. Teachers will be provided a procedures manual.<br />
Assigned to:<br />
Mr. Moore provided all teachers with a lesson plan template<br />
during the first teacher meeting before school began.<br />
Marcus Moore<br />
Target Completion Date: 12/20/2011<br />
Comments:<br />
3. Teachers will be provided feedback in an effort to continue their journey toward<br />
achieving/meeting the expectations such as evaluations, conferences with the principal,<br />
observations, data walks, etc.<br />
Assigned to:<br />
Marcus Moore<br />
Target Completion Date: 05/31/2012<br />
Comments:<br />
Page: 33 of 41
4. We will work to create an earthquake procedure and practice this procedure when practicing<br />
the other disaster drills each month.<br />
Assigned to:<br />
Michael Stick<br />
Target Completion Date: 05/31/2012<br />
Comments:<br />
5. New staff will receive professional development in PBIS on-site.<br />
Assigned to:<br />
Target Completion Date: 05/31/2012<br />
Comments:<br />
Valerie Thomas-Wooden<br />
Implement Percent Task Complete: Tasks completed: 1 of 5 (20%)<br />
Collaborative Leadership-Effective Leaders<br />
Essential Element 8 - Organizational Structure and Resources<br />
Indicator<br />
Status<br />
EEIIIB-8.02 - School leadership designs the master schedule to provide all students<br />
access to the entire curriculum. (296)<br />
Full Implementation<br />
Rubric Score Initial: 3<br />
Assessment Level of Development: Initial: Full Implementation 11/02/2011<br />
Evidence:<br />
This schedule was completed at the beginning of the school<br />
year. The schedule allows for the proper amount of time in the<br />
classroom as well as time in the library, gym, art and music<br />
classes. This schedule was created using the input of the<br />
entire faculty.<br />
Page: 34 of 41
Indicator<br />
EEIIIB-8.05 - School leadership uses effective strategies to attract highly qualified and<br />
highly effective teachers. (299)<br />
Status Tasks completed: 2 of 3 (67%)<br />
Rubric Score Initial: 2<br />
Assessment Level of Development: Initial: Limited Development 12/16/2010<br />
Index: 4 (Priority Score x Opportunity Score)<br />
Priority Score: 2 (3 - highest, 2 - medium, 1 - lowest)<br />
Opportunity Score: 2 (3 - relatively easy to address, 2 - accomplished<br />
within current policy and budget conditions, 1 -<br />
requires changes in current policy and budget<br />
conditions)<br />
Describe current level of<br />
development:<br />
Plan Assigned to: Marcus Moore<br />
How it will look when fully met:<br />
Target Date: 04/01/2011<br />
Tasks:<br />
At <strong>Anderson</strong> <strong>Elementary</strong>, the principal attends teacher job fairs<br />
both for <strong>Tulsa</strong> <strong>Public</strong> <strong>Schools</strong> and at regional universities to<br />
recruit highly qualified teachers. Teachers also participate in<br />
regular professional development provided in-house and by<br />
consultants to assist in professional growth.<br />
Beginning in January, the principal of <strong>Anderson</strong> <strong>Elementary</strong><br />
will attend job fairs at Oklahoma State University and<br />
Northeastern State University to recruit highly qualified<br />
teachers to both <strong>Anderson</strong> and <strong>Tulsa</strong> <strong>Public</strong> <strong>Schools</strong>. At<br />
<strong>Anderson</strong> <strong>Elementary</strong>, the principal will continue to attend<br />
teacher job fairs both for <strong>Tulsa</strong> <strong>Public</strong> <strong>Schools</strong> and at regional<br />
universities to recruit highly qualified teachers. Teachers also<br />
participate in regular professional development provided inhouse<br />
and by consultants to assist in professional growth.<br />
Teacher teams will continue to advise in the interview process.<br />
1. School leadership will offer teachers instructional feedback regarding research-based practices<br />
and data-driven instruction in a consistent and timely manner to guide and ensure the<br />
effectiveness of each teacher.<br />
Assigned to:<br />
Marcus Moore<br />
Target Completion Date: 03/30/2012<br />
Comments:<br />
Task Completed: 03/01/2011<br />
2. School leadership will utilize the Teacher Effective Index to evaluate teachers and to assess<br />
the effectiveness of all <strong>Anderson</strong> teachers.<br />
Assigned to:<br />
Marcus Moore<br />
Target Completion Date: 03/30/2011<br />
Comments:<br />
Task Completed: 03/01/2011<br />
3. <strong>Anderson</strong> will work with the area universities in an effort to recruit student teachers to our<br />
building and expand our job pool.<br />
Assigned to:<br />
Target Completion Date: 05/31/2012<br />
Valerie Thomas-Wooden<br />
Page: 35 of 41
Comments:<br />
Implement Percent Task Complete: Tasks completed: 2 of 3 (67%)<br />
Indicator<br />
Status<br />
EEIIIB-8.06 - School leadership provides time for vertical and horizontal planning across<br />
content areas and grade configurations. (300)<br />
Full Implementation<br />
Rubric Score Initial: 3<br />
Assessment Level of Development: Initial: Full Implementation 11/02/2011<br />
Evidence:<br />
Teachers meet within their grade level teams every Monday to<br />
collaborate and meet every Monday afterschool for one hour in<br />
the library to collaborate with other grade levels as well as the<br />
librarian, art teacher and gym teacher.<br />
Indicator<br />
EEIIIB-8.07 - School leadership collaborates with district leadership to provide increased<br />
opportunities to learn such as virtual courses, dual enrollment opportunities, and workbased<br />
internships. (301)<br />
Status Tasks completed: 0 of 1 (0%)<br />
Rubric Score Initial: 2<br />
Assessment Level of Development: Initial: Limited Development 12/16/2010<br />
Index: 2 (Priority Score x Opportunity Score)<br />
Priority Score: 2 (3 - highest, 2 - medium, 1 - lowest)<br />
Opportunity Score: 1 (3 - relatively easy to address, 2 - accomplished<br />
within current policy and budget conditions, 1 -<br />
requires changes in current policy and budget<br />
conditions)<br />
Describe current level of<br />
development:<br />
Plan Assigned to: Marcus Moore<br />
How it will look when fully met:<br />
Target Date: 05/01/2012<br />
Tasks:<br />
At <strong>Anderson</strong> <strong>Elementary</strong>, our students are afforded<br />
opportunities such as student council participation, Red Cross<br />
participation, Salvation Army food basket drive, participation in<br />
the Veteran's Day Parade and field trips. With more funding,<br />
being there experiences could be more frequent and more in<br />
depth.<br />
<strong>Anderson</strong> <strong>Elementary</strong> School students will participate in a<br />
minimum of one field trip per year per grade level. This field<br />
trip will be aligned with current benchmarks and standards<br />
and teachers will provide an assessment of knowledge after<br />
the field trip. <strong>Anderson</strong> will continue to utilize the Healthy<br />
Activity Time program which brings in speakers and hands-on<br />
being there experiences which teach about healthy food<br />
choices.<br />
1. <strong>Anderson</strong> <strong>Elementary</strong> School third through sixth grade students will participate in one<br />
community service learning project per year. They will be required to report on their service<br />
learning project and provide documentation for having participated.<br />
Assigned to:<br />
Marcus Moore<br />
Page: 36 of 41
Target Completion Date: 05/01/2012<br />
Comments:<br />
Implement Percent Task Complete: Tasks completed: 0 of 1 (0%)<br />
Indicator<br />
EEIIIB-8.08 - School leadership provides and communicates clearly defined process for<br />
equitable and consistent use of fiscal resources. (302)<br />
Status Tasks completed: 0 of 2 (0%)<br />
Rubric Score Initial: 2<br />
Assessment Level of Development: Initial: Limited Development 12/14/2010<br />
Index: 1 (Priority Score x Opportunity Score)<br />
Priority Score: 1 (3 - highest, 2 - medium, 1 - lowest)<br />
Opportunity Score: 1 (3 - relatively easy to address, 2 - accomplished<br />
within current policy and budget conditions, 1 -<br />
requires changes in current policy and budget<br />
conditions)<br />
Describe current level of<br />
development:<br />
Plan Assigned to: Marcus Moore<br />
How it will look when fully met:<br />
Target Date: 12/15/2011<br />
Tasks:<br />
1. Create a budget review committee.<br />
Assigned to:<br />
As a result of the state and district current fiscal difficulties<br />
there are a few decisions to be made at the school site.<br />
Whenever funds become available the principal discuss<br />
possible usage of such funds at staff meeting.<br />
The principal will establish a site budget committee from<br />
inservice staff meeting and establish a meeting schedule for<br />
the following year. The committee will meet every other<br />
month during the school year. The school secretary will<br />
distribute copies of the budget for committe members to be<br />
reviewed.The budget will be discussed at faculty meeting<br />
following Site Budget Committee meeting for review and<br />
comments.<br />
Marcus Moore<br />
Target Completion Date: 11/30/2011<br />
Comments:<br />
2. Develop a user friendly form to publish school financial records.<br />
Assigned to:<br />
Marcus Moore<br />
Target Completion Date: 12/15/2011<br />
Comments:<br />
Implement Percent Task Complete: Tasks completed: 0 of 2 (0%)<br />
Page: 37 of 41
Indicator<br />
EEIIIB-8.09 - School leadership directs funds based on an assessment of needs aligned to<br />
the school improvement plan. (303)<br />
Status Tasks completed: 0 of 2 (0%)<br />
Rubric Score Initial: 2<br />
Assessment Level of Development: Initial: Limited Development 12/14/2010<br />
Index: 3 (Priority Score x Opportunity Score)<br />
Priority Score: 3 (3 - highest, 2 - medium, 1 - lowest)<br />
Opportunity Score: 1 (3 - relatively easy to address, 2 - accomplished<br />
within current policy and budget conditions, 1 -<br />
requires changes in current policy and budget<br />
conditions)<br />
Describe current level of<br />
development:<br />
Plan Assigned to: Marcus Moore<br />
How it will look when fully met:<br />
Target Date: 12/20/2011<br />
Tasks:<br />
At anderson the students data has been an important<br />
instrument for the purchase of needed items for each grade<br />
level.<br />
The principal and teachers will collaborate during grade level<br />
meetings on student data. Based on assessments of needs<br />
funds will be distributed as determined by principal and staff.<br />
1. . A plan will be developed to for the distribution of discretionary funds based on student needs.<br />
Assigned to:<br />
Marcus Moore<br />
Target Completion Date: 11/30/2011<br />
Comments:<br />
2. Community resources will be tapped to develop more programs to promote student success.<br />
Assigned to:<br />
Wakel Ousley<br />
Target Completion Date: 12/15/2011<br />
Comments:<br />
Implement Percent Task Complete: Tasks completed: 0 of 2 (0%)<br />
Page: 38 of 41
Indicator<br />
EEIIIB-8.10 - School leadership allocates and integrates state and federal program<br />
resources to address identified student needs. (304)<br />
Status Tasks completed: 0 of 4 (0%)<br />
Rubric Score Initial: 2<br />
Assessment Level of Development: Initial: Limited Development 12/14/2010<br />
Index: 3 (Priority Score x Opportunity Score)<br />
Priority Score: 3 (3 - highest, 2 - medium, 1 - lowest)<br />
Opportunity Score: 1 (3 - relatively easy to address, 2 - accomplished<br />
within current policy and budget conditions, 1 -<br />
requires changes in current policy and budget<br />
conditions)<br />
Describe current level of<br />
development:<br />
Plan Assigned to: Marcus Moore<br />
How it will look when fully met:<br />
Target Date: 04/12/2012<br />
Tasks:<br />
The principal follows all guidelines as currently directed by the<br />
district concerning resources provided by the state and federal<br />
programs.<br />
At <strong>Anderson</strong> the principal will attend all relevant professional<br />
development to stay current with all state and federal<br />
guidelines in the district. The WISE plan will guide the principal<br />
to search for funds to meet the needs of the students.<br />
1. Principal/Team Leaders meetings will be conducted to direct money to support priority goals<br />
and programs.<br />
Assigned to:<br />
Marcus Moore<br />
Target Completion Date: 02/12/2012<br />
Comments:<br />
2. Teachers will attend professional development on research-based strategies as a result of<br />
student data disaggregation.<br />
Assigned to:<br />
Target Completion Date: 03/12/2012<br />
Comments:<br />
Valerie Thomas-Wooden<br />
3. Community organizations, businesses, and churches have input at leadership and PTA<br />
meetings.<br />
Assigned to:<br />
Wakel Ousley<br />
Target Completion Date: 12/15/2011<br />
Comments:<br />
4. Leadership will attend professional development regarding Title I funding and how it can be<br />
used within the school.<br />
Assigned to:<br />
Marcus Moore<br />
Target Completion Date: 05/31/2012<br />
Comments:<br />
Implement Percent Task Complete: Tasks completed: 0 of 4 (0%)<br />
Page: 39 of 41
Collaborative Leadership-Effective Leaders<br />
Essential Element 9- Comprehensive and Effective Planning<br />
Indicator<br />
Status<br />
EEIIIC-9.01 - School leadership uses a collaborative process to develop vision, beliefs,<br />
mission, and goals. (305)<br />
Full Implementation<br />
Rubric Score Initial: 3<br />
Assessment Level of Development: Initial: Full Implementation 11/02/2011<br />
Evidence:<br />
The principal has created a leadership team within the building<br />
to help with the development of the vision, beliefs, mission<br />
and goals of the building. The principal has also held<br />
professional learning community meetings to include the<br />
faculty in the decision making process.<br />
Indicator<br />
Status<br />
EEIIIC-9.02 - School planning team collects, manages, and analyzes data from multiple<br />
data sources. (306)<br />
Full Implementation<br />
Rubric Score Initial: 3<br />
Assessment Level of Development: Initial: Full Implementation 11/02/2011<br />
Evidence:<br />
The leadership team collects and uses data from the OCCT,<br />
DIBELS, Benchmark assessments, Fontus and Pinnel to guide<br />
decision making in the building. The counselor serves as the<br />
Site Test Coordinator and there is a Staff Development<br />
Teacher in the building to assist with data analysis.<br />
Indicator<br />
EEIIIC-9.05 - School planning team identifies action steps, resources, timelines, and<br />
persons responsible for implementing the activities aligned with school improvement<br />
goals and objectives. (309)<br />
Status Tasks completed: 1 of 5 (20%)<br />
Rubric Score Initial: 2<br />
Assessment Level of Development: Initial: Limited Development 11/02/2011<br />
Index: 6 (Priority Score x Opportunity Score)<br />
Priority Score: 3 (3 - highest, 2 - medium, 1 - lowest)<br />
Opportunity Score: 2 (3 - relatively easy to address, 2 - accomplished<br />
within current policy and budget conditions, 1 -<br />
requires changes in current policy and budget<br />
conditions)<br />
Describe current level of<br />
development:<br />
Plan Assigned to: Valerie Thomas-Wooden<br />
How it will look when fully met:<br />
Target Date: 05/31/2012<br />
Tasks:<br />
Currently the leadership team utilizes the WISE plan,<br />
collaboration meetings, beanchmark data to determine what<br />
areas/subjects/grade levels need resources and support.<br />
The leadership team will review the Wise plan monthly to<br />
determine what areas teachers need the most support.<br />
1. The WISE plan will be written to reflect the needs of the students based on the 2010-2011<br />
OCCT scores.<br />
Page: 40 of 41
Assigned to:<br />
Target Completion Date: 11/04/2011<br />
Comments:<br />
Task Completed: 11/30/2011<br />
Valerie Thomas-Wooden<br />
2. The WISE plan will be reviewed monthly by the leadership team as well as grade level teams<br />
to monitor improvement or determine areas which need more focus based on classroom<br />
assessments, DIEBLS data, benchmark assessment data, etc.<br />
Assigned to:<br />
Marcus Moore<br />
Target Completion Date: 05/31/2012<br />
Comments:<br />
3. The WISE plan will be edited monthly according to progress made or areas that are<br />
determined to need improvement according to the collected data.<br />
Assigned to:<br />
Target Completion Date: 12/01/2011<br />
Comments:<br />
Valerie Thomas-Wooden<br />
4. The WISE process manager will receive a stipened paid with Title I funds for reviewing and<br />
revising the WISE plan monthy and insuring that the integrity of the plan is being maintained.<br />
Assigned to:<br />
Marcus Moore<br />
Target Completion Date: 12/31/2012<br />
Comments:<br />
5. The WISE plan will be presented by the WISE process manager to the staff after approval at<br />
the state level.<br />
Assigned to:<br />
Target Completion Date: 05/31/2012<br />
Comments:<br />
Valerie Thomas-Wooden<br />
Implement Percent Task Complete: Tasks completed: 1 of 5 (20%)<br />
February 09, 2012<br />
Page: 41 of 41
<strong>Tulsa</strong> <strong>Public</strong> <strong>Schools</strong><br />
Program Management Office(PMO)<br />
Scholastic Reading Inventory (SRI) Baseline Data of October 7, 2011<br />
SECTION I<br />
<strong>Anderson</strong> <strong>Elementary</strong> School<br />
Reading and Common Core Standards :**<br />
"The Common Core Standards aim to ensure that all students are "on track" to be both college and career ready. Research<br />
shows that high school graduation no longer guarantees that students are ready for the postsecondary challenges that await<br />
them. While the reading demands of college, the workforce and life in general have remained consistent or increased over<br />
time, K-12 texts and reading tasks have decreased in complexity. The result is a significant gap between many students'<br />
reading abilities and the reading demands they will likely encounter after graduation". http://www.lexile.com/usinglexile/lexile-measures-and-the-ccssi/<br />
"In 2006, ACT, Inc., released a report called Reading Between the Lines that showed which skills differentiated those<br />
students who equaled or exceeded the benchmark score (21 out of 36) in the reading section of the ACT college admissions<br />
test from those who did not. Prior ACT research had shown that students achieving the benchmark score or better in<br />
reading—which only about half (51 percent) of the roughly half million test takers in the 2004–2005 academic year had<br />
done—had a high probability (75 percent chance) of earning a C or better in an introductory, credit-bearing course in U.S.<br />
history or psychology (two common reading-intensive courses taken by first-year college students) and a 50 percent chance<br />
of earning a B or better in such a course. Surprisingly, what chiefly distinguished the performance of those students who<br />
had earned the benchmark score or better from those who had not was not their relative ability in making inferences while<br />
reading or answering questions related to particular cognitive processes, such as determining main ideas or determining the<br />
meaning of words and phrases in context. Instead, the clearest differentiator was students’ ability to answer questions<br />
associated with complex texts. Students scoring below benchmark performed no better than chance (25 percent correct) on<br />
four-option multiple-choice questions pertaining to passages rated as ―complex‖ on a three-point qualitative rubric described<br />
in the report".<br />
"These findings held for male and female students, students from all racial/ethnic groups, and students from families with<br />
widely varying incomes. The most important implication of this study was that a pedagogy focused only on ―higher-order‖ or<br />
―critical‖ thinking was insufficient to ensure that students were ready for college and careers: what students could read, in<br />
terms of its complexity, was at least as important as what they could do with what they read."<br />
Lexile Ranges and the Common Core Initiative:**<br />
"The Common Core Standards advocate a "staircase" of increasing text complexity, beginning in grade 2, so that students<br />
can develop their reading skills and apply them to more difficult texts. At the lowest grade in each band, students focus on<br />
reading texts within that text complexity band. In the subsequent grade or grades within a band, students must "stretch" to<br />
read a certain proportion of texts from the next higher text complexity band. This pattern repeats itself throughout the grades<br />
so that students can both build on earlier literacy gains and challenge themselves with texts at a higher complexity level. all<br />
students should be reading at the college and career readiness level by no later than the end of high school. To measure<br />
the attainment of higher complexity levels of reading required for ,Common Core Standards the use of " qualitative scales of<br />
text complexity anchored at one end by descriptions of texts representative of those required in typical first-year creditbearing<br />
college courses and in workforce training programs" is essential. Lexile measures and the Lexile ranges are widely<br />
recognized as a qualitative scale suited for such a purpose. By incorporating Lexile Ranges as measures of student<br />
performance, schools can readily determine what text is appropriate for each grade band and what should be considered<br />
"stretch" text."<br />
MetaMetrics, a leader in the development and validation of the use of Lexile has realigned its Lexile ranges (Table 1) to<br />
match the Standards’ text complexity grade bands and has adjusted upward its trajectory of reading comprehension<br />
development through the grades to indicate that all students should be reading at the college and career readiness level by<br />
no later than the end of high school.<br />
Table I<br />
Text Complexity<br />
Grade Band in the<br />
Standards<br />
K-1<br />
2-3<br />
4-5<br />
6-8<br />
9-10<br />
11-C.C.R.<br />
Lexile Ranges Aligned to<br />
Old Lexile Ranges<br />
Common Core Expectations<br />
NA<br />
NA<br />
450-725 450-790<br />
645-895 770-980<br />
860-1010 955-1155<br />
960-1115 1080-1305<br />
1070-1220 1215-1355<br />
Lexile Range Performance and College Career Readiness (CCR) :**<br />
"Additional research has shown that the texts required for many postsecondary pursuits fall within a Lexile range of 1200L to 1400L, while the<br />
text complexity of typical high school textbooks for grades 11 and 12 is about 1050L to 1165L. This research provides valuable insight into the<br />
apparent disconnect when high school graduates encounter college and career texts. To put this gap in perspective, a 250L difference between<br />
reader ability and text complexity can cause a drop from 75-percent comprehension to 50-percent comprehension. This means that high school<br />
seniors who can successfully read twelfth-grade texts may enter college or the workplace several months later and encounter texts that result<br />
in less than 50-percent comprehension."<br />
** Excerpted from "Common Core State Standards for Language Arts & Literacy in History/Social Studies Science and Technical Subjects :Appendix A"<br />
Prepared by Taylor L. Young, Ph.D. 1 11:07 AM2/16/2012
<strong>Tulsa</strong> <strong>Public</strong> <strong>Schools</strong><br />
Program Management Office(PMO)<br />
Scholastic Reading Inventory (SRI) Baseline Data of October 7, 2011<br />
SECTION II<br />
Implementation Of Scholastic Reading Inventory<br />
In December of the 2010-11 school year a district level task force formed by the Curriculum Office recommended that the SRI be used as<br />
a district screening device to measure the reading levels of students grades 4 through 11. The SRI was selected because it is an<br />
computer based reading assessment that provides an individual assessment based upon the abilities of each person taking the<br />
assessment. The score obtained from the assessment is a Lexile score is based upon the Lexile ranges developed by MetaMetrics . The<br />
SRI reports the range of ability rather than a single yes or no, pass or failure type measurement.<br />
In April and May of 2011 the Program Management Office , the Instructional Support Services Department and the Curriculum<br />
Department deployed a district wide SRI screening program for students in grades 4 through 11. Beginning in the 2011-2012 school year<br />
students in grades 4 through 11 will receive a SRI in September and again May of 2012. The two SRI administered during the 2011-2012<br />
year will be used to measure the Lexile gains during the school year. The information in this this report is baseline data collected from<br />
SRI screenings conducted into he spring of 2011. These results will be compared to the data collected during the 2011-2012 year to<br />
determine gains and/or gap analysis.<br />
SECTION III<br />
Baseline Lexile Range Performance<br />
Presented below is a chart depicting the distribution of the Lexile performance of students screened using the performance Lexile<br />
ranges established by MetaMetrics and adopted by Scholastic Inc. contained in the SRI.<br />
<strong>Anderson</strong> <strong>Elementary</strong> School, 4th Through 6th Grade, Scholastic<br />
Reading Inventory (SRI) Baseline Data of October 7, 2011<br />
0%<br />
BR 0%<br />
At Risk 100%<br />
Basic 0%<br />
Proficient<br />
#REF!<br />
Advanced 0%<br />
BR<br />
At Risk<br />
Basic<br />
Proficient<br />
Advanced<br />
100%<br />
Reading Proficiency Levels : Scholastic READ 180 Placement, Assessment, and Reporting Guide Revised Edition, 2009, page 18.<br />
BR: Beginning reader<br />
At Risk: Significantly Below Grade Level Student does not exhibit minimally competent performance when reading grade level appropriate text.<br />
Basic: Below Grade Level Student exhibits minimally competent performance when reading grade-level appropriate text.<br />
Proficient: Grade Level Student exhibits competent performance when reading grade-level appropriate text and can identify details, draw<br />
conclusions, and make comparisons and generalizations.<br />
Advanced: Above Grade Level Student exhibits superior performance when reading grade-level appropriate text.<br />
SECTION IV<br />
Analysis of Data<br />
As of October 7,(Official Baseline for 2011-2012), 2011, 2% of the students in grades 4th through 6th had completed an SRI.<br />
Zero percent of these students placed at the proficient Lexile level or above. One-hundred percent of the students completing<br />
the SRI placed in the "Basic" or "At Risk" or "BR" Lexile level category.<br />
When calculating the estimated Lexile range required to be a proficient reader in the Common Core Standards, current data<br />
indicates 0% of the students would possess the necessary reading skills to demonstrate success in Common Core<br />
Standards.<br />
Prepared by Taylor L. Young, Ph.D. 2 11:07 AM2/16/2012
SECTION V<br />
Levels of Reading Proficiency<br />
<strong>Tulsa</strong> <strong>Public</strong> <strong>Schools</strong><br />
Program Management Office(PMO)<br />
Scholastic Reading Inventory (SRI) Baseline Data of October 7, 2011<br />
The actual Lexile range performance results by students (on the left) compared to the same Lexile performance results (on the<br />
right) sorted into the expected Lexile range necessary for success in the Common Core Standards.<br />
<strong>Anderson</strong> <strong>Elementary</strong> School, October 7, 2011<br />
Reading Proficiency 4th Grade % of Students<br />
Lexile Range Required for Common<br />
BR 0 0%<br />
Core Standards<br />
At Risk 349 and Below 1 100%<br />
4th % of<br />
Basic 350 to 599 0 0%<br />
Grade students<br />
Proficient 600 to 900 0 0% Proficient 770 to 980 0 0%<br />
Advanced 901 and Above 0 0% 100% Above 980 0 0%<br />
Total with SRI 1 2% Total of SRI 0 0%<br />
No Lexile 46 98%<br />
Total 4th Grade 47 100%<br />
Reading Proficiency 5th Grade % of Students<br />
Lexile Range Required for Common<br />
BR 0 0%<br />
Core Standards<br />
At Risk 449 and Below 0 0%<br />
5th % of<br />
Basic 450 to 699 0 0%<br />
Grade students<br />
Proficient 700 to 1000 0 0% Proficient 770 to 980 0 #DIV/0!<br />
Advanced 1001 and Above 0 0% 0% Above 980 0 #DIV/0!<br />
Total with SRI 0 0% Total of SRI 0 #DIV/0!<br />
No Lexile 51 100%<br />
Total 5th Grade 51 100%<br />
Reading Proficiency 6th Grade % of Students<br />
Lexile Range Required for Common<br />
BR 0%<br />
Core Standards<br />
At Risk 499 and Below 1 100%<br />
6th % of<br />
Basic 500 to 799 0%<br />
Proficient 955 to Grade students<br />
Proficient 800 to 1050 0% 1155<br />
0%<br />
Advanced 1051 and Above 0% 100% Above 1155 0%<br />
Total with SRI 1 4% Total of SRI 0 0%<br />
No Lexile 23 96%<br />
Total 6th Grade 24 100%<br />
Level of Reading Proficiency<br />
All ( 4th through 6th Grades)<br />
Grades 4th<br />
through 6th % of Students<br />
Lexile Range Required in Common Core<br />
BR 0 0%<br />
Standards<br />
At Risk 2 100%<br />
% of<br />
Basic 0 0%<br />
Grades 4th through 6th students<br />
Proficient 0 0% Proficient 0 0%<br />
Advanced 0 0% 100% Above Proficient 0 0%<br />
Total with SRI 2 2% Total of SRI 0 0%<br />
Total No Lexile 120 98%<br />
Total 4th through 6th 122 100%<br />
SECTION VI<br />
Common Lexile Levels<br />
Listed below are the Lexile levels for material from three types of text with titles for comparative purposes.<br />
Informational Text Lexile Levels<br />
Functional Text Lexile Levels<br />
College Text 1200-1400 College Application 1500+<br />
New York Times 1380 State Job Application 1410<br />
Scholastic Home Page 1220 Application for Federal Student Aid 1270<br />
11th Grade Chemistry Textbook 1100 Car Warranty Application 1160<br />
11th Grade American Literature Textbook 1040 Pool Installation Manual 1130<br />
<strong>Elementary</strong> Encyclopedia 850 Drivers License Manual 1020<br />
All About Things People Do 630 Play Station Install Instructions 830<br />
The World of Water 300<br />
Narrative Text Lexile Levels<br />
Billy Bud 1450<br />
Up From Slavery 1320<br />
The Scarlet Pimpernel 1140<br />
The Old Man and the Sea 940<br />
Charlie and the Chocolate Factory 810<br />
Esperanza Rising 760<br />
I Lost my Tooth in Africa 620<br />
Toy Assembly Instructions 760 Knight 590<br />
Children's Comic Strip 350<br />
Clifford the Big Red Dog 200<br />
SECTION VII<br />
What is expected Lexile growth?<br />
The proficient Lexile performance ranges presented in SECTION V are the ranges which should be achieved by<br />
a student before the end of a given school year. An anticipated rate of growth equaling one year of reading<br />
development is 100 Lexile points for a student in an elementary school, 75 Lexile points for a student in a<br />
middle school, and 50 points for a student in a high school. Students who are "At Risk" or even "Basic" Lexile<br />
may need to attain more than a years growth in a years time. This type of growth is possible within an READ<br />
180 classroom that is effectively operating at model standards.<br />
Prepared by Taylor L. Young, Ph.D. 3 11:07 AM2/16/2012
QUARTERLY REVIEW<br />
DECEMBER, 2011<br />
<strong>Anderson</strong> <strong>Elementary</strong> School
Draft Vision Statement at <strong>Anderson</strong><br />
The vision of <strong>Anderson</strong> <strong>Elementary</strong> School is to provide a<br />
safe, respectful and rigorous learning environment for all<br />
stakeholders. Students will be empowered and motivated<br />
to direct their own learning. Staff will maintain high<br />
expectations for ALL students by encouraging hands-on<br />
learning opportunities, appealing their various learning<br />
styles, providing opportunities for 21 st Century learning, and<br />
ensuring that every student has ample opportunities to<br />
succeed. All staff will support each other while committing<br />
to continuous learning and collaboration designed to<br />
enhance our learning. Every effort will be taken to ensure<br />
the school has all of the resources it needs to provide our<br />
students with a world-class education.
Explanation of Dashboard<br />
Click the + sign for Home<br />
Click the + sign for Dashboard<br />
Click the + sign for Student<br />
Click the + sign for Attendance<br />
Click Attendance 2011-2012<br />
Choose <strong>Anderson</strong> using the drop bar<br />
Click the face for Attendance % by race – 2011 -<br />
2012 Student<br />
Choose a student by clicking the face to show the<br />
student’s profile
<strong>Anderson</strong> Data Summary<br />
Attendance Percentage - 2011-2012 Total<br />
Attend<br />
Percent<br />
95.16%
<strong>Anderson</strong> Data Summary
<strong>Anderson</strong> Data Summary<br />
Comparing Populations on DIBELS<br />
(well below and below students in need of intervention right now)
<strong>Anderson</strong> Data Summary<br />
Comparing Populations on DIBELS<br />
(well below, below and at benchmark)
<strong>Anderson</strong> Data Summary
Pre-Kindergarten ECAT Scores<br />
Fall 2011<br />
Gender<br />
Race<br />
ELL<br />
IEP<br />
Full Day (F) - Half<br />
Day (H)<br />
Social - Emotional<br />
(5)<br />
Personal Skills (3)<br />
Congnitive Math<br />
(29)<br />
L.A. - Literacy (20)<br />
Motor Skills (3)<br />
Fall TOTAL (60)<br />
0-15 (L) 16-36 (M)<br />
37-48 (A) 49-60 (P)<br />
M B F 1 1 1 5 0 8 Limited<br />
F B F 5 2 4 2 1 14 Limited<br />
M W F 6 2 2 4 1 15 Limited<br />
M B F 5 1 5 4 1 16 Minimal<br />
M B X F 5 2 5 3 1 16 Minimal<br />
F B F 5 1 8 3 1 18 Minimal<br />
M B F 4 1 12 3 1 20 Minimal<br />
F B F 5 1 7 5 2 20 Minimal<br />
M B F 4 2 9 5 1 21 Minimal<br />
M B X F 5 1 11 5 1 23 Minimal<br />
M B F 5 2 8 7 1 23 Minimal<br />
M B X F 5 1 12 9 1 28 Minimal<br />
F B F 5 2 19 2 1 29 Minimal<br />
F B F 5 3 12 9 1 30 Minimal<br />
M W F 5 3 12 9 1 30 Minimal<br />
F W F 5 3 17 7 1 32 Minimal<br />
M B F 5 2 17 8 1 33 Minimal<br />
F B F 5 3 13 11 1 36 Minimal<br />
F B F 5 2 19 9 1 36 Minimal<br />
F B F 5 2 22 9 1 39 Adequate<br />
Limited – 3 students<br />
Minimal – 17 students<br />
Adequate – 1 student<br />
Gender<br />
Race<br />
ELL<br />
IEP<br />
Full Day (F) - Half<br />
Day (H)<br />
Social - Emotional<br />
(5)<br />
Personal Skills (3)<br />
Congnitive<br />
Math (29)<br />
L.A. - Literacy (20)<br />
Motor Skills (3)<br />
Fall TOTAL (60)<br />
0-15 (L) 16-36 (M)<br />
37-48 (A) 49-60 (P)<br />
M B F 5 2 28 20 2 57 Adequate<br />
M B F 2 3 21 10 0 36 Minimal<br />
M W F 3 3 19 8 0 33 Minimal<br />
M B F 5 2 14 9 2 32 Minimal<br />
M B X F 2 2 16 8 0 28 Minimal<br />
M B F 1 2 6 5 1 15 Limited<br />
M B F 2 2 6 4 0 14 Limited<br />
M B F 1 1 5 4 0 11 Limited<br />
M B F 1 1 0 0 0 2 Limited<br />
M B X F 5 1 25 5 2 38 Minimal<br />
F B F 3 3 16 4 1 27 Minimal<br />
F B X F 0 2 11 10 0 23 Minimal<br />
F B F 0 2 11 9 0 22 Minimal<br />
F B F 3 3 5 8 0 19 Minimal<br />
F W F 2 2 10 4 0 18 Minimal<br />
F W F 2 1 6 5 0 14 Limited<br />
F B F 5 3 15 12 1 36 Minimal<br />
M B F 5 1 16 9 2 33 Minimal<br />
F B F 5 2 9 5 1 22 Minimal<br />
F B F 1 1 11 4 0 17 Adequate<br />
M B F 4 3 19 8 1 35 Minimal<br />
Limited – 5 students<br />
Minimal – 14 students<br />
Adequate – 2 students
<strong>Anderson</strong> Data Summary<br />
Enrollment Count by Grade<br />
Total of 9 row(s) with 10000 Row<br />
Limit<br />
Domain<br />
Alternate<br />
Decode<br />
Students<br />
PK3 5<br />
PK4 39<br />
KG 70<br />
01 70<br />
02 55<br />
03 38<br />
04 51<br />
05 47<br />
06 28
<strong>Anderson</strong> Data Summary<br />
Discipline Action Count by Month<br />
Total of 4 row(s) with 10000 Row Limit<br />
Incidents Month Action Type<br />
1Sep<br />
SUSPENDED FROM SCH.<br />
37Oct<br />
SUSPENDED FROM SCH.<br />
1Nov<br />
@ERR<br />
24Nov<br />
SUSPENDED FROM SCH.
<strong>Anderson</strong> Data Summary<br />
YTD Violent Incident Count<br />
Total of 3 row(s) with 10000 Row Limit<br />
Incidents<br />
Offense Type<br />
1ASSAULT<br />
43FIGHTING<br />
2HARRASS/INTIMIDATE/BULLY
<strong>Anderson</strong> Data Summary<br />
Incident Count by Grade<br />
Total of 10 row(s) with 10000 Row Limit<br />
Offense Type<br />
Incidents<br />
Total of 7 row(s) with 10000 Row Limit<br />
Incidents<br />
Domain<br />
Alternate<br />
Decode<br />
3PK4<br />
36KG<br />
1601<br />
1802<br />
2803<br />
2204<br />
3205<br />
@ERR 2<br />
ASSAULT 1<br />
DISRUPTIVE<br />
BEHAVIOR 7<br />
District Truancy 93<br />
FIGHTING 43<br />
HARRASS/INTIMIDATE<br />
/BULLY 2<br />
PETIT LARCENY 1<br />
POSSESS<br />
WEAPON/FACSIMILE 1<br />
SKIPPING/CUTTING<br />
CLASS 5<br />
THEFT BY RECEIVING 1
<strong>Anderson</strong> Data Summary<br />
Incident Count by Location<br />
Filter Criteria:
2010-2011 OCCT Data- 3 rd<br />
Grade
2010-2011 OCCT Data- 4 th<br />
Grade
2010-2011 OCCT Data- 5 th<br />
Grade
2010-2011 OCCT Data- 5 th Grade<br />
continued
<strong>Anderson</strong> Data Summary<br />
Reading Benchmark Data Fall 2011<br />
40<br />
35<br />
30<br />
25<br />
20<br />
15<br />
10<br />
Unsatisfactory<br />
Limited<br />
Proficient<br />
Advanced<br />
5<br />
0<br />
2nd grade 3rd grade 4th grade 5th grade 6th grade<br />
Unsatisfactor Limited<br />
Proficient<br />
y<br />
2 nd – 16 students 2 nd – 5 students<br />
2 nd 3<br />
– 26 students<br />
grade – missing 3 rd grade – missing<br />
3 rd data<br />
data<br />
grade – missing<br />
4<br />
data<br />
grade- 4 students 4 th grade- 0 students<br />
4 th 5<br />
grade- 34<br />
grade – 7<br />
5 th grade – 0<br />
students<br />
students<br />
students<br />
5 th 6<br />
grade – 38<br />
grade - 3<br />
6 th grade - 3<br />
students<br />
students
<strong>Anderson</strong> Data Summary<br />
Math Benchmark Data Fall 2011<br />
60<br />
50<br />
40<br />
30<br />
20<br />
unsatisfactory<br />
limited<br />
proficient<br />
advanced<br />
10<br />
0<br />
2nd grade 3rd grade 4th grade 5th grade 6th grade<br />
Unsatisfactory<br />
2 nd – 50 students<br />
3 rd grade – no data<br />
4 th grade- no data<br />
5 th grade – 39<br />
students<br />
6 th grade - 19<br />
Limited<br />
2 nd grade – 1<br />
3 rd grade – no data<br />
4 th grade – no data<br />
5 th grade – 6 students<br />
6 th grade – 0 students<br />
Proficent<br />
2 nd grade – 0<br />
students<br />
3 rd grade – no data<br />
4 th grade – no data<br />
5 th grade – 2<br />
students
Prepare students, pre‐correct potential<br />
misbehaviors, intentionally set the tone<br />
for the next event<br />
Observe and identify<br />
problem behavior<br />
Teacher managed<br />
Is the behavior<br />
teacher or office<br />
managed?<br />
Office managed<br />
Redirect student<br />
Re‐teach<br />
Remind student of<br />
appropriate behavior in this<br />
situation and of potential +<br />
/‐ consequences<br />
Second reminder of<br />
appropriate behavior in this<br />
situation and of potential<br />
+/‐ consequences<br />
Student completes selfassessment<br />
form<br />
YES<br />
Did the<br />
behavior<br />
change?<br />
NO<br />
Teacher vs. Principal<br />
Managed Managed<br />
• Inappropriate language<br />
• Not having materials<br />
• Blurting out<br />
• Teasing<br />
• Refusal to work<br />
• Non‐compliance<br />
• Minor dishonesty<br />
• Inappropriate clothing<br />
• Minor disruption<br />
• Minor aggression<br />
• Unsafe or rough play<br />
• Disrespectful<br />
o Tone<br />
o Attitude<br />
o Body<br />
Language<br />
• Disrespect towards<br />
Property<br />
• Pattern of not<br />
completing homework<br />
• Aggressive physical<br />
contact<br />
• Fighting<br />
• Property destruction<br />
• Weapons<br />
• Leaving School<br />
property<br />
• Pattern of aggressive/<br />
profane language<br />
• Credible threats<br />
• Harassment of<br />
students/teachers<br />
• Major/chronic<br />
destruction<br />
• Major/chronic refusal<br />
to follow school rules<br />
• Major dishonesty<br />
• Chronic minor<br />
infractions<br />
• Theft<br />
• Racial/Ethnic<br />
discrimination<br />
• Cheating<br />
Teacher completes<br />
Student Referral Form<br />
and sends the form to<br />
the office<br />
Student completes<br />
self‐assessment form<br />
Administrative<br />
action<br />
Administration<br />
follows up with<br />
referring teacher<br />
Notice and<br />
reward<br />
correct<br />
behaviors<br />
Complete Student<br />
Referral Report and send<br />
form to office<br />
Refer to principal
<strong>Anderson</strong> <strong>Elementary</strong> School 2011‐2012<br />
Parent/Guardian Notification Attempts<br />
Student Name________________________________________<br />
Date___________________<br />
Time Number Called Parent/Guardian Notified Reason for Notification Result
The following are suggested interventions that may be utilized in correcting a student’s<br />
inappropriate behavior. Interventions listed are not hierarchical. Not all intervention strategies for<br />
each level need to be utilized.<br />
PRECORRECTION IS THE MOST PROACTIVE WAY TO INCREASE STUDENT ENGAGEMENT IN CLASSROOM ACTIVITIES<br />
Behavior causes minimal interference with instructional process based on class<br />
and/or school procedures<br />
*Proximity control<br />
*Nonverbal cue to correct behavior<br />
*Verbal warning to student(s)<br />
*Private conference with student (in classroom or hallway)<br />
*In‐class modified seating<br />
*In‐class time out<br />
Teacher- Managed<br />
Behavior causes interference with instructional process based on class and/or<br />
school procedures.<br />
*Student/Teacher conference<br />
*Out of class time with another teacher<br />
*Phone call or other correspondence to parent/guardian<br />
*Completion of Student Self‐Assessment<br />
*Recess detention in ISD<br />
Behavior that continues after correction and intervention<br />
*Teacher/referring staff member completes Student Action Report<br />
*Teacher/referring staff member phones parent<br />
*Parent/Student/Teacher conference<br />
*Parent/Student/Team conference<br />
*Team/Student/Administrator conference<br />
*Refer to guidance<br />
Office- Managed<br />
Administrative action<br />
*Disciplinary consequences<br />
*Removal of student from area<br />
*Baggage Claim<br />
*In/Out‐of‐School Suspension
<strong>Anderson</strong> <strong>Elementary</strong><br />
Definitions of Major Behaviors<br />
Abusive/<br />
Inappropriate Language<br />
Fighting<br />
Verbal messages that include swearing or using<br />
words in an inappropriate way in such a manner<br />
that the learning environment is significantly<br />
disrupted.<br />
(different from Harassment/Discrimination)<br />
At least two students mutually engaged in serious<br />
physical contact (punching, kicking, scratching,<br />
hair pulling, hitting with object).<br />
Physical Aggression<br />
Insubordination<br />
Student Threat<br />
Disruption<br />
Bully/Harassment/Discrimination<br />
Property Damage (school)<br />
Property Damage (others)<br />
Vandalism<br />
Theft<br />
One student making serious physical contact<br />
upon another (hitting, punching, kicking,<br />
scratching, hair pulling, hitting with object).<br />
Complete refusal to follow staff directions in such<br />
a manner that the learning environment is<br />
significantly disrupted and/or the students places<br />
his/herself in a dangerous situation.<br />
Student delivers a message (verbalized, written,<br />
drawn or gestured) toward another that conveys<br />
an act of intended injury or harm.<br />
Behavior causing a sustained and significant<br />
interruption of a class or activity.<br />
Include but are not limited to verbal or physical<br />
contact, epithets, slurs, gestures, or graffiti, even<br />
in jest, that are targeted toward an individual<br />
because of race, color, religion, sex, sexual<br />
orientation, age, national origin, marital status,<br />
veteran status, disability or genetic information.<br />
Deliberately impairing the usefulness of school<br />
property. (different from Vandalism).<br />
Deliberately impairing the usefulness of another’s<br />
student’s or staff member’s personal property.<br />
Participating in an activity that results in<br />
substantial destruction or disfigurement of<br />
property.<br />
Possession of, having passed on, or the removing<br />
of someone else’s property.
ANDERSON EAGLES<br />
*Level II<br />
Student Behavior Documentation<br />
Reflection Sheet<br />
Extraordinary<br />
Achievers<br />
Generate<br />
Lifelong<br />
Exemplary<br />
1. What did I do wrong?<br />
2. Why did I do it?<br />
3. What should I do next time?<br />
4. How do I fix it?<br />
**************************************************************************<br />
Conference Conducted by _______________________Title ______________ Date _______<br />
Student Signature _________________________ Staff __________________ time _______<br />
Parent Contact: phone _________left message ______face to face ______ time _________<br />
Name of adult contact: ________________________
<strong>Anderson</strong> <strong>Elementary</strong> Discipline Procedure<br />
LEVELS OF BEHAVIOR<br />
Tier I Behaviors<br />
Tier I behaviors (Code 100s) are those which are best addressed initially in the classroom by<br />
the classroom teacher. If the behaviors continue or are more severe, these may be the need<br />
to have additional interventions at the building level.<br />
Inappropriate Personal Property Gang Symbols<br />
Insubordination Put Downs/Teasing<br />
Verbal or Non Verbal Profanity Not Staying on Task<br />
Bullying‐Verbal intimidation Not Following Dress Code<br />
No Hall Pass Minor Rough Play<br />
Tier I Interventions<br />
Students who engage in Tier I behaviors will be asked to identify inappropriate behavior and<br />
describe the appropriate replacement behavior. Students may receive a mild consequence<br />
delivered by the teacher or staff member designed to discourage the inappropriate behavior<br />
from occurring in the future. Consequences for Tier I behaviors require a phone call to<br />
Guardian and may include but are not limited to:<br />
Verbal correction Loss of privileges<br />
Time out Detention<br />
Apology Behavior Plan<br />
Review of procedures Conference<br />
Tier II Behaviors<br />
Tier II behaviors (Code 200s) are more serious in nature. Tier II behaviors will result in an<br />
immediate verbal correction, a logical consequence, and a written referral form that is filled<br />
out by staff member and sent to office.<br />
Chronic Tier I Behavior<br />
Harassment, Intimidation, Bullying or<br />
Threatening Behavior<br />
Petit Larceny<br />
Excessive Rough Play<br />
Excessive Classroom Disruptions<br />
Inappropriate Use of Technology<br />
Conspiracy<br />
Possession of Stolen Property<br />
Excessive Disrespect<br />
Fighting
<strong>Anderson</strong> Data Summary<br />
Gifted/Sped/ELL Program Count<br />
Program Count<br />
Total of 9 row(s) with 10000 Row Limit<br />
Grade G/T SPED ELL<br />
PK3 0 3 0<br />
PK4 0 3 0<br />
KG 0 3 0<br />
01 1 5 0<br />
02 1 1 0<br />
03 1 3 0<br />
04 2 8 0<br />
05 3 8 0<br />
06 1 1 0
Child Study Team Process<br />
The Child Study Team meets every Thursday<br />
The counselor is the CST Chair<br />
All students were universally screened using<br />
DIBELS or Fountas n Pinnell<br />
All teachers must complete a Request for Child<br />
Study Team Referral before a child is brought<br />
to Child Study<br />
All teachers must present their student data to<br />
the child study team for
Universal Screening for ALL Students at <strong>Anderson</strong> ES<br />
* DIBELS /Fountas n Pinnell *Benchmark Test *OCCT *(OTHER???)<br />
Child Study Grade-Level Team<br />
Reviews student-learning data to determine which students meet grade level standards.<br />
Tier 1<br />
Students who meet grade-level standards will remain at<br />
Tier 1.<br />
Universal screening is reviewed by the grade-level CST after each benchmark<br />
assessment (i.e. every 6 weeks); however, the teacher monitors each<br />
student’s performance weekly to inform his/her instructional practice.<br />
Tier 2<br />
Students who do NOT meet grade-level<br />
standards will be CONSIDERED for Tier 2<br />
intervention.<br />
The grade-level CST will use universal screening data ,<br />
information from other relevant records (see attachment for<br />
examples of records) , and teacher recommendations to<br />
IDENTIFY and PRIORITIZE students for Tier 2 Intervention.<br />
6-8 weeks of relevant data is to be collected before<br />
completing the CST referral form; the grade-level CST chair<br />
is to schedule a pre-conference with the teacher before<br />
taking it to the team.<br />
Once the team identifies students for tier 2 intervention, the grade-level CST will determine the appropriate<br />
interventions. During this time, the team will complete an Intervention Plan, the grade-level chair will notify the parent<br />
in writing of the interventions being implemented , and the grade-level CST will review the data in 6 weeks.<br />
Goal met, return to Tier 1, notify<br />
parents<br />
Making progress, continue with<br />
intervention, notify parents<br />
Insufficient progress, CST moves to Tier<br />
3 Intervention, notify parents<br />
Tier 3 (Child Study Core Team)<br />
The Core CST (Sped coordinator, SDT, counselor, principal, principal intern, psychologist, parent, referring teacher,<br />
nurse, and social worker) will:<br />
• Conduct observations to determine fidelity of implementation of the intervention<br />
• Determine if additional tier 2 interventions are required<br />
• Determine if the student requires a 504 or needs to be assessed for Special Education
READING/WRITING CURRICULUM‐BASED MEASUREMENTS AND<br />
ASSESSMENTS<br />
Documentation:<br />
DIBELS print outs<br />
sample reading text<br />
benchmark reading text<br />
4 writing samples<br />
RDG<br />
ASSESSMENT<br />
DATE SCORE BENCHMARK<br />
BEHAVIOR CURRICULUChM‐BASED MEASUREMENTS AND ASSESSMENTS<br />
Documentation:<br />
ABC Frequency Chart<br />
Functional Behavior Assessment/Behavior Intervention Plan<br />
Observation Data<br />
Contracts<br />
Phone Logs<br />
STRATEGIES<br />
DURATION<br />
ISF Behavior management techniques<br />
LNF Adjusted work load<br />
PSF Modified methods, materials<br />
NWF Extended time<br />
ORF Repetition of directions<br />
RTF Wait time<br />
WUF Peer buddy or tutoring<br />
WR Lunch/afterschool work session<br />
Other:_________<br />
_<br />
DATE OF<br />
WRITING<br />
TYPE OF WRITING SCORE RUBRIC<br />
<br />
<br />
Goal 1:<br />
Goal 2:<br />
Small group work<br />
1:1 adult time<br />
CONTRACTS<br />
REPORT CARD GRADES<br />
Advisory 1 Advisory 2 Advisory 3 Advisory 4<br />
Week 1 2 3 4 5<br />
6<br />
% of Success<br />
Rate:<br />
Frequency of reinforcement:<br />
Reinforcers:
Duration:<br />
MATHEMATICS CURRICULUM‐BASED MEASUREMENTS AND<br />
ASSESSMENTS<br />
Documentation:<br />
Documentation:<br />
Work samples Report cards<br />
WORK HABITS<br />
Pre‐Assessment Date Score Work Habits Grade<br />
Teacher‐Created Assessment Dates<br />
Objectives assessed:<br />
Score<br />
Follows<br />
directions.<br />
Completes class<br />
work on time.<br />
Works well with<br />
others/cooperate<br />
s.<br />
Uses time wisely.<br />
Completes and<br />
returns<br />
homework.<br />
Participates in<br />
class discussion.<br />
Makes an effort.<br />
BASIC FACTS SCORE TIME GOAL ATTENDANCE AND OFFICE REFERRALS<br />
Addition<br />
# of Days of Instruction<br />
Subtraction<br />
Multiplication<br />
Division<br />
REPORT CARD GRADES<br />
Advisory 1 Advisory 2 Advisory 3 Advisory 4<br />
Office Referral<br />
Dates<br />
Dates of<br />
Conferences:<br />
Dates of Notes:<br />
# of Days Absent<br />
# of Days Tardy<br />
PARENT COMMUNICATION
PLC Goals at <strong>Anderson</strong><br />
<br />
<br />
Build a Culture of Collaboration<br />
Teachers will function as a team and work<br />
collaboratively to identify goals, gather relevant data,<br />
and learn from one another.<br />
Create a Shared Vision<br />
Staff will revisit our vision statement to describe the<br />
school we want to create.<br />
Staff will take ownership of the vision statement<br />
Staff development initiatives will be tied to the vision<br />
statement.
PLCs at <strong>Anderson</strong><br />
<br />
<br />
<br />
<br />
<br />
<br />
<br />
<br />
<br />
<br />
<br />
<br />
<br />
<br />
<br />
<br />
<br />
<br />
<br />
<br />
Committees (Choose your top three committees)<br />
-Math (Allison-Chair)<br />
-Reading/Writing (Cromwell-Chair)<br />
-Professional Development (Wooden-Chair)<br />
-Family and Youth Engagement (Wright-Chair)<br />
-Student Services (Jeffries/Bastian-Co-chairs)<br />
-Hospitality (Olvey-Chair)<br />
-Technology (Edgar-Chair)<br />
PD Schedule during the week<br />
Every Monday – Every Grade level plans collaboratively with the staff facilitator during planning<br />
Every Tuesday – Staff facilitator will prioritize time to spend with teachers to model, co-teach and<br />
provide real-time instructional support in the classroom<br />
Every Wednesday – Staff facilitator will examine student work samples from each grade level and<br />
provide feedback (e.g., a writing prompt accompanied with a rubric and student responses across<br />
grade levels)<br />
Every Thursday – staff facilitator summarizes any data both quantitative and qualitative for<br />
conferences or feedback given to teachers.<br />
(Note: If a holiday falls on a Monday, the scheduled PD will be moved to Tuesday)<br />
Faculty Meeting schedule<br />
1 st Monday – Grade-level Planning<br />
2 nd Monday – PLC Visioning<br />
3 rd Monday – Instructional Strategies<br />
4 th Monday – Committees/Grade-Level Exhibition<br />
(Note: If a holiday falls on a Monday, the scheduled faculty meeting will be moved to the<br />
following Tuesday)
SDT Daily Schedule at <strong>Anderson</strong><br />
7:30-7:40 Morning Duty-Gym<br />
7:40-8:10 Morning Duty- First floor<br />
8:10-11:35 Monday- Grade-level Team Meetings<br />
Tuesday- Modeling, co-teaching and providing real-time instructional support in the<br />
classroom<br />
Wednesday- examine student work samples from each grade level and provide<br />
feedback<br />
Thursday- Summarizes any data both quantitative and qualitative and schedules<br />
conferences to give feedback to teachers<br />
11:40-12:10 Lunch Duty- Cafeteria<br />
12:10-2:45 Monday- Grade-level Team Meetings<br />
Tuesday- Modeling, co-teaching and providing real-time instructional support in the<br />
classroom<br />
Wednesday- examine student work samples from each grade level and provide<br />
feedback<br />
Thursday- Summarizes any data both quantitative and qualitative and schedules<br />
conferences to give feedback to teachers<br />
2:45-3:10 Afternoon Duty- Gym<br />
(*9:00 - Monday leadership meeting with Mr. Moore)<br />
(*Fridays - SDT meeting at Fulton every Friday of the school year)<br />
Schedule subject to change based on unforeseen circumstances, individual teacher/grade level needs or whole school needs
PLCs at <strong>Anderson</strong><br />
Grade-level Weekly Planner<br />
Submitted every Friday by 2:00 P.M.<br />
Feedback provided to teams, as necessary, by<br />
Monday<br />
Team Leader Meetings BiWeekly<br />
Team Meeting Agendas/Minutes<br />
Weekly Articles and Staff Newsletter<br />
Individual Professional Development Plans<br />
Instructional Team Meetings
TLE at <strong>Anderson</strong><br />
Observations are scheduled with individual<br />
staff in advance<br />
All staff members must preconference with the<br />
principal<br />
All staff members are formerly observed for 30<br />
minutes<br />
All staff must have a post-conference with the<br />
principal<br />
All staff gets a copy of my observation notes to<br />
self assess their performance
WISE at <strong>Anderson</strong><br />
<br />
<br />
<br />
<br />
The WISE process involves using data to determine the immediate<br />
needs of the school and creating a plan of action in order to meet<br />
those needs.<br />
The <strong>Anderson</strong> WISE plan was created using OCCT data,<br />
Benchmark data, DIBELS, socio-economic data of our student body<br />
as well as enrollment and other various demographic data.<br />
The indicators listed within the WISE that relate to the immediate<br />
needs of <strong>Anderson</strong> were assessed, tasks were created and<br />
assigned to various teachers.<br />
Each teacher that is assigned to an indicator will create a small team<br />
to work with them to determine that the tasks are being completed or<br />
if tasks need to be edited to accomplish the goal of the indicator.<br />
Ideally, these teams will meet once a month to determine the<br />
progress being made. These meetings will be recorded on the<br />
planning worksheets provided by the WISE program.
WISE at <strong>Anderson</strong><br />
<br />
<br />
<br />
The process manager will then edit the WISE plan to reflect the<br />
information provided by each team. If a team determines that the<br />
indicator has been fully met and all tasks completed, they will begin<br />
collecting evidence of their findings and present to the staff.<br />
After each revision of the WISE plan the entire staff will be updated<br />
to the changes and made aware of their responsibilities in meeting<br />
the goals of the plan.<br />
The WISE plan is considered a work in progress. It is an ever<br />
changing document that directs the operation of the school in the<br />
areas of academics, student needs, teacher needs and overall<br />
achievement of <strong>Anderson</strong>. As the needs in these areas change, the<br />
WISE document will change.
WISE and the Budget<br />
School Improvement funds are being used to<br />
support the following items:<br />
Classroom Libraries<br />
After School Tutoring<br />
Reading Intervention Teacher<br />
Professional Development<br />
Parental Involvement and Literacy via our Parent<br />
Facilitator<br />
Math Manipulatives<br />
Instructional Consultant<br />
Supplemental Material<br />
Reading Intervention Program
A 3-Year Continuous<br />
School Improvement and<br />
Achievement Plan<br />
<strong>Anderson</strong> <strong>Elementary</strong> School<br />
<strong>Tulsa</strong> <strong>Public</strong> <strong>Schools</strong><br />
Brenda S. <strong>Anderson</strong>, Principal<br />
School Year 2008 - 2009<br />
Written and monitored by:<br />
Brenda <strong>Anderson</strong>, Principal<br />
Diahanne McClellan, Instructional Coach<br />
Nina Eccles, Early Childhood Lead Teacher<br />
Katherine Thompson, First Grade Lead Teacher<br />
Kelley Blakney, Fourth Grade Lead Teacher<br />
Lois Diggs, Fifth Grade Lead Teacher<br />
Kemba Wright, Parent<br />
<strong>Anderson</strong> <strong>Elementary</strong> SiPlan Page 1
TABLE OF CONTENTS<br />
1. INTRODUCTION / PROFILE<br />
1.1 DESCRIPTION OF THE SCHOOL ................................................. 3 - 5<br />
1.2 MISSION AND API / AYP STATUS / COORDINATION OF SERVICES .... 6 - 7<br />
1.3 IN SUPPORT OF TPS CORE GOALS .............................................. 8-9<br />
1.4 IN SUPPORT OF TPS BELIEFS ....................................................... 10<br />
1.5 NCLB COMPLIANCE ELEMENTS AND BUILDING RESPONSES ...... 11 - 12<br />
2. DATA SUMMARY AND<br />
DATA ANALYSIS RESULTING IN IDENTIFIED PRIORITIES<br />
STATISTICAL PROFILE OF THE SCHOOL ........................................ 13<br />
INDIVIDUAL GRADE LEVELS / CURRICULAR AREAS. ........... 14 - 20<br />
BUILDING-WIDE ATTENDANCE…………………………………………..21<br />
BUILDING-WIDE CLIMATE / BEHAVIOR……………………… .......... ….22<br />
3. BUILDING GOALS<br />
SPECIFIC GOALS TO BE ADDRESSED BY ACTION PLANS ..... …….23-26<br />
4. ACTION PLANS BY INDIVIDUAL GRADE LEVELS AND BUILDING<br />
4.1 LANGUAGE ARTS / ENGLISH BY GRADE LEVEL .......... … 27 - 43<br />
4.2 MATHEMATICS BY GRADE LEVEL…… .......................... ….44 - 58<br />
4.3 BUILDING-WIDE ATTENDANCE ................................................... 59<br />
4.4 BUILDING-WIDE CLIMATE / BEHAVIOR ...................................... 60<br />
5. THREE (3) YEAR TIME LINE<br />
FOR IMPLEMENTATION, REVIEW AND REVISION …… …....……. 61 - 62<br />
6. APPENDICES ....................................................................... 63 -66<br />
<strong>Anderson</strong> <strong>Elementary</strong> SiPlan Page 2
1. INTRODUCTION<br />
1.1 DESCRIPTION OF THE SCHOOL<br />
Section A: Who We Are and Who We Serve<br />
Marian <strong>Anderson</strong> <strong>Elementary</strong> is located in the north quadrant of <strong>Tulsa</strong>, Oklahoma. It is<br />
located in one of the most economically distressed areas of <strong>Tulsa</strong>. <strong>Anderson</strong> currently<br />
serves 320 predominantly African-American, economically deprived students in academic<br />
and enrichment programs in grades DD (developmentally delayed) through fifth. Since<br />
<strong>Anderson</strong> was once a junior high (middle) school, it enjoys luxuries most elementary<br />
schools do not: a swimming pool, auditorium, and two levels. Due to previously passed<br />
bonds, a new gym was built, the old gym was converted into a media center, and monies<br />
from the recently passed bond will further upgrade the facility, adding additional furniture,<br />
upgrading technology, and replacing textbooks.<br />
Section B: Programs and Achievements<br />
Programs in place include:<br />
• Reading First Literacy<br />
Coach<br />
• Eat, Exercise, Excel<br />
Program & Grant<br />
• Benchmark Unit<br />
Assessments<br />
Program<br />
• Instructional Coach • Big Brothers and<br />
Sisters<br />
• Promethean Boards in<br />
every classroom<br />
• Mentors, volunteers,<br />
adopters<br />
• Reading Mastery Plus<br />
Literacy Program<br />
• Waterford Early<br />
Literacy Program<br />
• Highly Qualified Reading<br />
Interventionists<br />
• Therapist and Case<br />
workers<br />
• Synergistic Missions<br />
Science Lab<br />
• <strong>Tulsa</strong> Library • Reading First Grant<br />
• Boy Scouts & Girl<br />
Scouts<br />
• Reading Sufficiency<br />
• PTA • R.I.F. book<br />
distribution<br />
• Attendance Counselor • Ameri-Corp • Monthly Award<br />
Celebration<br />
• Instrumental Band • Second Step<br />
Program<br />
• Tribes<br />
• Student Council • In School Connection • Masonic award – fifth<br />
grade<br />
• Safety Patrol • THD It’s All About<br />
Kids Program<br />
• Compass Learning<br />
<strong>Anderson</strong> <strong>Elementary</strong> SiPlan Page 3
Achievements in place include:<br />
• Discipline –There has been a steady<br />
decrease in suspensions and a significant<br />
reduction in acts of physical aggression /<br />
confrontations.<br />
• Professional Development – Staff has<br />
been engaged in ongoing reading & math<br />
to accommodate curricular advancement.<br />
• We were awarded a 3 year grant for our<br />
Eat, Exercise, Excel program<br />
• Increased parental attendance in parent<br />
conferencing, classroom visits, field trips,<br />
and volunteering.<br />
• Recognition – Quarterly awards,<br />
assemblies to recognize academic<br />
improvement, perfect attendance,<br />
citizenship, etc.<br />
District Awards to staff, students, teachers,<br />
volunteers<br />
Section C: Transitions<br />
To receive a new student / parent to <strong>Anderson</strong> the following activities and<br />
processes are in place:<br />
• The Principal personally greets the incoming family and stresses the “open door”<br />
policy that is in effect at the building.<br />
• The office staff welcomes the family and student.<br />
• Every new student is given a tour to assist the child and assure a receiving and<br />
welcome climate.<br />
• A caring environment (Tribes model) has been woven into the fabric of <strong>Anderson</strong>.<br />
• A uniform, beginning of the day, greeting procedure is in place and implemented<br />
by all teachers.<br />
Career Awareness / Orientation / Exploration activities include:<br />
• Implementation of a school wide plan to coordinate career awareness and<br />
opportunity.<br />
• Career day sponsored by classrooms.<br />
• National “Bring your Child to Work” day.<br />
• School Partners in Education will present at a Career Fair<br />
Preparation for vertical articulation includes:<br />
• Middle school teachers and counselors visit <strong>Anderson</strong>’s 5 th grade classrooms to<br />
generate interest and share schedule options / courses.<br />
• Teachers will meet with preceding grade levels as per our Area 1/McLain Cluster<br />
Pattern plan for vertical articulation.<br />
• Information provided for alternative middle schools in TPS.<br />
• Open house information (provided by the middle schools) is distributed to all<br />
current 5 th grade parents.<br />
<strong>Anderson</strong> <strong>Elementary</strong> SiPlan Page 4
Section D: Challenges<br />
The school supports a community seriously impacted by economic discord and social<br />
crisis. Gangs, drugs, and random violence directly influence and permeate the<br />
experiences of many of our children. The student population is greatly affected by the<br />
problems arising out of chronic and generational poverty, hostile urban environments,<br />
parental neglect and abuse, hunger and distrust. Many of our children display the<br />
negative effects of their family and neighborhood existence with poor impulse control,<br />
cognitive dysfunction and poor to failing language processing. The number of <strong>Anderson</strong><br />
students receiving free and/or reduced lunches is over 90%. Classroom management<br />
and behavior problems, as well as cognitive delays, absenteeism, and chronic tardiness<br />
are indicative of the multiple challenges that are encountered on a daily basis. The<br />
<strong>Anderson</strong> staff does not view the above as insurmountable challenges; rather, they are<br />
viewed as opportunities to be addressed where and when possible through the collective<br />
efforts, energies, and talents of this staff.<br />
Balance of this page is blank.<br />
<strong>Anderson</strong> <strong>Elementary</strong> SiPlan Page 5
1. INTRODUCTION<br />
1.2 MISSION, API / AYP STATUS AND COORDINATION OF SERVICES<br />
The MISSION of <strong>Anderson</strong> <strong>Elementary</strong> School is to provide a quality educational<br />
experience for every student, every day, without exception.<br />
To achieve our MISSION we are guided by the following PRINCIPLES…<br />
• Everyone can and will learn.<br />
• High expectations yield high results.<br />
• Quality learning experiences require:<br />
• An effective teacher in every classroom;<br />
• An effective principal in every school;<br />
• A challenging curriculum;<br />
• Adequate resources;<br />
• Continuous improvement in every classroom, office and department;<br />
• Shared accountability among students, teachers, administrators, staff, parents<br />
and community;<br />
• A safe, secure, non-threatening, comfortable environment.<br />
• Families and communities are essential partners in the education process.<br />
• Every employee is personally responsible to model ethical behavior, exhibit a<br />
strong work ethic and to achieve high performance.<br />
• Every individual has dignity and worth.<br />
• A diverse community of learning requires a variety of educational opportunities.<br />
• All plans and decisions at <strong>Anderson</strong> will give students experiences to succeed in<br />
school and in life.<br />
Students will be challenged and inspired by <strong>Anderson</strong> educators and staff and actively<br />
supported by parents and other adults.<br />
<strong>Anderson</strong> will equip students with the academic skills, work habits and love for learning<br />
that are critical for success.<br />
<strong>Anderson</strong> will engage students, parents, staff and the community to pursue excellence<br />
through shared decision-making.<br />
API / AYP STATUSAPI numeric status reporting for <strong>Anderson</strong> is as follows:<br />
Year<br />
Math –All<br />
Students<br />
State Math<br />
Target<br />
AYP?<br />
Yes, No<br />
or SH<br />
Reading – All<br />
Students<br />
State<br />
Reading<br />
Target<br />
AYP?<br />
Yes, No or<br />
SH<br />
2005-2006 534 790 SH 437 768 SH<br />
2006-2007 927 932 SH 1136 914 YES<br />
2007-2008 307 932 No 804 914 CI<br />
Attendance statistics are:<br />
Year Attendance Rate Target Rate<br />
2005 – 2006<br />
91.3 ( 676 )<br />
91.2 ( 664)<br />
2006 – 2007<br />
93.5 ( 940)<br />
91.2 ( 664 )<br />
2007 – 2008 95.2 (1144) 91.2 (664)<br />
<strong>Anderson</strong> <strong>Elementary</strong> SiPlan Page 6
1. INTRODUCTION<br />
1.2 MISSION, API / AYP STATUS AND COORDINATION OF<br />
SERVICES<br />
COORDINATION OF SERVICES<br />
<strong>Anderson</strong> <strong>Elementary</strong> has embedded (integrated and coordinated) the components<br />
of Title I and other entitlement programs within the spirit, intent and direction of this<br />
SIPlan as evidenced below and within the Action Plans (Chapter 4) that follow:<br />
Program Status Reporting<br />
Title I, Part A<br />
Title IV A - Safe<br />
and Drug Free<br />
School<br />
Principal /<br />
Teacher Training<br />
Teacher Training<br />
Eat, Exercise,<br />
Excel Program<br />
Reading<br />
Sufficiency<br />
Grant<br />
Community<br />
Programs<br />
School Partners<br />
Big Brothers/Big<br />
Sisters<br />
Reading First<br />
Program<br />
After-School<br />
Programs<br />
See attached Appendix A -- Budget justification page.<br />
Second Step Counseling Program and district-wide<br />
Red Ribbon week, promoting drug-free lifestyles.<br />
Reading Academy ( Helping educators build skills for teaching every<br />
child to read) 4 day training in June; Professional Development with<br />
Educational Consulting Services/Kim Collier throughout the year<br />
Reading Academy ( Voyager U ); Ongoing District PD<br />
Comprehension school health program coordinated with the State<br />
Department of Education in Kansas. Components of program include:<br />
30 minutes a day of “structured activity” time in place of traditional<br />
recess; water bottles in the classroom for increased hydration; lunch<br />
in the classroom with the teacher to promote community and nutrition;<br />
increased PE time; a daily multi-vitamin given to students with parent<br />
permission. Goals of the program include: increased activity that<br />
limits opportunities for bullying and fighting; increased academic<br />
learning time because of decreased behavior issues in the classroom;<br />
less food waste and more focus on healthy nutrition.<br />
Reading sufficiency funding is used to provide direct reading<br />
instruction to primary students performing below grade level in small<br />
group settings on a pull-out basis. Family Literacy Night on a monthly<br />
basis provides strategies for families to develop and participate in<br />
reading activities.<br />
Boy Scouts, Girl Scouts, In-School Connection, GREAT Program<br />
through <strong>Tulsa</strong> Police Department<br />
Oral Roberts University, 320 Boston Management, Inc., <strong>Tulsa</strong><br />
Running Club, <strong>Tulsa</strong> 66ers, Christ Temple Church, Crossover Bible<br />
Church, Northside Homes Mission, Boy Scouts of America, St.<br />
Francis Hospital South<br />
Matching volunteer mentors with students.<br />
Develops competent readers through the use of quality explicit<br />
reading instruction, continuous monitoring of student growth, and<br />
early interventions in the areas of reading difficulties. The program is<br />
implemented as our core-reading program.<br />
A series of staff-initiated after-school programs, focusing on reading<br />
and mathematics skill areas, offered throughout the school year.<br />
<strong>Anderson</strong> <strong>Elementary</strong> SiPlan Page 7
1. INTRODUCTION<br />
1.3 IN SUPPORT OF TPS CORE GOALS<br />
TPS Core Goals<br />
I. Student Learning &<br />
Performance<br />
By 2010, each student will meet or<br />
exceed state and national<br />
standards by demonstrating<br />
mastery of an individualized and<br />
challenging comprehensive<br />
curriculum.<br />
II. Efficient & Effective<br />
Operations<br />
By 2010, each <strong>Tulsa</strong> <strong>Public</strong> School<br />
division, department and office will<br />
meet or exceed all generally<br />
accepted standards of<br />
performance effectiveness.<br />
III. Parent/Guardian &<br />
Community Involvement<br />
By 2010, each school community<br />
will demonstrate exceptional<br />
parent/guardian involvement and<br />
support through 100%<br />
membership in its respective<br />
parent/guardian association, and<br />
the district will triple its Partners-in-<br />
Education agreements with<br />
community, businesses,<br />
institutions, organizations and<br />
agencies.<br />
IV. Faculty & Staff Focus<br />
By 2010, all employees will be<br />
highly qualified in their positions<br />
and CHOOSE to remain with TPS.<br />
V. Quality Performance<br />
By 2010, <strong>Tulsa</strong> <strong>Public</strong> <strong>Schools</strong> will<br />
win the Malcolm Baldrige National<br />
Quality Award.<br />
<strong>Anderson</strong>’s Complementary Actions<br />
Teachers will work with coaches and tutors to<br />
continue using best practices and researchbased<br />
programs, as well as ongoing<br />
assessments to challenge students to meet or<br />
exceed national standards by 2010.<br />
<strong>Anderson</strong> has procedures and inventory controls<br />
in each area of school function to achieve<br />
performance effectiveness.<br />
<strong>Anderson</strong> <strong>Elementary</strong> has hired a Parent<br />
Facilitator for the 2005 -2006 school year. We<br />
are also establishing a working PTA.<br />
School-wide<br />
• Outdoor marquee sign<br />
• Written notices (in Spanish & English<br />
when available)<br />
• Announcements at Special Events and<br />
Parent Meetings<br />
Classroom<br />
• Conversations with parents<br />
• Written notices<br />
After-school opportunities<br />
• Back to school night<br />
• Fall carnival<br />
• Parent Teacher conferences<br />
• Health / nutrition<br />
During school opportunities<br />
• Grade level parent meetings<br />
• Classroom celebrations<br />
• Field Trip Sponsorships<br />
All <strong>Anderson</strong> <strong>Elementary</strong> School staff members<br />
are highly qualified, and most choose to remain<br />
at <strong>Anderson</strong> and with <strong>Tulsa</strong> <strong>Public</strong> <strong>Schools</strong>.<br />
<strong>Anderson</strong> <strong>Elementary</strong> school staff will actively<br />
engage in all quality performance initiation.<br />
<strong>Anderson</strong> <strong>Elementary</strong> SiPlan Page 8
TPS Core Goals<br />
IV. Faculty & Staff Focus<br />
By 2010, all employees will be<br />
highly qualified in their positions<br />
and CHOOSE to remain with<br />
TPS.<br />
<strong>Anderson</strong>’s Complementary Actions<br />
<strong>Anderson</strong> <strong>Elementary</strong> is committed to the<br />
professional growth and development of each new<br />
staff member. When a new staff member arrives<br />
he/she is immediately interviewed by the Principal<br />
and the Principal “pairs” the new staff member with<br />
a compatible, resource-rich and experienced<br />
colleague. The senior staff member mentors the<br />
new staff member and is charged with the<br />
responsibilities of “linking” experiences with the<br />
needs of the mentee. At grade level / curricular<br />
level meetings entire teams provide a network of<br />
support, encouragement and resources for each<br />
new staff member.<br />
The SIPlan process serves as the foundational<br />
blueprint in the development of the new staff<br />
member’s understanding of the instructional /<br />
curricular directions of the building. Inherent in the<br />
mentor / mentee relationship is a philosophy of twoway<br />
communication and sharing of ideas. New staff<br />
members are encouraged and promoted to offer<br />
suggestion, direction and focus to all activities of<br />
the school. They are also encouraged to provide<br />
on-site and off-site opportunities to increase the<br />
experiential base of the new staff member alternate<br />
scheduling processes that are in place, e.g.,<br />
providing substitute cover, shadowing another staff<br />
member, teaming opportunity, participation in small<br />
learning communities on focused topics and visiting<br />
alternate sites to view programs and approaches.<br />
Close partnerships exist between the school and<br />
local, regional and state-wide centers of higher<br />
learning. Each partner provides all staff members,<br />
new and seasoned, with opportunities for<br />
coursework, collaboration and other venues of<br />
collegial decision-making.<br />
<strong>Tulsa</strong> <strong>Public</strong> <strong>Schools</strong> has a Professional<br />
Development Program that promotes professional<br />
competence of all certified, licensed and support<br />
personnel. The District will offer and all certified<br />
employees will participate in professional<br />
development for all topics as may be required by<br />
law. Whether or not required by law, the District<br />
will offer and all certificated employees will<br />
participate in training that includes the following<br />
topics: classroom management and student<br />
discipline strategies, outreach to parents, diversity<br />
and multicultural education and other components<br />
as required for school improvement.<br />
<strong>Anderson</strong> <strong>Elementary</strong> SiPlan Page 9
1. INTRODUCTION<br />
TPS Beliefs<br />
1.4 IN SUPPORT OF TPS BELIEFS<br />
<strong>Anderson</strong>’s Complementary Actions<br />
A. Everyone Can & Will Learn<br />
• Highly qualified faculty and staff<br />
• Certified interventionist<br />
• Research –Based Best Practices<br />
B. High Expectations Yield High Results • Satisfactory / above for each student on OCCT<br />
by 2110<br />
• Data driven instruction<br />
• P.A.S.S curriculum base<br />
C. Effective Teachers in Every Classroom • Professional Development<br />
• Deploy strategies learned from research based<br />
best practice.<br />
D. Effective Principals in Every School • Professional Development<br />
• High Expectations<br />
E. Safe, Secure, Non-Threatening<br />
Environments<br />
• <strong>Tulsa</strong> Model for Learning Environment<br />
• Lifeskills<br />
• Operation Aware<br />
F. Individual Dignity & Worth • Lifeskills<br />
• Mentoring<br />
• Counseling Services<br />
G. Challenging Curriculum • Minimum time Math / Reading Blocks<br />
• P.A.S.S based curriculum<br />
• Fine Arts / P.E. enrichment<br />
• Data-driven instruction<br />
H. Adequate Resources • Title I<br />
• Reading First Grant<br />
• Partners in Education<br />
I. Continuous Improvement • Professional Development<br />
• Data-driven instruction<br />
• Reading First<br />
• Benchmark Unit Assessments<br />
J. Shared Accountability • Principal; coaches ;teachers; interventionists<br />
• Parent participation<br />
• Students<br />
K. Families / Communities as Partners • Oral Roberts University,<br />
• 320 Boston Management, Inc.<br />
• <strong>Tulsa</strong> Running Club<br />
• <strong>Tulsa</strong> 66ers<br />
• Christ Temple Church<br />
• Crossover Bible Church<br />
• Northside Homes Mission<br />
• Boy Scouts of America<br />
• Pocket Full of Hope, Inc.<br />
• St. Francis Hospital South<br />
L. Variety of Educational Opportunities • Fine Arts<br />
• P.E<br />
• Health Education<br />
• Media Center<br />
• Promethean Board in every classroom<br />
<strong>Anderson</strong> <strong>Elementary</strong> SiPlan Page 10
1. INTRODUCTION<br />
1.5 NCLB COMPLIANCE ELEMENTS AND BUILDING RESPONSES<br />
NCLB Compliance Elements<br />
1. Using research-based strategies that<br />
address the academic issues that<br />
caused the school to be identified<br />
<strong>Anderson</strong>’s Response<br />
Academic Improvement:<br />
• Data driven, PASS –based<br />
curriculum<br />
• Benchmark Unit Assessments<br />
• Reading Mastery Plus K-5 th<br />
• Certified Interventionist<br />
Attendance:<br />
• Incentives for 100% attendance<br />
• quarterly, semester, end of year<br />
2. Adopting “Best Practices” Weekly team meetings - literacy<br />
/math/instructional facilitator/principal<br />
Literacy/Math Coaching-school-wide<br />
Site Delivered Training – data desegregation<br />
and literacy / math curriculum use<br />
3. Meeting professional<br />
development needs<br />
4. Using professional development<br />
funds effectively<br />
Literacy & Math<br />
10 days devoted to professional<br />
development in these areas<br />
Peer Coaching<br />
Weekly meetings centered<br />
on data and student proficiency<br />
Instructional Improvement<br />
Professional development funds<br />
provide for school-wide<br />
instructional improvement<br />
Data Disaggregation and Use<br />
On-going data desegregation<br />
support is provided throughout the<br />
year with ECS, Benchmark Unit Assessments<br />
and<br />
District consultants.<br />
5. Setting annual goals Academic: All students will develop<br />
language arts and math skills needed<br />
to be successful as determined by<br />
State and district assessment.<br />
Attendance: 96% of students will attend<br />
school daily.<br />
Climate/Behavior: Students and staff<br />
will embrace the 7 Community<br />
Guidelines and Life Skills as part of<br />
their daily interactions.<br />
<strong>Anderson</strong> <strong>Elementary</strong> SiPlan Page 11
NCLB Compliance Elements<br />
(continued)<br />
<strong>Anderson</strong>’s Response<br />
(continued)<br />
6. Outlining parent notices School-wide<br />
• Outdoor marquee sign<br />
• Written notices (in Spanish & English<br />
when available)<br />
• Announcements at Special Events and<br />
Parent Meetings<br />
• Parent Facilitators<br />
Classroom<br />
• Conversations with parents<br />
• Written notices<br />
• Newsletters<br />
7. Assigning responsibilities Administration creates ownership for student<br />
success with teachers and parents supported<br />
and assisted by district and guided by the state.<br />
8. Increasing parent involvement After-school opportunities<br />
• Back to school night<br />
• Fall carnival<br />
• Parent Teacher conferences<br />
• Health / nutrition<br />
• Invitations to assemblies<br />
• Monthly PCAC meetings<br />
• Annual Red & White Ball<br />
• <strong>Anderson</strong> Idol Talent Show<br />
• After-school exercise & swim classes<br />
During school opportunities<br />
• Grade level parent meetings<br />
• Classroom celebrations<br />
• Field Trip Sponsorships<br />
9. Increasing instructional time • Traditional recess has been replaced<br />
with 30 minutes daily of Healthy Activity<br />
Time (HAT) to insure students are more<br />
focused and attentive during academic<br />
learning time.<br />
10. Setting up teacher mentoring Literacy and Instructional coaches continue to<br />
develop peer coaching designs for planning,<br />
assessing and driving instruction to equip<br />
students for success.<br />
<strong>Anderson</strong> <strong>Elementary</strong> SiPlan Page 12
2. PROFILE/DATA SUMMARY AND DATA ANALYSIS<br />
resulting in IDENTIFIED PRIORITIES with DATA DISPLAYS<br />
<strong>Anderson</strong><br />
Our faculty and staff are committed to ensuring every student<br />
receives a quality education, every day, without exception.<br />
Students are encouraged to soar to the highest of heights, despite<br />
any and all obstacles. Our goal is to be recognized as the elite<br />
elementary school program in the <strong>Tulsa</strong> <strong>Public</strong> <strong>Schools</strong> district.<br />
Brenda <strong>Anderson</strong>, Principal<br />
1921 East 29 Street North<br />
<strong>Tulsa</strong> Oklahoma<br />
918-925-1300<br />
School colors black and gold<br />
www.tulsaschools.org/schools/anderson<br />
Staff Information<br />
Advanced degrees<br />
Doctorate 1<br />
Masters 7<br />
Bachelor 20<br />
National Board Certified 0<br />
Experienced (11+ years) 10<br />
Highly Qualified 100%<br />
Attendance 96.3%<br />
Minority 15<br />
Gender<br />
Female 26<br />
Male 2<br />
Student Teacher Ratio 13 to 1<br />
Classes with 30 or more students 0<br />
(Start time –7:55 End time – 2:45)<br />
Student Information<br />
American Indian 5.3%<br />
Asian 1.3%<br />
African American 83.2%<br />
Hispanic 4.3%<br />
Caucasian 5.6%<br />
Students on IEP 13.0%<br />
Students with free lunch 98.2%<br />
Attendance 95.2%<br />
Total Students (October 1, 2007) 299<br />
Adequate Yearly Progress? No.<br />
Area needing improvement: Math-Reg. Ed.,<br />
Math- All, Math-Black, Math-Econ. Disadv.<br />
Curriculum<br />
East, Exercise, Excel Program<br />
Full Day 4 year old program<br />
Full Day Kindergarten<br />
Reading First School<br />
Waterford Early Learning System<br />
Compass Learning System<br />
Handwriting without Tears<br />
Instrumental Music<br />
PE<br />
Art and Music<br />
Computer Lab<br />
Synergistic Missions Science<br />
Modules<br />
State-of-the-Art Science Lab<br />
Science Specialist<br />
Activities<br />
Student Council<br />
Breakfast in a Bag Program<br />
Lunch in the Classroom<br />
Scouts<br />
Sports<br />
Safety Patrol<br />
Tutoring<br />
Daily Structured Activity<br />
Big Brother/Big Sisters Program<br />
In School Connection<br />
Operation Aware<br />
Swimming Pool<br />
Hop Sports Program<br />
<strong>Anderson</strong> <strong>Elementary</strong> SiPlan Page 13
Pre K Grade<br />
Data Analysis Resulting in the Following Identified Priorities<br />
Early Childhood<br />
The Early Childhood staff at <strong>Anderson</strong> <strong>Elementary</strong> utilizes ongoing assessment<br />
procedures to implement the following assessment tools.<br />
1. <strong>Tulsa</strong> <strong>Public</strong> <strong>Schools</strong> Skills Pre-Kindergarten Growth Inventory<br />
2. KAT/PAT Readiness Assessments<br />
3. Teacher observations of daily participation/work and flexible group work will<br />
give an informal view of student development.<br />
4. Teacher-made tests will be administered as needed.<br />
Based upon these tools in conjunction with teacher-made tests, observations and student<br />
work product portfolios, goals for instructional emphasis are:<br />
In Reading:<br />
• Speaking/Uses language for a variety of purposes 2.1 (07-08)<br />
• Speaking/Uses sentences of increasing length 2.3 (07-08)<br />
• Vocabulary/Shows a steady increase in listening and speaking vocabulary 5.1<br />
(06-07 & 07-08))<br />
In Mathematics:<br />
• Number Sense/Counts Objects in a Set 2.4 (07-08)<br />
• Number Sense/Numeral Identification 2.6 (07-08)<br />
• Patterns/Sorts and groups objects into a set 1.1 (06-07 & 07-08)<br />
Ongoing assessments in conjunction with teacher-made tests, teacher observation and<br />
analysis of assessment result in reading goals in areas of language development,<br />
vocabulary, and listening comprehension. Emphases in mathematics are creation of sets<br />
and counting numerals.<br />
*The staff at <strong>Anderson</strong> <strong>Elementary</strong> has analyzed the data and come to the conclusion<br />
that students in each subgroup not achieving AYP, which include Regular Ed, African<br />
American Males, and Economically Disadvantaged students, have the same identified<br />
objective needs; therefore, we will be utilizing the same strategies to increase student<br />
performance.<br />
We have also analyzed the data and have concluded there to be no significant<br />
discrepancy based on performance of specific gender.<br />
<strong>Anderson</strong> <strong>Elementary</strong> SiPlan Page 14
Kindergarten Grade<br />
Data Analysis Resulting in the Following Identified Priorities<br />
Kindergarten<br />
The Kindergarten staff of <strong>Anderson</strong> <strong>Elementary</strong> utilizes ongoing assessment procedures<br />
to implement the following assessment tools:<br />
1. DIBELS Assessment<br />
2. SRA Assessment<br />
3. KAT/PAT Kindergarten Inventory<br />
(Goals for reading / math remain the same)<br />
4. Teacher observations of daily participation/work and flexible group work will<br />
give an informal view of student development.<br />
5. Teacher-made tests will be administered as needed.<br />
Bases upon teacher observation and professional judgment in conjunction with current<br />
student performance, goals for instructional emphasis are:<br />
In Reading:<br />
• Phonics/Decoding/Identifies the alphabet by name 3.1b<br />
• Vocabulary/Uses new vocabulary and language in own speech 4.1<br />
(07-08)<br />
• Vocabulary/Uses new vocabulary and language in own writing 4.2<br />
(07-08)<br />
In Mathematics:<br />
• Patterns/Sort and group objects 1.1 (06-07 & 07-08)<br />
• Number Sense/Count forward to twenty and backward from ten 2.3<br />
(06-07 & 07-08)<br />
• Number Sense/Identify and create sets of objects zero through ten 2.5<br />
(06-07 & 07-08)<br />
Ongoing assessments in conjunction with teacher-made tests, teacher observation and<br />
analysis of assessment result in instructional goals in areas of writing, listening, and<br />
retelling for comprehension. Emphasis in math will focus on number sense, numeral<br />
recognition, and counting sets.<br />
*The staff at <strong>Anderson</strong> <strong>Elementary</strong> has analyzed the data and come to the conclusion<br />
that students in each subgroup not achieving AYP, which include Regular Ed, African<br />
American Males, and Economically Disadvantaged students, have the same identified<br />
objective needs; therefore, we will be utilizing the same strategies to increase student<br />
performance.<br />
We have also analyzed the data and have concluded there to be no significant<br />
discrepancy based on performance of specific gender.<br />
<strong>Anderson</strong> <strong>Elementary</strong> SiPlan Page 15
1 st Grade<br />
Data Analysis Resulting in the Following Identified Priorities<br />
The first grade staff at <strong>Anderson</strong> <strong>Elementary</strong> School utilizes ongoing assessment<br />
procedures to implement the following assessment tools.<br />
1. DIBELS Assessment<br />
2. Reading Mastery Plus Assessment<br />
3. Benchmark Unit Assessments Assessment<br />
6. Teacher observations of daily participation/work and flexible group work will<br />
give an informal view of student development.<br />
7. Teacher-made tests will be administered as needed.<br />
8. IOWA Test of Basic Skills<br />
Based upon these tools in conjunction with teacher-made tests, observations and student<br />
portfolios, goals for instructional emphasis are:<br />
In Reading:<br />
• Print Awareness/Recognize the difference among letters, words, and<br />
sentences 1.3 (07-08)<br />
• Phonological/Phonemic Awareness/Add or delete a phoneme change to<br />
a word 2.6 (07-08)<br />
• Vocabulary/Increase Personal Vocabulary 4.1<br />
• Vocabulary/Use new vocabulary and language 4.3<br />
• Comprehension/Critical Literacy/Literal Understanding 6.1 (07-08)<br />
In Mathematics:<br />
• Patterns/Describe, extend and create patterns 1.1 (07-08)<br />
• Number Sense/Compare and order objects 2.2 (07-08)<br />
• Number Operations and Computation/Develop/apply the concepts of<br />
addition and subtraction 3.1 (06-07 & 07-08)<br />
• Number Sense/Read and write numerals to 100 using verbal, kinesthetic,<br />
and written skills 2.3<br />
Ongoing assessments in conjunction with teacher-made tests, teacher observation and<br />
analysis of assessment result in instructional goals in areas of vocabulary<br />
comprehension, retelling, and sequencing. Emphasis in mathematics is set creation,<br />
addition and subtraction, time and money.<br />
*The staff at <strong>Anderson</strong> <strong>Elementary</strong> has analyzed the data and come to the conclusion<br />
that students in each subgroup not achieving AYP, which include Regular Ed, African<br />
American Males, and Economically Disadvantaged students, have the same identified<br />
objective needs; therefore, we will be utilizing the same strategies to increase student<br />
performance.<br />
We have also analyzed the data and have concluded there to be no significant<br />
discrepancy based on performance of specific gender.<br />
<strong>Anderson</strong> <strong>Elementary</strong> SiPlan Page 16
2nd Grade<br />
Data Analysis Resulting in the Following Identified Priorities<br />
The second grade staff at <strong>Anderson</strong> <strong>Elementary</strong> School utilizes ongoing assessment<br />
procedures to implement the following assessment tools.<br />
1. DIBELS Assessment<br />
2. SRA Assessment<br />
3. IOWA Test of Basic Skills<br />
4. Teacher observations of daily participation/work and flexible group work will<br />
give an informal view of student development.<br />
5. Teacher-made tests will be administered as needed.<br />
6. Benchmark assessments twice per year<br />
7. Saxon Math assessments<br />
Based upon these tools in conjunction with teacher-made tests, observations and student<br />
portfolios, goals for instructional emphasis are:<br />
In Reading:<br />
• Phonics/Decoding/Phonetic Analysis 2.1 (06-07 & 07-08)<br />
• Vocabulary/Words in Context 3.1 (07-08)<br />
• Fluency 4.0 (07-08)<br />
• Comprehension/Critical Literacy/Literal Understanding 5.1<br />
In Mathematics:<br />
• Number Operations and Computation/Develop/apply the concepts of<br />
addition and subtraction 3.1 (07-08)<br />
• Geometry and Measurement/Measurement 4.2a (07-08)<br />
• Geometry and Measurement/Time and Money 4.3 (07-08)<br />
• Number Sense/Place Value 2.1<br />
Ongoing assessments in conjunction with teacher-made tests, teacher observation and<br />
analysis of assessment result in instructional goals in the areas of phonics and<br />
comprehension. In math the instructional goals focus in the areas of geometry and<br />
measurement and data analysis.<br />
*The staff at <strong>Anderson</strong> <strong>Elementary</strong> has analyzed the data and come to the conclusion<br />
that students in each subgroup not achieving AYP, which include Regular Ed, African<br />
American Males, and Economically Disadvantaged students, have the same identified<br />
objective needs; therefore, we will be utilizing the same strategies to increase student<br />
performance.<br />
We have also analyzed the data and have concluded there to be no significant<br />
discrepancy based on performance of specific gender.<br />
<strong>Anderson</strong> <strong>Elementary</strong> SiPlan Page 17
3 rd Grade<br />
Data Analysis Resulting in the Following Identified Priorities<br />
The third grade staff at <strong>Anderson</strong> <strong>Elementary</strong> School utilizes ongoing assessment<br />
procedures to implement the following assessment tools.<br />
1. DIBELS Assessment<br />
2. SRA Assessment<br />
3. IOWA Test of Basic Skills<br />
4. Growing With Math Assessments<br />
5. Oklahoma Core Curriculum Tests<br />
6. Benchmark Unit Assessments<br />
7. Teacher observations of daily participation/work and flexible group work will<br />
give an informal view of student development.<br />
8. Teacher-made tests will be administered as needed.<br />
9. Saxon Math assessments<br />
Based upon these tools in conjunction with teacher-made tests, observations and student<br />
portfolios, goals for instructional emphasis are:<br />
In Reading:<br />
• Comprehension/Summary and generalization 4.3 (06-07 & 07-08)<br />
• Literature/Figurative Language and Sound Devices 5.3<br />
• Research and Information/Accessing Information 6.1<br />
In Mathematics:<br />
• Number Sense 2.0<br />
• Number Operations and Computation/Estimation 3.1 (06-07 & 07-08)<br />
• Number Operations & Computation/Multiplication 3.2 (07-08)<br />
• Number Operations & Computation/Money Problems 3.3 (06-07 & 07-08)<br />
• Geometry and Measurement/Measurement 4.2 (07-08)<br />
• Data Analysis & Probability 5.0<br />
Ongoing assessments in conjunction with teacher-made tests, teacher observation and<br />
analysis of assessment result in instructional goals in areas of vocabulary,<br />
comprehensive/fluency and writing composition. Emphasis in mathematics is geometry<br />
and measurement, estimation, number sense, fractions, decimals and problem solving.<br />
*The staff at <strong>Anderson</strong> <strong>Elementary</strong> has analyzed the data and come to the conclusion<br />
that students in each subgroup not achieving AYP, which include Regular Ed, African<br />
American Males, and Economically Disadvantaged students, have the same identified<br />
objective needs; therefore, we will be utilizing the same strategies to increase student<br />
performance.<br />
We have also analyzed the data and have concluded there to be no significant<br />
discrepancy based on performance of specific gender.<br />
<strong>Anderson</strong> <strong>Elementary</strong> SiPlan Page 18
4 th Grade<br />
Data Analysis Resulting in the Following Identified Priorities<br />
The fourth grade staff at <strong>Anderson</strong> <strong>Elementary</strong> School utilizes ongoing assessment<br />
procedures to implement the following assessment tools.<br />
1. Scott Foresman Assessments (Weekly Selection/Unit Tests)<br />
2. Oklahoma Core Curriculum Tests<br />
3. Benchmark Unit Assessments Benchmark Testing<br />
4. Teacher observations of daily participation/work and flexible group work will<br />
give an informal view of student development.<br />
5. Teacher-made tests will be administered as needed.<br />
Based upon these tools in conjunction with teacher-made tests, observations and student<br />
portfolios, goals for instructional emphasis are:<br />
In Reading:<br />
• Comprehension/Critical Literacy 3.0<br />
• Literature 4.0<br />
• Research and Information 5.0<br />
In Mathematics:<br />
• Number Operations & Computation 3.0<br />
• Number Sense/Multiplication 3.1<br />
(06-07 & 07-08)<br />
• Geometry & Measurement/Measurement 4.4<br />
Ongoing assessments in conjunction with teacher-made tests, teacher observation and<br />
analysis of assessment result in instructional goals in the areas of subject, direct object<br />
and summary writing based upon the main ideas. In mathematics, emphasis is in<br />
multiplications, fractions and decimals on number line, estimation and equivalent and<br />
non- equivalent fraction parts.<br />
*The staff at <strong>Anderson</strong> <strong>Elementary</strong> has analyzed the data and come to the conclusion<br />
that students in each subgroup not achieving AYP, which include Regular Ed, African<br />
American Males, and Economically Disadvantaged students, have the same identified<br />
objective needs; therefore, we will be utilizing the same strategies to increase student<br />
performance.<br />
We have also analyzed the data and have concluded there to be no significant<br />
discrepancy based on performance of specific gender.<br />
<strong>Anderson</strong> <strong>Elementary</strong> SiPlan Page 19
5 th Grade<br />
Data Analysis Resulting in the Following Identified Priorities<br />
The fifth grade staff at <strong>Anderson</strong> <strong>Elementary</strong> School utilizes ongoing assessment<br />
procedures to implement the following assessment tools.<br />
1. SRA Assessment<br />
2. Saxon Math Assessments<br />
3. Oklahoma Core Curriculum Tests<br />
4. Benchmark Unit Assessments Benchmark Testing<br />
5. Teacher observations of daily participation/work and flexible group work will<br />
give an informal view of student development.<br />
6. Teacher-made tests will be administered as needed.<br />
Based upon these tools in conjunction with teacher-made tests, observations and student<br />
portfolios, goals for instructional emphasis are:<br />
In Reading:<br />
• Vocabulary/Words in Context 1.1 (07 – 08)<br />
• Vocabulary/Synonyms, Antonyms, Homonyms 1.3<br />
• Comprehension/Critical Literacy/Inferences and Interpretation 3.2<br />
In Mathematics:<br />
• Number Sense/Fractions/Decimals/Percent 2.1 (07 – 08)<br />
• Geometry and Measurement/Convert Measurements 4.5<br />
• Geometry and Measurement/Perimeter/Area 4.2<br />
Ongoing assessments in conjunction with teacher-made tests, teacher observation and<br />
analysis of assessment result in instructional goals in the areas of comprehension,<br />
literature, analysis, and figurative language. In math instructional goals will focus on<br />
algebraic reasoning along with data analysis and probability.<br />
*The staff at <strong>Anderson</strong> <strong>Elementary</strong> has analyzed the data and come to the conclusion<br />
that students in each subgroup not achieving AYP, which include Regular Ed, African<br />
American Males, and Economically Disadvantaged students, have the same identified<br />
objective needs; therefore, we will be utilizing the same strategies to increase student<br />
performance.<br />
We have also analyzed the data and have concluded there to be no significant<br />
discrepancy based on performance of specific gender.<br />
<strong>Anderson</strong> <strong>Elementary</strong> SiPlan Page 20
Building-Wide Attendance<br />
Data Analysis Resulting in the Following Identified Priorities<br />
The staff at <strong>Anderson</strong> utilizes ongoing assessment procedures to implement the following<br />
assessment tools.<br />
1. Daily Attendance Reports<br />
2. Absentee phone call<br />
3. Quarterly report cards to document absences<br />
4. Monthly attendance incentives<br />
Based upon these tools the goal for increased student attendance is that 96% of the<br />
students will be present daily.<br />
<strong>Anderson</strong> <strong>Elementary</strong> SiPlan Page 21
Building-Wide Climate/Behavior<br />
Data Analysis Resulting in the Following Identified Priorities<br />
The staff at <strong>Anderson</strong> utilizes ongoing assessment procedures to implement the following<br />
assessment tools.<br />
1. Discipline Referrals<br />
2. After-school Detention Forms<br />
3. In School Intervention Forms<br />
4. Suspension Forms<br />
Based upon these tools in conjunction with observations the goal for improved building<br />
wide climate/behavior is that student discipline referrals will decrease 50% from the<br />
previous school year, with monthly monitoring in place.<br />
<strong>Anderson</strong> <strong>Elementary</strong> SiPlan Page 22
3. BUILDING GOALS<br />
4.1 Language Arts<br />
<strong>Anderson</strong> <strong>Elementary</strong> School is committed to mastery of a language arts curriculum that serves<br />
as the cornerstone of communication skills (thinking, speaking, listening, reading, and writing).<br />
The optimum development of communication skills will focus on mastery of: vocabulary,<br />
comprehension / critical literacy, literature and research / information which ensure educational<br />
success for every student.<br />
Progress Report for the 2007 – 08 School Year in Language Arts:<br />
4.1 Language Arts<br />
Analysis of OCCT test results in conjunction with a variety of other data indicates progress was<br />
not made toward mastery of the language arts curriculum. Data indicates the gap between<br />
special education and regular education students is closing. Special Education data indicates<br />
areas of strengths vary across the grade levels. Data also indicates that our students still<br />
struggle in the area of vocabulary development.<br />
Progress Report for the 2006 – 07 School Year in Language Arts:<br />
4.1 Language Arts<br />
Analysis of OCCT test results in conjunction with a variety of other data indicates progress was<br />
made toward mastery of the language arts curriculum. Data indicates there is still a gap<br />
between regular students and IEP students. Special Education data indicates areas of<br />
strengths vary across the grade levels. Data also indicates that our students still struggle in the<br />
area of vocabulary development.<br />
<strong>Anderson</strong> <strong>Elementary</strong> SiPlan Page 23
4.2 Mathematics<br />
<strong>Anderson</strong> <strong>Elementary</strong> School is committed to mastery of a mathematics curriculum that serves<br />
as the foundation of abstract reasoning and problem-solving skills. The optimum development of<br />
mathematics skills will include: patterns and algebraic reasoning, number sense, number<br />
operations / computation, geometry and measurement, data analysis and probability which<br />
ensures educational success for every student.<br />
Progress Report for the 2007 – 2008 School Year in Mathematics:<br />
Analysis of OCCT test results in conjunction with a variety of other data indicates progress was<br />
not made toward mastery of the mathematics curriculum. Data indicates Special Education<br />
students’ scores well surpassed those of the regular education students. Special Education<br />
data indicates areas of strengths vary across the grade levels. Data indicates that geometry<br />
and measurement along with number sense are still areas of struggle for our students.<br />
Progress Report for the 2006-07 School Year in Mathematics:<br />
Analysis of OCCT test results in conjunction with a variety of other data indicates progress was<br />
made toward mastery of the mathematics curriculum. Data indicates the gap between regular<br />
students and IEP students is getting smaller. Special Education data indicates areas of<br />
strengths vary across the grade levels. Data indicates that geometry and measurement along<br />
with number sense are still areas of struggle for our students.<br />
<strong>Anderson</strong> <strong>Elementary</strong> SiPlan Page 24
4.3 Attendance<br />
<strong>Anderson</strong> <strong>Elementary</strong> School students will attend school daily, arriving in a timely manner, with<br />
a readiness for positive learning.<br />
• Daily Attendance Reports<br />
• Absentee phone calls<br />
• Quarterly report cards to document absences<br />
Progress Report for the 2007-08 School Year in Attendance:<br />
Attendance rates increased significantly over the last year. In the 2007 – 08 school year our<br />
attendance rate increased by 3%, which well surpassed the minimum rate for AYP. Our<br />
continued focus will be on increasing our attendance rate to 96% in the 2008 – 2009 school<br />
year.<br />
Progress Report for the 2006-07 School Year in Attendance:<br />
Attendance rates have increased slightly over the last three years. In the 2006 -07 school year<br />
our attendance rate surpassed the minimum rate for AYP. Our continued focus will be on<br />
increasing our attendance rate to 95% in the 2007-2008 school year.<br />
<strong>Anderson</strong> <strong>Elementary</strong> SiPlan Page 25
4.4 Climate<br />
An <strong>Anderson</strong> <strong>Elementary</strong> School learning community based upon respect and dignity will be the<br />
keystone that nurtures academic success. In an effort to decrease behavior problems and<br />
increase academic achievement, we have implemented Eat, Exercise, Excel, which is a<br />
research-based program developed to increase academic achievement through proper nutrition<br />
and proper levels of exercise. <strong>Anderson</strong> students will develop skills and behavioral abilities that<br />
assure a positive, safe and caring learning community for all members of the school. All is<br />
achieved by the active partnership of students, families and staff working collaboratively<br />
together.<br />
Progress Report for the 2007-08 School Year in Climate:<br />
In an effort to drastically decrease the number of office referrals and suspensions, we have<br />
implemented the Eat, Exercise, Excel program school wide. This research-based program is<br />
designed to improve academic achievement and behavior through proper nutrition and<br />
research. Because of the implementation of this program, we have already seen a huge<br />
decrease in referrals and of the suspensions we have had, the amount of violent offenders has<br />
decreased.<br />
Progress Report for the 2006-07 School Year in Climate:<br />
Suspension rates at <strong>Anderson</strong> <strong>Elementary</strong> School doubled over the last two school years. In an<br />
effort to insure that does not happen this year, we are implementing a new school-wide<br />
discipline plan, focusing on Tribes and building community, and utilizing In School Suspension.<br />
Already the number of discipline referrals has decreased slightly. Our emphasis on a positive<br />
learning environment with optimal time on task is enabling our teachers to teach without<br />
constant interruption.<br />
Focusing on Student Sub-Group Learning Needs: Via an analysis of disaggregated data it<br />
has become apparent that sub-group populations of our students are functioning at varying<br />
performing levels. As a result of these findings, this staff is charting courses of action to address<br />
these instructional / learning realities with immediacy and building-wide concerted effort. Work<br />
products to this end will be found within individual teacher’s lesson planning.<br />
<strong>Anderson</strong> <strong>Elementary</strong> SiPlan Page 26
4. ACTION PLANS BY INDIVIDUAL GRADE LEVEL<br />
4.1 Language Arts / English<br />
Focus of Improvement: Early Childhood Language Arts<br />
School Improvement and Achievement Plan<br />
School: <strong>Anderson</strong> <strong>Elementary</strong> School Year: 2008-2009<br />
Goal: All Early Childhood students will demonstrate the ability to speak in complete sentences,<br />
and will demonstrate increased listening skills as determined by district wide standards listed on<br />
the report card.<br />
Achievement Objective: All Early Childhood students will be able to demonstrate the ability to<br />
speak in complete sentences; Speaking/Uses language for a variety of purposes 2.1;<br />
Speaking/Uses sentences of increasing length 2.3; Vocabulary/Shows a steady increase in<br />
listening and speaking vocabulary 5.1.<br />
Benchmark: Early Childhood students will show growth on the teacher made assessments as<br />
documented on the Post Test of the KAT Skills Inventory.<br />
Interventions / Strategies<br />
Speaking / Uses language for a variety of purposes 2.1<br />
The EC (Early Childhood) teachers should focus on<br />
developing the Linguistic Intelligence, as identified by<br />
Howard Gardner, to assist their young students in<br />
expressing themselves verbally. Activities should<br />
include Nursery Rhymes, singing games, stories with<br />
repeating word patterns, and other word<br />
games/activities. Students should also be encouraged<br />
to speak/answer in complete sentences.<br />
Speaking/Uses sentences of increasing length 2.3<br />
All Early Childhood students will be able to demonstrate<br />
or show improvement in the ability to speak in<br />
sentences of increasing length (three or more words)<br />
and grammatical complexity. Pre-K students will have<br />
many opportunities to speak to others during center<br />
activities and during group time/story time activities<br />
allowing for “Think, Pair, Share” time in making<br />
predictions. Language will be expanded through<br />
retelling stories and acting out poems and Nursery<br />
Rhymes<br />
Vocabulary/Shows a steady increase in listening and<br />
speaking vocabulary 5.1<br />
By providing opportunities of retelling stories, the EC<br />
teacher will help students develop skills through use of<br />
the multiple intelligences of linguistics, bodily<br />
kinesthetic, and through inter- and intra- personal skills.<br />
Assessments<br />
Daily/Weekly<br />
• Class time discussions<br />
• One on one with the teacher<br />
• Sharing time<br />
• Center time interaction<br />
• Observations and interaction during book time<br />
• Teacher-made tests will be administered as<br />
needed.<br />
• Anecdotal records focusing on children’s literal<br />
understanding and children’s usage of literary<br />
elements will be recorded on a weekly basis.<br />
Periodic<br />
• Pre-K Growth Inventory (Pre-screening in<br />
August, Post screening in May)<br />
• Pre-Kindergarten Growth Inventory (PKGI) is<br />
administered on entry to the program and in the<br />
spring to assess cognitive growth of students.<br />
• Scott Foresman Assessments each quarter<br />
Assessments are made quarterly using the applicable<br />
Literacy First materials and teacher made assessments<br />
of Early Childhood benchmarks to monitor language<br />
growth<br />
See next page for continuation of this action plan.<br />
<strong>Anderson</strong> <strong>Elementary</strong> SiPlan Page 27
Instructional Technology Integrated<br />
Strategies<br />
Speaking / Uses language for a variety of purposes 2.1<br />
EC teacher will utilize the Waterford Early Learning<br />
System beginning in the second quarter. Starfall and<br />
Promethean Planet websites will be utilized as well<br />
throughout the school year.<br />
Speaking/Uses sentences of increasing length 2.3<br />
EC teacher will utilize the Waterford Early Learning<br />
System.<br />
Vocabulary/Shows a steady increase in listening and<br />
speaking vocabulary 5.1<br />
EC teacher will utilize the Waterford Early Learning<br />
System as well as Promethean Planet activities.<br />
Parental Participation<br />
Communication:<br />
• Parents will partner with staff in providing<br />
opportunities for the children to practice writing<br />
and saying letters of the alphabet. Activities are<br />
provided in the monthly newsletters and as<br />
homework on a periodic basis.<br />
• Parents shall receive assistance in<br />
understanding such topics as the state’s<br />
academic content and achievement standards,<br />
the assessments being used and how to monitor<br />
their children’s progress and work with<br />
educators to improve their achievement.<br />
• <strong>Schools</strong> shall ensure that information related to<br />
school and parent programs, meetings and other<br />
activities is sent to the parents of participating<br />
children in a format, and, to the extent<br />
practicable, in a language the parents can<br />
understand.<br />
• Family Literacy Nights will occur monthly in an<br />
effort to increase family involvement.<br />
Learning At Home:<br />
• <strong>Schools</strong> shall provide materials and training,<br />
such as literacy training and training on how to<br />
use technology, to help parents work with their<br />
children to improve achievement.<br />
Professional Development<br />
• Pre-Kindergarten teachers will participate in schoolwide<br />
in-service identifying student /teacher<br />
resources found at the Internet4classrooms web<br />
site to enhance student awareness of print<br />
concepts.<br />
• Pre-Kindergarten teachers will participate in inservice<br />
programs with district resource teachers,<br />
school librarian and grade level teams to identify<br />
ways to increase student awareness of the<br />
transition of spoken language to printed word.<br />
• Pre-Kindergarten teachers will participate in schoolwide<br />
in-service where they will identify ways to<br />
incorporate supplemental resources found in the<br />
Scott Foresman reading program.<br />
• Pre-Kindergarten teachers will attend Saturday<br />
professional development sessions with Kim<br />
Collier/Educational Consulting Services.<br />
• Pre-Kindergarten teachers will participate in<br />
ongoing Waterford, Scott Foresman, and<br />
Promethean training sessions.<br />
<strong>Anderson</strong> <strong>Elementary</strong> SiPlan Page 28
4. ACTION PLANS BY INDIVIDUAL GRADE LEVEL<br />
4.1 Language Arts / English<br />
Focus of Improvement: Kindergarten Language Arts<br />
School Improvement and Achievement Plan<br />
School: <strong>Anderson</strong> <strong>Elementary</strong> School Year: 2007-2008<br />
Goal: All kindergarteners will have acquired the basic skills necessary to be successful<br />
in first grade as determined by district-wide assessment.<br />
Achievement Objective: All kindergarten students will be able to achieve mastery of basic<br />
kindergarten level language arts concepts in the area of Phonics/Decoding/Identify the<br />
alphabet by name 3.1; Vocabulary/Use new vocabulary and language in own speech 4.1;<br />
Vocabulary/Use new vocabulary and language in own writing 4.2.<br />
Benchmark: Minimally, all Kindergarten students will score a Benchmark on the DIBELS test<br />
given in the spring.<br />
Interventions / Strategies<br />
Phonics/Decoding/Identify the alphabet by<br />
name 3.1 Teachers will use Flexible Small Group<br />
Instruction following the SRA Direct Instruction program<br />
for progression of the skill of sound letter recognition<br />
and skills will be introduced through Literacy Centers.<br />
Also during large group instruction teachers will use<br />
shared reading, rhyming songs fingerplays, read<br />
alouds, poetry, and morning message to help provide<br />
language, letter, and sound practice for ELL students.<br />
There will be intervention provided by paid reading<br />
interventionists for students in need of additional<br />
assistance to achieve mastery for any students below<br />
skill knowledge or who are just developing the letters<br />
and sounds of the new language. HWT will be taught to<br />
all students. Teachers will also use Voyager Passport<br />
intervention system in the classroom daily.<br />
Vocabulary/Use new vocabulary and<br />
language in own speech 4.1 Kindergarten<br />
teachers will provide repeated exposure to varying letter<br />
sounds and words. They will provide association<br />
methods where students utilize prior knowledge and<br />
personal experience to identify letters, sounds, and<br />
words. Teachers will also use Voyager Passport<br />
intervention system in the classroom daily.<br />
Vocabulary/Use new vocabulary and<br />
language in own writing 4.2. Kindergarten<br />
teachers will provide opportunities in large group as well<br />
as small group instruction where students can practice<br />
the new vocabulary through talking with the teacher and<br />
other students. They will also provide opportunities for<br />
students to use new vocabulary when describing<br />
pictures drawn in students own writing journals.<br />
Teachers will also use Voyager Passport intervention<br />
system in the classroom daily.<br />
Assessments<br />
Daily and Weekly Assessments:<br />
• Teacher observations of daily participation/work<br />
and flexible group work will give an informal view<br />
of student development.<br />
• Teacher-made tests will be administered as<br />
needed.<br />
Periodic<br />
• DIBELS will be administered as directed by the<br />
school district.<br />
• Kindergarten assessment will be given as a<br />
pre/post assessment in fall & spring.<br />
See next page for continuation of this action plan.<br />
<strong>Anderson</strong> <strong>Elementary</strong> SiPlan Page 29
Instructional Technology Integrated Strategies<br />
Phonics/Decoding/Identify the alphabet by name 3.1<br />
Students will use Compass Learning aligned<br />
assignments to assist in mastery of these skills for<br />
about 30 minutes per week. Promethean Planet and<br />
www.starfall.com will be utilized as well.<br />
Vocabulary/Use new vocabulary and language in own<br />
speech 4.1<br />
Teachers will use the “Blues Clues” section of<br />
www.nickjr.com. Students click on highlighted words in<br />
the story. Once the student clicks on the word, the<br />
word becomes a small picture with the word printed<br />
under the picture.<br />
Vocabulary/Use new vocabulary and language in won<br />
writing 4.2<br />
Websites to help with these learning objectives are:<br />
www.starfall.com Provides numerous reading skills<br />
along with concept in print and phonemic awareness<br />
skills.<br />
www.nickjr.com Variety of reading skills from favorite<br />
children’s TV shows. The “Blue Clues” section has<br />
highlighted words for students to click on in the story.<br />
Once the student clicks on the word, the word becomes<br />
a small picture with the word printed under picture.<br />
Professional Development<br />
• Grade level team meetings with Instructional<br />
Facilitator and academic coaches<br />
• Peer coaching with literacy coach<br />
• Kindergarten teachers will consult with the<br />
Instructional Facilitator, to obtain additional<br />
strategies for helping the students with word<br />
recognition and comprehension.<br />
• Kindergarten teachers will view demonstration<br />
lessons and attend workshops conducted by<br />
the Instructional Facilitator for new ideas to<br />
increase student reading skills.<br />
• Kindergarten teachers will participate in Early<br />
Childhood Teacher Workshops to share and<br />
gain new strategies and ideas for helping<br />
students improve reading skills.<br />
• Kindergarten teachers will work with First grade<br />
teachers in collaborative planning sessions to<br />
ensure kindergarten students are developing<br />
Parental Participation<br />
Communication<br />
• Students’ work will be sent home regularly to<br />
acquaint parents with instructional focus.<br />
• Progress Reports will be sent home with every<br />
student at mid-quarter, four times a year. This<br />
will inform parents of their child’s strengths and<br />
weaknesses in the area of reading/language<br />
arts.<br />
• Title I Compact is explained and signed<br />
by all participants: parent/guardian,<br />
student & teacher.<br />
• Parents shall receive assistance in<br />
understanding such topics as the state’s<br />
academic content and achievement<br />
standards, the assessments being used<br />
and how to monitor their children’s<br />
progress and work with educators to<br />
improve their achievement. (and<br />
Learning at Home)<br />
• <strong>Schools</strong> shall ensure that information related to<br />
school and parent programs, meetings and other<br />
activities is sent to the parents of participating<br />
children in a format, and, to the extent<br />
practicable, in a language the parents can<br />
understand.<br />
• Family Literacy Nights will occur monthly in an<br />
effort to increase family involvement.<br />
Learning at Home:<br />
• Homework will be assigned at least one time<br />
each week.<br />
• Parents partner with the teacher by helping their<br />
children practice letter concepts each week.<br />
Parents are encouraged to read to their children<br />
in multiple ways. Learning materials are sent so<br />
that parents can monitor student learning at<br />
home.<br />
See next page for continuation of this action plan.<br />
<strong>Anderson</strong> <strong>Elementary</strong> SiPlan Page 30
skills to help them be successful in First grade.<br />
• Kindergarten teachers will meet weekly to plan<br />
instruction that will help students with various<br />
reading skills.<br />
• Kindergarten teachers will complete the<br />
Voyager U Modules as required by the Reading<br />
First Grant.<br />
• Kindergarten teachers will participate in<br />
Saturday professional development sessions<br />
with Kim Collier/Educational Consulting<br />
Services.<br />
• Kindergarten teachers will participation in<br />
quarterly vertical articulation professional<br />
development provided by District Instructional<br />
Facilitators.<br />
BALANCE OF THE PAGE LEFT BLANK<br />
<strong>Anderson</strong> <strong>Elementary</strong> SiPlan Page 31
Focus of Improvement: First Grade Reading<br />
School Improvement and Achievement Plan<br />
School: <strong>Anderson</strong> <strong>Elementary</strong> School Year: 2008-2009<br />
Goal: All first grade students will demonstrate reading proficiency at grade level or improving by<br />
nine months over the previous year’s scores.<br />
Achievement Objective: All first grade students will be able to demonstrate proficiency at<br />
grade level or show improvement within the areas of Print Awareness/Recognize the difference<br />
among letters, words, and sentences 1.3; Phonological/Phonemic Awareness/Add or delete a<br />
phoneme change to a word 2.6; Comprehension/Critical Literacy/Literal Understanding 6.1;<br />
Vocabulary/Increase personal vocabulary 4.1; Vocabulary/Use new vocabulary and language<br />
4.3<br />
Benchmark: Minimally, all first grade students scoring strategic will score benchmark, and<br />
those scoring intensive will score strategic on the DIBELS test given in the spring.<br />
Interventions / Strategies<br />
Assessments<br />
Print Awareness/Recognize the difference among<br />
letters, words, and sentences 1.3<br />
First grade teachers will use graphic organizers<br />
according to Marzano’s strategies to recognize the<br />
difference among letters, words, and sentences.<br />
Teachers will also utilize the Voyager Passport<br />
intervention system in the classroom daily. Teachers<br />
will also utilize Direct Instruction through SRA.<br />
Phonological/Phonemic Awareness/Add or delete a<br />
phoneme change to a word 2.6<br />
1 st grade teachers will provide direct instruction through<br />
phoneme manipulation tasks and the use of the<br />
Promethean Board or chart tablet where they use word<br />
knowledge (story vocabulary) as a basis of adding or<br />
deleting a phoneme as well as through the Scott<br />
Foresman reading program. Teachers will also use the<br />
Voyager Passport intervention system in the classroom<br />
daily.<br />
Comprehension/Critical Literacy/Literal<br />
Understanding 6.1<br />
Teachers will use Marzano’s Identifying Similarities and<br />
Differences strategy to increase students’ literal<br />
understanding and general comprehension skills. The<br />
students will compare and contrast two different<br />
versions of the same story and discuss how they are<br />
alike and different. Teachers will also use the Voyager<br />
Passport intervention system in the classroom daily.<br />
Vocabulary/Increase personal vocabulary 4.1<br />
Teachers will utilize the Amazing Words in the Scott<br />
Foresman series to increase students’ personal<br />
vocabulary. Teachers will also use the Voyager<br />
Passport intervention system in the classroom daily.<br />
Vocabulary/Use new vocabulary and language 4.3<br />
The first grade teacher will utilize a vocabulary graphic<br />
organizer from Scott Foresman. The child will write the<br />
vocabulary word/draw a pictorial representation of the<br />
word on a card. On the right side identify objects with<br />
Daily and Weekly Assessments:<br />
• Teacher observations of daily participation/work<br />
and flexible group work will give an informal view<br />
of student development.<br />
• SRA Reading Check-outs and Mastery tests<br />
• Progress Monitoring bi-weekly<br />
• Teacher-made tests will be administered as<br />
needed.<br />
• Scott Foresman Assessments<br />
Periodic<br />
• DIBELS will be administered as directed by the<br />
district and the Reading First Grant.<br />
Annually:<br />
• The ITBS test will be administered as directed<br />
by the Reading First Grant.<br />
See next page for continuation of this action plan.<br />
<strong>Anderson</strong> <strong>Elementary</strong> SiPlan Page 32
pictures that are like the vocabulary word. On the<br />
opposite side identify objects with pictures that are not<br />
like the vocabulary word. Teachers will also use the<br />
Voyager Passport intervention system in the classroom<br />
daily.<br />
Instructional Technology Integrated Strategies<br />
Print Awareness/Recognize the difference among<br />
letters, words, and sentences 1.3<br />
First grade teachers will use Compass Learning<br />
assignments that are aligned with this standard.<br />
Phonological/Phonemic Awareness/Add or delete a<br />
phoneme change to a word 2.6<br />
First grade teachers will utilize overhead projectors and<br />
Promethean Boards to engage students in utilizing<br />
phoneme addition and deletion in word identification<br />
and fluency development. Students will also use audio<br />
books to listen to rhyming words – repeated exposure.<br />
Comprehension/Critical Literacy/Literal<br />
Understanding 6.1<br />
The students will read a short story on the following<br />
website to further practice answering Narrative Story<br />
Frame questions: http://www.starfall.com/n/controlor/or/load.htm.<br />
Vocabulary/Increase personal vocabulary 4.1<br />
Teachers will utilize the CompassLearning program to<br />
provide additional vocabulary instruction.<br />
Vocabulary/Use new vocabulary and language 4.3<br />
Teachers will utilize the Promethean Planet website,<br />
along with Safari Montage and Scott Foresman<br />
websites and technology to build vocabulary and<br />
language.<br />
See next page for continuation of this action plan.<br />
Parental Participation<br />
Communication<br />
• First grade teachers will provide<br />
training for how to help students learn at home<br />
(homework or other content related projects) at<br />
Literacy Nights.<br />
• Parent/teacher conferences will<br />
provide a basis for periodic communication<br />
between parents and teachers regarding<br />
children’s literacy development. Information will<br />
be presented in an understandable way to<br />
parents.<br />
• Make-It/Take-It nights will provide<br />
first grade teachers with the opportunity to<br />
demonstrate strategies and techniques parents<br />
can use at home to further their child’s overall<br />
literacy development.<br />
• <strong>Schools</strong> shall ensure that<br />
information related to school and parent<br />
programs, meetings and other activities is sent<br />
to the parents of participating children in a<br />
format, and, to the extent practicable, in a<br />
language the parents can understand.<br />
• Parents shall receive assistance in<br />
understanding such topics as the state’s<br />
academic content and achievement standards,<br />
the assessments being used and how to monitor<br />
their children’s progress and work with<br />
educators to improve their achievement.<br />
• Family Literacy Nights will occur monthly in an<br />
effort to increase family involvement.<br />
Learning at Home:<br />
• Reading Logs will provide parents a means to<br />
communicate their child’s reading progress at<br />
home.<br />
• Pal Packets will be used in an effort to extend<br />
the learning beyond the classroom,<br />
and to further involve parents in their child’s<br />
learning.<br />
• <strong>Schools</strong> shall provide materials and<br />
training, such as literacy training and training on<br />
how to use technology, to help parents work with<br />
their children to improve achievement.<br />
Professional Development<br />
• First grade teachers will hold in-service team<br />
planning sessions where they identify ways to<br />
implement the PowerPoint computer program<br />
<strong>Anderson</strong> <strong>Elementary</strong> SiPlan Page 33
when teaching alphabetizing words.<br />
• First grade teachers will also partake in schoolwide<br />
in-service programs learning how to utilize<br />
the Question Answer Relationship Strategy<br />
(QAR) and Bloom’s Taxonomy questioning<br />
strategies to enhance critical literacy relating to<br />
summarization and making generalizations.<br />
• First grade teachers will participate in the<br />
Voyager U Modules as required by the Reading<br />
First Grant.<br />
• First grade teachers will participate in Saturday<br />
professional development sessions with Kim<br />
Collier/Educational Consulting Services.<br />
BALANCE OF THE PAGE LEFT BLANK<br />
<strong>Anderson</strong> <strong>Elementary</strong> SiPlan Page 34
Focus of Improvement: Second Grade Reading<br />
School Improvement and Achievement Plan<br />
School: <strong>Anderson</strong> <strong>Elementary</strong> School Year: 2008-2009<br />
Goal: All second grade students will achieve reading proficiency at grade level or above on<br />
district-wide assessment utilized.<br />
Achievement Objective: All second grade students will be able to demonstrate proficiency at<br />
grade level or show improvement within the areas of Phonics/Decoding/Phonemic Analysis<br />
2.1; Vocabulary/Words in Context 3.1; Fluency 4.0; Comprehension/Critical Literacy/Literal<br />
Understanding 5.1<br />
Benchmark: Minimally, all second grade students scoring strategic will score benchmark, and<br />
those scoring intensive will score strategic on the DIBELS test given in the spring.<br />
Interventions / Strategies<br />
Assessments<br />
Phonics/Decoding/Phonetic Analysis 2.1<br />
Second grade teachers can start with short regular<br />
words emphasizing rhyming, rapping and alliteration to<br />
teach consonant sounds and beginning, medial, and<br />
final positions reinforcing effort of students and<br />
providing feedback to them. Teachers will also use the<br />
Voyager Passport intervention system in the classroom<br />
daily.<br />
Vocabulary/Words in Context 3.1<br />
Second grade teachers will provide repeated exposure<br />
to vocabulary and sight words using Word Walls to<br />
display high-frequency words. They will use graphic<br />
organizers and K-W-L charts with students to activate<br />
their prior knowledge and personal experience to<br />
identify words in context. Teachers will also use the<br />
Voyager Passport intervention system in the classroom<br />
daily.<br />
Fluency 4.0<br />
Second grade teachers will provide repeated exposure<br />
to books on the students’ instructional level. They will<br />
allow students to practice their reading and time<br />
themselves to build their oral reading fluency. Teachers<br />
will also use the Voyager Passport intervention system<br />
in the classroom daily.<br />
Comprehension/Critical Literacy/Literal<br />
Understanding 5.1<br />
Second grade teachers will provide students with both<br />
fiction and nonfiction reading materials and assess<br />
reading and listening comprehension. The teachers will<br />
implement pre-reading strategies to allow students to<br />
make and generate questions about their reading as<br />
well as utilize graphic organizers. Teachers will also<br />
use the Voyager Passport intervention system in the<br />
classroom daily.<br />
Daily and Weekly Assessments:<br />
• Teacher observations of daily participation/work<br />
and flexible group work will give an informal view<br />
of student development.<br />
• Review student journals<br />
• Teacher-made assessments as needed<br />
• Scott Foresman<br />
• Progress Monitoring (bi-weekly)<br />
• SRA Check-outs and Mastery Tests<br />
Periodic<br />
• DIBELS Reading Assessments will be<br />
administered as directed by the school district<br />
and the Reading First Grant.<br />
• Benchmark testing twice a year<br />
Annually:<br />
• IOWA Test of Basic Skills as required by the Reading<br />
First Grant<br />
See next page for continuation of this action plan.<br />
<strong>Anderson</strong> <strong>Elementary</strong> SiPlan Page 35
Instructional Technology Integrated<br />
Strategies<br />
Phonics/Decoding/Phonetic Analysis 2.1<br />
Second grade teachers will model and use<br />
www.starfall.com with students. Teachers will also use<br />
activities from Promethean Planet regularly in the<br />
classroom<br />
Vocabulary/Words in Context 3.1<br />
The Second grade teacher will model use of computer<br />
for students and provide opportunities for students to<br />
independently use the computer in a variety of activities<br />
to improve phonics skills. Teachers will also use<br />
activities from Promethean Planet regularly in the<br />
classroom.<br />
Fluency 4.0<br />
Tech Link… Fluency 4.0 Teacher approved reading<br />
websites including www.StarFall.com and<br />
www.PBSKids.org will be utilized to help students gain<br />
understanding in the area of fluency. Students will also<br />
be allowed to use books on tape in the listening center.<br />
Comprehension/Critical Literacy/Literal<br />
Understanding 5.1<br />
As a technology component of this lesson, students will<br />
design a page for a nonfiction book that the class will<br />
put together. The students will use Microsoft Word to<br />
type their summary of the magazine article. Then, the<br />
students will insert a picture about their article using<br />
Clip Art. After all students have created & printed their<br />
summary page, the teacher will compile the pages to<br />
form a class book. Teachers will also use activities<br />
from Promethean Planet regularly in the classroom.<br />
Parental Participation<br />
Communication:<br />
• Second grade teachers will submit periodic<br />
parent surveys giving parents the opportunity to<br />
voice their opinions regarding their child’s<br />
literacy strengths and needs. This will be in the<br />
form of two-way communication as teachers<br />
then inform parents of how to further develop<br />
their child’s literacy skills.<br />
• The second grade teacher will send homework<br />
that is related to that week’s work and provide a<br />
space for a signature and feedback from home.<br />
• Second grade teachers will send home progress<br />
reports and report cards in 41/2 week intervals.<br />
• Family Literacy Nights will occur monthly in an<br />
effort to increase family involvement.<br />
Learning at Home:<br />
• Reading Logs will have an area for<br />
parent/teacher feedback regarding the student’s<br />
reading at school and at home.<br />
• Homework to be completed with parental<br />
assistance at home daily.<br />
Professional Development<br />
• Teacher resources may be found at<br />
http://www.four-blocks.com and<br />
http://www.cherylsigmon.com/about.asp .<br />
• Additional ideas and teaching tools using<br />
Harvey and Goudvis’ strategies can be found at<br />
www.readinglady.com under “comprehension.”<br />
• Grade level team meetings with Instructional<br />
Facilitator and academic coaches<br />
• Peer coaching with literacy coach<br />
• In-building training in Compass Learning<br />
software<br />
• Periodic SRA training and coaching in teaching<br />
of Language for Thinking<br />
• Second grade teachers will participate in the<br />
Voyager U Modules as directed by the Reading<br />
First Grant.<br />
• Teachers will participate in Saturday<br />
professional development sessions with Kim<br />
Collier/Educational Consulting Services.<br />
See next page for continuation of this action plan.<br />
<strong>Anderson</strong> <strong>Elementary</strong> SiPlan Page 36
• Second grade teachers will participate in the<br />
Vertical Articulation meetings provided by the<br />
District Instructional Facilitators.<br />
• Two the second grade teachers will attend the<br />
Closing the Achievement Gap seminar<br />
presented by Larry Bell in October 2008.<br />
BALANCE OF THE PAGE LEFT BLANK<br />
<strong>Anderson</strong> <strong>Elementary</strong> SiPlan Page 37
Focus of Improvement: 3 rd Grade Reading<br />
School Improvement and Achievement Plan<br />
School: <strong>Anderson</strong> School Year: 2008-2009<br />
Goal: All third grade students will demonstrate reading proficiency at grade level or higher on<br />
the Oklahoma Core Curriculum Test.<br />
Achievement Objective: At a current median score of 33% Research and<br />
Information/Accessing information 6.1 at least half of the third graders will score 50% or above;<br />
at a current median score of 40% Literature/Figurative Language/Sound Devices 5.3 at least<br />
half the third graders will score 60% or above; at a current median score of 50%<br />
Comprehension/Critical Literacy/Summary and Generalization 4.3 at least half the third<br />
graders will score 75% or above. These measures of progress will be achieved on the Standard<br />
District Curriculum Assessments and OCCT during the 2009 testing cycles.<br />
Benchmark: Minimally, the majority of all third grade students will achieve a satisfactory or<br />
above score as demonstrated by the OCCT given in the spring.<br />
Interventions / Strategies<br />
Assessments<br />
Research and Information/Accessing Information<br />
6.1<br />
Third grade teachers will facilitate a classroom<br />
discussion to assess prior knowledge of students’<br />
ability to research and access information. Teacher<br />
will engage students in a hands-on activity in which<br />
students will utilize a graphic organizer to locate and<br />
correctly use a variety of research resources (i.e.<br />
atlas, glossary, encyclopedia, etc.)<br />
Literature/Figurative Language/Sound Devices 5.3<br />
Third grade teachers will use direct instruction to<br />
provide the necessary word knowledge needed to<br />
understand the figurative language as well as teach<br />
children to listen effectively so they can apply<br />
comprehension monitoring to their understanding of<br />
figurative language and sound devises. Voyager<br />
Passport intervention system will be used in the<br />
classroom daily.<br />
Comprehension/Critical Literacy/Summary and<br />
Generalization 4.3<br />
Student will recognize the main idea, actions,<br />
supporting details and key concepts in fiction and<br />
non-fiction stories by using SRA multiple skills and<br />
Scott Foresman, CompassLearning computer<br />
program. The teacher will assign and monitor<br />
student understanding of summary and<br />
generalization using the CompassLearning program.<br />
Daily and Weekly Assessments:<br />
• Teacher observations of daily participation/work<br />
and flexible group work will give an informal view of<br />
student development.<br />
• Teacher-made tests will be administered as<br />
needed.<br />
• Compass Learning Weekly Assessments<br />
• SRA Check-outs and Mastery Tests<br />
Periodic<br />
• Standard District Curriculum Assessment unit tests<br />
will be administered approximately every three<br />
weeks for six units.<br />
• DIBELS Reading Assessments will be<br />
administered as directed by the school district and<br />
by the Reading First Grant.<br />
• Individual assessments will provide informal views<br />
of student literacy development.<br />
Annually:<br />
- The OCCT test will be administered as directed by<br />
the state.<br />
- IOWA Test of Basic Skills as directed by the<br />
Reading First Grant<br />
See next page for continuation of this action plan.<br />
<strong>Anderson</strong> <strong>Elementary</strong> SiPlan Page 38
Instructional Technology Integrated<br />
Strategies<br />
Research and Information/Accessing Information<br />
6.1<br />
Teachers and students will use the computer to<br />
access information via the Internet and other<br />
computer resources.<br />
Literature/Figurative Language/Sound Devices 5.3<br />
Teachers will use CompassLearning and Scott<br />
Foresman Reading Street, along with Promethean<br />
Planet on the Promethean Boards in the classroom.<br />
Comprehension/Summary and Generalization 4.3<br />
Students may use the Internet to research topics<br />
identified through the readings and develop reports<br />
within their cooperative groups. In this example,<br />
students could research other marsupials and<br />
develop a collage to share with the class. Website<br />
for interactive activities to increase knowledge in<br />
summary and generalization:<br />
www.webenglishteacher.com.<br />
Professional Development<br />
Parental Participation<br />
Communication:<br />
• Reading incentive program<br />
• Progress reports/report cards<br />
• Periodic phone calls or notes regarding student<br />
progress<br />
• Progress Reports will be sent home with every<br />
student at mid-quarter, four times a year. This will<br />
inform parents of their child’s strengths and<br />
weaknesses in the area of reading/language arts.<br />
• Title I Compact is explained and signed by all<br />
participants; parent, student and teacher.<br />
• Third grade teachers will hold parent teacher<br />
conferences in the fall and spring to meet with<br />
parents on an individual basis.<br />
• Family Literacy Nights will occur monthly in an<br />
effort to increase family involvement.<br />
Learning at Home:<br />
• Read at home daily<br />
• Homework will be assigned at least three times<br />
each week, to practice/review specific language<br />
arts skills.<br />
• Grade level team meetings with Instructional<br />
Facilitator and academic coaches<br />
• Peer coaching with literacy coach<br />
• In-building training in Compass Learning<br />
software<br />
• Periodic SRA training and coaching in<br />
teaching of Vocabulary and<br />
Comprehension/Critical Literacy skills<br />
• Third grade teachers will participate in inservice<br />
SRA training where they will learn to<br />
utilize the program efficiently and effectively.<br />
• Third grade teachers will participate in the<br />
Voyager U Modules as required by the<br />
Reading First Grant.<br />
• Third grade teachers will participate in<br />
Saturday sessions of professional<br />
development with Kim Collier/Educational<br />
Consulting Services.<br />
• Fourth grade teachers will participate in the<br />
Unpacking the Standards professional<br />
development presented prior to each<br />
benchmark unit.<br />
<strong>Anderson</strong> <strong>Elementary</strong> SiPlan Page 39
Focus of Improvement: Fourth Grade Reading<br />
School Improvement and Achievement Plan<br />
School: <strong>Anderson</strong> <strong>Elementary</strong> School Year: 2008-2009<br />
Goal: All fourth grade students will demonstrate reading, vocabulary and comprehension<br />
proficiency at grade level or above on the Oklahoma Core Curriculum Test.<br />
Achievement Objective: At a current median score of 57% Comprehension/Critical Literacy<br />
3.0 at least half of the fourth grade students will score 61% or above; at a current median score<br />
of 56% Literature 4.0 at least half of the fourth grade students will score 67% or above; and at a<br />
current median score of 67% Research and Information 5.0 at least half of the fourth grade<br />
students will score 83% or above. These measures of progress will be achieved on the<br />
Standard District Assessments and OCCT during the 2009 testing cycles.<br />
Benchmark: Minimally, the majority of all fourth grade students will achieve a satisfactory or<br />
above score as demonstrated by the OCCT given in the spring.<br />
Interventions / Strategies<br />
Comprehension/Critical Literacy/Inferences and<br />
Interpretation 3.0<br />
Fourth grade teachers will instruct students in small,<br />
flexible groups based on need, utilizing the eight –step<br />
lesson progression for comprehension skills and<br />
strategies. Students will practice summarizing &<br />
paraphrasing using reading logs to record main ideas,<br />
key concepts, and supporting details in a variety of texts.<br />
Teachers will use pre-reading strategies to allow<br />
students to summarize and generate generalizations.<br />
Teachers will assist students working in small<br />
cooperative groups to use graphic organizers in<br />
analyzing characters from their reading. Students will<br />
then come together to share and support their group<br />
analysis to the class.<br />
Literature 4.0<br />
Fourth grade teachers will use the Scott Foresman<br />
Reading Program to teach students literary elements<br />
and techniques. Students will learn how to identify the<br />
main events of the plot, causes and effects of each<br />
event on future action, major theme from the story.<br />
Also, the student will identify the purposes of different<br />
types of texts, setting, a character’s traits, motivations,<br />
and feelings for the character.<br />
Research and Information 5.0<br />
Fourth grade teachers will actively involve all students in<br />
cooperative learning groups where they research topics<br />
of interest using multiple sources. Teachers will monitor<br />
comprehension of accessed information with graphic<br />
organizers. They will also employ learning opportunities<br />
where children utilize Marzano’s note taking skills when<br />
recording information.<br />
Assessments<br />
Daily and Weekly:<br />
• Teacher observations of daily participation/work<br />
will give an informal view of student development.<br />
• Data folders<br />
• Oral leveled questioning<br />
• Teacher-made assessments<br />
• Scott Foresman Weekly Selection Tests<br />
• Data Folders (as needed)<br />
• CompassLearning ILS<br />
• Scott Foresman leveled readers for<br />
differentiated instruction<br />
Periodic:<br />
• Scott Foresman Unit Assessments<br />
• Scott Foresman Fresh Reads Inventory<br />
Assessments<br />
• Standard District Curriculum Assessment unit<br />
tests will be administered approximately every<br />
three weeks for six units.<br />
Annually:<br />
• OCCT in the spring<br />
See next page for continuation of this action plan.<br />
<strong>Anderson</strong> <strong>Elementary</strong> SiPlan Page 40
Instructional Technology Integrated<br />
Strategies<br />
Comprehension/Critical Literacy/Inferences and<br />
Interpretation 3.0<br />
Students will use CompassLearning for a minimum of 90<br />
minutes per week to develop these skills. Teachers will<br />
utilize Safari Montage selecting a story clip to create<br />
anticipation and to review standards or use a graphic<br />
organizer. Students will also use<br />
www.highlightskids.com in order to improve their<br />
analysis skills by writing anticipation guide statements<br />
for the next student. Teachers will also use<br />
www.pearsonsuccessnet.com assessments and leveled<br />
readers.<br />
Literature 4.0<br />
Students will use CompassLearning for a minimum of 90<br />
minutes per week to develop these skills. Nettrecker will<br />
also be used to access and use information from<br />
electronic reference sources.<br />
Parental Involvement<br />
Communication:<br />
• Homework weekly<br />
• Monthly newsletters<br />
• Progress reports/report cards<br />
• Phone calls as needed<br />
• Parental letters<br />
• Special projects<br />
• P.A.C. letters<br />
• Family Literacy Night will occur monthly to<br />
encourage parent participation.<br />
Learning at Home:<br />
• Read 20 minutes per day<br />
• Reading Logs<br />
• Teacher Created Activities<br />
Research and Information 5.0<br />
Teachers will use the Promethean Interactive<br />
Whiteboard to involve all learners and strengthen skills<br />
in the specific benchmark areas listed above.<br />
www.prometheanplanet.com<br />
Professional Development<br />
• Staff Meetings<br />
• Weekly Team Meetings<br />
• Attend state, district, and school professional<br />
development opportunities for reading and<br />
language arts. Collaborate with instructional<br />
facilitator, reading interventionist, and library<br />
media specialist to enhance and target specific<br />
areas. The team of teachers will share as a<br />
team various learning strategies and lessons<br />
they have used. They will share the success<br />
and areas that need assistance with each other.<br />
They will meet as a grade level and the whole<br />
school to align curriculum specific to students’<br />
needs.<br />
• Fourth grade teachers will participate in<br />
Saturday professional development sessions<br />
with Kim Collier/Educational Consulting<br />
Services.<br />
• Fourth grade teachers will participate in Vertical<br />
Articulation meetings presented by the District<br />
Instructional Facilitators.<br />
• Fourth grade teachers will participate in the<br />
Unpacking the Standards professional<br />
development presented prior to each benchmark<br />
unit.<br />
BALANCE OF THE PAGE LEFT BLANK<br />
<strong>Anderson</strong> <strong>Elementary</strong> SiPlan Page 41
Focus of Improvement: 5 th Grade Reading<br />
School Improvement and Achievement Plan<br />
School: <strong>Anderson</strong> <strong>Elementary</strong> School Year: 2008-2009<br />
Goal: All fifth grade students will demonstrate reading vocabulary and comprehension<br />
proficiency at grade level or above on the Oklahoma Core Curriculum Test.<br />
Achievement Objective: At a current median score of 60% Vocabulary/Words in Context 1.1<br />
at least half of the fifth grade students will score 80% or above; at a current median score of<br />
50% Vocabulary/Synonyms, Antonyms, Homonyms 1.3 at least half of the fifth grade students<br />
will score 75% or above; and at a median score of 60% Comprehension/Critical<br />
Literacy/Inferences and Interpretation 3.2 at least half of the fifth grade students will score 80%<br />
or above. These measures of progress will be achieved on the Standard District Curriculum<br />
Assessments and OCCT during the 2009 testing cycles.<br />
Benchmark: Minimally, the majority of all fifth grade students will achieve a satisfactory or<br />
above score as demonstrated by the OCCT given in the spring.<br />
Interventions / Strategies<br />
Vocabulary/Words in Context 1.1<br />
Fifth grade teachers will provide repeated exposure to<br />
varying vocabulary words. They will provide association<br />
methods where students utilize prior knowledge and<br />
personal experience to identify words in context, as well<br />
as different clues in text to identify words. They will use<br />
Word Maps to analyze words and keep these maps in<br />
folders for students to refer to regularly. These word<br />
maps will provide students use of the words in contexts,<br />
what it is and what it isn’t, and to store words in<br />
associate memory.<br />
Vocabulary/Synonyms, Antonyms, Homonyms 1.3<br />
Fifth grade teachers will provide direct instruction<br />
through repeated word knowledge activities, and then<br />
allow for cooperative and independent practice.<br />
CompassLearning and Scott Foresman reading<br />
program activities should be used as well.<br />
Comprehension/Critical Literacy/Inferences and<br />
Interpretation 3.2<br />
Students will also be regularly asked to retell the story<br />
to a partner or to the group either verbally or as an<br />
illustration using sequencing words.<br />
Assessments<br />
Daily and Weekly Assessments:<br />
• Teachers will use observations of daily<br />
participation/work and flexible group work to<br />
monitor progress on an on-going basis.<br />
• Teachers will use teacher-made tests as<br />
needed.<br />
• Vocabulary and comprehension tests over<br />
reading selection of the week will provide formal<br />
assessments of the desired achievement<br />
objectives.<br />
• SRA Checkouts and Mastery tests will be given<br />
as appropriate<br />
Periodic<br />
• Standard District Curriculum Assessment unit<br />
tests will be administered approximately every<br />
three weeks for six units.<br />
Annually:<br />
• OCCT in the spring.<br />
See next page for continuation of this action plan.<br />
<strong>Anderson</strong> <strong>Elementary</strong> SiPlan Page 42
Professional Development<br />
• Staff Meetings<br />
• Weekly Team Meetings<br />
• Attend state, district, and school professional<br />
development opportunities for reading and<br />
language arts.<br />
• Collaborate with instructional facilitator, reading<br />
interventionist, and library media specialist to<br />
enhance and target specific areas.<br />
• Fifth grade teachers will participate in Saturday<br />
professional development sessions with Kim<br />
Collier/Educational Consulting Services<br />
• Fifth grade teachers will participate in vertical<br />
articulation meetings presented by District<br />
Instructional Facilitators.<br />
• Fifth grade teachers will participate in the<br />
Unpacking the Standards professional<br />
development presented prior to each<br />
benchmark unit.<br />
Parental Participation<br />
Communication:<br />
• The Regular Education teacher will<br />
communicate with the Special Education teacher<br />
and the parent(s) regarding the child’s progress<br />
and specific needs as addressed on the IEP.<br />
• Title I Compact is explained and signed by all<br />
participants; parent, student and teacher.<br />
• <strong>Schools</strong> shall ensure that information related to<br />
school and parent programs, meetings and other<br />
activities is sent to the parents of participating<br />
children in a format, and, to the extent<br />
practicable, in a language the parents can<br />
understand.<br />
• Family Literacy Night will occur monthly in an<br />
effort to encourage parental participation.<br />
Learning at Home<br />
• Homework will be assigned at least three times<br />
each week, to practice/review specific language<br />
arts skills.<br />
• Students are to read at home each night.<br />
Parenting<br />
• Parents shall receive assistance in<br />
understanding such topics as the state’s<br />
academic content and achievement standards,<br />
the assessments being used and how to monitor<br />
their children’s progress and work with<br />
educators to improve their achievement.<br />
• <strong>Schools</strong> shall provide materials and training,<br />
such as literacy training and training on how to<br />
use technology, to help parents work with their<br />
children to improve achievement.<br />
BALANCE OF THE PAGE LEFT BLANK<br />
<strong>Anderson</strong> <strong>Elementary</strong> SiPlan Page 43
4. ACTION PLANS BY INDIVIDUAL GRADE LEVEL<br />
4.2 Mathematics<br />
Focus of Improvement: Early Childhood Mathematics<br />
School Improvement and Achievement Plan<br />
School: <strong>Anderson</strong> <strong>Elementary</strong> School Year: 2008-2009<br />
Goal: All Early Childhood students will demonstrate the ability to sort and group objects into<br />
sets, identify numerals, and count objects in a set one by one.<br />
Achievement Objective: All Early Childhood students will be able to demonstrate an<br />
understanding of Patterns/Sorts and groups objects into a set 1.1; Number Sense/Counts<br />
objects in a set one-by-one from one through five 2.4; Number Sense/Identifies numerals one<br />
through five 2.6.<br />
Benchmark: Students will demonstrate mastery of Pre-Kindergarten math skills by scoring<br />
satisfactory or better on Pre-Kindergarten screening and 80% or better on the Growing With<br />
Math Comprehensive Assessment Interview.<br />
Interventions / Strategies<br />
Patterns / Sorts and groups objects into a set 1.1<br />
Teachers will use math centers, small group instruction,<br />
supplemental games, commercial and teacher-made<br />
games, blocks, manipulatives and flannel boards. This<br />
approach accommodates students’ various learning<br />
styles:<br />
• Visual ~ visual students benefit from the<br />
colorful posters and story pictures;<br />
• Auditory ~ auditory students will learn through<br />
hearing concepts;<br />
• Kinesthetic ~ kinesthetic students will thrive on<br />
finger plays, centers and tactile materials.<br />
Number Sense/Counts objects in a set one-by-one<br />
from one through five 2.4<br />
Teachers will provide multiple opportunities during the<br />
week to count and identify numerals.<br />
Benchmark Assessments<br />
Daily and Weekly Assessments<br />
• Teacher observations of daily participation/work<br />
and flexible group work will give an informal view<br />
of student development.<br />
• Teacher-made tests will be administered as<br />
needed.<br />
• A portfolio of students’ work will be kept to note<br />
progress in the area of mathematics.<br />
Periodic<br />
• Quarterly Progress notes<br />
• Growing with Math assessments will be<br />
administered periodically to assess student<br />
understanding of standards.<br />
• Individual assessments will provide informal<br />
views of student math development.<br />
Number Sense/Identifies numerals one through five<br />
2.6. The early childhood teachers will provide repeated<br />
exposure to numerals by engaging students in counting<br />
games requiring students to identify numbers and count<br />
objects and matching amounts with numerals. Daily<br />
calendar elements such as number of the day, number<br />
on the calendar, and the number line will also be used<br />
to reinforce this objective.<br />
Instructional Technology Integrated<br />
Strategies<br />
Annually<br />
• Pre-K Growth Inventory post test will measure<br />
progress.<br />
See next page for continuation of this action plan.<br />
Patterns / Sorts and groups objects into a set 1.1<br />
Teacher may integrate technology by providing online<br />
game sites, such as: www.Prometheanplanet.com.<br />
Number Sense/Counts objects in a set one-by-one<br />
from one through five 2.4<br />
Students will have weekly opportunities to practice<br />
these math skills by visiting the computer lab and<br />
<strong>Anderson</strong> <strong>Elementary</strong> SiPlan Page 44
working with the Millie’s Math House CD. Teachers will<br />
utilize activities from www.prometheanplanet.com as<br />
well.<br />
Number Sense/Identifies numerals one through five<br />
2.6.<br />
Additional practice recognizing numbers 0-5 may be<br />
assigned using the online website<br />
www.internet4classrooms.com. Select Pre-kindergarten<br />
Resources/Math/Counting Concepts.<br />
Professional Development<br />
• The Early Childhood teachers will interact with<br />
the Instructional Facilitator in developing plans<br />
and activities to support interventions,<br />
strategies and activities.<br />
• The Early Childhood teachers will meet on a<br />
weekly basis to discuss and prepare lesson<br />
plans that will develop strategies for the<br />
students in the classroom.<br />
• The Pre-Kindergarten teachers will participate<br />
in Saturday professional development sessions<br />
with Kim Collier/Educational Consulting<br />
Services.<br />
Parental Participation<br />
Communication<br />
• The Pre-K teacher will provide parents with<br />
newsletters to keep parents informed of<br />
concepts being taught in class.<br />
• The Pre-K teacher will utilize personal progress<br />
notes, phone calls, and/ or notes home to inform<br />
parents of their child’s progress in mathematical<br />
development.<br />
• The Pre-K teacher will invite parents to come in<br />
for a scheduled conference at any time of the<br />
year as well as our fall and spring Conference<br />
days.<br />
• Parents shall receive assistance in<br />
understanding such topics as the state’s<br />
academic content and achievement standards,<br />
the assessments being used and how to monitor<br />
their children’s progress and work with<br />
educators to improve their achievement.<br />
• <strong>Schools</strong> shall ensure that information related to<br />
school and parent programs, meetings and other<br />
activities is sent to the parents of participating<br />
children in a format, and, to the extent<br />
practicable, in a language the parents can<br />
understand.<br />
Learning at Home<br />
• Weekly “Family Homework” is sent to parents<br />
with hands-on learning activities for parents to<br />
do with students related to the math concepts<br />
being taught that week.<br />
• <strong>Schools</strong> shall provide materials and training,<br />
such as literacy training and training on how to<br />
use technology, to help parents work with their<br />
children to improve achievement.<br />
<strong>Anderson</strong> <strong>Elementary</strong> SiPlan Page 45
Focus of Improvement: Kindergarten Mathematics<br />
School Improvement and Achievement Plan<br />
School: <strong>Anderson</strong> <strong>Elementary</strong> School Year: 2008-2009<br />
Goal: All kindergarteners will acquire the basic mathematical skills necessary to be successful<br />
in first grade as determined by district-wide assessment.<br />
Achievement Objective: All kindergarteners will be able to achieve mastery of basic<br />
kindergarten level math concepts in the area of Patterns/Sort and group objects 1.1; Number<br />
Sense/Count forward to twenty and backward from ten 2.3; Number Sense/Identify and create<br />
sets of objects zero through ten 2.5<br />
Benchmark: Students will demonstrate mastery of Kindergarten math skills by scoring 80% or<br />
better on the Growing with Math Comprehensive Assessment Interview and Kindergarten<br />
Screening.<br />
Interventions / Strategies<br />
Patterns/Sort and group objects 1.1<br />
The Kindergarten Teachers will provide daily<br />
opportunities for sorting objects by color, size and<br />
shape. Using math manipulatives to solve simple<br />
patterns, the children will be able to explain verbally<br />
what the objects have in common and verbally identify<br />
the pattern.<br />
Number Sense/Count forward to twenty and backward<br />
from ten 2.3<br />
The Kindergarten Teachers will use every opportunity to<br />
have the children verbally count during the school day.<br />
Number Sense/Identify and create sets of objects zero<br />
through ten 2.5<br />
Kindergarten teachers will provide repeated exposure to<br />
creating sets in small group instruction and at math<br />
centers. Opening activities such as counting on the<br />
calendar, counting the number of days in school,<br />
counting items in collections, and counting students will<br />
also be used.<br />
Instructional Technology Integrated<br />
Strategies<br />
Patterns/Sort and group objects 1.1<br />
Teachers may integrate technology by providing online<br />
games sites, such as: www.starfall.com and<br />
www.prometheanplanet.com for independent practice or<br />
learning centers.<br />
Number Sense/Count forward to twenty and backward<br />
from ten 2.3<br />
Teachers will use Kidspiration to create visual<br />
representations for use in mathematics development.<br />
Teachers will use websites, such as:<br />
www.prometheanplanet.com as models for mathematics<br />
skill practice.<br />
Number Sense/Identify and create sets of objects zero<br />
through ten 2.5<br />
Benchmark Assessments<br />
Daily and Weekly Assessments<br />
• Teacher observations of daily participation/work<br />
and flexible group work will give an informal<br />
view of student development.<br />
• Teacher-made tests will be administered as<br />
needed.<br />
• A portfolio of students’ work will be kept to note<br />
progress in the area of mathematics.<br />
Periodic<br />
• Quarterly Progress notes<br />
• Growing with Math assessments will be<br />
administered periodically to assess student<br />
understanding of standards.<br />
• Individual assessments will provide informal<br />
views of student math development.<br />
Annually<br />
• Kindergarten Growth Inventory post test will<br />
measure progress.<br />
See next page for continuation of this action plan.<br />
<strong>Anderson</strong> <strong>Elementary</strong> SiPlan Page 46
Teachers will use Kidspiration to create visual<br />
representations for use in mathematics development.<br />
Teachers will use websites, such as:<br />
http://www.bbc.co.uk/schools/laac/numbers/chi.shtml as<br />
models for mathematics skill practice.<br />
Professional Development<br />
Parental Participation<br />
Communication:<br />
• Students’ work will be sent home regularly to<br />
acquaint parents with instructional focus.<br />
• Teachers will provide parents with newsletters<br />
to communicate skills being covered in class.<br />
• Kindergarten teachers will use Thursday folders<br />
to send home weekly communication to parents.<br />
• Kindergarten teachers will send home progress<br />
reports to show student development of skills.<br />
• Parent/Child Make-n-Take activity will inform<br />
parents about what students are learning and<br />
ways they can enhance their student’s learning.<br />
• “Parent/Teacher conferences will help parents<br />
and teachers communicate student’s progress<br />
in relation to effective strategies in the<br />
classroom and at home.<br />
Learning at Home:<br />
• Parents will be encouraged to take their children<br />
to the public library.<br />
• Various family homework projects throughout<br />
the school year.<br />
• Kindergarten teachers will send home<br />
homework assignments to re-enforce math skills<br />
worked on in class.<br />
• Kindergarten teachers will encourage parents to<br />
work with their child on math skills.<br />
• Additionally, kindergarten teachers will continue<br />
to meet weekly and at various times to review<br />
and discuss interventions, strategies, and<br />
activities.<br />
• Kindergarten teachers will participate in inservice<br />
programs with district resource teachers,<br />
school librarian and grade level teams to identify<br />
ways to increase student awareness of<br />
measurement using nonstandard units of<br />
measurement and comparing numbers.<br />
• Kindergarten teachers will participate in<br />
Saturday professional development sessions<br />
with Kim Collier/Educational Consulting<br />
Services.<br />
<strong>Anderson</strong> <strong>Elementary</strong> SiPlan Page 47
Focus of Improvement: First Grade Mathematics<br />
School Improvement and Achievement Plan<br />
School: <strong>Anderson</strong> <strong>Elementary</strong> School Year: 2008-2009<br />
Goal: All first grade students will demonstrate mathematics proficiency at grade level or<br />
improve by nine months over the previous year’s scores.<br />
Achievement Objective: All first grade students will be able to demonstrate proficiency at<br />
grade level or show improvement in the areas of Patterns/Describe, extend and create patterns<br />
1.1; Number Sense/Compare and order objects 2.2; Number Operations and<br />
Computation/Develop/apply the concepts of addition and subtraction 3.1 and Number<br />
Sense/Read and write numerals to 100 using verbal, kinesthetic and written skills 2.3.<br />
Benchmark: All students will show 80% mastery, or greater, on the Saxon Math Assessment.<br />
Interventions / Strategies<br />
Patterns/Describe, extend and create patterns 1.1<br />
First grade teachers will provide weekly direct, small group,<br />
paired and individual instruction to utilize manipulatives to<br />
create patterns and sorting attributes. First grade teachers<br />
will use colored cubes of different colors to create and<br />
demonstrate a pattern; the children will then create the<br />
pattern in sequence.<br />
Number Sense/Compare and order objects 2.2<br />
First Grade Teachers will provide many repeated<br />
experiences using hands on methods to compare and order<br />
objects. They will address the concept of more, less and<br />
equal to.<br />
Number Operations and Computation/Develop/apply the<br />
concepts of addition and subtraction 3.1<br />
First Grade Teachers will provide an early introduction of<br />
basic addition and subtraction skills, with ongoing practice<br />
and the concrete use of objects. (Kinesthetic) A weekly<br />
assessment, (ex. FACTS MASTERS) will be given to<br />
monitor students’ progress.<br />
Number Sense/Read and write numerals to 100 using<br />
verbal, kinesthetic, and written skills 2.3<br />
First grade teachers will provide direct instruction, small<br />
group instruction, and repeated exposure to counting<br />
objects. Daily opening activities include the Saxon Math<br />
Meeting Place, which includes calendar, counting money,<br />
and attendance, as well as counting objects in sets,<br />
kinesthetic activities will be used.<br />
Assessments<br />
Daily and Weekly Assessments<br />
• Teacher Observations of daily<br />
participation/work and flexible group work will<br />
give an informal view of student development.<br />
• Saxon Math Assessments<br />
• Teacher made tests will be administered as<br />
needed.<br />
• Specific skills in mathematic homework will be<br />
given to those who may need the extra<br />
practice.<br />
• Teacher observation of daily<br />
participation/work, workbook practice,<br />
student’s use of manipulatives, and flexible<br />
group work will give an informal view of<br />
student development in understanding and<br />
conveying math concepts.<br />
• Homework review and recording will provide<br />
ongoing monitoring of concept knowledge and<br />
will give insight for re-teaching if needed.<br />
Periodic<br />
• Individual Assessments will be given in<br />
Mathematics as needed.<br />
See next page for continuation of this action plan.<br />
Instructional Technology Integrated Strategies<br />
Patterns/Describe, extend and create patterns 1.1<br />
As a technology component of this lesson, students may<br />
extend patterns using the following link<br />
www.prometheanplanet.com or they may create patterns by<br />
Parental Participation<br />
Communication<br />
• Progress reports/report cards will be sent<br />
home at mid-quarter and end of quarter to<br />
inform parents of student progress.<br />
<strong>Anderson</strong> <strong>Elementary</strong> SiPlan Page 48
inserting clip art in Microsoft Word.<br />
Number Sense/Compare and order objects 2.2<br />
First Grade Teachers will provide many repeated<br />
experiences using hands on methods to compare and order<br />
objects. They will address the concept of more, less and<br />
equal to.<br />
Number Operations and Computation/Develop/apply the<br />
concepts of addition and subtraction 3.1<br />
Instructional technology used for this intervention includes<br />
the use of an overhead projector for whole group<br />
instruction. Interactive instructional technology links for<br />
computation are:<br />
http://www.abc.net.au/countusin/games/game8.htm and<br />
http://www.dositey.com/addsub/Mystery4.htm.<br />
Number Sense/Read and write numerals to 100 using<br />
verbal, kinesthetic, and written skills 2.3<br />
Teachers will use CompassLearning, along with<br />
www.prometheanplanet.com for instructional technology<br />
links to this standard.<br />
• First Grade Teachers will utilize personal<br />
progress notes, phone calls, and/or notes<br />
home to inform parents of their child’s<br />
progress in mathematics.<br />
• First Grade Teachers will invite parents to<br />
come in to a scheduled conference at any time<br />
of the year, to discuss any aspect of their<br />
child’s progress in the area of mathematics.<br />
• <strong>Schools</strong> shall ensure that information related<br />
to school and parent programs, meetings and<br />
other activities is sent to the parents of<br />
participating children in a format, and, to the<br />
extent practicable, in a language the parents<br />
can understand. (Communication)<br />
Learning at Home<br />
• First Grade Teachers will provide Skill Specific<br />
Homework in the areas of math that a child<br />
may be having trouble with.<br />
• First grade teachers will select specific weekly<br />
homework to monitor student mastery of skills.<br />
• Parents shall receive assistance in<br />
understanding such topics as the<br />
state’s academic content and<br />
achievement standards, the<br />
assessments being used and how to<br />
monitor their children’s progress and<br />
work with educators to improve their<br />
achievement. (and Parenting)<br />
Professional Development<br />
• First Grade teachers will participate in in-service<br />
programs with district resource teachers, school<br />
librarian and grade level teams to identify ways to<br />
increase student awareness of place value and<br />
comparing numbers.<br />
• First grade teachers will participate in Saturday<br />
professional development sessions with Kim<br />
Collier/Educational Consulting Services.<br />
<strong>Anderson</strong> <strong>Elementary</strong> SiPlan Page 49
Focus of Improvement: Second Grade Mathematics<br />
School Improvement and Achievement Plan<br />
School: <strong>Anderson</strong> <strong>Elementary</strong> School Year: 2008-2009<br />
Goal: All second grade students will achieve mathematics proficiency at grade level or above<br />
on district-wide assessment utilized.<br />
Achievement Objective: All students will be able to demonstrate Number Operations and<br />
Computation/Develop/apply the concepts of addition and subtraction 3.1; Number<br />
Sense/Place value 2.1; Geometry and Measurement/Measurement 4.2; Geometry and<br />
Measurement/Time and Money 4.3 on grade level by the end of the school year.<br />
Benchmark: All students will show 80% mastery, or greater, on the Standard District<br />
Curriculum Benchmark Assessments.<br />
Interventions / Strategies<br />
Number Operations and Computation/Develop/apply<br />
the concepts of addition and subtraction 3.1<br />
Using Marzano’s strategy of Classroom Practice and<br />
Cooperative Learning, students will improve their fluency<br />
with basic addition facts. Sitting in groups of four<br />
students, each group will need to have a small box or can<br />
and a set of 20 counters. Students will cut out practice<br />
addition facts on the following page and put them into<br />
their group’s box or can. One student will pull out a card<br />
with an addition fact on it, will read the card aloud, and try<br />
to give the appropriate answer. The group will check their<br />
member’s math and if correct the student will keep the<br />
card. If group members believe the answer to be<br />
incorrect, they will use counters to show the correct<br />
answer. The incorrect card will go back into the can, and<br />
play passes to the next member of the group. Play will<br />
continue until all cards have been pulled from the can<br />
and none remain. If a student picks a “Lucky Day” card,<br />
all members must give their cards to that student. When<br />
there are no cards left in play, the student with the most<br />
cards in his/her hand is declared the winner.<br />
Geometry and Measurement/Measurement 4.2<br />
Second grade teachers will access prior knowledge with<br />
a graphic organizer - KWHL (what they Know, Want to<br />
know, How they will learn the information, what they<br />
Learned) chart - before the children begin measuring<br />
objects of their choice with standard and non-standard<br />
units. Teachers will provide students will a visual for<br />
identifying different ways of measuring things in the<br />
classroom and beyond<br />
Geometry and Measurement/Time and Money 4.3<br />
Second grade teachers will use direct instruction and<br />
Marzano’s massed and distributed practice to teach<br />
students how to determine amounts of money using<br />
pennies, nickels, dimes, quarters, and half-dollars; how to<br />
determine whether to add or subtract to solve a word<br />
problem; how to solve one-step word problems; and how<br />
to determine the amounts of change by subtracting.<br />
Number Sense/Place Value 2.1<br />
Second grade teachers will use direct instruction and<br />
Marzano’s massed and distributed practice to teach<br />
Benchmark Assessments<br />
Daily and Weekly Assessment:<br />
• Teacher Observations of daily participation of<br />
work and flexible group work will give an<br />
informal view of student achievement with<br />
objectives.<br />
• Teachers will administer weekly timed test<br />
demonstrating fluency with the basic addition<br />
and subtraction facts and fact families to 18.<br />
• Saxon Math Assessments will be given after<br />
every ten to fifteen lessons.<br />
Periodic<br />
• District-provided tests will be administered<br />
during the first and fourth quarter.<br />
See next page for continuation of this action plan.<br />
<strong>Anderson</strong> <strong>Elementary</strong> SiPlan Page 50
students how to determine the place value and name of<br />
numbers using a concrete model.<br />
Instructional Technology Integrated<br />
Strategies<br />
Number Operations and Computation/Develop/apply<br />
the concepts of addition and subtraction 3.1<br />
Students can choose a number of activities and practice<br />
from the following sites:<br />
www.amblesideprimary.com<br />
www.funbrain.com/brain/mathbrain/mathbrain.html<br />
Geometry and Measurement/Measurement 4.2<br />
Technology connections may be found on interactive<br />
educational websites as well as assigned activities from<br />
CompassLearning.<br />
Geometry and Measurement/Time and Money 4.3<br />
To integrate instructional technology, second grade<br />
students will practice money and time skills at the<br />
website www.internet4classrooms.com.<br />
Number Sense/Place Value 2.1<br />
To integrate instructional technology, second grade<br />
students will practice money and time skills at the<br />
website www.internet4classrooms.com<br />
Professional Development<br />
• Second Grade teachers will participate in inservice<br />
programs with district resource teachers,<br />
school librarian and grade level teams to identify<br />
ways to increase student awareness of time and<br />
money.<br />
• Second grade teachers will participate in<br />
Saturday professional development sessions with<br />
Kim Collier/Educational Consulting Services.<br />
Parental Participation<br />
Communication<br />
• Progress reports/report cards will be sent<br />
home at mid-quarter and end of quarter to<br />
inform parents of student progress.<br />
• Second Grade Teachers will utilize personal<br />
progress notes, phone calls, and/or notes<br />
home to inform parents of their child’s progress<br />
in mathematics.<br />
• Second Grade Teachers will invite parents to<br />
come in to a scheduled conference at any time<br />
of the year, to discuss any aspect of their<br />
child’s progress in the area of mathematics.<br />
• <strong>Schools</strong> shall ensure that information related to<br />
school and parent programs, meetings and<br />
other activities is sent to the parents of<br />
participating children in a format, and, to the<br />
extent practicable, in a language the parents<br />
can understand. (Communication)<br />
Learning at Home<br />
• Second Grade Teachers will provide Skill<br />
Specific Homework in the areas of math that a<br />
child may be having trouble with.<br />
• Second grade teachers will select specific<br />
weekly homework to monitor student mastery<br />
of skills.<br />
• Parents shall receive assistance in<br />
understanding such topics as the<br />
state’s academic content and<br />
achievement standards, the<br />
assessments being used and how to<br />
monitor their children’s progress and<br />
work with educators to improve their<br />
achievement. (and Parenting)<br />
BALANCE OF THE PAGE LEFT BLANK<br />
<strong>Anderson</strong> <strong>Elementary</strong> SiPlan Page 51
Focus of Improvement: 3 rd Grade Mathematics<br />
School Improvement and Achievement Plan<br />
School: <strong>Anderson</strong> <strong>Elementary</strong> School Year: 2008-2009<br />
Goal: All third grade students will demonstrate math proficiency at grade level or higher on the<br />
Oklahoma Core Curriculum Test and the quarterly benchmark test.<br />
Achievement Objective: At a current median score of 25% Number Operations &<br />
Computation/Estimation 3.1 at least half of the third grade students will score 50% or above; at<br />
a current median score of 25% Number Operations & Computation/Money Problems 3.3 at<br />
least half of the third grade students will score 50% or above; at a current median score of 25%<br />
Geometry and Measurement/Measurement 4.2 at least half of the third grade students will<br />
score 50% or above; at a current median score of 25% Number Operations &<br />
Computation/Multiplication 3.2 at least half of the third grade students will score 50% or above;<br />
at a current median score of 29% Number Sense 2.0 at least half of the third grade students<br />
will score 43% or above; at a current median score of 33% Data Analysis & Probability 5.0 at<br />
least half of the third grade students will score 50% or above. These measures of progress will<br />
be achieved on the Standard District Curriculum Assessments and OCCT during the 2009<br />
testing cycles.<br />
Benchmark: Minimally, third grade students will score an 80% or higher as documented on the<br />
spring OCCT.<br />
Interventions / Strategies<br />
Number Operations & Computation/Estimation 3.1 Third<br />
grade teachers will use Marzano’s strategy of<br />
classroom practice to have students write their own<br />
story problems using 3 & 4 digit numbers. First,<br />
teachers will model how to write a story problem. Then,<br />
the teacher guides the students through writing a class<br />
story problem on the SmartBoard. Next, each student<br />
writes one story problem using 3 & 4 digit numbers.<br />
Finally, each student makes a PowerPoint slide show of<br />
their story problem on the lab computers. They will<br />
project their problem to the class on the SmartBoard<br />
screen. Students will take turns rounding the numbers<br />
to estimate the answers.<br />
Number Operations & Computation/Money Problems<br />
3.3<br />
Third grade teachers will use Marzano’s strategy of<br />
classroom practices and cooperation to help students<br />
understand math operations involving addition and<br />
subtraction involving money. Working in groups or with<br />
peers, students will talk through money word problems<br />
making certain to identify the appropriate operation, and<br />
then solve the problem. Students will be able to use<br />
math money manipulatives to help solve the money<br />
problems. Third grade teachers will reinforce students<br />
for correctly solving the problems.<br />
Geometry and Measurement/Measurement 4.2<br />
Third grade teachers will provide rulers for measuring to<br />
the nearest centimeter and quarter inch (concrete<br />
means of understanding objective). They will also<br />
provide balances and scales for measuring in<br />
customary and metric units. They will provide a KWHL<br />
Assessments<br />
Daily and Weekly<br />
Daily and weekly assessments<br />
- Teacher made tests will be administered as<br />
appropriate<br />
- Student journals will show student thought<br />
process related to the above objectives.<br />
Quarterly:<br />
- District-provided tests will provide teachers with<br />
a formal view of student progress related to the<br />
specific objectives listed above.<br />
- STAR Math assessments will be administered<br />
one per quarter<br />
Yearly:<br />
- OCCT test will provide a formal cumulative view<br />
of student progress related to the above<br />
objectives.<br />
See next page for continuation of this action plan.<br />
<strong>Anderson</strong> <strong>Elementary</strong> SiPlan Page 52
chart for measurement in which the students organize<br />
their thoughts prior to measuring with the different tools<br />
as well as access their prior knowledge with which to<br />
build on. They have a say in what they want to measure<br />
and learn about measurement as well as how they will<br />
measure certain things, making the experience more<br />
meaningful. They use the L to record how they<br />
measured certain objects using the given tools. Teacher<br />
provides a vocabulary chart of key words used when<br />
measuring (such as “quarter inch”).<br />
Number Operations & Computation/Multiplication 3.2<br />
Using Marzano’s strategy of Classroom Practice and<br />
Cooperative Learning, students will improve their<br />
fluency with basic multiplication facts using drill and<br />
practice daily.<br />
Number Sense 2.0<br />
Third grade teachers will use meta cognitive strategies<br />
to teach students how to order fractions and decimals<br />
on a number line. Asking students to verbalize their<br />
thinking while working helps students become aware of<br />
their thinking process and improve problem-solving so<br />
that they become aware of the strategies they use.<br />
Using money as a reference activates students’<br />
previous knowledge and helps students use the decimal<br />
system efficiently.<br />
Data Analysis & Probability 5.0<br />
The third grade teachers will utilize Marzano’s graphic<br />
organizers to help the student organize student data.<br />
The students will collect various kinds of data, then<br />
analyze the data, create the appropriate graph, and<br />
display it for other students to see. The students will<br />
also be able to read and interpret other graphs.<br />
Instructional Technology Integrated Strategies<br />
Computation / Estimation 3.1<br />
Third grade teachers will prescribe online activities<br />
based on student’s math levels in Compass Learning<br />
Odyssey to build estimation skills. Analyzing student’s<br />
progress will be conducted weekly.<br />
Computation / Money Problems 3.3<br />
Third grade teachers will prescribe online activities<br />
based on student’s math levels in Compass Learning<br />
Odyssey to build skills in solving problems involving<br />
money. Analyzing student’s progress will be conducted<br />
weekly. Procedural specificity will be detailed in<br />
individual teacher lesson plans.<br />
Geometry and Measurement/Measurement 4.2<br />
Students can visit the following website in pairs or small<br />
groups<br />
www.shodor.org/interactivate/activities;perimeter/index.htm.<br />
for more practice with perimeter and area.<br />
Number Operations & Computation/Multiplication 3.2<br />
Teachers will use www.mathfactory.com to practice<br />
their multiplication facts. They will also use strategies<br />
from www.prometheanplanet.com.<br />
Number Sense 2.0<br />
Teachers will use CompassLearning in which students<br />
will engage with mathematics programs to add further<br />
practice for reading, writing, and ordering whole<br />
numbers and fractions.<br />
Parental Participation<br />
Communication:<br />
- Progress reports will be used by teachers to<br />
communicate student progress as it relates to<br />
their mathematical understanding.<br />
Learning at home:<br />
- Homework will give added practice of the<br />
learned skills.<br />
- Third-grade teachers will provide such materials<br />
as addition/subtraction/fact family practice<br />
tables, times tables, study guides, etc., as<br />
needed, for the parents to study with their child<br />
at home.<br />
- Daily math homework will be assigned, to be<br />
completed with the assistance of the parent as<br />
needed by the child.<br />
See next page for continuation of this action plan.<br />
<strong>Anderson</strong> <strong>Elementary</strong> SiPlan Page 53
Data Analysis & Probability 5.0<br />
Teachers will use CompassLearning in which students<br />
will engage with mathematics programs to add further<br />
practice in data analysis and probability.<br />
Professional Development<br />
• Third grade teachers will participate in Saturday<br />
professional development sessions with Kim<br />
Collier/Educational Consulting Services.<br />
• Third grade teachers will participate in vertical<br />
articulation meetings presented by District<br />
Instructional Facilitators.<br />
• Third grade teachers will participate in<br />
Unpacking the Standards professional<br />
development given prior to each Benchmark<br />
Unit test.<br />
BALANCE OF THE PAGE LEFT BLANK<br />
<strong>Anderson</strong> <strong>Elementary</strong> SiPlan Page 54
Focus of Improvement: Fourth Grade Mathematics<br />
School Improvement and Achievement Plan<br />
School: <strong>Anderson</strong> <strong>Elementary</strong> School Year: 2008-2009<br />
Goal: All fourth grade students will demonstrate mathematics proficiency at grade level or<br />
above on the OCCT.<br />
Achievement Objective: At a current median score of 25% Number Sense/Multiplication 3.1<br />
at least half of the fourth grade students will score 50% or above; at a current median score of<br />
25% Geometry and Measurement/Measurement 4.4 at least half of the fourth grade students<br />
will score 50% or above; and at a current median score of 27% Number Operations &<br />
Computation 3.0 at least half of the fourth grade students will score 36% or above. These<br />
measures of progress will be achieved on the Standard District Curriculum Assessments and<br />
OCCT during the 2009 testing cycles.<br />
Benchmark: Minimally, the majority of all fourth grade students will score an 80% or higher as<br />
demonstrated on the spring OCCT.<br />
Interventions / Strategies<br />
Assessments<br />
Number Sense/Multiplication 3.1<br />
Fourth grade teachers will use direct instruction and<br />
concrete models to teach multiplication of 2 and 3 digit<br />
numbers with regrouping.<br />
Geometry and Measurement/Measurement 4.4<br />
Using Marilyn Burns’ strategy of real world problem<br />
solving, teachers will present math activities involving<br />
money, time, and temperature using real world<br />
contexts.<br />
Number Operations & Computation 3.0<br />
Teachers will use direct instruction and concrete<br />
models to teach multiplication of 2 and 3 digit numbers<br />
with regrouping, using base-ten blocks and place value<br />
mats.<br />
Daily/ Weekly:<br />
• Teacher observation of daily participation,<br />
assignment completion, and/or group work will<br />
give an informal view of student progress.<br />
• Teacher-made tests will be administered as<br />
needed.<br />
• Math tests over target areas will provide a formal<br />
view of the child’s understanding related to the<br />
desired objective.<br />
• Saxon Math Assessments<br />
Periodically:<br />
• Teacher-made tests will be administered as<br />
needed.<br />
• Standard District Curriculum tests (every 6<br />
weeks)<br />
Annually:<br />
• OCCT in the spring<br />
• District Pre-/Post- Benchmark tests will be<br />
administered in the fall and spring<br />
See next page for continuation of this action plan.<br />
<strong>Anderson</strong> <strong>Elementary</strong> SiPlan Page 55
Instructional Technology Integrated<br />
Strategies<br />
Number Sense/Multiplication 3.1<br />
Teachers will utilize the multiplication.com website to<br />
give students opportunities to practice and review basic<br />
multiplication facts. Teachers will also use Compass<br />
Learning aligned assignments to reinforce this skill.<br />
Geometry and Measurement/Measurement 4.4<br />
The fourth grade teachers will utilize the computer lab<br />
and the computers in the classroom. The students will<br />
be exposed to various websites such as<br />
www.funbrain.com. Teachers will also utilize Safari<br />
Montage for math literature and to provide real world<br />
connections.<br />
Number Operations & Computation 3.0<br />
The students will use Compass Learning software to<br />
increase their proficiency solving computation<br />
problems. Teachers will also use the Promethean<br />
Board and Math Solutions manipulatives.<br />
Parental Participation<br />
Communication:<br />
• Progress reports/report cards<br />
• Teachers will use progress reports to<br />
communicate to parents the children’s progress<br />
related to their mathematical development.<br />
Learning at Home:<br />
• Math homework for additional practice on<br />
learned concepts daily.<br />
• Homework will provide opportunities to extend<br />
the learned skills to the home environment and<br />
allow students further practice.<br />
Parental Involvement:<br />
• Parents shall receive assistance in<br />
understanding such topics as the state’s<br />
academic content and achievement<br />
standards, the assessments being used and<br />
how to monitor their children’s progress and<br />
work with educators to improve their<br />
achievement.<br />
• <strong>Schools</strong> shall ensure that information related to<br />
school and parent programs, meetings and other<br />
activities is sent to the parents of participating<br />
children in a format, and, to the extent practicable,<br />
in a language the parents can understand.<br />
Professional Development<br />
• Grade level team meetings with Instructional<br />
Facilitator and academic coaches<br />
• In-building training in Compass Learning<br />
software<br />
• Fourth grade teachers will participate in<br />
Saturday professional development sessions<br />
with Kim Collier/Educational Consulting<br />
Services.<br />
BALANCE OF THE PAGE LEFT BLANK<br />
<strong>Anderson</strong> <strong>Elementary</strong> SiPlan Page 56
Focus of Improvement: 5 th Grade Mathematics<br />
School Improvement and Achievement Plan<br />
School: <strong>Anderson</strong> <strong>Elementary</strong> School Year: 2008-2009<br />
Goal: All fifth grade students will demonstrate mathematics proficiency at grade level or above<br />
on Oklahoma Core Curriculum Test and the Benchmark Unit Assessments benchmark test.<br />
Achievement Objective: At a current median score of 25% Geometry &<br />
Measurement/Convert Measurements 4.5 at least half of the fifth grade students will score 50%<br />
or above; at a current median score of 50% Number Sense/Fraction/Decimal/Percent 2.1 at<br />
lease half of the fifth grade students will score 75% or above; and at a current median score of<br />
50% Geometry and Measurement/Perimeter/Area 4.2 at least half of the fifth grade students<br />
will score 75% or above. These measures of progress will be achieved on the Standard District<br />
Curriculum Assessments and OCCT during the 2009 testing cycles.<br />
Benchmark: Minimally, the majority of all fifth grade students will score an 80% or higher as<br />
demonstrated on the spring OCCT.<br />
Interventions / Strategies<br />
Geometry & Measurement/Convert<br />
Measurements 4.5<br />
Fifth grade teachers will introduce tools of<br />
measurement. Teachers will use Marzano’s<br />
strategy of cooperative learning and generating<br />
and testing hypotheses to allow students to<br />
manipulate various types of measurement tools<br />
and complete tasks involving graphing<br />
temperatures, measuring set areas and weighing<br />
amounts.<br />
Number Sense/Fraction/Decimal/Percent 2.1<br />
Using Marzano’s strategy of Classroom Practice<br />
and Cooperative Learning, students will compare<br />
and order whole numbers and decimals to the<br />
thousandths place. Teachers will need to have<br />
available an 11x18 sheet of construction paper cut<br />
in half horizontally and one number cube for each<br />
student. The class should be divided into<br />
heterogeneous groups of four. Step One: Students<br />
will fold their construction paper into five equal<br />
sections and will draw a decimal point in the<br />
second box from the left. Step Two: Each student<br />
will roll his/her number cube and will fill the<br />
remaining three spaces on the construction paper<br />
in any order he/she chooses. Step Three: The<br />
group will work cooperatively to put their four<br />
numbers in numerical order paying particularly<br />
close attention to the thousandth place. Step Four:<br />
Each student in the group will write their numbers<br />
down in order on a sheet of paper for assessment<br />
purposes. The assignment can be repeated by<br />
flipping the construction paper over to the other<br />
side. Step Five: Each group will trade all five<br />
pieces of construction paper with another group<br />
and will practice the assignment with the other<br />
group’s set of numbers, recording their answers on<br />
their papers to be assessed by the teacher. Step<br />
Six: The teacher will lead the students in putting<br />
Assessments<br />
Daily and Weekly:<br />
• Daily participation observation<br />
• Teacher-made Tests<br />
• Daily Work<br />
• Weekly Homework<br />
• Mathematical Portfolios<br />
Periodic:<br />
• Standard District Curriculum tests (every 6 weeks)<br />
Annually:<br />
• OCCT in the spring<br />
See next page for continuation of this action plan.<br />
<strong>Anderson</strong> <strong>Elementary</strong> SiPlan Page 57
the class set of the number strips in numerical<br />
order. Develop a reference sheet of fraction<br />
equivalencies for students to keep at desks.<br />
Provide practice in fractions and decimals by using<br />
computer software programs that give the student<br />
immediate feedback.<br />
Geometry and Measurement/Perimeter/Area 4.2<br />
Fifth grade teachers will use direct instruction and<br />
Marzano’s massed and distributed practice to<br />
teach students how to find the perimeter of simple<br />
polygons and the area of a rectangle. Students will<br />
write the steps for finding area and perimeter in<br />
their math notebooks.<br />
Parental Participation<br />
Communication:<br />
• Fifth grade teachers will send Thursday folders home<br />
with updates of academic objectives.<br />
• Parents shall receive assistance in<br />
understanding such topics as the state’s<br />
academic content and achievement<br />
standards, the assessments being used and<br />
how to monitor their children’s progress and<br />
work with educators to improve their<br />
achievement. (Parenting, Learning at Home)<br />
• <strong>Schools</strong> shall ensure that information related to<br />
school and parent programs, meetings and other<br />
activities is sent to the parents of participating<br />
children in a format, and, to the extent practicable, in<br />
a language the parents can understand.<br />
Learning at home:<br />
• Homework that reinforces math objectives will be<br />
completed at home.<br />
Instructional Technology Integrated<br />
Strategies<br />
Geometry & Measurement/Convert<br />
Measurements 4.5<br />
Teachers will send small groups or pairs to<br />
computers to visit<br />
www.hbschool.com/elab/act_3_24.html where they<br />
will practice measuring using a virtual ruler. They<br />
will print off the recording sheet for the activity and<br />
turn it in to the teacher.<br />
Number Sense/Fraction/Decimal/Percent 2.1<br />
Teachers will use Compass Learning aligned<br />
lessons to assist with this skill. They will also<br />
utilize activities on www.prometheanplanet.com.<br />
Geometry and Measurement/Perimeter/Area 4.2<br />
To integrate instructional technology, fifth grade<br />
students will explore perimeter and its relationship<br />
to the corresponding area. Using the online Area<br />
Explorer, students will choose the desired<br />
perimeter using the slide at the bottom of the grid<br />
applet. Next, the students will type in the correct<br />
area and click “Check Answer.” Then they will<br />
click the button “Draw a New Shape.” Students<br />
can click “Show Score” to keep a record of their<br />
explored perimeters and areas.<br />
www.shodor.org/interactivate/activities/perm/index.<br />
html.<br />
Professional Development<br />
• Grade level team meetings with Instructional<br />
Facilitator and academic coaches<br />
• In-building training in Compass Learning software<br />
• Fourth grade teachers will participate in Saturday<br />
professional development sessions with Kim<br />
Collier/Educational Consulting Services.<br />
BALANCE OF THE PAGE LEFT BLANK<br />
<strong>Anderson</strong> <strong>Elementary</strong> SiPlan Page 58
4. ACTION PLANS BY INDIVIDUAL GRADE LEVEL<br />
4.3 Attendance<br />
Focus of Improvement: Attendance<br />
School Improvement and Achievement Plan<br />
School: <strong>Anderson</strong> School School Year: 2008-2009<br />
Goal: 96% of <strong>Anderson</strong> students will attend school daily (and in a timely arrival manner) ready<br />
to learn.<br />
Achievement Objective: 96% of all <strong>Anderson</strong> students will be on time and ready to learn each<br />
day.<br />
Benchmark: Current student attendance is steady at 95.2%. We will continue to show an<br />
increase steadily each quarter to reach 96% as demonstrated by 2009 AYP data.<br />
Interventions / Strategies<br />
According to AYP, <strong>Anderson</strong> <strong>Elementary</strong> made AYP<br />
based on a 95.2% attendance rate, which is above the<br />
minimum standard. Attendance at <strong>Anderson</strong> will be<br />
monitored monthly, and incentives will be in place to<br />
insure growth in the attendance area.<br />
Instructional Technology Integrated<br />
Strategies<br />
Teachers will be required to put attendance online on<br />
the Gradespeed. We will also be graphing attendance<br />
regularly so stakeholders can monitor progress.<br />
Assessments<br />
• Monthly attendance will be monitored through the<br />
Gradespeed program.<br />
• Goals will be set monthly, and students will know the<br />
attendance rate each month. Celebrations will be<br />
held if goal is met monthly. These goals will be made<br />
known in our monthly assembly.<br />
Parental Participation<br />
• <strong>Schools</strong> shall ensure that information related to<br />
school and parent programs, meetings, and<br />
other activities is sent to the parents of<br />
participating children in a format, and, to the<br />
extent practicable, in a language parents can<br />
understand.<br />
Professional Development<br />
• Teachers will be trained in Gradespeed to learn<br />
how to put attendance online to better insure<br />
accuracy.<br />
BALANCE OF THE PAGE LEFT BLANK<br />
<strong>Anderson</strong> <strong>Elementary</strong> SiPlan Page 59
4. ACTION PLANS BY INDIVIDUAL GRADE LEVEL<br />
4.4 Climate / Behavior<br />
Focus of Improvement: Climate/Behavior<br />
School Improvement and Achievement Plan<br />
School: <strong>Anderson</strong> School School Year: 2008-2009<br />
Goal: All students will positively contribute to a safe and nurturing school environment.<br />
Achievement Objective: Students will be able to solve interpersonal problems in school<br />
without behavior referrals. Students will demonstrate the Life Skills and Community Guidelines<br />
throughout each school day.<br />
Benchmark: Student discipline referrals will decrease 50% from the previous school year, with<br />
quarterly monitoring in place.<br />
Interventions / Strategies<br />
The Eat, Exercise, Excel Program has been<br />
implemented at <strong>Anderson</strong> in an effort to decrease office<br />
referrals. The program is research based and consists<br />
of five components surrounding nutrition and exercise.<br />
Since implementation of the program, referrals<br />
decreased by 63% in the first year.<br />
Benchmark Assessments<br />
• Referrals will be monitored monthly.<br />
• Teachers will receive reports with graphs<br />
and percentages in order to monitor<br />
classroom referrals.<br />
• Graphs will be posted so students can<br />
monitor classroom referrals.<br />
Instructional Technology Integrated<br />
Strategies<br />
Referrals will be monitored and reported using<br />
computer programs. Graphs will be posted with<br />
applicable information.<br />
Parental Participation<br />
• <strong>Schools</strong> shall ensure that information related to<br />
school and parent programs, meetings, and<br />
other activities is sent to the parents of<br />
participating children in a format, and, to the<br />
extent practicable, in a language parents can<br />
understand.<br />
Professional Development<br />
• Teachers will be further trained on classroom<br />
management strategies and on the<br />
implementation of the Eat, Exercise, Excel<br />
program.<br />
BALANCE OF THE PAGE LEFT BLANK<br />
<strong>Anderson</strong> <strong>Elementary</strong> SiPlan Page 60
5. THREE (3) YEAR TIME LINE<br />
FOR IMPLEMENTATION, REVIEW and REVISION<br />
SIPlan and Process Time Line for <strong>Anderson</strong> School<br />
Month<br />
June 06<br />
July 06<br />
August 06<br />
September 06<br />
October 06<br />
November 06<br />
December 06<br />
January 07<br />
February 07<br />
March 07<br />
April 07<br />
May 07<br />
June 07<br />
October 2007<br />
November 2007<br />
December 2007<br />
January 2008<br />
February 2008<br />
March 2008<br />
April 2008<br />
May 2008<br />
June 2008<br />
October 2008<br />
December 2008<br />
School Improvement Plan (SIPlan) Chronology<br />
Have individual building SIPlan Teams revise the SIPlan in response to an<br />
analysis of state-provided data from Spring 05 testing.<br />
Submit the revised SIPlan for ESC review.<br />
School leadership team will review and revise SIPlan<br />
School Efficacy Trainers will evaluate and provide feedback on a one to one<br />
session with the principal.<br />
The individual SIPlan team will make final necessary revisions and SIPlan will<br />
be submitted to School Efficacy Trainers for first electronic evaluation before<br />
submission. It will be submitted to the ESC prior to October 18.<br />
The individual SiPlan team will prepare for District level team visit<br />
Using real-time assessments during the course of the school year, the SIPlan<br />
was reviewed and revised.<br />
Using real-time assessments during the course of the school year, the SIPlan<br />
was reviewed and revised.<br />
Parent Session will be held to present SiPlan<br />
Using real-time assessments during the course of the school year, the SIPlan<br />
was reviewed and revised.<br />
Using real-time assessments during the course of the school year, the SIPlan<br />
was reviewed and revised.<br />
Using real-time assessments during the course of the school year, the SIPlan<br />
was reviewed and revised.<br />
Data Analysis for the necessary revisions of the SIPlan will begin based on<br />
data disaggregation of the ’06-07 data<br />
Attend SiPlan Learning Circle<br />
The individual SiPlan team will make final necessary revisions and SiPlan will<br />
be submitted to School Efficacy Trainers for first electronic evaluation before<br />
submission. It will be submitted to the ESC prior to November 9.<br />
Using real-time assessments during the course of the school year, the SIPlan<br />
was reviewed and revised.<br />
Using real-time assessments during the course of the school year, the SIPlan<br />
was reviewed and revised.<br />
Parent Session will be held to present SiPlan<br />
Using real-time assessments during the course of the school year, the SIPlan<br />
was reviewed and revised.<br />
Using real-time assessments during the course of the school year, the SIPlan<br />
was reviewed and revised.<br />
Using real-time assessments during the course of the school year, the SIPlan<br />
was reviewed and revised.<br />
Data Analysis for the necessary revisions of the SiPlan will begin based on<br />
data disaggregation of the ’07-08 data<br />
Attend SiPlan Learning Circle; The individual SiPlan team will make final<br />
necessary revisions and SiPlan will be submitted to School Efficacy Trainers<br />
for first electronic evaluation before submission. It will be submitted to the<br />
ESC prior to October 24 th .<br />
Using real-time assessments during the course of the school year, the SiPlan<br />
<strong>Anderson</strong> <strong>Elementary</strong> SiPlan Page 61
January 2009<br />
February 2009<br />
March 2009<br />
April 2009<br />
May 2009<br />
June 2009<br />
August 2009<br />
was reviewed and revised.<br />
Using real-time assessments during the course of the school year, the SiPlan<br />
was reviewed and revised.<br />
Parent Session will be held to present SiPlan<br />
Using real-time assessments during the course of the school year, the SiPlan<br />
was reviewed and revised.<br />
Using real-time assessments during the course of the school year, the SiPlan<br />
was reviewed and revised.<br />
Using real-time assessments during the course of the school year, the SiPlan<br />
was reviewed and revised.<br />
Data Analysis for the necessary revisions of the SiPlan will begin based on<br />
data disaggregation of the ’08-09 data<br />
Data Analysis for the necessary revisions of the SiPlan will begin based on<br />
data disaggregation of the ’08-09 data<br />
BALANCE OF THE PAGE LEFT BLANK<br />
<strong>Anderson</strong> <strong>Elementary</strong> SiPlan Page 62
6. APPENDICES<br />
Oklahoma State Department of Education<br />
Checklist of the Ten Components of a Schoolwide Site Plan<br />
Statement of Assurances by <strong>Anderson</strong> <strong>Elementary</strong><br />
<strong>Public</strong> Law 107-110, No Child Left Behind Act of 2001 Requirements<br />
(NCLB)<br />
Found on<br />
page(s) #<br />
1. A comprehensive needs assessment of the entire school. 64-65<br />
2. Implementation of school-wide reform strategies that:<br />
3<br />
4<br />
• Provide opportunities for all children to meet proficient and advanced levels<br />
7<br />
of student academic achievement.<br />
• Use effective methods and instructional strategies that are based on<br />
scientifically based research.<br />
“See the<br />
Parental<br />
• Strengthens the core academic program.<br />
Involvement<br />
cell within ALL<br />
• Increases the amount of learning time.<br />
Action Plans.”<br />
• Includes strategies for serving underserved populations (examples:<br />
migrant, economically disadvantaged, and minority students).<br />
• Includes strategies to address the needs of all children in the school, but<br />
particularly low-achieving children and those at risk of not meeting state<br />
standards.<br />
• Address how the school will determine if those needs of the children have<br />
been met.<br />
• Are consistent with and are designed to implement state and local<br />
improvement plans, if any.<br />
3. Instruction by highly qualified teachers. 8<br />
4. High quality and on-going professional development for teachers, principals, and<br />
paraprofessionals (attach professional development plan).<br />
“See the<br />
Professional<br />
Development<br />
cell within ALL<br />
Action Plans.”<br />
5. Strategies to attract high-quality, highly qualified teachers to high-needs schools. 8<br />
6. Strategies to increase parental involvement, such as family literacy<br />
services.<br />
7. Plans for assisting preschool children in the transition from early childhood<br />
programs such as Head Start, Even Start, Early or Reading First to local<br />
elementary school programs.<br />
8. Opportunities and expectations for teachers to be included in the decision<br />
making related to the use of academic assessment results leading to the<br />
improvement of student achievement.<br />
9. Activities and programs at the school level to ensure that students having<br />
difficulty mastering proficient and advanced levels of the academic achievement<br />
standards are provided with effective, timely additional assistance.<br />
10. Coordination and integration of Federal, State and local services and programs,<br />
including programs supported under this Act.<br />
“See the<br />
Parental<br />
Involvement<br />
cell within ALL<br />
Action Plans”<br />
4<br />
7<br />
9<br />
10<br />
11<br />
“See<br />
Intervention<br />
and Strategies<br />
cells within ALL<br />
Action Plans”<br />
3<br />
7<br />
9<br />
10<br />
11<br />
“See<br />
Intervention<br />
and Strategies<br />
cells within ALL<br />
Action Plans”<br />
7<br />
I<br />
I<br />
I<br />
<strong>Anderson</strong> <strong>Elementary</strong> SiPlan Page 63
certify that the above components of our Schoolwide Site Plan are in place, active<br />
and under constant review, modification and improvement.<br />
__________________________________________<br />
Principal’s Signature<br />
_________<br />
Date<br />
<strong>Anderson</strong> <strong>Elementary</strong> SiPlan Page 64
Professional Development<br />
Needs Assessment<br />
2008-2009<br />
Area: 1 Feeder Pattern: McLain School: <strong>Anderson</strong> <strong>Elementary</strong><br />
<strong>Elementary</strong> School<br />
Principal: Brenda <strong>Anderson</strong> PD Site Coordinator: Katherine Thompson<br />
Academic Achievement<br />
□ Fell Short of AYP-In Improvement<br />
□ Met AYP-In Improvement<br />
□ Fell Short of AYP-On Alert<br />
x Successful-Meets AYP<br />
Mathematics<br />
Need(s): PD in SIPlan: Reflective Assessment:<br />
0- P, NS 0- Marzano’s Strategies □ Successful □ Ongoing X Need Support □ Recommendations<br />
K- NS K- Marzano’s Strategies □ Successful Ongoing X Need Support □ Recommendations<br />
1- NS, PV, 1- Peer Coaching □ Successful X Ongoing □ Need Support □ Recommendations<br />
2- GM, DA, P, E 2- Book study □ Successful X Ongoing □ Need Support □ Recommendations<br />
3- P, AR, Computation 3- Peer Coach □ Successful X Ongoing □ Need Support □ Recommendations<br />
4- NO, Comp, GM 4- Peer Coaching □ Successful X Ongoing Need Support □ Recommendations<br />
5- SP, DA, P, AR 5- Peer Coaching □ Successful X Ongoing Need Support □ Recommendations<br />
Data to Support Successful Assessment:<br />
Additional Comments:<br />
Academic Achievement<br />
Language Arts<br />
Need(s): PD in SIPlan: Reflective Assessment:<br />
0- Language/Vocabulary 0- Marzano’s Strategies □ Successful □ Ongoing X Need Support □ Recommendations<br />
K- WP, P, D, Comp K- SRA Training □ Successful X Ongoing □ Need Support □ Recommendations<br />
1- OL, PA, VP 1- Peer Coaching □ Successful X Ongoing □ Need Support □ Recommendations<br />
2- PD, Comp/CL 2- Voyager U □ Successful X Ongoing □ Need Support □ Recommendations<br />
3- V, Comp 3- Voyager U/Peer Coach □ Successful X Ongoing □ Need Support □ Recommendations<br />
4- Comp/CL, V, Comp/Inf/Int 4- Compass PD □ Successful □ Ongoing X Need Support □ Recommendations<br />
5- A/E, C/CL, FL 5- Compass PD □ Successful □ Ongoing X Need Support □ Recommendations<br />
Additional Comments: We are showing gains in these areas, but we need to continue with the support of<br />
the Reading First grant and the district.<br />
<strong>Anderson</strong> <strong>Elementary</strong> SiPlan Page 65
Technology<br />
Need(s): <strong>Anderson</strong> has advanced rapidly in technology. We have added Promethean Boards in every<br />
regular classroom this year. This has allowed us to be a leader in technology in our district. However,<br />
further training in the use of the boards is necessary in order for us to develop and implement consistent<br />
use of the boards.<br />
PD in SIPlan: Further training in Compass Learning is needed. Some teachers still need training in basic<br />
computer use, however, acquiring the Promethean Boards has motivated the staff to become more<br />
technologically knowledgeable.<br />
Reflective Assessment:<br />
□<br />
X<br />
□<br />
Successful – Supported by data including:<br />
Ongoing – Provided by Site funding (and District funding)<br />
Limited Success – Requesting District Support:<br />
□<br />
Unsuccessful – Requesting District Recommendations<br />
Building-Wide Climate/Behavior<br />
Need(s): Tribes Training with the entire faculty and staff. We will be receiving a PBIS program for next<br />
year so we will have onsite counselors to help with major student issues.<br />
PD in SIPlan: Tribes is the training listed in the SiPlan.<br />
Reflective Assessment:<br />
□<br />
□<br />
x<br />
Successful – Supported by data including:<br />
Ongoing – Provided by Site funding<br />
Limited Success – Requesting District Support: We need a week long Tribes training for the<br />
entire faculty and staff.<br />
□<br />
Unsuccessful – Requesting District Recommendations<br />
Parental Involvement<br />
Need(s): Increased parent involvement is necessary for <strong>Anderson</strong>. Involvement continues to increase;<br />
however, we still need to further implement strategies to encourage parents to be more involved.<br />
PD in SIPlan: Our plan was to have regular classes for parents in many different areas. Because of lack<br />
of funding, we were unable to put that plan in place for this year.<br />
Reflective Assessment:<br />
□<br />
X<br />
□<br />
□<br />
Successful – Supported by data including:<br />
Ongoing – Provided by Site funding<br />
Limited Success – Requesting District Support:<br />
Unsuccessful – Requesting District Recommendations<br />
<strong>Anderson</strong> <strong>Elementary</strong> SiPlan Page 66
2011 VA SCHOOL REPORT<br />
ANDERSON ELEMENTARY<br />
2011 VA School Report<br />
This report provides 2011 ValueAdded (VA) data. The results reported here<br />
measure your school's impact on the academic growth of students at both the<br />
school and grade levels for each tested subject. In addition to the overall<br />
results, VA Estimates are also provided for specific groups of students, based<br />
on Prior Student Achievement Level, ELL Status, and Special Education<br />
Status. For each student group, the VA Estimate compares the actual<br />
achievement of students in your school to the predicted achievement of those<br />
students. All VA results account for prior state test scores (OCCT and<br />
OMAAP). A number of demographic variables are also included in the<br />
calculation to ensure the results regarding your school's impact are as fair<br />
and accurate as possible. For more information on the demographic variables,<br />
please see the last page of this report.<br />
Report Contents<br />
Page 1 How to Read the VA<br />
School Report<br />
Page 2 SchoolLevel VA Results<br />
Page 3 4 GradeLevel VA<br />
Results<br />
Page 5 6 SchoolLevel Results<br />
with Student Subgroups<br />
Page 7 13 GradeLevel Results<br />
with Student Subgroups<br />
Page 14 16 SchoolLevel and<br />
GradeLevel VA Graphs<br />
Page 17 Additional Information on<br />
VA<br />
1
2011 VA SCHOOL REPORT<br />
ANDERSON ELEMENTARY<br />
ValueAdded: SchoolLevel Results<br />
The tables below provide SchoolLevel VA results for Reading and Math. Results are provided both for the 2010–<br />
2011 academic year and for the average of the last three years. Refer to page 1 of this report for tips on how to<br />
read these tables.<br />
NUMBER OF<br />
STUDENTS<br />
(WEIGHTED)<br />
READING SchoolLevel VA<br />
Past Academic Year 2010–2011 3 Year Average 20082011<br />
VA ESTIMATE<br />
NUMBER OF<br />
STUDENTS<br />
(WEIGHTED)<br />
VA ESTIMATE<br />
1 2 District Average 4 5 1 2 District Average 4 5<br />
Overall 65.3 3.0 169.8<br />
2.6<br />
MATH SchoolLevel VA<br />
Overall 65.3 2.5 169.8<br />
2.7<br />
2
2011 VA SCHOOL REPORT<br />
ANDERSON ELEMENTARY<br />
ValueAdded: GradeLevel Results<br />
The tables below provide GradeLevel VA results for all OCCT subjects. Results are provided both for 2010–2011<br />
academic year and for the average of the last three years. Refer to page 1 of this report for tips on how to read<br />
these tables.<br />
NUMBER OF<br />
STUDENTS<br />
(WEIGHTED)<br />
Past Academic Year 2010–2011 3 Year Average 20082011<br />
VA ESTIMATE<br />
NUMBER OF<br />
STUDENTS<br />
(WEIGHTED)<br />
VA ESTIMATE<br />
1 2 District Average 4 5 1 2 District Average 4 5<br />
READING<br />
GradeLevel VA<br />
Grade 4 37.0 3.4 93.8<br />
2.8<br />
Grade 5 28.3 2.4 76.0<br />
2.4<br />
MATH<br />
GradeLevel VA<br />
Grade 4 37.0 2.5 93.8<br />
2.9<br />
Grade 5 28.3 2.6 76.0<br />
2.4<br />
SCIENCE<br />
GradeLevel VA<br />
Grade 5 28.3 2.2 77.0<br />
2.4<br />
3
2011 VA SCHOOL REPORT<br />
ANDERSON ELEMENTARY<br />
ValueAdded: GradeLevel Results<br />
The tables below provide GradeLevel VA results for all OCCT subjects. Results are provided both for 2010–2011<br />
academic year and for the average of the last three years. Refer to page 1 of this report for tips on how to read<br />
these tables.<br />
NUMBER OF<br />
STUDENTS<br />
(WEIGHTED)<br />
Past Academic Year 2010–2011 3 Year Average 20082011<br />
VA ESTIMATE<br />
NUMBER OF<br />
STUDENTS<br />
(WEIGHTED)<br />
VA ESTIMATE<br />
1 2 District Average 4 5 1 2 District Average 4 5<br />
SOCIAL STUDIES<br />
GradeLevel VA<br />
Grade 5 29.3 2.3 76.6<br />
2.4<br />
WRITING<br />
GradeLevel VA<br />
Grade 5 27.3 3.8 73.5<br />
3.7<br />
4
READING<br />
2011 VA SCHOOL REPORT<br />
ANDERSON ELEMENTARY<br />
ValueAdded: SchoolLevel Results with Student Subgroups<br />
The tables below provide SchoolLevel VA results for specific groups of students. Results are provided both for<br />
the 2010–2011 academic year and for the average of the last three years.<br />
By Prior Student Achievement Level: These groups are based on the student's OCCT performance level from the<br />
previous year. Note: does not include OMAAP results.<br />
By ELL Status: Results are based on English Language Learner (ELL) status of students. Note: does not include<br />
OMAAP results.<br />
By SPED Status: Results are based on Special Education (SPED) status of students.<br />
NUMBER OF<br />
STUDENTS<br />
(WEIGHTED)<br />
Past Academic Year 2010–2011 3 Year Average 20082011<br />
VA ESTIMATE<br />
READING By Prior Student Achievement Level<br />
NUMBER OF<br />
STUDENTS<br />
(WEIGHTED)<br />
VA ESTIMATE<br />
1 2 District Average 4 5 1 2 District Average 4 5<br />
Advanced ** Insufficient Data or NA ** Insufficient Data or NA<br />
Proficient 18.0 3.0 73.0<br />
2.5<br />
Limited<br />
Knowledge<br />
16.3 3.0 38.9<br />
2.8<br />
Unsatisfactory 31.0 3.0 49.9<br />
2.7<br />
READING By ELL Status<br />
ELL ** Insufficient Data or NA ** Insufficient Data or NA<br />
NonELL ** Insufficient Data or NA ** Insufficient Data or NA<br />
READING By SPED Status<br />
SPED ** Insufficient Data or NA 10.0<br />
2.6<br />
NonSPED ** Insufficient Data or NA 159.8<br />
2.7<br />
5
MATH<br />
2011 VA SCHOOL REPORT<br />
ANDERSON ELEMENTARY<br />
ValueAdded: SchoolLevel Results with Student Subgroups<br />
The tables below provide SchoolLevel VA results for specific groups of students. Results are provided both for<br />
the 2010–2011 academic year and for the average of the last three years.<br />
By Prior Student Achievement Level: These groups are based on the student's OCCT performance level from the<br />
previous year. Note: does not include OMAAP results.<br />
By ELL Status: Results are based on English Language Learner (ELL) status of students. Note: does not include<br />
OMAAP results.<br />
By SPED Status: Results are based on Special Education (SPED) status of students.<br />
NUMBER OF<br />
STUDENTS<br />
(WEIGHTED)<br />
Past Academic Year 2010–2011 3 Year Average 20082011<br />
VA ESTIMATE<br />
MATH By Prior Student Achievement Level<br />
NUMBER OF<br />
STUDENTS<br />
(WEIGHTED)<br />
VA ESTIMATE<br />
1 2 District Average 4 5 1 2 District Average 4 5<br />
Advanced ** Insufficient Data or NA ** Insufficient Data or NA<br />
Proficient 18.0 2.8 47.1<br />
2.8<br />
Limited<br />
Knowledge<br />
15.3 2.6 61.2<br />
2.7<br />
Unsatisfactory 28.0 2.3 47.6<br />
2.5<br />
MATH By ELL Status<br />
ELL ** Insufficient Data or NA ** Insufficient Data or NA<br />
NonELL ** Insufficient Data or NA ** Insufficient Data or NA<br />
MATH By SPED Status<br />
SPED ** Insufficient Data or NA 10.0<br />
2.2<br />
NonSPED ** Insufficient Data or NA 159.8<br />
2.8<br />
6
READING<br />
2011 VA SCHOOL REPORT<br />
ANDERSON ELEMENTARY<br />
ValueAdded: GradeLevel Results with Student Subgroups<br />
The tables below provide GradeLevel VA results for specific groups of students. Results are provided both for the<br />
2010–2011 academic year and for the average of the last three years.<br />
By Prior Student Achievement Level: These groups are based on the student's OCCT performance level from the<br />
previous year. Note: does not include OMAAP results.<br />
By ELL Status: Results are based on English Language Learner (ELL) status of students. Note: does not include<br />
OMAAP results.<br />
By SPED Status: Results are based on Special Education (SPED) status of students.<br />
NUMBER OF<br />
STUDENTS<br />
(WEIGHTED)<br />
Past Academic Year 2010–2011 3 Year Average 20082011<br />
VA ESTIMATE<br />
Grade 4 By Prior Student Achievement Level<br />
NUMBER OF<br />
STUDENTS<br />
(WEIGHTED)<br />
VA ESTIMATE<br />
1 2 District Average 4 5 1 2 District Average 4 5<br />
Advanced ** Insufficient Data or NA ** Insufficient Data or NA<br />
Proficient 12.0 3.4 39.9<br />
2.5<br />
Limited<br />
Knowledge<br />
11.0 3.4 25.1<br />
3.0<br />
Unsatisfactory 14.0 3.4 22.8<br />
3.0<br />
Grade 4 By ELL Status<br />
ELL ** Insufficient Data or NA ** Insufficient Data or NA<br />
NonELL ** Insufficient Data or NA ** Insufficient Data or NA<br />
Grade 4 By SPED Status<br />
SPED ** Insufficient Data or NA ** Insufficient Data or NA<br />
NonSPED ** Insufficient Data or NA ** Insufficient Data or NA<br />
7
READING<br />
2011 VA SCHOOL REPORT<br />
ANDERSON ELEMENTARY<br />
ValueAdded: GradeLevel Results with Student Subgroups<br />
The tables below provide GradeLevel VA results for specific groups of students. Results are provided both for the<br />
2010–2011 academic year and for the average of the last three years.<br />
By Prior Student Achievement Level: These groups are based on the student's OCCT performance level from the<br />
previous year. Note: does not include OMAAP results.<br />
By ELL Status: Results are based on English Language Learner (ELL) status of students. Note: does not include<br />
OMAAP results.<br />
By SPED Status: Results are based on Special Education (SPED) status of students.<br />
NUMBER OF<br />
STUDENTS<br />
(WEIGHTED)<br />
Past Academic Year 2010–2011 3 Year Average 20082011<br />
VA ESTIMATE<br />
Grade 5 By Prior Student Achievement Level<br />
NUMBER OF<br />
STUDENTS<br />
(WEIGHTED)<br />
VA ESTIMATE<br />
1 2 District Average 4 5 1 2 District Average 4 5<br />
Advanced ** Insufficient Data or NA ** Insufficient Data or NA<br />
Proficient ** Insufficient Data or NA 33.0<br />
2.4<br />
Limited<br />
Knowledge<br />
** Insufficient Data or NA 13.8<br />
2.4<br />
Unsatisfactory 17.0 2.4 27.1<br />
2.4<br />
Grade 5 By ELL Status<br />
ELL ** Insufficient Data or NA ** Insufficient Data or NA<br />
NonELL ** Insufficient Data or NA ** Insufficient Data or NA<br />
Grade 5 By SPED Status<br />
SPED ** Insufficient Data or NA ** Insufficient Data or NA<br />
NonSPED ** Insufficient Data or NA ** Insufficient Data or NA<br />
8
MATH<br />
2011 VA SCHOOL REPORT<br />
ANDERSON ELEMENTARY<br />
ValueAdded: GradeLevel Results with Student Subgroups<br />
The tables below provide GradeLevel VA results for specific groups of students. Results are provided both for the<br />
2010–2011 academic year and for the average of the last three years.<br />
By Prior Student Achievement Level: These groups are based on the student's OCCT performance level from the<br />
previous year. Note: does not include OMAAP results.<br />
By ELL Status: Results are based on English Language Learner (ELL) status of students. Note: does not include<br />
OMAAP results.<br />
By SPED Status: Results are based on Special Education (SPED) status of students.<br />
NUMBER OF<br />
STUDENTS<br />
(WEIGHTED)<br />
Past Academic Year 2010–2011 3 Year Average 20082011<br />
VA ESTIMATE<br />
Grade 4 By Prior Student Achievement Level<br />
NUMBER OF<br />
STUDENTS<br />
(WEIGHTED)<br />
VA ESTIMATE<br />
1 2 District Average 4 5 1 2 District Average 4 5<br />
Advanced ** Insufficient Data or NA ** Insufficient Data or NA<br />
Proficient 13.0 2.9 25.8<br />
3.1<br />
Limited<br />
Knowledge<br />
** Insufficient Data or NA 34.3<br />
2.9<br />
Unsatisfactory 14.0 1.9 24.8<br />
2.6<br />
Grade 4 By ELL Status<br />
ELL ** Insufficient Data or NA ** Insufficient Data or NA<br />
NonELL ** Insufficient Data or NA ** Insufficient Data or NA<br />
Grade 4 By SPED Status<br />
SPED ** Insufficient Data or NA ** Insufficient Data or NA<br />
NonSPED ** Insufficient Data or NA ** Insufficient Data or NA<br />
9
MATH<br />
2011 VA SCHOOL REPORT<br />
ANDERSON ELEMENTARY<br />
ValueAdded: GradeLevel Results with Student Subgroups<br />
The tables below provide GradeLevel VA results for specific groups of students. Results are provided both for the<br />
2010–2011 academic year and for the average of the last three years.<br />
By Prior Student Achievement Level: These groups are based on the student's OCCT performance level from the<br />
previous year. Note: does not include OMAAP results.<br />
By ELL Status: Results are based on English Language Learner (ELL) status of students. Note: does not include<br />
OMAAP results.<br />
By SPED Status: Results are based on Special Education (SPED) status of students.<br />
NUMBER OF<br />
STUDENTS<br />
(WEIGHTED)<br />
Past Academic Year 2010–2011 3 Year Average 20082011<br />
VA ESTIMATE<br />
Grade 5 By Prior Student Achievement Level<br />
NUMBER OF<br />
STUDENTS<br />
(WEIGHTED)<br />
VA ESTIMATE<br />
1 2 District Average 4 5 1 2 District Average 4 5<br />
Advanced ** Insufficient Data or NA ** Insufficient Data or NA<br />
Proficient ** Insufficient Data or NA 21.3<br />
2.5<br />
Limited<br />
Knowledge<br />
** Insufficient Data or NA 26.9<br />
2.5<br />
Unsatisfactory 14.0 2.6 22.8<br />
2.4<br />
Grade 5 By ELL Status<br />
ELL ** Insufficient Data or NA ** Insufficient Data or NA<br />
NonELL ** Insufficient Data or NA ** Insufficient Data or NA<br />
Grade 5 By SPED Status<br />
SPED ** Insufficient Data or NA ** Insufficient Data or NA<br />
NonSPED ** Insufficient Data or NA ** Insufficient Data or NA<br />
10
SCIENCE<br />
2011 VA SCHOOL REPORT<br />
ANDERSON ELEMENTARY<br />
ValueAdded: GradeLevel Results with Student Subgroups<br />
The tables below provide GradeLevel VA results for specific groups of students. Results are provided both for the<br />
2010–2011 academic year and for the average of the last three years.<br />
By Prior Student Achievement Level: These groups are based on the student's OCCT performance level from the<br />
previous year. Note: does not include OMAAP results.<br />
By ELL Status: Results are based on English Language Learner (ELL) status of students. Note: does not include<br />
OMAAP results.<br />
By SPED Status: Results are based on Special Education (SPED) status of students.<br />
NUMBER OF<br />
STUDENTS<br />
(WEIGHTED)<br />
Past Academic Year 2010–2011 3 Year Average 20082011<br />
VA ESTIMATE<br />
Grade 5 By Prior Student Achievement Level<br />
NUMBER OF<br />
STUDENTS<br />
(WEIGHTED)<br />
VA ESTIMATE<br />
1 2 District Average 4 5 1 2 District Average 4 5<br />
Advanced ** Insufficient Data or NA ** Insufficient Data or NA<br />
Proficient ** Insufficient Data or NA 21.3<br />
2.5<br />
Limited<br />
Knowledge<br />
** Insufficient Data or NA 26.9<br />
2.4<br />
Unsatisfactory 14.0 2.0 23.8<br />
2.3<br />
Grade 5 By ELL Status<br />
ELL ** Insufficient Data or NA ** Insufficient Data or NA<br />
NonELL ** Insufficient Data or NA ** Insufficient Data or NA<br />
Grade 5 By SPED Status<br />
SPED ** Insufficient Data or NA ** Insufficient Data or NA<br />
NonSPED ** Insufficient Data or NA ** Insufficient Data or NA<br />
11
SOCIAL STUDIES<br />
2011 VA SCHOOL REPORT<br />
ANDERSON ELEMENTARY<br />
ValueAdded: GradeLevel Results with Student Subgroups<br />
The tables below provide GradeLevel VA results for specific groups of students. Results are provided both for the<br />
2010–2011 academic year and for the average of the last three years.<br />
By Prior Student Achievement Level: These groups are based on the student's OCCT performance level from the<br />
previous year. Note: does not include OMAAP results.<br />
By ELL Status: Results are based on English Language Learner (ELL) status of students. Note: does not include<br />
OMAAP results.<br />
By SPED Status: Results are based on Special Education (SPED) status of students.<br />
NUMBER OF<br />
STUDENTS<br />
(WEIGHTED)<br />
Past Academic Year 2010–2011 3 Year Average 20082011<br />
VA ESTIMATE<br />
Grade 5 By Prior Student Achievement Level<br />
NUMBER OF<br />
STUDENTS<br />
(WEIGHTED)<br />
VA ESTIMATE<br />
1 2 District Average 4 5 1 2 District Average 4 5<br />
Advanced ** Insufficient Data or NA ** Insufficient Data or NA<br />
Proficient ** Insufficient Data or NA 33.0<br />
2.4<br />
Limited<br />
Knowledge<br />
** Insufficient Data or NA 14.8<br />
2.4<br />
Unsatisfactory 18.0 2.3 28.8<br />
2.4<br />
Grade 5 By ELL Status<br />
ELL ** Insufficient Data or NA ** Insufficient Data or NA<br />
NonELL ** Insufficient Data or NA ** Insufficient Data or NA<br />
Grade 5 By SPED Status<br />
SPED ** Insufficient Data or NA ** Insufficient Data or NA<br />
NonSPED ** Insufficient Data or NA ** Insufficient Data or NA<br />
12
WRITING<br />
2011 VA SCHOOL REPORT<br />
ANDERSON ELEMENTARY<br />
ValueAdded: GradeLevel Results with Student Subgroups<br />
The tables below provide GradeLevel VA results for specific groups of students. Results are provided both for the<br />
2010–2011 academic year and for the average of the last three years.<br />
By Prior Student Achievement Level: These groups are based on the student's OCCT performance level from the<br />
previous year. Note: does not include OMAAP results.<br />
By ELL Status: Results are based on English Language Learner (ELL) status of students. Note: does not include<br />
OMAAP results.<br />
By SPED Status: Results are based on Special Education (SPED) status of students.<br />
NUMBER OF<br />
STUDENTS<br />
(WEIGHTED)<br />
Past Academic Year 2010–2011 3 Year Average 20082011<br />
VA ESTIMATE<br />
Grade 5 By Prior Student Achievement Level<br />
NUMBER OF<br />
STUDENTS<br />
(WEIGHTED)<br />
VA ESTIMATE<br />
1 2 District Average 4 5 1 2 District Average 4 5<br />
Advanced ** Insufficient Data or NA ** Insufficient Data or NA<br />
Proficient ** Insufficient Data or NA 32.0<br />
3.7<br />
Limited<br />
Knowledge<br />
** Insufficient Data or NA 14.4<br />
3.7<br />
Unsatisfactory 17.0 3.8 27.1<br />
3.7<br />
Grade 5 By ELL Status<br />
ELL ** Insufficient Data or NA ** Insufficient Data or NA<br />
NonELL ** Insufficient Data or NA ** Insufficient Data or NA<br />
Grade 5 By SPED Status<br />
SPED ** Insufficient Data or NA ** Insufficient Data or NA<br />
NonSPED ** Insufficient Data or NA ** Insufficient Data or NA<br />
13
2011 VA SCHOOL REPORT<br />
ANDERSON ELEMENTARY<br />
Your School Compared to the Rest of the District<br />
The charts below compare your school's student growth (ValueAdded) in reading and mathematics to student<br />
attainment (percentage of students who meet or exceed the OCCT proficiency standards). ValueAdded scores<br />
are read along the bottom, and percentage meeting/exceeding standards are read along the lefthand side.<br />
READING<br />
MATH<br />
14
2011 VA SCHOOL REPORT<br />
ANDERSON ELEMENTARY<br />
Your School Compared to the Rest of the District by Grade<br />
15
2011 VA SCHOOL REPORT<br />
ANDERSON ELEMENTARY<br />
Your School Compared to the Rest of the District by Grade<br />
16
2011 VA SCHOOL REPORT<br />
ANDERSON ELEMENTARY<br />
Additional Information on ValueAdded<br />
Differences Between Specific Groups of Students<br />
Readers may want to compare two student subgroups. For example, let's say you see the following on your<br />
report:<br />
In this case, it is not necessarily true that students in the "Unsatisfactory" grouping grew more than students in<br />
the "Proficient" grouping. Instead the table above indicates that your "Unsatisfactory" students grew more, on<br />
average, than similar "Unsatisfactory" students from across TPS. Your "Proficient" students grew, on average,<br />
about the same as similar "Proficient" students from across TPS.<br />
Prior Achievement Level for Student Groups<br />
The prior achievement level groupings in this report are "Advanced", "Proficient", "Limited Knowledge" and<br />
"Unsatisfactory." These groups are based on the student's OCCT performance level from the previous year. The<br />
purpose of this calculation is to measure the impact of teachers on students from across the achievement<br />
spectrum.<br />
Control Variables Used in the VA Model<br />
The VA Model uses statistical techniques to separate the impact of schooling from other factors that may<br />
influence growth; the following variables are controlled for in the VA Model:<br />
1. Prior OCCT Reading Score 5. Race/Ethnicity 9. Mobility<br />
2. Prior OCCT Math Score 6. LowIncome Status 10. Attendance History<br />
3. Grade Level 7. ELL Status 11. Grade Retention<br />
4. Gender 8. Special Education Status<br />
It is important to note that controlling for demographic characteristics does not mean a lowering of expectations<br />
for any grouping of students addressed by a control variable.<br />
For more information on ValueAdded (VA), please refer to the companion professional development piece titled,<br />
"Making Meaning of Your ValueAdded School Report."<br />
Insufficient Data or NA<br />
Results may not be provided for the following reasons:<br />
Too few students to calculate a result (less than 10).<br />
Too few students in the contrasting category to calculate a result.<br />
A grade level or subject was not taught during the given time period.<br />
Only one teacher taught that grade or subject during the given time period.<br />
No districtwide differential effects between student groups.<br />
17
A School Improvement Plan (SIPlan) and Process<br />
School Year 2009 - 2010<br />
Marian <strong>Anderson</strong> <strong>Elementary</strong> School<br />
<strong>Tulsa</strong> <strong>Public</strong> <strong>Schools</strong><br />
Brenda <strong>Anderson</strong>, Principal<br />
Written, updated and evaluated by:<br />
Nina Eccles, Early Childhood Teacher<br />
Katherine Thompson, First Grade Teacher<br />
Diahanne McClellan, Instructional Coach<br />
Kelley Blakney, Fourth Grade Teacher<br />
Michael Stick, Fifth Grade Teacher<br />
Brenda <strong>Anderson</strong>, Principal<br />
Kemba Wright, Parent<br />
Donna Davis, Community Member<br />
January 2010, Sharing of SIPlan with Parents / Community Members<br />
1921 East 29 th Street North<br />
<strong>Tulsa</strong>, OK 74110<br />
918-925-1300<br />
<strong>Anderson</strong> <strong>Elementary</strong> School SiPlan 2009 - 2010 - Page 1
Table of Contents<br />
PART I - DESCRIPTION of SCHOOL........................................................... 3-9<br />
A. Who We Are and Who We Serve ......................................................................... 3<br />
B. Programs and Achievements .............................................................................. 3<br />
C. Transitions ............................................................................................................ 4<br />
D. Challenges ............................................................................................................. 5<br />
E. AYP Status ............................................................................................................ 5<br />
F. Attendance Statistics ........................................................................................... 5<br />
G. Coordination of Services ..................................................................................... 6<br />
H. Checklist of the 10 Components of a School-wide Site Plan ............................ 7<br />
I. NCLB Compliance Elements ................................................................................ 8-9<br />
PART II - ACTION PLANS, including ANALYSIS OF DATA ...................... 10<br />
Pre-Kindergarten (Overview, Reading / Language Arts and Mathematics)………………….10-17<br />
Kindergarten (Overview, Reading / Language Arts and Mathematics)………………………...10-17<br />
1st Grade (Overview, Reading / Language Arts and Mathematics)………………………………17-22<br />
2nd Grade (Overview, Reading / Language Arts and Mathematics)……………………………..23-28<br />
3rd Grade (Overview, Reading / Language Arts and Mathematics)………………………………29-34<br />
4th Grade (Overview, Reading / Language Arts and Mathematics)………………………………35-40<br />
5th Grade (Overview, Reading / Language Arts, Mathematics, Social Studies & Science)….41-50<br />
Attendance and Climate / Behavior (Overview, Action)……………………………………….51-54<br />
<strong>Anderson</strong> <strong>Elementary</strong> School SiPlan 2009 - 2010 - Page 2
PART I<br />
DESCRIPTION of SCHOOL<br />
A. Who We Are and Who We Serve<br />
Marian <strong>Anderson</strong> <strong>Elementary</strong> is located in the north quadrant of <strong>Tulsa</strong>, Oklahoma. It is<br />
located in one of the most economically distressed areas of <strong>Tulsa</strong>. <strong>Anderson</strong> currently<br />
serves 320 predominantly African-American, economically deprived students in academic<br />
and enrichment programs in grades DD (developmentally delayed) through fifth. Since<br />
<strong>Anderson</strong> was once a junior high (middle) school, it enjoys luxuries most elementary schools<br />
do not: a swimming pool, auditorium, and two levels. Due to previously passed bonds, a<br />
new gym was built, the old gym was converted into a media center, and monies from the<br />
recently passed bond will further upgrade the facility, adding additional furniture, upgrading<br />
technology, and replacing textbooks.<br />
B. Programs and Achievements<br />
Programs<br />
• Reading First Literacy<br />
Coach<br />
• Eat, Exercise, Excel<br />
Program & Grant<br />
• Benchmark Unit<br />
Assessments Program<br />
• Instructional Coach • Big Brothers and Sisters • Reading Mastery Plus<br />
Literacy Program<br />
• Promethean Boards in every<br />
classroom<br />
• Mentors, volunteers,<br />
adopters<br />
• Waterford Early<br />
Literacy Program<br />
• Highly Qualified Reading<br />
• <strong>Tulsa</strong> Library • Reading First Grant<br />
Interventionists<br />
• Building Academic Vocabulary • Boy Scouts & Girl Scouts • Reading Sufficiency<br />
Demonstration Site<br />
• Synergistic Missions Science • PTA • R.I.F. book distribution<br />
Lab<br />
• Compass Learning Lab • <strong>Tulsa</strong> City County Health<br />
Department It’s All About<br />
• Monthly Award<br />
Celebration<br />
Kids Program<br />
• Instrumental Band • Second Step Program • Tribes<br />
• Student Council • In School Connection • Masonic award –<br />
fifth grade<br />
• Safety Patrol • FasttMath Math Facts<br />
Program<br />
• Boys/Girl Scouts<br />
<strong>Anderson</strong> <strong>Elementary</strong> School SiPlan 2009 - 2010 - Page 3
Achievements in place include:<br />
• Discipline –There has been a steady<br />
decrease in suspensions and a significant<br />
reduction in acts of physical aggression /<br />
confrontations.<br />
• Professional Development – Staff has been<br />
engaged in ongoing reading & math to<br />
accommodate curricular advancement.<br />
• We were awarded a 3 year grant for our Eat,<br />
Exercise, Excel program<br />
• Increased parental attendance in parent<br />
conferencing, classroom visits, field trips, and<br />
volunteering.<br />
• Recognition – Quarterly awards, assemblies<br />
to recognize academic improvement, perfect<br />
attendance, citizenship, etc.<br />
District Awards to staff, students, teachers,<br />
volunteers<br />
C. Transitions<br />
1. To receive a new student / parent the following is provided.<br />
• The Principal personally greets the incoming family and stresses the “open door”<br />
policy that is in effect at the building.<br />
• The office staff welcomes the family and student.<br />
• Every new student is given a tour to assist the child and assure a receiving and<br />
welcome climate.<br />
• A caring environment (Tribes model) has been woven into the fabric of <strong>Anderson</strong>.<br />
• A uniform, beginning of the day, greeting procedure is in place and implemented by all<br />
teachers.<br />
2. Career Awareness / Orientation / Exploration opportunities while attending the<br />
school.<br />
• Implementation of a school wide plan to coordinate career awareness and opportunity.<br />
• Career day sponsored by classrooms.<br />
• National “Bring your Child to Work” day.<br />
• School Partners in Education will present at a Career Fair<br />
3. Preparation for vertical articulation upon leaving the school.<br />
• Middle school teachers and counselors visit <strong>Anderson</strong>’s 5 th grade classrooms to<br />
generate interest and share schedule options / courses.<br />
• Teachers will meet with preceding grade levels as per our Area 1/McLain Cluster<br />
Pattern plan for vertical articulation.<br />
• Information provided for alternative middle schools in TPS.<br />
• Open house information (provided by the middle schools) is distributed to all current<br />
5 th grade parents.<br />
<strong>Anderson</strong> <strong>Elementary</strong> School SiPlan 2009 - 2010 - Page 4
D. Challenges<br />
The school supports a community seriously impacted by economic discord and social crisis.<br />
Gangs, drugs, and random violence directly influence and permeate the experiences of many<br />
of our children. The student population is greatly affected by the problems arising out of<br />
chronic and generational poverty, hostile urban environments, parental neglect and abuse,<br />
hunger and distrust. Many of our children display the negative effects of their family and<br />
neighborhood existence with poor impulse control, cognitive dysfunction and poor to failing<br />
language processing. The number of <strong>Anderson</strong> students receiving free and/or reduced<br />
lunches is over 90%. Classroom management and behavior problems, as well as cognitive<br />
delays, absenteeism, and chronic tardiness are indicative of the multiple challenges that are<br />
encountered on a daily basis. The <strong>Anderson</strong> staff does not view the above as<br />
insurmountable challenges; rather, they are viewed as opportunities to be addressed where<br />
and when possible through the collective efforts, energies, and talents of this staff.<br />
E. AYP Status<br />
School<br />
Year<br />
05-06<br />
06-07<br />
07-08<br />
Math –<br />
ALL<br />
Students<br />
State Math<br />
Target<br />
AYP?<br />
Yes, No or<br />
SH<br />
Reading –<br />
ALL<br />
Students<br />
State<br />
Reading<br />
Target<br />
AYP?<br />
Yes, No<br />
or SH<br />
534 790 SH 437 768 SH<br />
927 932 SH 1136 914 YES<br />
307 932 No 804 914 CI<br />
08-09 588 932 SH 1131 914 CI<br />
F. Attendance Statistics<br />
Year Attendance Rate Target Rate<br />
04-05<br />
05-06 91.3 (676) 91.2 (664)<br />
06-07 93.5 (940) 91.2 (664)<br />
07-08 95.2 (1144) 91.2 (664)<br />
08-09 93.7 (964) 91.2 (664)<br />
<strong>Anderson</strong> <strong>Elementary</strong> School SiPlan 2009 - 2010 - Page 5
G. Coordination of Services<br />
<strong>Anderson</strong> <strong>Elementary</strong> has embedded (integrated and coordinated) the components of Title I<br />
and other entitlement programs within the spirit, intent, focus and direction of this SIPlan as<br />
evidenced below and within the Action Plans.<br />
Program<br />
Status Reporting<br />
Title I, Part A<br />
See attached Appendix A -- Budget justification page.<br />
Title IV A - Safe and Drug Second Step Counseling Program and district-wide<br />
Free School<br />
Principal / Teacher Training<br />
Red Ribbon week, promoting drug-free lifestyles.<br />
Reading Academy ( Helping educators build skills for<br />
teaching every child to read) 4 day training in June;<br />
Professional Development with Educational Consulting<br />
Services/Kim Collier throughout the year<br />
Teacher Training<br />
Reading Academy ( Voyager U ); Ongoing District PD<br />
Eat, Exercise, Excel Program Comprehension school health program coordinated with the<br />
State Department of Education in Kansas. Components of<br />
program include: 30 minutes a day of “structured activity” time<br />
in place of traditional recess; water bottles in the classroom<br />
for increased hydration; lunch in the classroom with the<br />
teacher to promote community and nutrition; increased PE<br />
time; a daily multi-vitamin given to students with parent<br />
permission. Goals of the program include: increased activity<br />
that limits opportunities for bullying and fighting; increased<br />
academic learning time because of decreased behavior<br />
issues in the classroom; less food waste and more focus on<br />
healthy nutrition.<br />
Reading Sufficiency<br />
Grant<br />
Community Programs<br />
School Partners<br />
Big Brothers/Big Sisters<br />
Reading First Program<br />
After-School Programs<br />
Reading sufficiency funding is used to provide direct reading<br />
instruction to primary students performing below grade level<br />
in small group settings on a pull-out basis. Family Literacy<br />
Night on a monthly basis provides strategies for families to<br />
develop and participate in reading activities.<br />
Boy Scouts, Girl Scouts, In-School Connection, GREAT<br />
Program through <strong>Tulsa</strong> Police Department<br />
Oral Roberts University, 320 Boston Management, Inc., <strong>Tulsa</strong><br />
Running Club, <strong>Tulsa</strong> 66ers, Christ Temple Church, Crossover<br />
Bible Church, Northside Homes Mission, Boy Scouts of<br />
America, St. Francis Hospital South<br />
Matching volunteer mentors with students.<br />
Develops competent readers through the use of quality<br />
explicit reading instruction, continuous monitoring of student<br />
growth, and early interventions in the areas of reading<br />
difficulties. The program is implemented as our core-reading<br />
program.<br />
A series of staff-initiated after-school programs, focusing on<br />
reading and mathematics skill areas, offered throughout the<br />
school year.<br />
<strong>Anderson</strong> <strong>Elementary</strong> School SiPlan 2009 - 2010 - Page 6
H. Oklahoma Department of Education’s Checklist of the Ten (10) Components of a<br />
School-wide Site Plan<br />
Requirements Found on Page(s) #<br />
1. A comprehensive needs assessment of the entire school. See Part 1 – Challenges; a<br />
comprehensive needs<br />
assessment was conducted<br />
through our detailed analysis<br />
of data made available from<br />
the OCCT Summary Reports.<br />
Additionally, all assessments<br />
used identify needs of our<br />
students.<br />
2. Implementation of school-wide reform strategies. See Part 1 – Programs; Our<br />
programs and initiatives<br />
outline our school reform<br />
strategies.<br />
3. Instruction by highly qualified teachers.<br />
4. High quality and on-going professional development for<br />
teachers, principals and paraprofessionals.<br />
5. Strategies to attract high-quality, highly qualified teachers to<br />
high-needs schools.<br />
6. Strategies to increase parental involvement, such as family<br />
literacy services.<br />
7. Plans for assisting preschool children in the transition from<br />
early childhood programs such as Head Start, Even Start,<br />
Early or Reading First to local elementary school programs.<br />
8. Opportunities and expectations for teachers to be included<br />
in the decision making related to the use of academic<br />
assessment results leading to the improvement of student<br />
achievement.<br />
9. Activities and programs at the school level to ensure that<br />
students having difficulty mastering proficient and advanced<br />
levels of the academic achievement standards are provided<br />
with effective, timely additional assistance.<br />
10. Coordination and integration of Federal, State and local<br />
services and programs, including programs supported under<br />
this Act.<br />
8, 10-13, 17-18, 23-24, 29-<br />
30, 35-36, 41-44, 51, 53<br />
6, 8, 9<br />
8, 9 10-13, 17-18, 23-24,<br />
29-30, 35-36, 41-44, 51,<br />
53<br />
4<br />
8, 9<br />
3, 10-54<br />
6<br />
<strong>Anderson</strong> <strong>Elementary</strong> School SiPlan 2009 - 2010 - Page 7
I. NCLB Compliance Elements<br />
Compliance Elements<br />
1. Using research-based strategies that<br />
address the academic issues that<br />
caused the school to be identified<br />
Building Response<br />
Academic Improvement:<br />
• Data driven, PASS –based curriculum<br />
• Benchmark Unit Assessments<br />
• Reading Mastery Plus K-5 th<br />
• Certified Interventionist<br />
Attendance:<br />
• Incentives for 100% attendance<br />
• quarterly, semester, end of year<br />
2. Adopting “Best Practices” Weekly team meetings - literacy<br />
coach/math/instructional facilitator/principal<br />
Literacy/Math Coaching-school-wide<br />
Site Delivered Training – data desegregation<br />
and literacy / math curriculum use<br />
3. Meeting professional development needs Literacy & Math<br />
Technical assistance through Educational<br />
Consulting Services/Kim Collier to focus on these<br />
areas<br />
Peer Coaching<br />
Weekly meetings centered<br />
4. Using professional development funds<br />
effectively<br />
on data and student proficiency<br />
Instructional Improvement<br />
Professional development funds<br />
provide for school-wide<br />
instructional improvement<br />
Data Disaggregation and Use<br />
On-going data desegregation<br />
support is provided throughout the<br />
year with ECS, Benchmark Unit Assessments<br />
and District consultants.<br />
5. Setting annual goals Academic: All students will develop<br />
language arts and math skills needed<br />
to be successful as determined by<br />
State and district assessment.<br />
Attendance: 96% of students will attend school<br />
daily.<br />
Climate/Behavior: Students and staff<br />
will embrace the 7 Community<br />
Guidelines and Life Skills as part of<br />
their daily interactions.<br />
<strong>Anderson</strong> <strong>Elementary</strong> School SiPlan 2009 - 2010 - Page 8
6. Outlining parent notices School-wide<br />
• Outdoor marquee sign<br />
• Written notices (in Spanish & English<br />
when available)<br />
• Announcements at Special Events and<br />
Parent Meetings<br />
• Parent Facilitators<br />
Classroom<br />
• Conversations with parents<br />
• Written notices<br />
• Newsletters<br />
7. Assigning responsibilities Administration creates ownership for student<br />
success with teachers and parents supported and<br />
assisted by district and guided by the state.<br />
8. Increasing parent involvement After-school opportunities<br />
• Back to school night<br />
• Fall carnival<br />
• Parent Teacher conferences<br />
• Health / nutrition<br />
• Invitations to assemblies<br />
• Monthly PCAC meetings<br />
• Annual Red & White Ball<br />
• <strong>Anderson</strong> Idol Talent Show<br />
• After-school exercise & swim classes<br />
During school opportunities<br />
• Grade level parent meetings<br />
• Classroom celebrations<br />
• Field Trip Sponsorships<br />
9. Increasing instructional time • Traditional recess has been replaced with<br />
30 minutes daily of Healthy Activity Time<br />
(HAT) to insure students are more<br />
focused and attentive during academic<br />
learning time.<br />
10. Setting up teacher mentoring Literacy and Instructional coaches continue to<br />
develop peer coaching designs for planning,<br />
assessing and driving instruction to equip<br />
students for success.<br />
<strong>Anderson</strong> <strong>Elementary</strong> School SiPlan 2009 - 2010 - Page 9
Part II<br />
Early Childhood Reading Focus for Action Plans<br />
Assessments:<br />
Daily/ Weekly:<br />
• Class time discussions<br />
• One on one with the teacher<br />
• Sharing time<br />
• Center time interaction<br />
• Observations and interaction during book time<br />
• Teacher-made tests will be administered as needed.<br />
• Anecdotal records focusing on children’s literal understanding and children’s usage of<br />
literary elements will be recorded on a weekly basis<br />
Periodically:<br />
• Scott Foresman Assessments each quarter<br />
Annually:<br />
• Pre-K Growth Inventory<br />
• Pre-Kindergarten Growth Inventory (PKGI) is administered on entry to the program<br />
and in the spring to assess cognitive growth of students.<br />
Professional Development:<br />
• Educational Consulting Services/Kim Collier Technical Assistance, Tribes, Sharp<br />
School, Voyager U, Building Academic Vocabulary, Closing the Achievement<br />
Gap/Larry Bell Training, PowerSchool<br />
Parental Participation<br />
• Communicating –<br />
• Early Childhood teachers will provide training for how to help students learn at home<br />
(homework or other content related projects) at Literacy Nights.<br />
• Parent/teacher conferences will provide a basis for periodic communication between<br />
parents and teachers regarding children’s literacy development. Information will be<br />
presented in an understandable way to parents.<br />
• Make-It/Take-It nights will provide first grade teachers with the opportunity to<br />
demonstrate strategies and techniques parents can use at home to further their child’s<br />
overall literacy development.<br />
• <strong>Schools</strong> shall ensure that information related to school and parent programs, meetings<br />
and other activities is sent to the parents of participating children in a format, and, to<br />
the extent practicable, in a language the parents can understand.<br />
• Parents shall receive assistance in understanding such topics as the state’s academic<br />
content and achievement standards, the assessments being used and how to monitor<br />
their children’s progress and work with educators to improve their achievement.<br />
• Family Literacy Nights will occur monthly in an effort to increase family involvement.<br />
• Learning at Home –<br />
• Reading Logs will provide parents a means to communicate their child’s reading<br />
progress at home.<br />
• <strong>Schools</strong> shall provide materials and training, such as literacy training and training on<br />
how to use technology, to help parents work with their children to improve<br />
achievement.<br />
<strong>Anderson</strong> <strong>Elementary</strong> School SiPlan 2009 - 2010 - Page 10
Part II<br />
Early Childhood Math Focus for Action Plans<br />
Daily/ Weekly:<br />
• Teacher observations of daily participation/work and flexible group work will give an<br />
informal view of student development.<br />
• Teacher-made tests will be administered as needed.<br />
• A portfolio of students’ work will be kept to note progress in the area of mathematics.<br />
Periodically:<br />
• Quarterly Progress notes<br />
• Teacher-made assessments will be administered periodically to assess student<br />
understanding of standards.<br />
• Individual assessments will provide informal views of student math development.<br />
Annually:<br />
• Pre-K Growth Inventory post test will measure progress.<br />
Professional Development:<br />
• Educational Consulting Services/Kim Collier Technical Assistance, Tribes, Closing the<br />
Achievement Gap/Larry Bell Training, PowerSchool, Sharp School<br />
Parental Participation<br />
• Communicating –<br />
• Progress reports/report cards will be sent home at mid-quarter and end of quarter to<br />
inform parents of student progress.<br />
• Early Childhood Teachers will utilize personal progress notes, phone calls, and/or<br />
notes home to inform parents of their child’s progress in mathematics.<br />
• Early Childhood Teachers will invite parents to come in to a scheduled conference at<br />
any time of the year, to discuss any aspect of their child’s progress in the area of<br />
mathematics.<br />
• <strong>Schools</strong> shall ensure that information related to school and parent programs, meetings<br />
and other activities is sent to the parents of participating children in a format, and, to<br />
the extent practicable, in a language the parents can understand. (Communication)<br />
• Learning at Home –<br />
• Early Childhood Teachers will provide Skill Specific Homework in the areas of math<br />
that a child may be having trouble with.<br />
• Early Childhood teachers will select specific weekly homework to monitor student<br />
mastery of skills.<br />
• Parents shall receive assistance in understanding such topics as the state’s<br />
academic content and achievement standards, the assessments being used and<br />
how to monitor their children’s progress and work with educators to improve their<br />
achievement. (and Parenting)<br />
<strong>Anderson</strong> <strong>Elementary</strong> School SiPlan 2009 - 2010 - Page 11
Part II<br />
Kindergarten Reading Focus for Action Plans<br />
Assessments:<br />
Daily/ Weekly:<br />
• Teacher observations of daily participation/work and flexible group work will give an<br />
informal view of student development.<br />
• Teacher-made tests will be administered as needed.<br />
Periodically:<br />
• DIBELS Beginning of Year, Middle of Year, End of Year Assessments, Progress<br />
Monitoring<br />
Annually:<br />
• Kindergarten assessment will be given as a pre/post assessment in fall & spring.<br />
Professional Development:<br />
• Educational Consulting Services/Kim Collier Technical Assistance, Tribes, Sharp<br />
School, Voyager U, Building Academic Vocabulary, Closing the Achievement<br />
Gap/Larry Bell Training, PowerSchool<br />
Parental Participation<br />
• Communicating –<br />
• Kindergarten teachers will provide training for how to help students learn at home<br />
(homework or other content related projects) at Literacy Nights.<br />
• Parent/teacher conferences will provide a basis for periodic communication between<br />
parents and teachers regarding children’s literacy development. Information will be<br />
presented in an understandable way to parents.<br />
• Make-It/Take-It nights will provide first grade teachers with the opportunity to<br />
demonstrate strategies and techniques parents can use at home to further their child’s<br />
overall literacy development.<br />
• <strong>Schools</strong> shall ensure that information related to school and parent programs, meetings<br />
and other activities is sent to the parents of participating children in a format, and, to<br />
the extent practicable, in a language the parents can understand.<br />
• Parents shall receive assistance in understanding such topics as the state’s academic<br />
content and achievement standards, the assessments being used and how to monitor<br />
their children’s progress and work with educators to improve their achievement.<br />
• Family Literacy Nights will occur monthly in an effort to increase family involvement.<br />
• Learning at Home –<br />
• Reading Logs will provide parents a means to communicate their child’s reading<br />
progress at home.<br />
• <strong>Schools</strong> shall provide materials and training, such as literacy training and training on<br />
how to use technology, to help parents work with their children to improve<br />
achievement.<br />
<strong>Anderson</strong> <strong>Elementary</strong> School SiPlan 2009 - 2010 - Page 12
Part II<br />
Kindergarten Math Focus for Action Plans<br />
Assessments:<br />
Daily/ Weekly:<br />
• Teacher observations of daily participation/work and flexible group work will give an<br />
informal view of student development.<br />
• Teacher-made tests will be administered as needed.<br />
• A portfolio of students’ work will be kept to note progress in the area of mathematics.<br />
Periodically:<br />
• Quarterly Progress notes<br />
• Growing with Math assessments will be administered periodically to assess student<br />
understanding of standards.<br />
• Individual assessments will provide informal views of student math development.<br />
Annually:<br />
• Kindergarten Growth Inventory post test will measure progress.<br />
Professional Development:<br />
• Educational Consulting Services/Kim Collier Technical Assistance, Tribes, Closing the<br />
Achievement Gap/Larry Bell Training, PowerSchool, Sharp School<br />
Parental Participation<br />
• Communicating –<br />
• Progress reports/report cards will be sent home at mid-quarter and end of quarter to<br />
inform parents of student progress.<br />
• Kindergarten Teachers will utilize personal progress notes, phone calls, and/or notes<br />
home to inform parents of their child’s progress in mathematics.<br />
• Kindergarten Teachers will invite parents to come in to a scheduled conference at any<br />
time of the year, to discuss any aspect of their child’s progress in the area of<br />
mathematics.<br />
• <strong>Schools</strong> shall ensure that information related to school and parent programs, meetings<br />
and other activities is sent to the parents of participating children in a format, and, to<br />
the extent practicable, in a language the parents can understand. (Communication)<br />
• Learning at Home –<br />
• Kindergarten Teachers will provide Skill Specific Homework in the areas of math that a<br />
child may be having trouble with.<br />
• Kindergarten teachers will select specific weekly homework to monitor student mastery<br />
of skills.<br />
• Parents shall receive assistance in understanding such topics as the state’s<br />
academic content and achievement standards, the assessments being used and<br />
how to monitor their children’s progress and work with educators to improve their<br />
achievement. (and Parenting)<br />
<strong>Anderson</strong> <strong>Elementary</strong> School SiPlan 2009 - 2010 - Page 13
Grade / Instructional Focus: (Pre K and Kindergarten, Early Childhood Area Lang. Arts)<br />
Groups: _x_ Regular; _x_ IEP; _x_ ELL; _x_ Econ. Disadvantaged; _x_ Race; _x_ Gender<br />
Goal: Early Childhood students will demonstrate the ability to speak in complete sentences,<br />
and will demonstrate increased listening skills as determined by district standards listed on<br />
the report card.<br />
Achievement Objective / Benchmark (median scores or assessment nomenclature):<br />
Standard Objective PASS Current %<br />
or<br />
assessment<br />
nomenclature<br />
Uses<br />
Language for a<br />
Variety of<br />
Purposes<br />
Uses<br />
Sentences of<br />
Increasing<br />
Length<br />
2.1 Proficiency<br />
on ECAT<br />
2.3 Proficiency<br />
on ECAT<br />
@ least half<br />
will score __<br />
as %<br />
or assessment<br />
nomenclature<br />
Proficiency<br />
on ECAT<br />
Proficiency<br />
on ECAT<br />
Years as<br />
Issue<br />
08-09<br />
08-09<br />
Interventions / Strategies:<br />
The following research-based strategies have been chosen specifically to meet the needs of students<br />
of each gender and race as well as those who are Special Needs or economically challenged.<br />
Female students benefit from verbal interaction, descriptive narration, and expressing emotional<br />
connections/experiences to the information. Male students benefit from simple, analytic explanation,<br />
kinesthetic movement, and visual images to aid in retention of information. According to Ruby Payne,<br />
economically challenged students, need to know the “why” and “how” of a topic, before they can learn<br />
it. With those needs in mind, the following interventions/strategies have been chosen:<br />
2.1<br />
The EC (Early Childhood) teachers should focus on developing the linguistic intelligence, as identified<br />
by Howard Gardner, to assist their young students in expressing themselves verbally. Activities<br />
should include Nursery Rhymes, singing games, and stories with repeating word patterns. Students<br />
should be encouraged to speak and answer in complete sentences.<br />
2.3<br />
Early childhood students will be able to show improvement in the ability to speak in sentences of<br />
increasing length (three or more words) with grammatical complexity. EC students will have many<br />
opportunities to speak to others during center activities and during group time/story time activities<br />
allowing for “think, pair, share time” in making predictions of story outcomes. Language and<br />
vocabulary will be expanded through the retelling stories and the acting out of poems and nursery<br />
rhymes.<br />
See next page for continuation of this action plan.<br />
<strong>Anderson</strong> <strong>Elementary</strong> School SiPlan 2009 - 2010 - Page 14
Instructional Technology Integrated Strategies<br />
2.1<br />
EC teachers will utilize the Waterford Early Learning System .Starfall and Promethean Planet<br />
websites will be utilized as well throughout the school year.<br />
2.3<br />
EC teachers will utilize the Waterford Early Learning System.<br />
Procedural specificity will be detailed in individual teacher lesson plans.<br />
<strong>Anderson</strong> <strong>Elementary</strong> School SiPlan 2009 - 2010 - Page 15
Grade / Instructional Focus: (Pre K and Kindergarten, Early Childhood Area Math)<br />
Groups: _x_ Regular; _x_ IEP; _x_ ELL; _x_ Econ. Disadvantaged; _x_ Race; _x_ Gender<br />
Goal: Early Childhood students will demonstrate the ability to sort and group objects into a<br />
set and identify and create sets of objects from one through five as determined by district<br />
standards listed on the report card.<br />
Achievement Objective / Benchmark (median scores or assessment nomenclature):<br />
Standard Objective PASS Current %<br />
or assessment<br />
nomenclature<br />
Patterns<br />
Number<br />
Sense<br />
Sorts and groups<br />
objects into a set<br />
Identifies and<br />
creates sets of<br />
objects from one<br />
through five<br />
1.1 Proficiency on<br />
ECAT<br />
2.5 Proficiency on<br />
ECAT<br />
@ least half<br />
will score __<br />
as %<br />
or assessment<br />
nomenclature<br />
Proficiency<br />
on ECAT<br />
Proficiency<br />
on ECAT<br />
Years as<br />
Issue<br />
08-09<br />
08-09<br />
Interventions / Strategies:<br />
The following research-based strategies have been chosen specifically to meet the needs of students<br />
of each gender and race as well as those who are Special Needs or economically challenged.<br />
Female students benefit from verbal interaction, descriptive narration, and expressing emotional<br />
connections/experiences to the information. Male students benefit from simple, analytic explanation,<br />
kinesthetic movement, and visual images to aid in retention of information. According to Ruby Payne,<br />
economically challenged students, need to know the “why” and “how” of a topic, before they can learn<br />
it. With those needs in mind, the following interventions/strategies have been chosen:<br />
1.1<br />
The EC (Early Childhood) teachers should provide a variety of counting object for the students to sort<br />
in multiple ways in the math center as well as playing patterning games during group times. The<br />
Growing with Mathematics activities are used to reinforce and assess the concepts.<br />
2.5<br />
Early childhood students will be able to show improvement in the ability to create sets and count from<br />
numerous commercial and teacher-made learning games. Group time activities such as counting<br />
sticks, chants, and songs also provide practice create sets and recognizing numerals.<br />
Instructional Technology Integrated Strategies<br />
EC teachers will utilize the numerous appropriate web sites including :<br />
www.primarygames.com<br />
Procedural specificity will be detailed in individual teacher lesson plans.<br />
<strong>Anderson</strong> <strong>Elementary</strong> School SiPlan 2009 - 2010 - Page 16
Part II<br />
First Grade Reading Focus for Action Plans<br />
Assessments:<br />
Daily/ Weekly:<br />
• SRA Reading Checkouts, SRA Mastery Tests, CompassLearning Unit Assessments,<br />
Saxon Phonics Assessments, Progress Monitoring<br />
Periodically:<br />
• DIBELS Beginning of Year, Middle of Year, End of Year Assessments, Teacher-made<br />
Assessments<br />
Annually:<br />
• IOWA Test for Reading First<br />
Professional Development:<br />
• Educational Consulting Services/Kim Collier Technical Assistance, Tribes, Sharp<br />
School, Voyager U, Building Academic Vocabulary, Closing the Achievement<br />
Gap/Larry Bell Training, PowerSchool<br />
Parental Participation<br />
• Communicating –<br />
• First grade teachers will provide training for how to help students learn at home<br />
(homework or other content related projects) at Literacy Nights.<br />
• Parent/teacher conferences will provide a basis for periodic communication between<br />
parents and teachers regarding children’s literacy development. Information will be<br />
presented in an understandable way to parents.<br />
• Make-It/Take-It nights will provide first grade teachers with the opportunity to<br />
demonstrate strategies and techniques parents can use at home to further their child’s<br />
overall literacy development.<br />
• <strong>Schools</strong> shall ensure that information related to school and parent programs, meetings<br />
and other activities is sent to the parents of participating children in a format, and, to<br />
the extent practicable, in a language the parents can understand.<br />
• Parents shall receive assistance in understanding such topics as the state’s academic<br />
content and achievement standards, the assessments being used and how to monitor<br />
their children’s progress and work with educators to improve their achievement.<br />
• Family Literacy Nights will occur monthly in an effort to increase family involvement.<br />
• Learning at Home –<br />
• Reading Logs will provide parents a means to communicate their child’s reading<br />
progress at home.<br />
• <strong>Schools</strong> shall provide materials and training, such as literacy training and training on<br />
how to use technology, to help parents work with their children to improve<br />
achievement.<br />
<strong>Anderson</strong> <strong>Elementary</strong> School SiPlan 2009 - 2010 - Page 17
Part II<br />
First Grade Math Focus for Action Plans<br />
Assessments:<br />
Daily/ Weekly:<br />
• Saxon Math Assessments, CompassLearning Unit Assessments, FasttMath<br />
Differentiated Instruction Assessments<br />
Periodically:<br />
• Teacher-made Assessments<br />
Annually:<br />
• Saxon Math Pre and Post Tests<br />
Professional Development:<br />
• Educational Consulting Services/Kim Collier Technical Assistance, Tribes, Closing the<br />
Achievement Gap/Larry Bell Training, PowerSchool, Sharp School<br />
Parental Participation<br />
• Communicating –<br />
• Progress reports/report cards will be sent home at mid-quarter and end of quarter to<br />
inform parents of student progress.<br />
• First Grade Teachers will utilize personal progress notes, phone calls, and/or notes<br />
home to inform parents of their child’s progress in mathematics.<br />
• First Grade Teachers will invite parents to come in to a scheduled conference at any<br />
time of the year, to discuss any aspect of their child’s progress in the area of<br />
mathematics.<br />
• <strong>Schools</strong> shall ensure that information related to school and parent programs, meetings<br />
and other activities is sent to the parents of participating children in a format, and, to<br />
the extent practicable, in a language the parents can understand. (Communication)<br />
• Learning at Home –<br />
• First Grade Teachers will provide Skill Specific Homework in the areas of math that a<br />
child may be having trouble with.<br />
• First grade teachers will select specific weekly homework to monitor student mastery<br />
of skills.<br />
• Parents shall receive assistance in understanding such topics as the state’s<br />
academic content and achievement standards, the assessments being used and<br />
how to monitor their children’s progress and work with educators to improve their<br />
achievement. (and Parenting)<br />
<strong>Anderson</strong> <strong>Elementary</strong> School SiPlan 2009 - 2010 - Page 18
Grade / Instructional Focus: First Grade Reading<br />
Groups: _x_ Regular; _x_ IEP; _x_ ELL; _x_ Econ. Disadvantaged; _x_ Race; _x_ Gender<br />
Goal: All first grade students will be at Benchmark as determined by the DIBELS reading<br />
assessment.<br />
Achievement Objective / Benchmark (median scores or assessment nomenclature):<br />
Standard Objective PASS Current %<br />
or<br />
assessment<br />
nomenclature<br />
Print Awareness<br />
Recognize the<br />
difference among<br />
letters, words and<br />
sentences<br />
1.3 Move 50% of<br />
students from<br />
Intensive to<br />
Strategic<br />
@ least half<br />
will score __<br />
as % or<br />
assessment<br />
nomenclature<br />
Years as<br />
Issue<br />
Benchmark 08-09<br />
Phonological/Phonemic<br />
Awareness<br />
Comprehension/Critical<br />
Literacy<br />
Add or delete a<br />
phoneme change<br />
Literal<br />
Understanding<br />
2.6 Move 50% of<br />
students from<br />
Intensive to<br />
Strategic<br />
6.1 Move 50% of<br />
students from<br />
Intensive to<br />
Strategic<br />
Benchmark 07-08<br />
08-09<br />
Benchmark 07-08<br />
08-09<br />
Interventions / Strategies:<br />
The following research-based strategies have been chosen specifically to meet the needs of students<br />
of each gender and race as well as those who are Special Needs or economically challenged.<br />
Female students benefit from verbal interaction, descriptive narration, and expressing emotional<br />
connections/experiences to the information. Male students benefit from simple, analytic explanation,<br />
kinesthetic movement, and visual images to aid in retention of information. According to Ruby Payne,<br />
economically challenged students, need to know the “why” and “how” of a topic, before they can learn<br />
it. With those needs in mind, the following interventions/strategies have been chosen:<br />
1.3<br />
First grade teachers will use graphic organizers according to Marzano’s strategies to recognize the difference<br />
among letters, words and sentences. Teachers will also utilize the Voyager Passport intervention in the<br />
classroom daily. Teachers will utilize Direct Instruction through the SRA program.<br />
2.6<br />
First grade teachers will provide direct instruction through phoneme manipulation tasks and the use of<br />
Promethean Board magnetic letters where the use of knowledge (story vocabulary) as a s basis of adding or<br />
deleting a phoneme as well as through Scott Foresman reading program. Teachers will also us Voyager<br />
Passport intervention in the classroom daily.<br />
6.1<br />
Teachers will use Marzano’s Indentifying Similarities and Differences strategy to increase student’s literal<br />
understanding and general comprehension skills. The students will compare and contrast two different versions<br />
of the same story and discuss how they are alike and different. Teachers will also use the Voyager Passport<br />
intervention in the classroom daily. The Promethean Board will be used for graphic organizers according to<br />
Marzano’s strategies.<br />
See next page for continuation of this action plan.<br />
<strong>Anderson</strong> <strong>Elementary</strong> School SiPlan 2009 - 2010 - Page 19
Instructional Technology Integrated Strategies<br />
1.3<br />
Teachers use the Promethean Board System (Smart board) to provide instruction in completing<br />
graphic organizers. The overhead projector is used to develop a “working with words” center. First<br />
grade teachers will model and use www.starfall.com with students.<br />
2.6<br />
First grade teachers will utilize overhead projectors and letter tiles to engage students in utilizing<br />
phoneme addition and deletion in word identification and fluency development. Students will also use<br />
audio books to listen to rhyming words – repeated exposure.<br />
6.1<br />
Technology interventions for critical literacy and literal understanding include listening to one of the<br />
versions, or a different version, of The Little Red Hen on tape and then use of an overhead projector<br />
for large group presentation. A computer link to read another version of the story, The Little Red Hen,<br />
with additional interactive reading games is: http://pbskids.org/lions/help/.<br />
Procedural specificity will be detailed in individual teacher lesson plans.<br />
<strong>Anderson</strong> <strong>Elementary</strong> School SiPlan 2009 - 2010 - Page 20
Grade / Instructional Focus: First Grade Math<br />
Groups: _x_ Regular; _x_ IEP; _x_ ELL; _x_ Econ. Disadvantaged; _x_ Race; _x_ Gender<br />
Goal: All first grade students will be able to demonstrate proficiency at grade level or<br />
improve nine months over the previous years’ scores.<br />
Achievement Objective / Benchmark (median scores or assessment nomenclature):<br />
Standard Objective PASS Current %<br />
or<br />
assessment<br />
nomenclature<br />
Patterns<br />
Number Sense<br />
Number Operation and<br />
Computation<br />
Describe and<br />
create patterns<br />
Compare and<br />
order objects<br />
Develop/apply the<br />
concepts of<br />
addition and<br />
subtraction<br />
1.1 Students will<br />
show nine<br />
months<br />
growth<br />
2.2 Students will<br />
show nine<br />
months<br />
growth<br />
3.1 Students will<br />
show nine<br />
months<br />
growth<br />
@ least half<br />
will score __<br />
as % or<br />
assessment<br />
nomenclature<br />
75% or<br />
higher on<br />
Saxon Post<br />
Test<br />
75% or<br />
higher on<br />
Saxon Post<br />
Test<br />
75% or<br />
higher on<br />
Saxon Post<br />
Test<br />
Years as<br />
Issue<br />
07-08<br />
08-09<br />
07-08<br />
08-09<br />
07-08<br />
08-09<br />
Interventions / Strategies:<br />
The following research-based strategies have been chosen specifically to meet the needs of students<br />
of each gender and race as well as those who are Special Needs or economically challenged.<br />
Female students benefit from verbal interaction, descriptive narration, and expressing emotional<br />
connections/experiences to the information. Male students benefit from simple, analytic explanation,<br />
kinesthetic movement, and visual images to aid in retention of information. According to Ruby Payne,<br />
economically challenged students, need to know the “why” and “how” of a topic, before they can learn<br />
it. With those needs in mind, the following interventions/strategies have been chosen:<br />
1.1<br />
First grade teachers will provide repeated exposure to describing, building, and extending patterns using<br />
calendar and hundreds chart to count by 2’s, 5’s, 10’s linking materials.<br />
2.2<br />
First Grade Teachers will provide many repeated experiences using hands on methods to compare and order<br />
objects. They will address the concept of more, less and equal to.<br />
3.1<br />
First Grade Teachers will provide an early introduction of basic addition and subtraction skills, with ongoing<br />
practice and the concrete use of objects. (Kinesthetic) A weekly assessment, (ex. FASTTMATH) will be given to<br />
monitor students’ progress.<br />
See next page for continuation of this action plan.<br />
<strong>Anderson</strong> <strong>Elementary</strong> School SiPlan 2009 - 2010 - Page 21
Instructional Technology Integrated Strategies<br />
1.1<br />
As a technology component of this lesson, students may extend patterns using the following link<br />
http://www.teachrkids.com/examples/pattern.asp?advanced=2&count=5 , or they may create patterns<br />
by inserting clip art in Microsoft Word.<br />
3.1<br />
As a technology component of these interventions, students can use the following link to practice their<br />
addition and subtraction skills while using a number line http://www.funbrain.com/linejump/index.html.<br />
They may practice at the level of difficulty used in the classroom. They will also utilize the Fasttmath<br />
program in their classrooms where each student will practice math facts for six minutes per day.<br />
Procedural specificity will be detailed in individual teacher lesson plans.<br />
<strong>Anderson</strong> <strong>Elementary</strong> School SiPlan 2009 - 2010 - Page 22
Part II<br />
Second Grade Reading Focus for Action Plans<br />
Assessments:<br />
Daily/ Weekly:<br />
• SRA Checkouts, SRA Mastery Tests, Scott Foresman Unit Assessments, Teachermade<br />
Assessments, Progress Monitoring<br />
Periodically:<br />
• DIBELS Beginning of Year, Middle of Year, End of Year Assessments, Scott<br />
Foresman, Oklahoma Buckle Down<br />
Annually:<br />
• IOWA Test for Reading First, Benchmark Pre and Post Test<br />
Professional Development:<br />
• Educational Consulting Services/Kim Collier Technical Assistance, Voyager U, Tribes,<br />
Closing the Achievement Gap/Larry Bell Training, PowerSchool, Sharp School,<br />
Building Academic Vocabulary<br />
Parental Participation<br />
• Communicating –<br />
• Second grade teachers will provide training for how to help students learn at home<br />
(homework or other content related projects) at Literacy Nights.<br />
• Parent/teacher conferences will provide a basis for periodic communication between<br />
parents and teachers regarding children’s literacy development. Information will be<br />
presented in an understandable way to parents.<br />
• Make-It/Take-It nights will provide first grade teachers with the opportunity to<br />
demonstrate strategies and techniques parents can use at home to further their child’s<br />
overall literacy development.<br />
• <strong>Schools</strong> shall ensure that information related to school and parent programs, meetings<br />
and other activities is sent to the parents of participating children in a format, and, to<br />
the extent practicable, in a language the parents can understand.<br />
• Parents shall receive assistance in understanding such topics as the state’s academic<br />
content and achievement standards, the assessments being used and how to monitor<br />
their children’s progress and work with educators to improve their achievement.<br />
• Family Literacy Nights will occur monthly in an effort to increase family involvement.<br />
• Learning at Home –<br />
• Reading Logs will provide parents a means to communicate their child’s reading<br />
progress at home.<br />
• <strong>Schools</strong> shall provide materials and training, such as literacy training and training on<br />
how to use technology, to help parents work with their children to improve<br />
achievement.<br />
<strong>Anderson</strong> <strong>Elementary</strong> School SiPlan 2009 - 2010 - Page 23
Part II<br />
Second Grade Math Focus for Action Plans<br />
Assessments:<br />
Daily/ Weekly:<br />
• Saxon Math Assessments, CompassLearning Unit Assessments, FasttMath<br />
Differentiated Instruction Assessments, TPS Standard District Curriculum Benchmark<br />
Assessments<br />
Periodically:<br />
• Saxon Math, Oklahoma Buckle Down<br />
Annually:<br />
• Benchmark Assessments Pre and Post<br />
Professional Development:<br />
• Educational Consulting Services/Kim Collier Technical Assistance, Tribes, Closing the<br />
Achievement Gap/Larry Bell Training, PowerSchool, Sharp School<br />
Parental Participation<br />
• Communicating –<br />
• Progress reports/report cards will be sent home at mid-quarter and end of quarter to<br />
inform parents of student progress.<br />
• Second Grade Teachers will utilize personal progress notes, phone calls, and/or notes<br />
home to inform parents of their child’s progress in mathematics.<br />
• Second Grade Teachers will invite parents to come in to a scheduled conference at<br />
any time of the year, to discuss any aspect of their child’s progress in the area of<br />
mathematics.<br />
• <strong>Schools</strong> shall ensure that information related to school and parent programs, meetings<br />
and other activities is sent to the parents of participating children in a format, and, to<br />
the extent practicable, in a language the parents can understand. (Communication)<br />
• Learning at Home –<br />
• Second Grade Teachers will provide Skill Specific Homework in the areas of math that<br />
a child may be having trouble with.<br />
• Second grade teachers will select specific weekly homework to monitor student<br />
mastery of skills.<br />
• Parents shall receive assistance in understanding such topics as the state’s<br />
academic content and achievement standards, the assessments being used and<br />
how to monitor their children’s progress and work with educators to improve their<br />
achievement. (and Parenting)<br />
<strong>Anderson</strong> <strong>Elementary</strong> School SiPlan 2009 - 2010 - Page 24
Grade / Instructional Focus: Second Grade Reading<br />
Groups: _x_ Regular; _x_ IEP; _x_ ELL; _x_ Econ. Disadvantaged; _x_ Race; _x_ Gender<br />
Goal: All second grade students will demonstrate reading/language arts proficiency at grade<br />
level or above grade level on the Standard District Curriculum Benchmark Post Test<br />
Achievement Objective / Benchmark (median scores or assessment nomenclature):<br />
Standard Objective PASS Current %<br />
or<br />
assessment<br />
nomenclature<br />
Phonics/Decoding<br />
Phonemic<br />
Analysis<br />
@ least half<br />
will score<br />
__ as % or<br />
assessment<br />
nomenclature<br />
2.1 75 80 or<br />
higher<br />
Years<br />
as Issue<br />
07-08<br />
08-09<br />
Vocabulary Words in Context 3.1 75 80 or<br />
higher<br />
Fluency 4.0 75 80 or<br />
higher<br />
Comprehension/Critical Literal<br />
5.1 75 80 or<br />
Literacy<br />
Understanding<br />
higher<br />
07-08<br />
08-09<br />
07-08<br />
08-09<br />
07-08<br />
08-09<br />
Interventions / Strategies:<br />
The following research-based strategies have been chosen specifically to meet the needs of students<br />
of each gender and race as well as those who are Special Needs or economically challenged.<br />
Female students benefit from verbal interaction, descriptive narration, and expressing emotional<br />
connections/experiences to the information. Male students benefit from simple, analytic explanation,<br />
kinesthetic movement, and visual images to aid in retention of information. According to Ruby Payne,<br />
economically challenged students, need to know the “why” and “how” of a topic, before they can learn<br />
it. With those needs in mind, the following interventions/strategies have been chosen:<br />
2.1<br />
Students are actively involved in small groups and peer groups to practice decoding skills with phonics readers<br />
and making word activities. Teachers will provide images representing these sounds with the letters that<br />
produce each sound. Repeated practice with these images and letters will give the children a mental picture to<br />
help them recognize and use these sounds in decoding and later in spelling.<br />
3.1<br />
Second grade teachers will provide repeated exposure to vocabulary and sight words using Word Walls to<br />
display high-frequency words. They will use graphic organizers and K-W-L charts with students to activate their<br />
prior knowledge and personal experience to identify words in context.<br />
4.0<br />
Second grade teachers will use direct instruction in a small group setting to provide repeated opportunities to<br />
read at an instructional level by following the SRA Reading Mastery curriculum.<br />
5.1<br />
Teachers provide books for practice of pre-reading strategies ( i.e. activating prior knowledge, making<br />
predictions, using picture clues, and establishing a purpose for reading) as shown by the use of graphic<br />
organizers. Comprehension is evident through response to questions, student journals, and post-reading<br />
graphic organizers.<br />
See next page for continuation of this action plan.<br />
<strong>Anderson</strong> <strong>Elementary</strong> School SiPlan 2009 - 2010 - Page 25
Instructional Technology Integrated Strategies<br />
2.1<br />
Teachers use the Promethean Board System (Smart board) to provide instruction in word building,<br />
word families, and completing graphic organizers. Computers are used to reinforce beginning and<br />
ending sounds, vowel sounds, writing, and spelling. The overhead projector is used to develop a<br />
“working with words” center. Second grade teachers will model and use www.starfall.com with students.<br />
3.1<br />
Teacher approved reading websites including www.StarFall.com and www.PBSKids.org will be<br />
utilized to help students gain understanding in the area of vocabulary.<br />
4.0<br />
Teacher approved reading websites including www.StarFall.com and www.PBSKids.org will be<br />
utilized to help students gain understanding in the area of fluency. Students will also be allowed to<br />
use books on tape in the listening center.<br />
5.1<br />
Teachers and students use the computer to access: www.internet4classrooms.com, which provide a<br />
host of comprehension skills and strategies, such as inferring, summarizing and analyzing.<br />
Procedural specificity will be detailed in individual teacher lesson plans.<br />
<strong>Anderson</strong> <strong>Elementary</strong> School SiPlan 2009 - 2010 - Page 26
Grade / Instructional Focus: Second Grade Math<br />
Groups: _x_ Regular; _x_ IEP; _x_ ELL; _x_ Econ. Disadvantaged; _x_ Race; _x_ Gender<br />
Goal: All second grade students will demonstrate math proficiency at grade level or above<br />
grade level on the Standard District Curriculum Benchmark Post Test<br />
Achievement Objective / Benchmark (median scores or assessment nomenclature):<br />
Standard Objective PASS Current %<br />
or<br />
assessment<br />
nomenclature<br />
Number Operations<br />
and Computation<br />
Geometry and<br />
Measurement<br />
Develop/apply the<br />
concepts of<br />
addition and<br />
subtraction<br />
3.1 80% on<br />
the SDC<br />
Benchmark<br />
Post Test<br />
Measurement 4.2 80% on<br />
the SDC<br />
Benchmark<br />
Post Test<br />
Number Sense Place Value 2.1 80% on<br />
the SDC<br />
Benchmark<br />
Post Test<br />
Interventions / Strategies:<br />
@ least half<br />
will score<br />
__ as % or<br />
assessment<br />
nomenclature<br />
80 or<br />
higher<br />
80 or<br />
higher<br />
80 or<br />
higher<br />
Years<br />
as Issue<br />
06-07<br />
07-08<br />
08-09<br />
06-07<br />
07-08<br />
08-09<br />
06-07<br />
07-08<br />
08-09<br />
The following research-based strategies have been chosen specifically to meet the needs of students<br />
of each gender and race as well as those who are Special Needs or economically challenged.<br />
Female students benefit from verbal interaction, descriptive narration, and expressing emotional<br />
connections/experiences to the information. Male students benefit from simple, analytic explanation,<br />
kinesthetic movement, and visual images to aid in retention of information. According to Ruby Payne,<br />
economically challenged students, need to know the “why” and “how” of a topic, before they can learn<br />
it. With those needs in mind, the following interventions/strategies have been chosen:<br />
3.1<br />
Second grade teachers will provide hands-on manipulatives (i.e. base 10 blocks) for students to<br />
concretely show addition and subtraction with and without regrouping prior to the more abstract pencil<br />
and paper work.<br />
4.2<br />
Second grade teachers will access prior knowledge with a graphic organizer - KWHL (what they<br />
Know, Want to know, How they will learn the information, what they Learned) chart - before the<br />
children begin measuring objects of their choice with standard and non-standard units. Teachers will<br />
provide students will a visual for identifying different ways of measuring things in the classroom and<br />
beyond.<br />
2.1<br />
Second grade teachers will use direct instruction and Marzano’s massed and distributed practice to<br />
teach students how to determine the place value and name of numbers using a concrete model.<br />
See next page for continuation of this action plan.<br />
<strong>Anderson</strong> <strong>Elementary</strong> School SiPlan 2009 - 2010 - Page 27
Instructional Technology Integrated Strategies<br />
3.1<br />
The students will be able to practice the skill on appropriate websites: www.mathkids.com;<br />
www.coolmath.com ; www.superkids.com. They will also utilize the Fasttmath program for continued<br />
practice of their math facts.<br />
4.2<br />
Technology connections may be found on interactive educational websites such as<br />
http://www.apples4theteacher.com/measure.html and www.brainpop.com. Teachers may also assign<br />
activities from CompassLearning.<br />
2.1<br />
Second grade students will be given the opportunity to go to internet websites such as<br />
www.funbrain.com to reinforce math concepts of relating to place value<br />
Procedural specificity will be detailed in individual teacher lesson plans.<br />
<strong>Anderson</strong> <strong>Elementary</strong> School SiPlan 2009 - 2010 - Page 28
Part II<br />
Third Grade Reading Focus for Action Plans<br />
Assessments:<br />
Daily/ Weekly:<br />
• SRA Check-Outs and Mastery Tests, DIBELS Progress Monitoring, Scott Foresman<br />
Daily Lesson with Practice, Scott Foresman Comprehension Story Test, Differentiated<br />
Instruction<br />
Periodically:<br />
• DIBELS Reading Assessment, Scott Foresman Unit Test, Oklahoma Buckle Down,<br />
TPS Standard District Curriculum Benchmark Unit Assessments, Teacher-made<br />
Assessments<br />
Annually:<br />
• Benchmark Pre and Post Test, Oklahoma Core Curriculum Testing<br />
Professional Development:<br />
• Educational Consulting Services/Kim Collier Technical Assistance, Voyager U, Tribes,<br />
Closing the Achievement Gap/Larry Bell Training, PowerSchool, Sharp School,<br />
Building Academic Vocabulary<br />
Parental Participation<br />
• Communicating –<br />
• Third grade teachers will provide training for how to help students learn at home<br />
(homework or other content related projects) at Literacy Nights.<br />
• Parent/teacher conferences will provide a basis for periodic communication between<br />
parents and teachers regarding children’s literacy development. Information will be<br />
presented in an understandable way to parents.<br />
• Make-It/Take-It nights will provide first grade teachers with the opportunity to<br />
demonstrate strategies and techniques parents can use at home to further their child’s<br />
overall literacy development.<br />
• <strong>Schools</strong> shall ensure that information related to school and parent programs, meetings<br />
and other activities is sent to the parents of participating children in a format, and, to<br />
the extent practicable, in a language the parents can understand.<br />
• Parents shall receive assistance in understanding such topics as the state’s academic<br />
content and achievement standards, the assessments being used and how to monitor<br />
their children’s progress and work with educators to improve their achievement.<br />
• Family Literacy Nights will occur monthly in an effort to increase family involvement.<br />
• Learning at Home –<br />
• <strong>Schools</strong> shall provide materials and training, such as literacy training and training on<br />
how to use technology, to help parents work with their children to improve<br />
achievement.<br />
<strong>Anderson</strong> <strong>Elementary</strong> School SiPlan 2009 - 2010 - Page 29
Part II<br />
Third Grade Math Focus for Action Plans<br />
Assessments:<br />
Daily/ Weekly:<br />
• Saxon Math Assessments, CompassLearning Unit Assessments, FasttMath<br />
Differentiated Instruction Assessments, TPS Standard District Curriculum Benchmark<br />
Assessments, Teacher Made Assessments<br />
Periodically:<br />
• Saxon Math, Oklahoma Buckle Down, TPS Standard District Curriculum Benchmark<br />
Unit Tests<br />
Annually:<br />
• Benchmark Assessments Pre and Post, Oklahoma Core Curriculum Testing<br />
Professional Development:<br />
• Educational Consulting Services/Kim Collier Technical Assistance, Tribes, Closing the<br />
Achievement Gap/Larry Bell Training, PowerSchool, Sharp School<br />
Parental Participation<br />
• Communicating –<br />
• Progress reports/report cards will be sent home at mid-quarter and end of quarter to<br />
inform parents of student progress.<br />
• Third Grade Teachers will utilize personal progress notes, phone calls, and/or notes<br />
home to inform parents of their child’s progress in mathematics.<br />
• Third Grade Teachers will invite parents to come in to a scheduled conference at any<br />
time of the year, to discuss any aspect of their child’s progress in the area of<br />
mathematics.<br />
• <strong>Schools</strong> shall ensure that information related to school and parent programs, meetings<br />
and other activities is sent to the parents of participating children in a format, and, to<br />
the extent practicable, in a language the parents can understand. (Communication)<br />
• Learning at Home –<br />
• Third Grade Teachers will provide Skill Specific Homework in the areas of math that a<br />
child may be having trouble with.<br />
• Third grade teachers will select specific weekly homework to monitor student mastery<br />
of skills.<br />
• Parents shall receive assistance in understanding such topics as the state’s<br />
academic content and achievement standards, the assessments being used and<br />
how to monitor their children’s progress and work with educators to improve their<br />
achievement. (and Parenting)<br />
<strong>Anderson</strong> <strong>Elementary</strong> School SiPlan 2009 - 2010 - Page 30
Grade / Instructional Focus: Third Grade Reading<br />
Groups: _x_ Regular; _x_ IEP; _x_ ELL; _x_ Econ. Disadvantaged; _x_ Race; _x_ Gender<br />
Goal: All third grade students will demonstrate reading/language arts proficiency at grade<br />
level or above grade level on the Oklahoma Core Curriculum Test<br />
Achievement Objective / Benchmark (median scores or assessment nomenclature):<br />
Standard Objective PASS Current %<br />
or<br />
assessment<br />
nomenclature<br />
Research and<br />
Information<br />
6/12%<br />
Literature<br />
8/16%<br />
Comprehension/Critical<br />
Literacy<br />
24/48%<br />
Interventions / Strategies:<br />
Accessing<br />
Information<br />
6 items<br />
@ least half<br />
will score<br />
__ as % or<br />
assessment<br />
nomenclature<br />
6.1 50% 67% or<br />
higher<br />
5.0 63% 75% or<br />
higher<br />
4.0 63% 67% or<br />
higher<br />
Years<br />
as Issue<br />
08-09<br />
N/A<br />
08-09<br />
The following research-based strategies have been chosen specifically to meet the needs of students<br />
of each gender and race as well as those who are Special Needs or economically challenged.<br />
Female students benefit from verbal interaction, descriptive narration, and expressing emotional<br />
connections/experiences to the information. Male students benefit from simple, analytic explanation,<br />
kinesthetic movement, and visual images to aid in retention of information. According to Ruby Payne,<br />
economically challenged students, need to know the “why” and “how” of a topic, before they can learn<br />
it. With those needs in mind, the following interventions/strategies have been chosen:<br />
6.1<br />
Students will be provided with opportunities to access information from charts, maps, graphs, schedules,<br />
directions, and diagrams in all subject areas (Math, Science, Reading and Social Studies). Students will be<br />
directly taught how to use this information and to synthesize the information in various projects and reports.<br />
5.0<br />
As found in Marzano’s book Classroom Instruction that Works, students will use advance organizers to aide in<br />
the process of classifying characters, settings, plots, and conclusions from current and previous literature<br />
selections.<br />
4.0<br />
Third grade teachers will allow students to make and generate questions about their reading, as well as utilize<br />
graphic organizers (like a story map) to show literal understanding.<br />
. See next page for continuation of this action plan.<br />
<strong>Anderson</strong> <strong>Elementary</strong> School SiPlan 2009 - 2010 - Page 31
Instructional Technology Integrated Strategies<br />
6.1<br />
Students conduct research in the library and computer lab to learn which resource (i.e. dictionary,<br />
encyclopedia) to select for a given purpose. They will use CD and computer based sources to<br />
locate information as well as hard copy materials. Websites such as www.learning.com and<br />
software such as CompassLearning is available.<br />
5.0<br />
Using the following link: http://www.readwritethink.org/materials/lit-elements/ students will analyze a<br />
short story that they have recently read and complete an online Literary Elements about setting,<br />
character, conflict, and the resolution.<br />
4.0<br />
A KWL chart is a chart activating the students’ prior knowledge and arouses their curiosity about a<br />
topic. Students will list what they already Know (K) about the topic, questions they Want (W) to know<br />
about the topic, and what they have Learned (L) about the topic. For a blackline master go to<br />
http://www.eduplace.com/graphicorganizer and click on “KWL Chart.”<br />
Procedural specificity will be detailed in individual teacher lesson plans.<br />
<strong>Anderson</strong> <strong>Elementary</strong> School SiPlan 2009 - 2010 - Page 32
Grade / Instructional Focus: Third Grade Math<br />
Groups: _x_ Regular; _x_ IEP; _x_ ELL; _x_ Econ. Disadvantaged; _x_ Race; _x_ Gender<br />
Goal: All third grade students will demonstrate math proficiency at grade level or above<br />
grade level on the Oklahoma Core Curriculum Test<br />
Achievement Objective / Benchmark (median scores or assessment nomenclature):<br />
Standard Objective PASS Current %<br />
or<br />
assessment<br />
nomenclature<br />
Number Operations<br />
and Computation<br />
12/27%<br />
Geometry and<br />
Measurement<br />
12/27%<br />
Number Sense<br />
7/16%<br />
Interventions / Strategies:<br />
@ least half<br />
will score<br />
__ as % or<br />
assessment<br />
nomenclature<br />
3.0 42% 50% or<br />
higher<br />
4.0 58% 67% or<br />
higher<br />
2.0 57% 71% or<br />
higher<br />
Years<br />
as Issue<br />
06-07<br />
07-08<br />
08-09<br />
06-07<br />
07-08<br />
08-09<br />
06-07<br />
07-08<br />
08-09<br />
The following research-based strategies have been chosen specifically to meet the needs of students<br />
of each gender and race as well as those who are Special Needs or economically challenged.<br />
Female students benefit from verbal interaction, descriptive narration, and expressing emotional<br />
connections/experiences to the information. Male students benefit from simple, analytic explanation,<br />
kinesthetic movement, and visual images to aid in retention of information. According to Ruby Payne,<br />
economically challenged students, need to know the “why” and “how” of a topic, before they can learn<br />
it. With those needs in mind, the following interventions/strategies have been chosen:<br />
3.0<br />
Students will use everyday situations to develop background knowledge of estimation. Graph estimations on<br />
various items and topics. For example, estimate the height of, the circumference of, the length of. Compare<br />
actual measurements to that of the estimations. Model and solve multiplication problems using concrete<br />
materials. Create arrays to find factors. Use skip counting to teach transition facts. Show how relational –<br />
when numbers increase, students add or multiply; when numbers decrease students subtract or divide. Utilize<br />
manipulatives to show visual representation of multiplication concepts.<br />
4.0<br />
Teachers will use Marzano’s Informal Cooperative Learning Groups to teach customary units of measurement<br />
and have students practice estimating and then measuring objects.<br />
2.0<br />
Third grade teachers will use base 10 blocks and fraction strips and/or circles to provide manipulatives for<br />
students to manipulate as they identify and order whole numbers and fractions<br />
See next page for continuation of this action plan.<br />
<strong>Anderson</strong> <strong>Elementary</strong> School SiPlan 2009 - 2010 - Page 33
Instructional Technology Integrated Strategies<br />
3.0<br />
Students will use the Compass Learning program to identify how to use estimation to solve three and<br />
four digit numbers in addition and subtraction problems. They will also use the Fasttmath program for<br />
development of multiplication and division facts mastery.<br />
4.0<br />
Students can visit the following website in pairs or small groups<br />
http://www.shodor.org/interactivate/activities/perimeter/index.html for more practice with perimeter and<br />
area. Teachers may also assign activities from CompassLearning.<br />
2.0<br />
Teachers will use Compass Learning in which students will engage with mathematics program to add<br />
further practice for reading, writing and ordering whole numbers and fractions.<br />
Procedural specificity will be detailed in individual teacher lesson plans.<br />
<strong>Anderson</strong> <strong>Elementary</strong> School SiPlan 2009 - 2010 - Page 34
Part II<br />
Fourth Grade Reading Focus for Action Plans<br />
Assessments:<br />
Daily/ Weekly:<br />
• Scott Foresman Daily Lesson with Practice, Scott Foresman Comprehension Story<br />
Test, Differentiated Instruction<br />
Periodically:<br />
• Scott Foresman Unit Test, Oklahoma Buckle Down, TPS Standard District Curriculum<br />
Benchmark Unit Assessments, Teacher-made Assessments<br />
Annually:<br />
• Benchmark Pre and Post Test, Oklahoma Core Curriculum Testing<br />
Professional Development:<br />
• Educational Consulting Services/Kim Collier Technical Assistance, Voyager U, Tribes,<br />
Closing the Achievement Gap/Larry Bell Training, PowerSchool, Sharp School,<br />
Building Academic Vocabulary<br />
Parental Participation<br />
• Communicating –<br />
• Fourth grade teachers will provide training for how to help students learn at home<br />
(homework or other content related projects) at Literacy Nights.<br />
• Parent/teacher conferences will provide a basis for periodic communication between<br />
parents and teachers regarding children’s literacy development. Information will be<br />
presented in an understandable way to parents.<br />
• Make-It/Take-It nights will provide first grade teachers with the opportunity to<br />
demonstrate strategies and techniques parents can use at home to further their child’s<br />
overall literacy development.<br />
• <strong>Schools</strong> shall ensure that information related to school and parent programs, meetings<br />
and other activities is sent to the parents of participating children in a format, and, to<br />
the extent practicable, in a language the parents can understand.<br />
• Parents shall receive assistance in understanding such topics as the state’s academic<br />
content and achievement standards, the assessments being used and how to monitor<br />
their children’s progress and work with educators to improve their achievement.<br />
• Family Literacy Nights will occur monthly in an effort to increase family involvement.<br />
• Learning at Home –<br />
• Reading Logs will provide parents a means to communicate their child’s reading<br />
progress at home.<br />
• <strong>Schools</strong> shall provide materials and training, such as literacy training and training on<br />
how to use technology, to help parents work with their children to improve<br />
achievement.<br />
<strong>Anderson</strong> <strong>Elementary</strong> School SiPlan 2009 - 2010 - Page 35
Part II<br />
Fourth Grade Math Focus for Action Plans<br />
Assessments:<br />
Daily/ Weekly:<br />
• Saxon Math Assessments, CompassLearning Unit Assessments, FasttMath<br />
Differentiated Instruction Assessments, TPS Standard District Curriculum Benchmark<br />
Assessments<br />
Periodically:<br />
• Saxon Math, Oklahoma Buckle Down, TPS Standard District Curriculum Benchmark<br />
Unit Tests<br />
Annually:<br />
• Benchmark Assessments Pre and Post, Oklahoma Core Curriculum Testing<br />
Professional Development:<br />
• Educational Consulting Services/Kim Collier Technical Assistance, Tribes, Closing the<br />
Achievement Gap/Larry Bell Training, PowerSchool, Sharp School<br />
Parental Participation<br />
• Communicating –<br />
• Progress reports/report cards will be sent home at mid-quarter and end of quarter to<br />
inform parents of student progress.<br />
• Fourth Grade Teachers will utilize personal progress notes, phone calls, and/or notes<br />
home to inform parents of their child’s progress in mathematics.<br />
• Fourth Grade Teachers will invite parents to come in to a scheduled conference at any<br />
time of the year, to discuss any aspect of their child’s progress in the area of<br />
mathematics.<br />
• <strong>Schools</strong> shall ensure that information related to school and parent programs, meetings<br />
and other activities is sent to the parents of participating children in a format, and, to<br />
the extent practicable, in a language the parents can understand. (Communication)<br />
• Learning at Home –<br />
• Fourth Grade Teachers will provide Skill Specific Homework in the areas of math that<br />
a child may be having trouble with.<br />
• Fourth grade teachers will select specific weekly homework to monitor student mastery<br />
of skills.<br />
• Parents shall receive assistance in understanding such topics as the state’s<br />
academic content and achievement standards, the assessments being used and<br />
how to monitor their children’s progress and work with educators to improve their<br />
achievement. (and Parenting)<br />
<strong>Anderson</strong> <strong>Elementary</strong> School SiPlan 2009 - 2010 - Page 36
Grade / Instructional Focus: Fourth Grade Reading<br />
Groups: _x_ Regular; _x_ IEP; _x_ ELL; _x_ Econ. Disadvantaged; _x_ Race; _x_ Gender<br />
Goal: All fourth grade students will demonstrate reading, vocabulary and comprehension<br />
proficiency at grade level or above on the Oklahoma Core Curriculum Test.<br />
Achievement Objective / Benchmark (median scores or assessment nomenclature):<br />
Standard Objective PASS Current %<br />
or<br />
assessment<br />
nomenclature<br />
Vocabulary<br />
12/24%<br />
Comprehension<br />
and Critical Literacy<br />
23/46%<br />
Research and<br />
Information<br />
6/12%<br />
Accessing<br />
Information<br />
6 items<br />
@ least half<br />
will score<br />
__ as % or<br />
assessment<br />
nomenclature<br />
1.0 67% 75% or<br />
Years<br />
as Issue<br />
08-09<br />
higher<br />
3.0 61% 65% or<br />
higher 08-09<br />
5.1 56% 67% or<br />
higher<br />
Interventions / Strategies:<br />
The following research-based strategies have been chosen specifically to meet the needs of students of each<br />
gender and race as well as those who are Special Needs or economically challenged. Female students benefit<br />
from verbal interaction, descriptive narration, and expressing emotional connections/experiences to the<br />
information. Male students benefit from simple, analytic explanation, kinesthetic movement, and visual images<br />
to aid in retention of information. According to Ruby Payne, economically challenged students, need to know<br />
the “why” and “how” of a topic, before they can learn it. With those needs in mind, the following<br />
interventions/strategies have been chosen:<br />
1.0<br />
Fourth grade teachers will use Marzano’s Cues, Questions, and Advanced Organizers Strategies and<br />
Cooperative Learning to develop an understanding of the vocabulary in a reading selection. First,<br />
students will select 3 vocabulary words from the reading selection. Next, they will complete the<br />
Vocabulary Web for each word selected. After completion of the web, they will share their webs with<br />
their cooperative learning group. The group will then choose the best Vocabulary Web to share with<br />
the class. Finally, each group will share their selected web and explain how this activity increased<br />
their understanding of the vocabulary words. Fourth grade teachers will participate in a school-wide<br />
in-service where they view an ASCD video called Building Academic Vocabulary: A Six-Step Process<br />
for Teaching Vocabulary and a book study using the book Building Academic Vocabulary to improve<br />
understanding words in context.<br />
3.0<br />
Teachers will use KWL strategies to activate prior knowledge. They will use QAR (Question, Answer,<br />
Relationship) comprehension strategy when teaching reading. Teachers will introduce Sequoyah and<br />
Newbery Award winning lists to students through model reading to help students read and<br />
comprehend poetry, fiction, and non-fiction. Students will partner read daily. Fourth grade teachers<br />
will utilize Marzano’s strategies of identifying differences in fiction and non-fiction text using graphic<br />
organizers.<br />
5.1<br />
Fourth grade teachers will actively involve all students in cooperative learning groups where they<br />
research topics of interest using multiple sources. Teachers will monitor comprehension of accessed<br />
information with graphic organizers. They will also employ learning opportunities where children utilize<br />
<strong>Anderson</strong> <strong>Elementary</strong> School SiPlan 2009 - 2010 - Page 37
Marzano’s note taking skills when recording information.<br />
Instructional Technology Integrated Strategies<br />
1.0<br />
Fourth grade teachers will use the computer and Aver Key to display a given passage where children<br />
have to use context clues to figure out missing words. Fourth grade teachers will prescribe online<br />
vocabulary activities from various sites such as: www.vocabulary.com/; http://www.vocabulary.co.il/<br />
3.0<br />
Students will practice and pass the Main Idea & Supporting Detail test on CompassLearning to<br />
increase comprehension of reading passages.<br />
5.1<br />
Teacher will model researching related information from leveled text on the Promethean Board (using<br />
technology and key words) with whole class then choose student to do the same with teacher<br />
supervision. After procedures and limits have been set, teacher with allow groups of two to do<br />
research on the internet using technology such as United Streaming or MarcoPolo Ed.<br />
Procedural specificity will be detailed in individual teacher lesson plans.<br />
<strong>Anderson</strong> <strong>Elementary</strong> School SiPlan 2009 - 2010 - Page 38
Grade / Instructional Focus: Fourth Grade Math<br />
Groups: _x_ Regular; _x_ IEP; _x_ ELL; _x_ Econ. Disadvantaged; _x_ Race; _x_ Gender<br />
Goal: All fourth grade students will demonstrate math proficiency at grade level or above<br />
on the Oklahoma Core Curriculum Test.<br />
Achievement Objective / Benchmark (median scores or assessment nomenclature):<br />
Standard Objective PASS Current %<br />
or<br />
assessment<br />
nomenclature<br />
Number Operations and<br />
Computation<br />
11/24%<br />
Geometry and<br />
Measurement<br />
10/22%<br />
Number Sense<br />
10/22%<br />
@ least half<br />
will score<br />
__ as % or<br />
assessment<br />
nomenclature<br />
3.0 36% 45% or<br />
higher<br />
4.0 60% 70% or<br />
higher<br />
2.0 70% 80% or<br />
higher<br />
Years<br />
as Issue<br />
07-08<br />
08-09<br />
07-08<br />
08-09<br />
06-07<br />
07-08<br />
08-09<br />
Interventions / Strategies:<br />
The following research-based strategies have been chosen specifically to meet the needs of students of each<br />
gender and race as well as those who are Special Needs or economically challenged. Female students benefit<br />
from verbal interaction, descriptive narration, and expressing emotional connections/experiences to the<br />
information. Male students benefit from simple, analytic explanation, kinesthetic movement, and visual images<br />
to aid in retention of information. According to Ruby Payne, economically challenged students, need to know<br />
the “why” and “how” of a topic, before they can learn it. With those needs in mind, the following<br />
interventions/strategies have been chosen:<br />
3.0<br />
Fourth grade teachers will teach multiplication using various strategies, including multiplication arrays,<br />
lattice multiplication, and partial product algorithm. Base ten blocks, Unifix cubes, and Cuisenaire<br />
Rods will be used to provide a concrete visual means of understanding multiplication. Using<br />
Marzano’s strategies, students will memorize and apply multiplication facts. Fourth grade teachers will<br />
improve their fluency with basic multiplication facts. This will be improved through games in class,<br />
homework, and demonstration in the classroom.<br />
4.0<br />
Teachers will use Marzano’s Informal Cooperative Learning Groups to identify, model, and compare<br />
lines and angles. Using Marilyn Burns' strategy of real world problem solving, teachers will present<br />
math activities involving money, time, and temperature using real world contexts.<br />
2.0<br />
Teachers will use Marzano’s strategy of Classroom Practice and Cueing to apply the concept of number sense.<br />
See next page for continuation of this action plan.<br />
<strong>Anderson</strong> <strong>Elementary</strong> School SiPlan 2009 - 2010 - Page 39
Instructional Technology Integrated Strategies<br />
3.0<br />
Teachers will use computer program Fasttmath for drill and practice of facts. Calculators will also be used for<br />
simple and complex problem solving.<br />
4.0<br />
Fourth grade teachers will utilize the computer lab and the computers in the classroom. The students will be<br />
exposed to various websites such as www.funbrain.com, etc.<br />
2.0<br />
Teachers will access http://www.aaamath.com/ using the computer to model how to do some of the activities on<br />
this site. Students will also use Compass Learning computer programs.<br />
Procedural specificity will be detailed in individual teacher lesson plans.<br />
<strong>Anderson</strong> <strong>Elementary</strong> School SiPlan 2009 - 2010 - Page 40
Part II<br />
Fifth Grade Reading Focus for Action Plans<br />
Assessments:<br />
Daily/ Weekly:<br />
• Building Academic Vocabulary, SRA Reading Mastery, Daily Homework, Oklahoma<br />
Buckle Down<br />
Periodically:<br />
• Scott Foresman Unit Test, Oklahoma Buckle Down, TPS Standard District Curriculum<br />
Benchmark Unit Assessments, Teacher-made Assessments<br />
Annually:<br />
• Benchmark Pre and Post Test, Oklahoma Core Curriculum Testing, OCCT Writing<br />
Professional Development:<br />
• Educational Consulting Services/Kim Collier Technical Assistance, Voyager U, Tribes,<br />
Closing the Achievement Gap/Larry Bell Training, PowerSchool, Sharp School,<br />
Building Academic Vocabulary, Writing workshops through Fulton Teaching and<br />
Learning Academy<br />
Parental Participation<br />
• Communicating –<br />
• Fifth grade teachers will provide training for how to help students learn at home<br />
(homework or other content related projects) at Literacy Nights.<br />
• Parent/teacher conferences will provide a basis for periodic communication between<br />
parents and teachers regarding children’s literacy development. Information will be<br />
presented in an understandable way to parents.<br />
• Make-It/Take-It nights will provide first grade teachers with the opportunity to<br />
demonstrate strategies and techniques parents can use at home to further their child’s<br />
overall literacy development.<br />
• <strong>Schools</strong> shall ensure that information related to school and parent programs, meetings<br />
and other activities is sent to the parents of participating children in a format, and, to<br />
the extent practicable, in a language the parents can understand.<br />
• Parents shall receive assistance in understanding such topics as the state’s academic<br />
content and achievement standards, the assessments being used and how to monitor<br />
their children’s progress and work with educators to improve their achievement.<br />
• Family Literacy Nights will occur monthly in an effort to increase family involvement.<br />
• Learning at Home –<br />
• Reading Logs will provide parents a means to communicate their child’s reading<br />
progress at home.<br />
• <strong>Schools</strong> shall provide materials and training, such as literacy training and training on<br />
how to use technology, to help parents work with their children to improve<br />
achievement.<br />
<strong>Anderson</strong> <strong>Elementary</strong> School SiPlan 2009 - 2010 - Page 41
Part II<br />
Fifth Grade Math Focus for Action Plans<br />
Assessments:<br />
Daily/ Weekly:<br />
• Saxon Math Assessments, CompassLearning Unit Assessments, FasttMath<br />
Differentiated Instruction Assessments, TPS Standard District Curriculum Benchmark<br />
Assessments<br />
Periodically:<br />
• Saxon Math, Oklahoma Buckle Down, TPS Standard District Curriculum Benchmark<br />
Unit Tests<br />
Annually:<br />
• Benchmark Assessments Pre and Post, Oklahoma Core Curriculum Testing<br />
Professional Development:<br />
• Educational Consulting Services/Kim Collier Technical Assistance, Tribes, Closing the<br />
Achievement Gap/Larry Bell Training, PowerSchool, Sharp School<br />
Parental Participation<br />
• Communicating –<br />
• Progress reports/report cards will be sent home at mid-quarter and end of quarter to<br />
inform parents of student progress.<br />
• Fifth Grade Teachers will utilize personal progress notes, phone calls, and/or notes<br />
home to inform parents of their child’s progress in mathematics.<br />
• Fifth Grade Teachers will invite parents to come in to a scheduled conference at any<br />
time of the year, to discuss any aspect of their child’s progress in the area of<br />
mathematics.<br />
• <strong>Schools</strong> shall ensure that information related to school and parent programs, meetings<br />
and other activities is sent to the parents of participating children in a format, and, to<br />
the extent practicable, in a language the parents can understand. (Communication)<br />
• Learning at Home –<br />
• Fifth Grade Teachers will provide Skill Specific Homework in the areas of math that a<br />
child may be having trouble with.<br />
• Fifth grade teachers will select specific weekly homework to monitor student mastery<br />
of skills.<br />
• Parents shall receive assistance in understanding such topics as the state’s<br />
academic content and achievement standards, the assessments being used and<br />
how to monitor their children’s progress and work with educators to improve their<br />
achievement. (and Parenting)<br />
<strong>Anderson</strong> <strong>Elementary</strong> School SiPlan 2009 - 2010 - Page 42
Part II<br />
Fifth Grade Science Focus for Action Plans<br />
Assessments:<br />
Periodically:<br />
• End of Mission Tests<br />
Annually:<br />
• Oklahoma Core Curriculum Testing<br />
Professional Development:<br />
• Educational Consulting Services/Kim Collier Technical Assistance, Tribes, Closing the<br />
Achievement Gap/Larry Bell Training, PowerSchool, Sharp School, Synergistic<br />
Missions Lab Training<br />
Parental Participation<br />
• Communicating –<br />
• Progress reports/report cards will be sent home at mid-quarter and end of quarter to<br />
inform parents of student progress.<br />
• Fifth Grade Teachers will utilize personal progress notes, phone calls, and/or notes<br />
home to inform parents of their child’s progress in mathematics.<br />
• <strong>Schools</strong> shall ensure that information related to school and parent programs, meetings<br />
and other activities is sent to the parents of participating children in a format, and, to<br />
the extent practicable, in a language the parents can understand. (Communication)<br />
• Learning at Home –<br />
• Fifth Grade Teachers will provide Skill Specific Homework in the areas of science that<br />
a child may be having trouble with.<br />
• Parents shall receive assistance in understanding such topics as the state’s<br />
academic content and achievement standards, the assessments being used and<br />
how to monitor their children’s progress and work with educators to improve their<br />
achievement. (and Parenting)<br />
<strong>Anderson</strong> <strong>Elementary</strong> School SiPlan 2009 - 2010 - Page 43
Part II<br />
Fifth Grade Social Studies Focus for Action Plans<br />
Assessments:<br />
Periodically:<br />
• End of Chapter Tests<br />
• End of Unit Tests<br />
Annually:<br />
• Oklahoma Core Curriculum Testing<br />
Professional Development:<br />
• Educational Consulting Services/Kim Collier Technical Assistance, Tribes,<br />
PowerSchool, Sharp School, Synergistic Missions Lab Training<br />
Parental Participation<br />
• Communicating –<br />
• Progress reports/report cards will be sent home at mid-quarter and end of quarter to<br />
inform parents of student progress.<br />
• Fifth Grade Teachers will utilize personal progress notes, phone calls, and/or notes<br />
home to inform parents of their child’s progress in mathematics.<br />
• <strong>Schools</strong> shall ensure that information related to school and parent programs, meetings<br />
and other activities is sent to the parents of participating children in a format, and, to<br />
the extent practicable, in a language the parents can understand. (Communication)<br />
• Learning at Home –<br />
• Fifth Grade Teachers will provide Skill Specific Homework in the areas of social<br />
studies that a child may be having trouble with.<br />
• Parents shall receive assistance in understanding such topics as the state’s<br />
academic content and achievement standards, the assessments being used and<br />
how to monitor their children’s progress and work with educators to improve their<br />
achievement. (and Parenting)<br />
<strong>Anderson</strong> <strong>Elementary</strong> School SiPlan 2009 - 2010 - Page 44
Grade / Instructional Focus: Fifth Grade Reading<br />
Groups: _x_ Regular; _x_ IEP; _x_ ELL; _x_ Econ. Disadvantaged; _x_ Race; _x_ Gender<br />
Goal: All fifth grade students will demonstrate reading/language arts proficiency at grade<br />
level or above on the Oklahoma Core Curriculum Test.<br />
Achievement Objective / Benchmark (median scores or assessment nomenclature):<br />
Standard Objective PASS Current %<br />
or<br />
assessment<br />
nomenclature<br />
Research and<br />
Information<br />
6/12%<br />
Comprehension and<br />
Critical Literacy<br />
20/40%<br />
Vocabulary<br />
12/24%<br />
@ least half<br />
will score<br />
__ as % or<br />
assessment<br />
nomenclature<br />
Years<br />
as Issue<br />
5.0 67% 83% or<br />
higher 08-09<br />
3.0 68% 75% or<br />
higher<br />
1.0 71% 75% or<br />
higher<br />
07-08<br />
08-09<br />
06-07<br />
07-08<br />
08-09<br />
Interventions / Strategies:<br />
The following research-based strategies have been chosen specifically to meet the needs of students of each<br />
gender and race as well as those who are Special Needs or economically challenged. Female students benefit<br />
from verbal interaction, descriptive narration, and expressing emotional connections/experiences to the<br />
information. Male students benefit from simple, analytic explanation, kinesthetic movement, and visual images<br />
to aid in retention of information. According to Ruby Payne, economically challenged students, need to know<br />
the “why” and “how” of a topic, before they can learn it. With those needs in mind, the following<br />
interventions/strategies have been chosen:<br />
5.0<br />
Fifth grade teachers will involve all students in cooperative learning groups, in which they research<br />
topics of interest using reference sources provided. They will monitor comprehension of accessed<br />
information with the use of graphic organizers. Fifth grade students will show an understanding of<br />
research information / data by developing a brief research paper using dictionary, thesaurus,<br />
encyclopedias, Internet to gather information of chosen research topic. Furthermore, students will<br />
credit the sources using text features, i.e., Italics, heading, sub heading, charts, maps… to organize<br />
and support and understand of information. Students will learn how to use reference features such as<br />
citations, end notes, and bibliography to locate information about a topic. Fifth grade teacher will<br />
demonstrate and model all components of a research paper. Fifth grade teachers will involve all<br />
students in research topics using atlases, encyclopedias, dictionaries, internet, almanacs, and<br />
thesauruses to access information for recording and note taking.<br />
3.0<br />
Fifth grade teachers will participate in a school-wide in-service where they view an ASCD video called<br />
Building Academic Vocabulary: A Six-Step Process for Teaching Vocabulary and a book study using<br />
the book Building Academic Vocabulary to improve understanding words in context. B) Fifth grade<br />
teachers will participate in school-wide in-service programs learning how to utilize the Question<br />
Answer Relationship Strategy (QAR) and Bloom’s Taxonomy questioning strategies to enhance<br />
critical literacy relating to figurative language and sound devises and using pre-reading strategies.<br />
1.0<br />
Fifth grade teachers will provide direct instruction through repeated word knowledge activities, and<br />
<strong>Anderson</strong> <strong>Elementary</strong> School SiPlan 2009 - 2010 - Page 45
then allow for cooperative and independent practice. CompassLearning and Scott Foresman reading<br />
program activities should be used as well.<br />
Instructional Technology Integrated Strategies<br />
5.0<br />
Teachers will use the CompassLearning program on the computer along with research on the internet.<br />
3.0<br />
Fifth grade teachers will explore the use of various web sites to support improved instruction in Literal<br />
Understanding and Literary Elements. They will share these learned strategies with the staff for classroom use.<br />
Examples:<br />
http://www.readwritethink.org/ http://webster.com<br />
1.0<br />
Fifth grade teachers will use the CompassLearning program to provide practice for using and reading words in<br />
context. Teachers will monitor progress and adjust programs to fit student needs.<br />
Procedural specificity will be detailed in individual teacher lesson plans.<br />
<strong>Anderson</strong> <strong>Elementary</strong> School SiPlan 2009 - 2010 - Page 46
Grade / Instructional Focus: Fifth Grade Math<br />
Groups: _x_ Regular; _x_ IEP; _x_ ELL; _x_ Econ. Disadvantaged; _x_ Race; _x_ Gender<br />
Goal: All fifth grade students will demonstrate math proficiency at grade level or above on<br />
the Oklahoma Core Curriculum Test.<br />
Achievement Objective / Benchmark (median scores or assessment nomenclature):<br />
Standard Objective PASS Current %<br />
or<br />
assessment<br />
nomenclature<br />
Number Operations and<br />
Computation<br />
8/18%<br />
Patterns and Algebraic<br />
Reasoning<br />
8/18%<br />
Number Sense<br />
8/18%<br />
Algebra Patterns<br />
4 items<br />
Fractions,<br />
Decimals and<br />
Percents,4 items<br />
@ least half<br />
will score<br />
__ as % or<br />
assessment<br />
nomenclature<br />
3.0 25% 38% or<br />
higher<br />
1.1 50% 75% or<br />
higher<br />
2.1 50% 75% or<br />
higher<br />
Years<br />
as Issue<br />
07-08<br />
08-09<br />
07-08<br />
08-09<br />
06-07<br />
07-08<br />
08-09<br />
Interventions / Strategies:<br />
The following research-based strategies have been chosen specifically to meet the needs of students of each<br />
gender and race as well as those who are Special Needs or economically challenged. Female students benefit<br />
from verbal interaction, descriptive narration, and expressing emotional connections/experiences to the<br />
information. Male students benefit from simple, analytic explanation, kinesthetic movement, and visual images<br />
to aid in retention of information. According to Ruby Payne, economically challenged students, need to know<br />
the “why” and “how” of a topic, before they can learn it. With those needs in mind, the following<br />
interventions/strategies have been chosen:<br />
3.0<br />
Fifth grade teachers will provide situations in which students estimate and find solutions to problems<br />
involving decimals, percents and fractions. Fifth grade teachers will teach percents and fractions using<br />
Marzano’s non-linguistic representation (with pictures, manipulatives, etc.).<br />
1.1<br />
Fifth grade teachers will have students use abstract figures to create and solve algebraic patterns and<br />
equations. Students will describe rules that produce patterns found in tables, graphs, and models and<br />
use variables to solve problems or to describe in general rules in algebraic expression or equation<br />
form. Fifth grade teachers will enable the students to use manipulates repeatedly.<br />
2.1<br />
Fifth grade teachers will provide manipulatives for children to model place-value, working with<br />
fractions and decimals. They will use concrete objects to build an understanding for an abstract<br />
thought process. Children will use their knowledge base to apply properties in math problems.<br />
See next page for continuation of this action plan.<br />
<strong>Anderson</strong> <strong>Elementary</strong> School SiPlan 2009 - 2010 - Page 47
Instructional Technology Integrated Strategies<br />
3.0<br />
Estimate and find the product of 2- and 3-digit numbers to solve application problems. Teachers will<br />
allow students to use the website http://www.dositey.com to improve their multiplication skills through<br />
fun games.<br />
1.1<br />
Fifth grade students will practice pattern activities at: www.mathplayground.com ; www.funbrain.com<br />
2.1<br />
Students can be given the opportunity to visit http://www.mrnussbaum.com/dec0210.htm to<br />
interactively work with numbers to understand the basic concepts and properties.<br />
Procedural specificity will be detailed in individual teacher lesson plans.<br />
<strong>Anderson</strong> <strong>Elementary</strong> School SiPlan 2009 - 2010 - Page 48
Grade / Instructional Focus: Fifth Grade Science<br />
Groups: _x_ Regular; _x_ IEP; _x_ ELL; _x_ Econ. Disadvantaged; _x_ Race; _x_ Gender<br />
Goal: All fifth grade students will demonstrate science proficiency at grade level or above<br />
on the Oklahoma Core Curriculum Test.<br />
Achievement Objective / Benchmark (median scores or assessment nomenclature):<br />
Standard Objective PASS Current %<br />
or<br />
assessment<br />
nomenclature<br />
Experiment<br />
11/24%<br />
Properties of Matter<br />
and Energy<br />
18/44%<br />
Experimental<br />
Design<br />
@ least half<br />
will score<br />
__ as % or<br />
assessment<br />
nomenclature<br />
3.2 29% 43% or<br />
higher<br />
C1.0 39% 44% or<br />
higher<br />
Years<br />
as Issue<br />
Interventions / Strategies:<br />
The following research-based strategies have been chosen specifically to meet the needs of students of each<br />
gender and race as well as those who are Special Needs or economically challenged. Female students benefit<br />
from verbal interaction, descriptive narration, and expressing emotional connections/experiences to the<br />
information. Male students benefit from simple, analytic explanation, kinesthetic movement, and visual images<br />
to aid in retention of information. According to Ruby Payne, economically challenged students, need to know<br />
the “why” and “how” of a topic, before they can learn it. With those needs in mind, the following<br />
interventions/strategies have been chosen:<br />
3.2<br />
Fifth grade teachers will provide opportunities for students to design and perform experiments using<br />
hands-on inquiry-based teaching strategies.<br />
C1.0<br />
Fifth grade teachers will have students use abstract figures and manipulatives to understand the<br />
properties of matter and energy. They will focus on how matter and organisms with mass produce<br />
energy.<br />
Instructional Technology Integrated Strategies<br />
3.2<br />
Students will use the computer lab to research and develop their experiments using the scientific<br />
method.<br />
C1.0<br />
Fifth grade students will use various computer software games and learning activities to further their<br />
learning of matter and energy.<br />
Procedural specificity will be detailed in individual teacher lesson plans.<br />
N/A<br />
N/A<br />
<strong>Anderson</strong> <strong>Elementary</strong> School SiPlan 2009 - 2010 - Page 49
Grade / Instructional Focus: Fifth Grade Social Studies<br />
Groups: _x_ Regular; _x_ IEP; _x_ ELL; _x_ Econ. Disadvantaged; _x_ Race; _x_ Gender<br />
Goal: All fifth grade students will demonstrate social studies proficiency at grade level or<br />
above on the Oklahoma Core Curriculum Test.<br />
Achievement Objective / Benchmark (median scores or assessment nomenclature):<br />
Standard Objective PASS Current %<br />
or<br />
assessment<br />
nomenclature<br />
Early Exploration<br />
8/13%<br />
American Revolution<br />
12/20%<br />
Native American<br />
Reaction<br />
Declaration of<br />
Independence<br />
@ least half<br />
will score<br />
__ as % or<br />
assessment<br />
nomenclature<br />
2.2 25% 50% or<br />
higher<br />
4.3 25% 50% or<br />
higher<br />
Years<br />
as Issue<br />
Interventions / Strategies:<br />
The following research-based strategies have been chosen specifically to meet the needs of students of each<br />
gender and race as well as those who are Special Needs or economically challenged. Female students benefit<br />
from verbal interaction, descriptive narration, and expressing emotional connections/experiences to the<br />
information. Male students benefit from simple, analytic explanation, kinesthetic movement, and visual images<br />
to aid in retention of information. According to Ruby Payne, economically challenged students, need to know<br />
the “why” and “how” of a topic, before they can learn it. With those needs in mind, the following<br />
interventions/strategies have been chosen:<br />
2.2<br />
Fifth grade teachers will provide opportunities for students to learn about the Native American reaction<br />
to the early explorers through use of technology and use of speakers from the Native American<br />
community visiting the classroom and sharing their heritage.<br />
4.3<br />
Teachers will utilize real literature to integrate the history surrounding the inception and signing of the<br />
Declaration of Independence.<br />
Instructional Technology Integrated Strategies<br />
2.2<br />
Students will use the computer lab to research and report on the experiences had by the Native<br />
Americans during the time of early exploration.<br />
4.3<br />
Fifth grade students will use various computer software games, learning activities, and internet<br />
research to further their learning of the American Revolution.<br />
Procedural specificity will be detailed in individual teacher lesson plans.<br />
N/A<br />
N/A<br />
<strong>Anderson</strong> <strong>Elementary</strong> School SiPlan 2009 - 2010 - Page 50
Part II<br />
Building Climate/Behavior Focus for Action Plans<br />
Assessments:<br />
Periodically:<br />
• Referrals will be monitored monthly by the principals and teachers.<br />
• Referrals will be put on the PowerSchool online student system by the teachers in an<br />
effort to maintain accurate records.<br />
Annually:<br />
• Graphs and data will be posted in the data room to keep teachers and staff aware of<br />
the number of referrals administered.<br />
Professional Development:<br />
• Teachers will participate in Tribes training in an effort to build classroom and schoolwide<br />
community. Tribes will assist teachers with management of behavior as well.<br />
Parental Participation<br />
• <strong>Schools</strong> shall ensure that information related to school and parent programs,<br />
meetings, and other activities is sent to the parents of participating children in a format,<br />
and, to the extent practicable, in a language parents can understand.<br />
<strong>Anderson</strong> <strong>Elementary</strong> School SiPlan 2009 - 2010 - Page 51
Grade / Focus: Building Wide Climate/Behavior<br />
Groups: X Regular; X IEP; X ELL; X Econ. Disadvantaged; X Race; X Gender<br />
Goal: All students will positively contribute to a safe and nurturing school environment.<br />
Objective / Benchmark:<br />
Students will be able to solve interpersonal problems in school without behavior referrals.<br />
Students will demonstrate the Lifeskills and Community Guidelines used in Tribes throughout<br />
every school day. Student discipline referrals will decrease 50% from the previous school<br />
year, with monthly monitoring in place.<br />
Interventions / Strategies:<br />
The Eat, Exercise, Excel Program has been implemented at <strong>Anderson</strong> in an effort to<br />
decrease office referrals. The program is research based and consists of five components<br />
surrounding nutrition and exercise. Since implementation of the program, referrals<br />
decreased by 63% in the first year.<br />
Instructional Technology Integrated Strategies<br />
Referrals will be monitored and reported using PowerSchool Student Information System.<br />
Graphs will be posted with applicable information.<br />
Procedural specificity will be detailed in individual teacher lesson plans.<br />
<strong>Anderson</strong> <strong>Elementary</strong> School SiPlan 2009 - 2010 - Page 52
Part II<br />
Attendance Focus for Action Plans<br />
Assessments:<br />
Daily/Weekly:<br />
• Daily Attendance will be taken and monitored by teachers and the principal through<br />
use of PowerSchool.<br />
Periodically:<br />
• The class with the best monthly attendance will receive the <strong>Anderson</strong> Eagle<br />
Attendance Trophy for the month and will receive a party.<br />
• Good Attendance Awards will be given to students at quarterly awards assemblies.<br />
• Teachers will receive monthly graphs that monitor student attendance. Further<br />
attendance incentives will be offered if attendance begins to drop.<br />
Annually:<br />
• Attendance will be monitored and compared yearly to determine trends and if further<br />
incentives may be necessary.<br />
Professional Development:<br />
• Teachers have undergone training in PowerSchool, the new student information<br />
system, to learn how to keep attendance online to better insure accuracy.<br />
Parental Participation<br />
• <strong>Schools</strong> shall ensure that information related to school and parent programs,<br />
meetings, and other activities is sent to the parents of participating children in a format,<br />
and, to the extent practicable, in a language parents can understand.<br />
<strong>Anderson</strong> <strong>Elementary</strong> School SiPlan 2009 - 2010 - Page 53
Grade / Focus: Attendance<br />
Groups: X Regular; X IEP; X ELL; X Econ. Disadvantaged; X Race; X Gender<br />
Goal: 96% of <strong>Anderson</strong> students will attend school daily (and in a timely arrival manner)<br />
ready to learn.<br />
Objective / Benchmark:<br />
96% of all <strong>Anderson</strong> students will be on time and ready to learn each day.<br />
Current student attendance is steady at 95.2%. We will continue to show an increase<br />
steadily each quarter to reach 96% as demonstrated by 2009 AYP data.<br />
Interventions / Strategies:<br />
According to AYP, <strong>Anderson</strong> <strong>Elementary</strong> made AYP based on a 95.2% attendance rate,<br />
which is above the minimum standard. Attendance at <strong>Anderson</strong> will be monitored monthly,<br />
and incentives will be in place to insure growth in the attendance area.<br />
Instructional Technology Integrated Strategies<br />
Teachers will be required to put attendance online on the PowerSchool Student Information<br />
System. We will also be graphing attendance regularly so stakeholders can monitor<br />
progress.<br />
Procedural specificity will be detailed in individual teacher lesson plans.<br />
<strong>Anderson</strong> <strong>Elementary</strong> School SiPlan 2009 - 2010 - Page 54