

Temperature-pressure phase diagram and ferroelectric properties of ...
Temperature-pressure phase diagram and ferroelectric properties of ...
Temperature-pressure phase diagram and ferroelectric properties of ...

You also want an ePaper? Increase the reach of your titles
YUMPU automatically turns print PDFs into web optimized ePapers that Google loves.
114105-5 Wang et al. J. Appl. Phys. 108, 114105 2010<br />
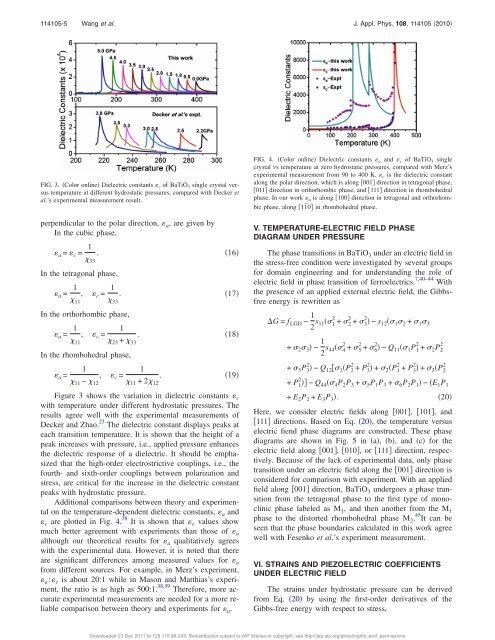
FIG. 3. Color online Dielectric constants c <strong>of</strong> BaTiO 3 single crystal versus<br />
temperature at different hydrostatic <strong>pressure</strong>s, compared with Decker et<br />
al.’s experimental measurement result.<br />
perpendicular to the polar direction, a , are given by<br />
In the cubic <strong>phase</strong>,<br />
a = c = 1 .<br />
33<br />
In the tetragonal <strong>phase</strong>,<br />
a = 1 , c = 1 .<br />
11 33<br />
In the orthorhombic <strong>phase</strong>,<br />
a = 1<br />
1<br />
, c = .<br />
11 23 + 33<br />
In the rhombohedral <strong>phase</strong>,<br />
16<br />
17<br />
18<br />
1<br />
1<br />
a = , c = .<br />
19<br />
11 − 12 11 +2 12<br />
Figure 3 shows the variation in dielectric constants c<br />
with temperature under different hydrostatic <strong>pressure</strong>s. The<br />
results agree well with the experimental measurements <strong>of</strong><br />
Decker <strong>and</strong> Zhao. 23 The dielectric constant displays peaks at<br />
each transition temperature. It is shown that the height <strong>of</strong> a<br />
peak increases with <strong>pressure</strong>, i.e., applied <strong>pressure</strong> enhances<br />
the dielectric response <strong>of</strong> a dielectric. It should be emphasized<br />
that the high-order electrostrictive couplings, i.e., the<br />
fourth- <strong>and</strong> sixth-order couplings between polarization <strong>and</strong><br />
stress, are critical for the increase in the dielectric constant<br />
peaks with hydrostatic <strong>pressure</strong>.<br />
Additional comparisons between theory <strong>and</strong> experimental<br />
on the temperature-dependent dielectric constants, a <strong>and</strong><br />
c are plotted in Fig. 4. 38 It is shown that c values show<br />
much better agreement with experiments than those <strong>of</strong> a<br />
although our theoretical results for a qualitatively agrees<br />
with the experimental data. However, it is noted that there<br />
are significant differences among measured values for a<br />
from different sources. For example, in Merz’s experiment,<br />
a : c is about 20:1 while in Mason <strong>and</strong> Matthias’s experiment,<br />
the ratio is as high as 500:1. 38,39 Therefore, more accurate<br />
experimental measurements are needed for a more reliable<br />
comparison between theory <strong>and</strong> experiments for a .<br />
FIG. 4. Color online Dielectric constants a <strong>and</strong> c <strong>of</strong> BaTiO 3 single<br />
crystal vs temperature at zero hydrostatic <strong>pressure</strong>s, compared with Merz’s<br />
experimental measurement from 90 to 400 K. c is the dielectric constant<br />
along the polar direction, which is along 001 direction in tetragonal <strong>phase</strong>,<br />
011 direction in orthorhombic <strong>phase</strong>, <strong>and</strong> 111 direction in rhombohedral<br />
<strong>phase</strong>. In our work a is along 100 direction in tetragonal <strong>and</strong> orthorhombic<br />
<strong>phase</strong>, along 11¯0 in rhombohedral <strong>phase</strong>.<br />
V. TEMPERATURE-ELECTRIC FIELD PHASE<br />
DIAGRAM UNDER PRESSURE<br />
The <strong>phase</strong> transitions in BaTiO 3 under an electric field in<br />
the stress-free condition were investigated by several groups<br />
for domain engineering <strong>and</strong> for underst<strong>and</strong>ing the role <strong>of</strong><br />
electric field in <strong>phase</strong> transition <strong>of</strong> <strong>ferroelectric</strong>s. 7,40–44 With<br />
the presence <strong>of</strong> an applied external electric field, the Gibbsfree<br />
energy is rewritten as<br />
G = f LGD − 1 2 s 11 1 2 + 2 2 + 3 2 − s 12 1 2 + 1 3<br />
+ 2 3 − 1 2 s 44 4 2 + 5 2 + 6 2 − Q 11 1 P 1 2 + 2 P 2<br />
2<br />
+ 3 P 3 2 − Q 12 1 P 2 2 + P 3 2 + 2 P 1 2 + P 3 2 + 3 P 2<br />
2<br />
+ P 1 2 − Q 44 4 P 2 P 3 + 5 P 1 P 3 + 6 P 2 P 1 − E 1 P 1<br />
+ E 2 P 2 + E 3 P 3 . 20<br />
Here, we consider electric fields along 001, 101, <strong>and</strong><br />
111 directions. Based on Eq. 20, the temperature versus<br />
electric fiend <strong>phase</strong> <strong>diagram</strong>s are constructed. These <strong>phase</strong><br />
<strong>diagram</strong>s are shown in Fig. 5 in a, b, <strong>and</strong> c for the<br />
electric field along 001, 010, or111 direction, respectively.<br />
Because <strong>of</strong> the lack <strong>of</strong> experimental data, only <strong>phase</strong><br />
transition under an electric field along the 001 direction is<br />
considered for comparison with experiment. With an applied<br />
field along 001 direction, BaTiO 3 undergoes a <strong>phase</strong> transition<br />
from the tetragonal <strong>phase</strong> to the first type <strong>of</strong> monoclinic<br />
<strong>phase</strong> labeled as M 1 , <strong>and</strong> then another from the M 1<br />
<strong>phase</strong> to the distorted rhombohedral <strong>phase</strong> M 2 . 45 It can be<br />
seen that the <strong>phase</strong> boundaries calculated in this work agree<br />
well with Fesenko et al.’s experiment measurement.<br />
VI. STRAINS AND PIEZOELECTRIC COEFFICIENTS<br />
UNDER ELECTRIC FIELD<br />
The strains under hydrostatic <strong>pressure</strong> can be derived<br />
from Eq. 20 by using the first-order derivatives <strong>of</strong> the<br />
Gibbs-free energy with respect to stress,<br />
Downloaded 23 Dec 2011 to 128.118.88.243. Redistribution subject to AIP license or copyright; see http://jap.aip.org/about/rights_<strong>and</strong>_permissions


