

Phase-field modeling of three-phase electrode microstructures in ...
Phase-field modeling of three-phase electrode microstructures in ...
Phase-field modeling of three-phase electrode microstructures in ...

Create successful ePaper yourself
Turn your PDF publications into a flip-book with our unique Google optimized e-Paper software.
033909-3 Li et al. Appl. Phys. Lett. 101, 033909 (2012)<br />
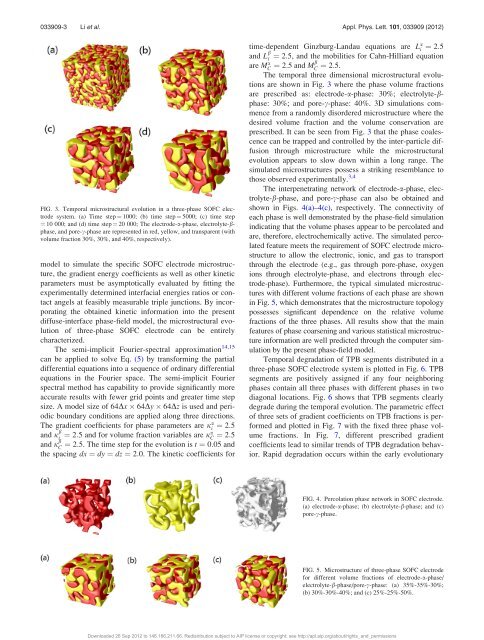
FIG. 3. Temporal microstructural evolution <strong>in</strong> a <strong>three</strong>-<strong>phase</strong> SOFC <strong>electrode</strong><br />
system. (a) Time step ¼ 1000; (b) time step ¼ 5000; (c) time step<br />
¼ 10 000; and (d) time step ¼ 20 000; The <strong>electrode</strong>-a-<strong>phase</strong>, electrolyte-b<strong>phase</strong>,<br />
and pore-c-<strong>phase</strong> are represented <strong>in</strong> red, yellow, and transparent (with<br />
volume fraction 30%, 30%, and 40%, respectively).<br />
model to simulate the specific SOFC <strong>electrode</strong> microstructure,<br />
the gradient energy coefficients as well as other k<strong>in</strong>etic<br />
parameters must be asymptotically evaluated by fitt<strong>in</strong>g the<br />
experimentally determ<strong>in</strong>ed <strong>in</strong>terfacial energies ratios or contact<br />
angels at feasibly measurable triple junctions. By <strong>in</strong>corporat<strong>in</strong>g<br />
the obta<strong>in</strong>ed k<strong>in</strong>etic <strong>in</strong>formation <strong>in</strong>to the present<br />
diffuse-<strong>in</strong>terface <strong>phase</strong>-<strong>field</strong> model, the microstructural evolution<br />
<strong>of</strong> <strong>three</strong>-<strong>phase</strong> SOFC <strong>electrode</strong> can be entirely<br />
characterized.<br />
The semi-implicit Fourier-spectral approximation 14,15<br />
can be applied to solve Eq. (5) by transform<strong>in</strong>g the partial<br />
differential equations <strong>in</strong>to a sequence <strong>of</strong> ord<strong>in</strong>ary differential<br />
equations <strong>in</strong> the Fourier space. The semi-implicit Fourier<br />
spectral method has capability to provide significantly more<br />
accurate results with fewer grid po<strong>in</strong>ts and greater time step<br />
size. A model size <strong>of</strong> 64Dx 64Dy 64Dz is used and periodic<br />
boundary conditions are applied along <strong>three</strong> directions.<br />
The gradient coefficients for <strong>phase</strong> parameters are j a i ¼ 2:5<br />
and j b i ¼ 2:5 and for volume fraction variables are j a C ¼ 2:5<br />
and j b C<br />
¼ 2:5. The time step for the evolution is t ¼ 0:05 and<br />
the spac<strong>in</strong>g dx ¼ dy ¼ dz ¼ 2:0. The k<strong>in</strong>etic coefficients for<br />
time-dependent G<strong>in</strong>zburg-Landau equations are L a i ¼ 2:5<br />
and L b i ¼ 2:5, and the mobilities for Cahn-Hilliard equation<br />
are M a C ¼ 2:5 and Mb C ¼ 2:5.<br />
The temporal <strong>three</strong> dimensional microstructural evolutions<br />
are shown <strong>in</strong> Fig. 3 where the <strong>phase</strong> volume fractions<br />
are prescribed as: <strong>electrode</strong>-a-<strong>phase</strong>: 30%; electrolyte-b<strong>phase</strong>:<br />
30%; and pore-c-<strong>phase</strong>: 40%. 3D simulations commence<br />
from a randomly disordered microstructure where the<br />
desired volume fraction and the volume conservation are<br />
prescribed. It can be seen from Fig. 3 that the <strong>phase</strong> coalescence<br />
can be trapped and controlled by the <strong>in</strong>ter-particle diffusion<br />
through microstructure while the microstructural<br />
evolution appears to slow down with<strong>in</strong> a long range. The<br />
simulated <strong>microstructures</strong> possess a strik<strong>in</strong>g resemblance to<br />
those observed experimentally. 3,4<br />
The <strong>in</strong>terpenetrat<strong>in</strong>g network <strong>of</strong> <strong>electrode</strong>-a-<strong>phase</strong>, electrolyte-b-<strong>phase</strong>,<br />
and pore-c-<strong>phase</strong> can also be obta<strong>in</strong>ed and<br />
shown <strong>in</strong> Figs. 4(a)–4(c), respectively. The connectivity <strong>of</strong><br />
each <strong>phase</strong> is well demonstrated by the <strong>phase</strong>-<strong>field</strong> simulation<br />
<strong>in</strong>dicat<strong>in</strong>g that the volume <strong>phase</strong>s appear to be percolated and<br />
are, therefore, electrochemically active. The simulated percolated<br />
feature meets the requirement <strong>of</strong> SOFC <strong>electrode</strong> microstructure<br />
to allow the electronic, ionic, and gas to transport<br />
through the <strong>electrode</strong> (e.g., gas through pore-<strong>phase</strong>, oxygen<br />
ions through electrolyte-<strong>phase</strong>, and electrons through <strong>electrode</strong>-<strong>phase</strong>).<br />
Furthermore, the typical simulated <strong>microstructures</strong><br />
with different volume fractions <strong>of</strong> each <strong>phase</strong> are shown<br />
<strong>in</strong> Fig. 5, which demonstrates that the microstructure topology<br />
possesses significant dependence on the relative volume<br />
fractions <strong>of</strong> the <strong>three</strong> <strong>phase</strong>s. All results show that the ma<strong>in</strong><br />
features <strong>of</strong> <strong>phase</strong> coarsen<strong>in</strong>g and various statistical microstructure<br />
<strong>in</strong>formation are well predicted through the computer simulation<br />
by the present <strong>phase</strong>-<strong>field</strong> model.<br />
Temporal degradation <strong>of</strong> TPB segments distributed <strong>in</strong> a<br />
<strong>three</strong>-<strong>phase</strong> SOFC <strong>electrode</strong> system is plotted <strong>in</strong> Fig. 6. TPB<br />
segments are positively assigned if any four neighbor<strong>in</strong>g<br />
<strong>phase</strong>s conta<strong>in</strong> all <strong>three</strong> <strong>phase</strong>s with different <strong>phase</strong>s <strong>in</strong> two<br />
diagonal locations. Fig. 6 shows that TPB segments clearly<br />
degrade dur<strong>in</strong>g the temporal evolution. The parametric effect<br />
<strong>of</strong> <strong>three</strong> sets <strong>of</strong> gradient coefficients on TPB fractions is performed<br />
and plotted <strong>in</strong> Fig. 7 with the fixed <strong>three</strong> <strong>phase</strong> volume<br />
fractions. In Fig. 7, different prescribed gradient<br />
coefficients lead to similar trends <strong>of</strong> TPB degradation behavior.<br />
Rapid degradation occurs with<strong>in</strong> the early evolutionary<br />
FIG. 4. Percolation <strong>phase</strong> network <strong>in</strong> SOFC <strong>electrode</strong>.<br />
(a) <strong>electrode</strong>-a-<strong>phase</strong>; (b) electrolyte-b-<strong>phase</strong>; and (c)<br />
pore-c-<strong>phase</strong>.<br />
FIG. 5. Microstructure <strong>of</strong> <strong>three</strong>-<strong>phase</strong> SOFC <strong>electrode</strong><br />
for different volume fractions <strong>of</strong> <strong>electrode</strong>-a-<strong>phase</strong>/<br />
electrolyte-b-<strong>phase</strong>/pore-c-<strong>phase</strong>: (a) 35%-35%-30%;<br />
(b) 30%-30%-40%; and (c) 25%-25%-50%.<br />
Downloaded 26 Sep 2012 to 146.186.211.66. Redistribution subject to AIP license or copyright; see http://apl.aip.org/about/rights_and_permissions


