Chapter 4 Climate of Texas - Texas Water Development Board
Chapter 4 Climate of Texas - Texas Water Development Board
Chapter 4 Climate of Texas - Texas Water Development Board

You also want an ePaper? Increase the reach of your titles
YUMPU automatically turns print PDFs into web optimized ePapers that Google loves.
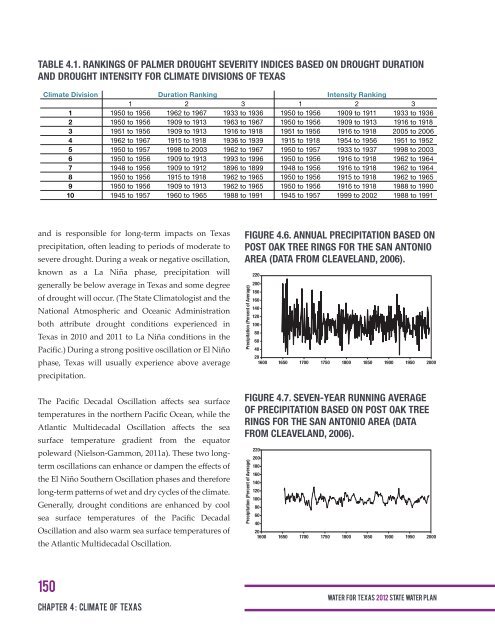
TABLE 4.1. RANKINGS OF PALMER DROUGHT SEVERITY INDICES BASED ON DROUGHT DURATION<br />
AND DROUGHT INTENSITY FOR CLIMATE DIVISIONS OF TEXAS<br />
<strong>Climate</strong> Division<br />
Duration Ranking<br />
Intensity Ranking<br />
1 2 3 1 2 3<br />
1 1950 to 1956 1962 to 1967 1933 to 1936 1950 to 1956 1909 to 1911 1933 to 1936<br />
2 1950 to 1956 1909 to 1913 1963 to 1967 1950 to 1956 1909 to 1913 1916 to 1918<br />
3 1951 to 1956 1909 to 1913 1916 to 1918 1951 to 1956 1916 to 1918 2005 to 2006<br />
4 1962 to 1967 1915 to 1918 1936 to 1939 1915 to 1918 1954 to 1956 1951 to 1952<br />
5 1950 to 1957 1998 to 2003 1962 to 1967 1950 to 1957 1933 to 1937 1998 to 2003<br />
6 1950 to 1956 1909 to 1913 1993 to 1996 1950 to 1956 1916 to 1918 1962 to 1964<br />
7 1948 to 1956 1909 to 1912 1896 to 1899 1948 to 1956 1916 to 1918 1962 to 1964<br />
8 1950 to 1956 1915 to 1918 1962 to 1965 1950 to 1956 1915 to 1918 1962 to 1965<br />
9 1950 to 1956 1909 to 1913 1962 to 1965 1950 to 1956 1916 to 1918 1988 to 1990<br />
10 1945 to 1957 1960 to 1965 1988 to 1991 1945 to 1957 1999 to 2002 1988 to 1991<br />
4.1<br />
and is responsible for long-term impacts on <strong>Texas</strong><br />
precipitation, <strong>of</strong>ten leading to periods <strong>of</strong> moderate to<br />
severe drought. During a weak or negative oscillation,<br />
known as a La Niña phase, precipitation will<br />
generally be below average in <strong>Texas</strong> and some degree<br />
<strong>of</strong> drought will occur. (The State Climatologist and the<br />
National Atmospheric and Oceanic Administration<br />
both attribute drought conditions experienced in<br />
<strong>Texas</strong> in 2010 and 2011 to La Niña conditions in the<br />
Pacific.) During a strong positive oscillation or El Niño<br />
phase, <strong>Texas</strong> will usually experience above average<br />
precipitation.<br />
The Pacific Decadal Oscillation affects sea surface<br />
temperatures in the northern Pacific Ocean, while the<br />
Atlantic Multidecadal Oscillation affects the sea<br />
surface temperature gradient from the equator<br />
poleward (Nielson-Gammon, 2011a). These two longterm<br />
oscillations can enhance or dampen the effects <strong>of</strong><br />
the El Niño Southern Oscillation phases and therefore<br />
long-term patterns <strong>of</strong> wet and dry cycles <strong>of</strong> the climate.<br />
Generally, drought conditions are enhanced by cool<br />
sea surface temperatures <strong>of</strong> the Pacific Decadal<br />
Oscillation and also warm sea surface temperatures <strong>of</strong><br />
the Atlantic Multidecadal Oscillation.<br />
FIGURE 4.6. ANNUAL PRECIPITATION BASED ON<br />
POST OAK TREE RINGS FOR THE SAN ANTONIO<br />
AREA (DATA FROM CLEAVELAND, 2006).<br />
Precipitation (Percent <strong>of</strong> Average)<br />
220<br />
200<br />
180<br />
160<br />
140<br />
120<br />
100<br />
80<br />
60<br />
40<br />
20<br />
1600 1650 1700 1750 1800 1850 1900 1950 2000<br />
FIGURE 4.7. SEVEN-YEAR RUNNING AVERAGE<br />
OF PRECIPITATION BASED ON POST OAK TREE<br />
RINGS FOR THE SAN ANTONIO AREA (DATA<br />
FROM CLEAVELAND, 2006).<br />
Precipitation (Percent <strong>of</strong> Average)<br />
220<br />
200<br />
180<br />
160<br />
140<br />
120<br />
100<br />
80<br />
60<br />
40<br />
20<br />
1600 1650 1700 1750 1800 1850 1900 1950 2000<br />
150<br />
<strong>Chapter</strong> 4 : climate <strong>of</strong> <strong>Texas</strong><br />
WAT E R FOR TEXAS 2012 STATE WATER PLAN