10 Year Review - The University of Akron
10 Year Review - The University of Akron
10 Year Review - The University of Akron

You also want an ePaper? Increase the reach of your titles
YUMPU automatically turns print PDFs into web optimized ePapers that Google loves.
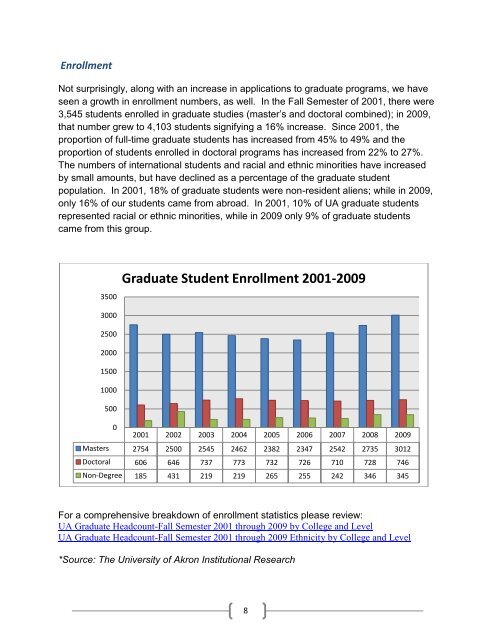
Enrollment<br />
Not surprisingly, along with an increase in applications to graduate programs, we have<br />
seen a growth in enrollment numbers, as well. In the Fall Semester <strong>of</strong> 2001, there were<br />
3,545 students enrolled in graduate studies (master’s and doctoral combined); in 2009,<br />
that number grew to 4,<strong>10</strong>3 students signifying a 16% increase. Since 2001, the<br />
proportion <strong>of</strong> full-time graduate students has increased from 45% to 49% and the<br />
proportion <strong>of</strong> students enrolled in doctoral programs has increased from 22% to 27%.<br />
<strong>The</strong> numbers <strong>of</strong> international students and racial and ethnic minorities have increased<br />
by small amounts, but have declined as a percentage <strong>of</strong> the graduate student<br />
population. In 2001, 18% <strong>of</strong> graduate students were non-resident aliens; while in 2009,<br />
only 16% <strong>of</strong> our students came from abroad. In 2001, <strong>10</strong>% <strong>of</strong> UA graduate students<br />
represented racial or ethnic minorities, while in 2009 only 9% <strong>of</strong> graduate students<br />
came from this group.<br />
Graduate Student Enrollment 2001-2009<br />
3500<br />
3000<br />
2500<br />
2000<br />
1500<br />
<strong>10</strong>00<br />
500<br />
0<br />
2001 2002 2003 2004 2005 2006 2007 2008 2009<br />
Masters 2754 2500 2545 2462 2382 2347 2542 2735 3012<br />
Doctoral 606 646 737 773 732 726 7<strong>10</strong> 728 746<br />
Non-Degree 185 431 219 219 265 255 242 346 345<br />
For a comprehensive breakdown <strong>of</strong> enrollment statistics please review:<br />
UA Graduate Headcount-Fall Semester 2001 through 2009 by College and Level<br />
UA Graduate Headcount-Fall Semester 2001 through 2009 Ethnicity by College and Level<br />
*Source: <strong>The</strong> <strong>University</strong> <strong>of</strong> <strong>Akron</strong> Institutional Research<br />
8