PhD Thesis, 2010 - University College Cork
PhD Thesis, 2010 - University College Cork
PhD Thesis, 2010 - University College Cork

Create successful ePaper yourself
Turn your PDF publications into a flip-book with our unique Google optimized e-Paper software.
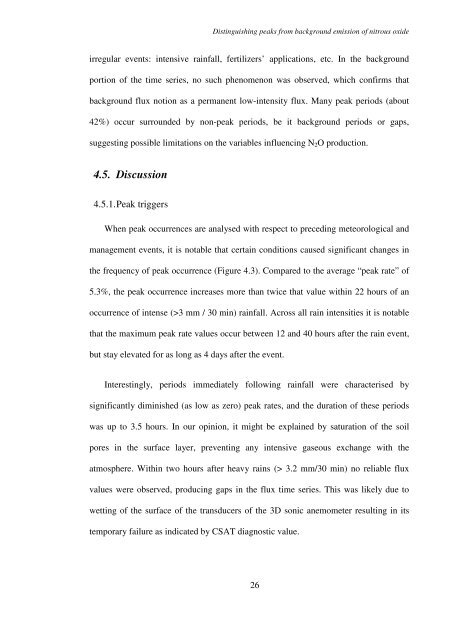
Distinguishing peaks from background emission of nitrous oxide<br />
irregular events: intensive rainfall, fertilizers’ applications, etc. In the background<br />
portion of the time series, no such phenomenon was observed, which confirms that<br />
background flux notion as a permanent low-intensity flux. Many peak periods (about<br />
42%) occur surrounded by non-peak periods, be it background periods or gaps,<br />
suggesting possible limitations on the variables influencing N 2 O production.<br />
4.5. Discussion<br />
4.5.1. Peak triggers<br />
When peak occurrences are analysed with respect to preceding meteorological and<br />
management events, it is notable that certain conditions caused significant changes in<br />
the frequency of peak occurrence (Figure 4.3). Compared to the average “peak rate” of<br />
5.3%, the peak occurrence increases more than twice that value within 22 hours of an<br />
occurrence of intense (>3 mm / 30 min) rainfall. Across all rain intensities it is notable<br />
that the maximum peak rate values occur between 12 and 40 hours after the rain event,<br />
but stay elevated for as long as 4 days after the event.<br />
Interestingly, periods immediately following rainfall were characterised by<br />
significantly diminished (as low as zero) peak rates, and the duration of these periods<br />
was up to 3.5 hours. In our opinion, it might be explained by saturation of the soil<br />
pores in the surface layer, preventing any intensive gaseous exchange with the<br />
atmosphere. Within two hours after heavy rains (> 3.2 mm/30 min) no reliable flux<br />
values were observed, producing gaps in the flux time series. This was likely due to<br />
wetting of the surface of the transducers of the 3D sonic anemometer resulting in its<br />
temporary failure as indicated by CSAT diagnostic value.<br />
26