2005-2006 FACT BOOK - University of the District of Columbia
2005-2006 FACT BOOK - University of the District of Columbia
2005-2006 FACT BOOK - University of the District of Columbia

You also want an ePaper? Increase the reach of your titles
YUMPU automatically turns print PDFs into web optimized ePapers that Google loves.
<strong>2005</strong>-<strong>2006</strong><br />
<strong>FACT</strong> <strong>BOOK</strong><br />
OFFICE OF INSTITUTIONAL RESEARCH,<br />
ASSESSMENT & PLANNING
THE OFFICE OF INSTITUTIONAL RESEARCH,<br />
ASSESSMENT AND PLANNING<br />
The staff <strong>of</strong> <strong>the</strong> Office <strong>of</strong> Institutional Research, Assessment and Planning is pleased to<br />
present <strong>the</strong> <strong>University</strong> <strong>of</strong> <strong>the</strong> <strong>District</strong> <strong>of</strong> <strong>Columbia</strong> <strong>2005</strong>-<strong>2006</strong> Fact Book. The Fact Book<br />
is issued periodically to provide frequently requested statistical, programmatic, and<br />
operational data about <strong>the</strong> <strong>University</strong> <strong>of</strong> <strong>the</strong> <strong>District</strong> <strong>of</strong> <strong>Columbia</strong> and serves as a reference<br />
resource tool for <strong>the</strong> <strong>University</strong> community. Information presented in <strong>the</strong> Fact Book is<br />
divided into sections, as indicated in <strong>the</strong> Table <strong>of</strong> Contents, and is presented in tabular<br />
and/or graphic form. Citations <strong>of</strong> <strong>the</strong> data sources used for this resource are also<br />
indicated. Suggestions or corrections are welcome and should be directed to <strong>the</strong> Office <strong>of</strong><br />
Institutional Research, Assessment and Planning.<br />
David Caruth, Ph.D. – Director<br />
Diane Hayes, M.A. - Operations Research Analyst<br />
Gashaw Mekonnen, M.S. - Senior Operations Research Analyst<br />
Marie Racine, Ph.D. – Pr<strong>of</strong>essor/Assessment Coordinator<br />
Latresa Stewart, B.S. - Office Manager<br />
i
ACKNOWLEDGEMENT<br />
The Office <strong>of</strong> Institutional Research, Assessment and Planning would like to dedicate this<br />
Fact Book to Diane Dickerson-Hayes, longtime Operations Research Analyst and<br />
<strong>University</strong> Statistician for her unyielding commitment and dedication to <strong>the</strong> success <strong>of</strong> this<br />
<strong>of</strong>fice. Mrs. Dickerson-Hayes has dedicated more than 32 years <strong>of</strong> her pr<strong>of</strong>essional<br />
academic career to serving <strong>the</strong> <strong>University</strong> community and <strong>the</strong> students we serve. This<br />
Fact Book is a testament to her hard work and for that we <strong>of</strong>fer her our deepest gratitude.<br />
ii
FROM THE DIRECTOR<br />
This Second Edition <strong>of</strong> <strong>the</strong> <strong>University</strong> <strong>of</strong> <strong>the</strong> <strong>District</strong> <strong>of</strong> <strong>Columbia</strong> Fact<br />
Book is a publication <strong>of</strong> <strong>the</strong> Office <strong>of</strong> Institutional Research, Assessment and<br />
Planning. This document provides factual, statistical information about UDC,<br />
and provides administrators, faculty, staff and o<strong>the</strong>r university constituents with<br />
convenient access to operational data.<br />
In our ongoing effort to provide useful institutional data, we aim to publish<br />
sequential editions <strong>of</strong> <strong>the</strong> fact book each year. We welcome your valuable<br />
comments and suggestions to improve <strong>the</strong> content <strong>of</strong> published facts about UDC.<br />
This second edition <strong>of</strong> <strong>the</strong> UDC fact book will also be published on <strong>the</strong><br />
<strong>University</strong>’s website at: (http://www.udc.edu/irap).<br />
We hope that those <strong>of</strong> you who are less familiar with our <strong>University</strong> will<br />
find this publication to be informative and useful. We invite you to visit our<br />
campus at 4200 Connecticut Avenue, N.W., Washington, D.C., 20008 to learn<br />
more about our academic <strong>of</strong>ferings as well as, to meet our outstanding student<br />
body, faculty, administrators and support staff.<br />
Respectively,<br />
David D. Caruth<br />
David D. Caruth, PhD<br />
Director<br />
Office <strong>of</strong> Institutional Research, Assessment and Planning<br />
iii
PREFACE<br />
The information presented here was collected and organized by <strong>the</strong> Office <strong>of</strong> Institutional<br />
Research, Assessment and Planning. This <strong>of</strong>fice serves as <strong>the</strong> clearinghouse for <strong>of</strong>ficial <strong>University</strong><br />
statistics to promote consistency in reporting and <strong>the</strong> provision <strong>of</strong> timely and accurate information. All<br />
information provided was collected from <strong>of</strong>ficial <strong>University</strong> reports generated by <strong>the</strong> Office <strong>of</strong><br />
Information Technology. These reports represent <strong>of</strong>ficial institutional records used for reporting to<br />
federal and local agencies.<br />
The data included in this document are also available on-line. To access this information in<br />
electronic format, please visit our web site at: http://www.udc.edu. Should you need to request data<br />
that is not contained in this book, visit <strong>the</strong> IR web site where we have made Data Request Forms<br />
available for your convenience. If you have any comments or suggestions, please let us hear from<br />
you.<br />
iv
TABLE OF CONTENTS<br />
Introduction ……………………………………………………………………………………………….. i<br />
Acknowledgement …………………………………………………………………………………………. ii<br />
Letter from <strong>the</strong> Director ……………………………………………………………………………………. iii<br />
Preface ……………………………………………………………………………………………………… iv<br />
SECTION I: General Information<br />
Members <strong>of</strong> <strong>the</strong> Board <strong>of</strong> Trustees …………………………………………………………………………. 2<br />
<strong>University</strong> Officers …………………………………………………………………………………………. 3<br />
Deans ……………………………………………………………………………………………………….. 3<br />
Administrative Officers and Directors ……………………………………………………………………… 3<br />
Mission <strong>of</strong> <strong>the</strong> <strong>University</strong> <strong>of</strong> <strong>the</strong> <strong>District</strong> <strong>of</strong> <strong>Columbia</strong> ……………………………………………………… 5<br />
Accreditation ……………………………………………………………………………………………….. 6<br />
Memberships (Institutional) ………………………………………………………………………………… 7<br />
Memberships (Specialized) …………………………………………………………………………………. 8<br />
Mission <strong>of</strong> <strong>the</strong> Office <strong>of</strong> Institutional Research, Assessment and Planning ………………………………… 9<br />
SECTION II: Admission and Entering Freshmen Student Information<br />
Applicants and Admitted Students by Ethnicity and Gender, Fall <strong>2005</strong> & <strong>2006</strong> …………………………… 11<br />
Applicants and Admitted Students, Fall <strong>2005</strong> & <strong>2006</strong> (Chart) ……………………………………………… 12<br />
First-Time Entering Students Enrolled from DC Public, Private and Charter Schools, Fall <strong>2005</strong> & <strong>2006</strong> …. 13<br />
Entering Freshmen Characteristics, Fall <strong>2005</strong> and <strong>2006</strong> …………………………………………………….. 14<br />
Entering Freshmen Student Enrollment, Fall <strong>2005</strong> and <strong>2006</strong> (Chart) ..…………………………. …………. 15<br />
Entering Freshmen by College and Schools, Fall <strong>2005</strong> and <strong>2006</strong> ……………………………….. …………… 16<br />
Entering Freshmen Enrollment by College and Schools, Fall <strong>2005</strong> and <strong>2006</strong> (Chart) …………... ………….. 16<br />
Entering Freshmen by College, School, Department and Declared Major, Fall <strong>2005</strong> and <strong>2006</strong> ……………… 17<br />
SECTION III: Enrollment and Student Characteristics<br />
Full and Part-Time Enrollment by College and Department, Fall <strong>2005</strong> ……………………………………… 21<br />
Full and Part-Time Enrollment by College and Department, Fall <strong>2006</strong> ……………………………………… 21<br />
Total Enrollment by College/School, Fall <strong>2005</strong> and <strong>2006</strong> (Chart) …………………………………………… 22<br />
Student Enrollment by Ward, Fall <strong>2005</strong> and <strong>2006</strong> …………………………………………………………… 23<br />
Resident Student Enrollment by Ward, Fall <strong>2005</strong> and <strong>2006</strong> (Chart) …………………………………………. 24<br />
Total Enrollment by Characteristics, Fall <strong>2005</strong> and <strong>2006</strong>…………………………………………………….. 25<br />
Enrollment in <strong>the</strong> Maadi Program by Characteristics, Fall <strong>2006</strong>……………………………………………. 26<br />
Enrollment Classification by National and International Status, Fall <strong>2005</strong> and <strong>2006</strong> ……………………….. 27<br />
Student Enrollment by Ethnicity, Fall <strong>2005</strong> and <strong>2006</strong> ……………………………………………………….. 28<br />
Student Enrollment by Age Group, Fall <strong>2005</strong> and <strong>2006</strong> ……………………………………………………… 28<br />
Student Enrollment by Ethnicity, Fall <strong>2005</strong> and <strong>2006</strong> (Chart) ……………………………………………….. 29<br />
Student Enrollment by Age Group, Fall <strong>2005</strong> and <strong>2006</strong> (Chart) ……………………………………………… 30<br />
David A. Clarke School <strong>of</strong> Law Enrollment, Fall <strong>2005</strong> and <strong>2006</strong> ……………………………………………. 31<br />
International Student Enrollment, Fall <strong>2005</strong> and <strong>2006</strong> ……………………………………………………….. 32<br />
International Enrollment by Country <strong>of</strong> Origin, Fall <strong>2005</strong> and <strong>2006</strong> …………………………………………. 33<br />
SECTION IV: Academic Programs by College, School and Department<br />
Programs by College, Schools, and Departments ……………………………………………………………… 35<br />
SECTION V: Degrees Conferred<br />
Degrees Conferred by Graduation Term, College/School and Major, Academic Year <strong>2005</strong>-06 ……………… 38<br />
Degrees Conferred by Ethnic Origin, College/School and Major, Academic Year <strong>2005</strong>-06 ………………….. 41<br />
Degrees Conferred by Gender, College/School and Major, Academic Year <strong>2005</strong>-06.………………………… 44<br />
Degrees Conferred by Citizenship, Ethnicity and Gender, Academic Year <strong>2005</strong>-06.…………………………. 47<br />
Degrees Conferred by Ethnic Origin, Academic Year <strong>2005</strong>-06 (Chart).………………………………………. 49<br />
Degrees Conferred by College/School, Academic Year <strong>2005</strong>-06 (Chart) …………………………………… 50<br />
Degrees Conferred by Gender, Academic Year <strong>2005</strong>-06 (Chart) ……………………………………………… 51<br />
v
TABLE OF CONTENTS<br />
SECTION VII: UDC Faculty<br />
Average Annual Salary <strong>of</strong> Full-Time Instructional Faculty by Academic Rank and Gender, Fall <strong>2006</strong> ..…….. 53<br />
Average Annual Salary <strong>of</strong> Full-Time Instructional Faculty by Academic Rank and Ethnicity, Fall <strong>2006</strong>……… 53<br />
Average Annual Salary <strong>of</strong> Full-Time Instructional Faculty by Academic Rank and Gender, Fall <strong>2006</strong> (Chart)… 54<br />
Full-Time Instructional Faculty by Ethnicity, Rank and Gender, Fall <strong>2006</strong> ……………………………………. 55<br />
Full-Time Instructional Faculty by College/School, Department and Gender, Fall <strong>2006</strong> ………………………. 56<br />
Full-Time Instructional Faculty by Rank and Ethnicity, Fall <strong>2006</strong> ……………………………………………… 57<br />
Full-Time Instructional Faculty by Ethnicity and Gender, Fall <strong>2006</strong> …………………………………………… 57<br />
Full-Time Instructional Faculty by Ethnicity and Highest Degree, Fall <strong>2006</strong> …………………………………… 58<br />
Full-Time Instructional Faculty by Age Group, Fall <strong>2006</strong> ………………………………………………………. 59<br />
Full-Time Instructional Faculty by Academic Rank and Gender, Fall <strong>2006</strong> …………………………………….. 60<br />
Number <strong>of</strong> Full Time Instructional Faculty by Highest Degree and Gender, Fall <strong>2006</strong> …………………………. 61<br />
Full-Time Instructional Faculty by Length <strong>of</strong> Service, Fall <strong>2006</strong> ……………………………………………… 62<br />
SECTION VIII: <strong>University</strong> <strong>of</strong> <strong>the</strong> <strong>District</strong> <strong>of</strong> <strong>Columbia</strong>’s Finance Statement<br />
September 30, <strong>2006</strong> and <strong>2005</strong><br />
Statements <strong>of</strong> Revenues, Expenses, and Changes in Net Assets, Years Ended September 30, <strong>2006</strong><br />
And <strong>2005</strong> ……………………………………………………………………………………………………….. 64<br />
Statements <strong>of</strong> Cash Flows Years Ended September 30, <strong>2006</strong> and <strong>2005</strong> …………………………………………. 65<br />
vi
SECTION I<br />
General Information<br />
1
UNIVERSITY OF THE DISTRICT OF COLUMBIA<br />
Academic Year <strong>2006</strong>-2007<br />
Members <strong>of</strong> <strong>the</strong> Board <strong>of</strong> Trustees<br />
Mr. James W. Dyke Jr., Esq. Chair<br />
Dr. Rita J. Kirshstein, Vice Chairperson<br />
Mr. Eugene Kinlow, Secretary<br />
Mr. Leo V. Williams, III, Treasurer<br />
Mr. Joseph L. Askew, Jr., Esq.<br />
Mr. J. Fernando Barrueta<br />
Ms. Emily Durso<br />
Mr. Verle Hammond<br />
Mr. Lester S. Hyman, Esq.<br />
Mr. Gerald B. Lang<br />
Dr. Donald N. Langenberg<br />
Ms. Kristin Mannion<br />
Dr. William L. Pollard (ex-<strong>of</strong>ficio)<br />
Ms. Mary C. Thompson<br />
Mr. Selvon M. Waldron*<br />
*Student Representative<br />
2
UNIVERSITY OFFICERS<br />
William L. Pollard, Ph.D., President<br />
Wilhelmina Reuben-Cooke, J.D., Provost and Vice President for Academic Affairs<br />
Stanley Jackson, B.A., Senior Vice President and Chief <strong>of</strong> Staff<br />
Clemmie Soloman, Ph.D., Vice President for Student Affairs<br />
Bobby W. Austin, Ph.D., Vice President for <strong>University</strong> Relations and Communications<br />
Robert T. Robinson, M.Ed., Vice President for Public Safety and Emergency Management<br />
Earl C. Cabbell, M.B.A., Vice President for Management<br />
W. David Watts, J.D., General Counsel and Vice President, Real Estate<br />
Barbara Jumper, M.B.A., Chief Financial Officer<br />
George Michael Jacks, B.B.A., Vice President for Technology<br />
Wossen Encubahre, Ph.D., Agency Chief Contracting Officer<br />
DEANS<br />
Rachel M. Petty, Ph.D., Dean, College <strong>of</strong> Arts and Sciences<br />
Melanie A. Anderson, Ph.D., Acting Dean, School <strong>of</strong> Business and Public Administration<br />
Ben O. Latigo, Ph.D., Dean, School <strong>of</strong> Engineering and Applied Sciences<br />
Ka<strong>the</strong>rine S. Broderick, J.D., Dean, <strong>the</strong> UDC David A. Clarke School <strong>of</strong> Law<br />
Gloria Wyche-Moore, Ph.D., Acting Dean, Community Outreach and Extension Services<br />
Albert J. Casciero, M.A., Dean, Division <strong>of</strong> Learning Resources<br />
ADMINISTRATIVE OFFICERS AND DIRECTORS<br />
Henry Anderson, B.A., Director, Financial Aid<br />
Lucious Anderson, M.A., Acting Director, Continuing Education<br />
Michael Andrews, M.A., Senior Director <strong>of</strong> Communications<br />
Laurie Blackman, B.A., Interim Director, Institute <strong>of</strong> Gerontology<br />
Janice Borlandoe, M.A., Associate Vice President, Student Affairs<br />
Felicia H. Brant, B.A., CFRE, Director <strong>of</strong> Development<br />
Joseph Brooks, B.S., Interim Controller, Finance Division<br />
Melba Broome, B.S., Assistant Dean, Learning Resources<br />
Saundra Carter, M.Ed., Director, TRIO and College Preparatory Programs<br />
David D. Caruth, Ph.D., Director, Office <strong>of</strong> Institutional Research, Assessment and Planning<br />
Clifton L. Coates, Sr., M.A., Director, Career Services<br />
Agnita Coleman, M.A., Director, Student Support Services<br />
Alvin Darby, Ph.D., Assistant Dean, School <strong>of</strong> Engineering and Applied Sciences<br />
Laverne Hill-Flanagan, M.A., Director, Acting Registrar and Director <strong>of</strong> Enrollment Management<br />
E. Gail Anderson Holness, D.Min., J.D., Director, Community Outreach and Involvement<br />
C. Gerard Johnson, M.S., Director, Campus Services<br />
Joan Levermore, M.A., Acting Director, Grants Administration<br />
Deborah L. Lyons, Ph.D., Director, Center for Applied Research and Urban Policy<br />
April Massey, Ph.D., Assistant Dean, College <strong>of</strong> Arts and Sciences<br />
Vijaya Melnick, Ph.D., Director, Office <strong>of</strong> Sponsored Research and Programs<br />
Harold Merritt, Ed.D., Director, Intercollegiate Athletics<br />
3
ADMINISTRATIVE OFFICERS AND DIRECTORS<br />
Bertha D. Minus, Ph.D., Associate Provost for Student Retention, Pr<strong>of</strong>essional Development,<br />
and International Programs<br />
Kevin Naiker, Ph.D., Director, Counseling and Career Development Center<br />
John Page, M.S., Associate Dean, Learning Resources<br />
Ernesta P. Pendleton, Ed.D. Title III Officer and Special Assistant to <strong>the</strong> Provost and Vice<br />
President, Academic Affairs<br />
Christine Poole, B.B.A., Director, Human Resources<br />
Ann Richardson, J.D., Associate Dean, UDC David A. Clarke School <strong>of</strong> Law<br />
Susan D. Saunders, J.D., Director, Governmental Affairs<br />
Connie Spinner, M.A., State Director, Adult Education Agency<br />
Mark Stro<strong>the</strong>rs, M.Ed., Assistant to <strong>the</strong> Vice President <strong>of</strong> Student Affairs<br />
Janice Washington, J.D., Associate Dean, UDC David A. Clarke School <strong>of</strong> Law<br />
JoVita Wells, J.D., Senior Director, Intergovernmental Relations<br />
Ray Whitman, Ph.D., Assistant Dean, School <strong>of</strong> Business and Public Administration<br />
Wynette Wilkins, Interim Deputy Chief Financial Officer<br />
Herman Melvin Witten, J.D., Director, Marketing and Media Technology<br />
4
MISSION OF THE UNIVERSITY OF THE DISTRICT OF COLUMBIA<br />
The <strong>University</strong> <strong>of</strong> <strong>the</strong> <strong>District</strong> <strong>of</strong> <strong>Columbia</strong> is an urban land-grant institution <strong>of</strong> higher education with an<br />
open admission policy. It’s a comprehensive public institution <strong>of</strong>fering quality, affordable<br />
postsecondary education to <strong>the</strong> <strong>District</strong> <strong>of</strong> <strong>Columbia</strong> residents at <strong>the</strong> certificate, associate’s<br />
baccalaureate, and graduate levels. These programs will prepare students for immediate entry into <strong>the</strong><br />
workforce, for <strong>the</strong> next level <strong>of</strong> education, for specialized employment opportunities, and for lifelong<br />
learning.<br />
UNIVERSITY GOALS<br />
1. Student Access: To ensure <strong>the</strong> legislative entitlement <strong>of</strong> <strong>the</strong> residents <strong>of</strong> <strong>the</strong> <strong>District</strong> <strong>of</strong><br />
<strong>Columbia</strong> to comprehensive public post-secondary education;<br />
2. Student Choice: To <strong>of</strong>fer a broad variety <strong>of</strong> programs within its available resources and to<br />
provide reasonable choices for post-secondary education to <strong>the</strong> residents <strong>of</strong> <strong>the</strong> <strong>District</strong> <strong>of</strong><br />
<strong>Columbia</strong> that will lead to meaningful employment opportunities;<br />
3. Student Achievement: To set high standards for student achievement and to provide<br />
quality instruction and support services to enable students to meet those standards;<br />
4. Land-Grant Functions: To be innovative in carrying out <strong>the</strong> traditional land-grant<br />
functions <strong>of</strong> teaching, research, and public service to solve urban community problems and to<br />
improve <strong>the</strong> overall quality <strong>of</strong> urban living in <strong>the</strong> <strong>District</strong> <strong>of</strong> <strong>Columbia</strong>;<br />
5. Institutional Quality: To ensure institutional excellence in management and leadership,<br />
academic programs, support services, instruction, research and public service;<br />
6. Institutional Growth and Development: To be responsive to new and emerging job market<br />
demands in <strong>the</strong> Washington, D.C. Metropolitan Area; and<br />
7. Advancement <strong>of</strong> Knowledge: To advance knowledge at <strong>the</strong> local, national, and<br />
international levels through various innovative strategies in teaching, research, and public<br />
service as America’s only public urban land-grant institution.<br />
5
ACCREDITATION<br />
The <strong>University</strong> <strong>of</strong> <strong>the</strong> <strong>District</strong> <strong>of</strong> <strong>Columbia</strong> is accredited by <strong>the</strong> Commission on Higher Education<br />
<strong>of</strong> <strong>the</strong> Middle States Association <strong>of</strong> Colleges and Schools, 3624 Market Street, Philadelphia, PA<br />
19104, (215) 662-5606. The Commission on Higher Education is an institutional accrediting<br />
agency recognized by <strong>the</strong> U.S. Secretary <strong>of</strong> Education and <strong>the</strong> Commission on Recognition <strong>of</strong><br />
Postsecondary Accreditation. In <strong>2005</strong>, <strong>the</strong> <strong>University</strong> received a 10-year unconditional<br />
reaffirmation <strong>of</strong> its accreditation from <strong>the</strong> Commission on Higher Education <strong>of</strong> <strong>the</strong> Middle States<br />
Association <strong>of</strong> Colleges and Schools with commendation.<br />
Specialized Accrediting Bodies<br />
• Accreditation Board for Engineering and Technology (ABET)<br />
111 Market Place, Suite 1050<br />
Baltimore, MD 21202<br />
• American Bar Association (ABA)<br />
321 N. Clark St.<br />
Chicago, IL 60610<br />
• American Board <strong>of</strong> Funeral Service Education (ABFSE)<br />
13 Garner Road, #316<br />
P.O. Box 1305<br />
Brunswick, ME 04011<br />
• American Chemical Society (ACS)<br />
Committee on Pr<strong>of</strong>essional Training<br />
1155 Sixteenth Street, N.W.<br />
Washington, D.C. 20036<br />
• Association <strong>of</strong> Collegiate Business Schools and Programs (ACBSP)<br />
7007 College Boulevard, Suite 420<br />
Overland Park, Kansas 66211<br />
• Committee on Accreditation for Respiratory Care (CoARC)<br />
1248 Harwood Road<br />
Bedford, Texas 76021-4244<br />
• Council on Academic Accreditation in Audiology and Speech Language Pathology<br />
(CAA)<br />
10801 Rockville Pike<br />
Rockville, MD 20852<br />
(301) 897-5700<br />
• Council on Social Work Education (CSWE)<br />
1600 Duke Street<br />
Alexandria, VA 223134<br />
(703) 683-8080<br />
6
ACCREDITATION<br />
Specialized Accrediting Bodies<br />
• Joint Review Committee on Education <strong>of</strong> Radiologic Technology (JRCERT)<br />
20 North Wacker Drive, Suite 2850<br />
Chicago, IL 60606-3182<br />
• National Council for Accreditation <strong>of</strong> Teacher Education (NCATE)<br />
2010 Massachusetts Avenue, N.W., Suite 500<br />
Washington, D.C. 20036<br />
(202) 466-7496<br />
• National League for Nursing Accrediting Commission (NLNAC)<br />
61 Broadway, 33 rd Floor<br />
New York, NY 10006<br />
(212) 363-5555<br />
MEMBERSHIPS<br />
Institutional<br />
• American Association <strong>of</strong> State Colleges and Universities (AASCU)<br />
• American Council on Education (ACE)<br />
• Association for Intuitional Research (AIR)<br />
• Association <strong>of</strong> Governing Boards <strong>of</strong> Universities and Colleges (AGB)<br />
• College and <strong>University</strong> Personnel Association (CUPA)<br />
• Consortium <strong>of</strong> Universities <strong>of</strong> <strong>the</strong> Washington Metropolitan Area<br />
• Council on Undergraduate Research (CUR)<br />
• Middle States Association <strong>of</strong> Colleges and Schools, Inc.<br />
• National Association for Equal Opportunity in Higher Education (NAFEO)<br />
• National Association <strong>of</strong> State Universities and Land-Grant Colleges (NASULGC)<br />
• National Association <strong>of</strong> Student Financial Aid Administrators (NASFAA)<br />
• The Greater Washington Board <strong>of</strong> Trade<br />
7
MEMBERSHIPS<br />
Specialized<br />
• American Assembly <strong>of</strong> Collegiate Schools <strong>of</strong> Business<br />
• American Association <strong>of</strong> Colleges for Teacher Education (AATC)<br />
• American Association <strong>of</strong> Colleges <strong>of</strong> Nursing<br />
• American Association for Higher Education<br />
• American Association <strong>of</strong> Law Schools (AALS)<br />
• American Ma<strong>the</strong>matical Society (AMS)<br />
• American Society for Engineering Education<br />
• American Speech-Language-Hearing Association (ASHA)<br />
• Association <strong>of</strong> Collegiate Business Schools and Programs<br />
• Association <strong>of</strong> Collegiate Schools <strong>of</strong> Architecture<br />
• Council <strong>of</strong> Academic Programs on Communication Sciences and Disorders (CAPCSD)<br />
• Council <strong>of</strong> Colleges <strong>of</strong> Arts and Sciences (CCAS)<br />
• Council <strong>of</strong> Colleges <strong>of</strong> Arts and Sciences in Urban Universities (CCASUU)<br />
• Council <strong>of</strong> Graduate Programs<br />
• Council <strong>of</strong> Graduate Schools<br />
• Engineering Accreditation Commission<br />
• Ma<strong>the</strong>matical Association <strong>of</strong> America (MAA)<br />
• Mid-Atlantic Consortium <strong>of</strong> Social Work Directors<br />
• National Association <strong>of</strong> Education <strong>of</strong> Young Children<br />
• National Association <strong>of</strong> Ma<strong>the</strong>matics (NAM)<br />
• National Institutes <strong>of</strong> Water Resources<br />
• Society for College and <strong>University</strong> Planning (SCUP)<br />
• Technology Accreditation Commission<br />
8
MISSION OF THE OFFICE OF INSTITUTIONAL RESEARCH,<br />
ASSESSMENT AND PLANNING<br />
The mission <strong>of</strong> <strong>the</strong> Office <strong>of</strong> Institutional Research, Assessment and Planning is to enhance<br />
institutional effectiveness by providing information that supports academic and university planning<br />
and streng<strong>the</strong>ns assessment and decision making processes for <strong>the</strong> administration <strong>of</strong> <strong>the</strong> <strong>University</strong><br />
<strong>of</strong> <strong>the</strong> <strong>District</strong> <strong>of</strong> <strong>Columbia</strong>. An integral part <strong>of</strong> our mission is to support internal and external<br />
requests for information and research regarding <strong>the</strong> <strong>University</strong>, including demographic and<br />
education related matters.<br />
Goals and Objectives<br />
• To support informed decision making throughout <strong>the</strong> <strong>University</strong>, independently and in<br />
collaboration with o<strong>the</strong>r campus constituencies charged with <strong>the</strong> responsibility for data<br />
collection, analysis, and presentation <strong>of</strong> institutional data.<br />
• To coordinate institutional data collection efforts that support internal and external<br />
reporting as well as compliance with governing agencies and accreditation bodies.<br />
• To provide access to, and to coordinate <strong>the</strong> release <strong>of</strong> selected, reliable university-wide<br />
data.<br />
• To assist with assessment and program evaluation efforts through <strong>the</strong> provision <strong>of</strong><br />
resources and data.<br />
• Provide significant support and coordination for <strong>University</strong> planning efforts by collecting,<br />
analyzing and summarizing data from operational activities.<br />
• Produce facts about <strong>the</strong> <strong>University</strong> and engage in special studies when needed.<br />
9
SECTION II<br />
Admission and Entering<br />
Freshmen Student<br />
Information<br />
10
APPLICANTS AND ADMITTED STUDENTS BY ETHNICITY AND GENDER<br />
FALL <strong>2005</strong> AND <strong>2006</strong><br />
Demographic<br />
Characteristics Applicant Admitted<br />
<strong>2005</strong> <strong>2006</strong><br />
%<br />
Admitted<br />
Applicant<br />
Ethnicity<br />
Admitted<br />
%<br />
Admitted<br />
% Change<br />
in<br />
Applicants<br />
% Change<br />
In<br />
Admission<br />
American Indian 9 7 77.8% 4 4 100.0% -55.6% -42.9%<br />
Asian 118 55 46.6% 116 66 56.9% -1.7% 20.0%<br />
Black 3,310 2,779 84.0% 3,167 2,640 83.4% -4.3% -5.0%<br />
Hispanic 260 186 71.5% 179 130 72.6% -31.2% -30.1%<br />
White 277 208 75.1% 272 230 84.6% -1.8% 10.6%<br />
O<strong>the</strong>r 216 185 85.6% 691 633 91.6% 219.9% 242.2%<br />
Gender<br />
Male 1,534 1,196 78.0% 1,873 1,544 82.4% 22.1% 29.1%<br />
Female 2,656 2,224 83.7% 2,556 2,159 84.5% -3.8% -2.9%<br />
Total 4,190 3,420 81.6% 4,429 3,703 83.6% 5.7% 8.3%<br />
Source: Office <strong>of</strong> Institutional Research, Assessment and Planning. Report # SIAY3016 – Admission Report for respective terms<br />
11
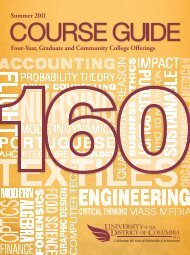
APPLICANTS AND ADMITTED STUDENTS, FALL <strong>2005</strong> AND <strong>2006</strong>.<br />
5000<br />
4500<br />
4,190<br />
4,429<br />
4000<br />
3500<br />
3,420<br />
3,703<br />
3000<br />
2500<br />
Fall <strong>2005</strong><br />
Fall <strong>2006</strong><br />
2000<br />
1500<br />
1000<br />
500<br />
0<br />
Applicant<br />
Admitted<br />
Source: Office <strong>of</strong> Institutional Research, Assessment and Planning. Report# SIAY 3016- Admission Report for respective Terms<br />
12
FIRST-TIME ENTERING STUDENTS ENROLLED FROM DC PUBLIC,<br />
PRIVATE AND CHARTER SCHOOLS, FALL <strong>2005</strong> AND <strong>2006</strong><br />
Name and Type <strong>of</strong> School <strong>2005</strong> <strong>2006</strong><br />
Public Schools<br />
Anacostia 24 14<br />
Armstrong Adult Learning Center 4 1<br />
Ballou 32 17<br />
Ballou Stay External Program 18 14<br />
Banneker 4 2<br />
Bell Multicultural 32 25<br />
Burdick 1 0<br />
Cardoza 45 41<br />
Chamberlain 3 1<br />
Coolidge 45 26<br />
Dix Street Academy 0 0<br />
Dunbar 41 40<br />
Eastern 51 27<br />
Ellington School <strong>of</strong> <strong>the</strong> Arts 13 8<br />
GED Testing Program 79 50<br />
M.M. Washington 8 14<br />
McKinley Technical 4 7<br />
Phelps Vocational 3 2<br />
Roosevelt 31 33<br />
Roosevelt Stay External Program 8 2<br />
School Without Walls 24 24<br />
Spingarn 31 18<br />
Spingarn Stay Program 4 5<br />
Wilson 33 43<br />
Woodson 28 18<br />
Sub-total 566 432<br />
Private Schools<br />
Archbishop Carroll 10 3<br />
Emerson Preparatory 1 0<br />
Gonzaga 1 0<br />
Mackin 1 0<br />
St. Johns 1 2<br />
Sub-total 14 5<br />
Chartered Public Schools<br />
Booker T. Washington School /Tech. Arts 9 3<br />
Cesar Chavez School for Public Policy 0 3<br />
Friendship-Edison Collegiate Academy 33 28<br />
Hyde Leadership School 1 1<br />
Integrated Design & Electronic Academy 1 1<br />
Jos-Arz Academy School 1 Closed<br />
Kamit Institute for Magnificent Achievers 1 12<br />
Marriott Hospitality High School 0 3<br />
Maya Angelou School 0 5<br />
New School for Enterprise & Development 10 Closed<br />
Next Step School 0 0<br />
School for Educational Evolution & Development 0 0<br />
Thurgood Marshall Academy 1 1<br />
Washington Ma<strong>the</strong>matics, Science & Technology 18 17<br />
Sub- total 75 74<br />
Grand Total 655 511<br />
Source: Office <strong>of</strong> Institutional Research, Assessment & Planning. Report # RTO3140 – EFR Students Listed by<br />
High School attended for respective terms.<br />
13
ENTERING FRESHMEN CHARACTERISTICS, FALL <strong>2005</strong> AND <strong>2006</strong><br />
CHARACTERISTICS<br />
FALL <strong>2005</strong> FALL <strong>2006</strong> %<br />
Number Percent Number Percent Change<br />
Total Entering Freshmen 1,136 100.0% 1,425 100.0% +25.4%<br />
Academic Workload<br />
Full-Time 498 43.8% 932 65.4% +87.1%<br />
Part-Time 638 56.2% 493 34.6% -22.7%<br />
Total 1,136 100.0% 1,425 100.0% +25.4%<br />
Residency<br />
Non-Resident 311 27.4% 751 52.7% +141.5%<br />
Resident 825 72.6% 674 47.3% -18.3%<br />
Total 1,136 100.0% 1,425 100.0% +25.4%<br />
Credit Hours<br />
Full-Time 6,440 59.5% 13,111 79.3% +103.6%<br />
Part-Time 4,375 40.5% 3,427 20.7% -21.7%<br />
Total 10,815 100.0% 16,538 100.0% +52.9%<br />
Gender<br />
Female 730 64.3% 708 49.7% -3.0%<br />
Male 406 35.7% 717 50.3% +76.6%<br />
Total 1,136 100.0% 1,425 100.0% +25.4%<br />
Full-Time Equivalency (FTE)<br />
Full-Time 429 59.5% 874 79.3% +103.7%<br />
Part-Time 292 40.5% 228 20.7% -21.9%<br />
Total 721 100.0% 1,102 100.0% +52.8%<br />
Ethnicity<br />
American Indian 2 0.2% 1 0.1% -50.0%<br />
Asian 26 2.3% 34 2.4% +30.8%<br />
Black 887 78.1% 784 55.0% -11.6%<br />
Hispanic or Latino 78 6.9% 55 3.9% -29.5%<br />
White 59 5.2% 83 5.8% +40.7%<br />
O<strong>the</strong>r 84 7.4% 468 32.8% +457.1%<br />
Total 1,136 100.% 1,425 100.0% +25.4%<br />
Source: Office <strong>of</strong> Institutional Research, Assessment and Planning. Report # EXO3010J – Enrollment Statistics for respective terms.<br />
14
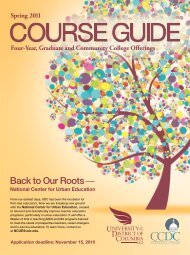
1600<br />
1400<br />
ENTERING FRESHMENT STUDENT CHARACTERSTICS, FALL SEMSETERS <strong>2005</strong> AND <strong>2006</strong><br />
1425<br />
1200<br />
1136<br />
ENROLLMENT<br />
1000<br />
800<br />
600<br />
400<br />
200<br />
0<br />
Fall <strong>2005</strong> Fall <strong>2006</strong><br />
SEMESTER<br />
Source: Office <strong>of</strong> Institutional Research, Assessment and Planning. Report # RTO3010J – Enrollment Statistics for respective terms.<br />
15
ENTERING FRESHMEN BY COLLEGE AND SCHOOLS<br />
FALL <strong>2005</strong> AND <strong>2006</strong><br />
Fall <strong>2005</strong> Fall <strong>2006</strong> %<br />
College/School<br />
Enrollment Percentage Enrollment Percentage Change<br />
Arts & Sciences 810 71.3% 711 49.9% -12.2%<br />
Business & Public<br />
203 17.9% 340 23.9% +67.5%<br />
Administration<br />
Engineering & Applied<br />
123 10.8% 374 26.2% +204.1%<br />
Sciences<br />
<strong>University</strong> Total 1,136 100.0% 1,425 100.0% +25.4%<br />
Source: Office <strong>of</strong> Institutional Research, Assessment and Planning. Report # EXO3010J – Enrollment Statistics for respective terms.<br />
NOTE: The significant increase in <strong>the</strong> School <strong>of</strong> Engineering and Applied Sciences enrollment is<br />
due to an increased enrollment in <strong>the</strong> Maadi Program.<br />
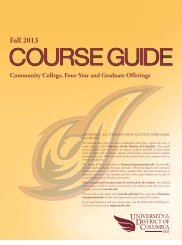
ENTERING FRESHMEN ENROLLMENT BY COLLEGE AND SCHOOLS: FALL SEMESTERS,<br />
<strong>2005</strong> AND <strong>2006</strong><br />
ENROLLMENT<br />
900<br />
800<br />
700<br />
600<br />
500<br />
400<br />
810<br />
711<br />
340<br />
374<br />
300<br />
200<br />
100<br />
203<br />
123<br />
0<br />
Engineering &<br />
Applied<br />
Sciences<br />
Business &<br />
Public<br />
Administration<br />
Arts &<br />
Sciences<br />
<strong>2005</strong> Fall <strong>2006</strong> Fall<br />
Source: Office <strong>of</strong> Institutional Research, Assessment and Planning. Report # EXO3010J – Enrollment Statistics for respective terms.<br />
16
ENTERING FRESHMEN BY COLLEGE, SCHOOL, DEPARTMENT,<br />
DECLARED MAJOR, FALL <strong>2005</strong> AND <strong>2006</strong><br />
Fall <strong>2005</strong> Fall <strong>2006</strong> %<br />
School/College/Dept./Major Students Percentage Students Percentage Change<br />
COLLEGE OF ARTS AND SCIENCES<br />
Education:<br />
Child Dev. & Nursery Sch Educ. (AAS) 50 44.6% 48 52.2% -4.0%<br />
Early Childhood Education (BA) 29 25.9% 22 23.9% -24.1%<br />
Elementary Education (BA) 20 17.9% 14 15.2% -30.0%<br />
Health Education (BS) 7 6.3% 7 7.6% 0.0%<br />
Special Education (BS) 6 5.4% 1 1.1% -83.3%<br />
Department Total 112 100.0% 92 100.0% -17.9%<br />
English Studies:<br />
English (BA) 12 100.0% 22 100.0% 83.3%<br />
Department Total 12 100.0% 22 100.0% 83.3%<br />
Language & Communication Disorders:<br />
French (BA) 0 0.0% 0 0.0% NA<br />
Spanish (BA) 8 80.0% 1 16.7% -87.5%<br />
Speech/Language Pathology (BS) 2 20.0% 5 83.3% 150.0%<br />
Department Total 10 100.0% 6 100.0% -40.0%<br />
Mass Media Visual & Performing Arts:<br />
Graphic Communications (BS) 4 4.8% 8 12.1% 100.0%<br />
Graphic Design (AA) 11 13.3% 10 15.2% -9.1%<br />
Mass Media Art (BA) 25 30.1% 31 47.0% 24.0%<br />
Music (AA) 3 3.6% 0 0.0% -100.0%<br />
Music (BM) 22 26.5% 15 22.7% -31.8%<br />
Studio Art (BA) 0 0.0% 0 0.0% NA<br />
Theatre Arts (BA) 18 21.7% 2 3.0% -88.9%<br />
Department Total 83 100.0% 66 100.0% -20.5%<br />
Biological & Environmental Science:<br />
Biology (BS) 31 83.8% 30 83.3% -3.2%<br />
Environmental Science (BS) 0 0.0% 0 0.0% NA<br />
Nutrition & Food Science (BS) 6 16.2% 6 16.7% 0.0%<br />
Water Quality & Marine Science (AAS) 0 0.0% 0 0.0% NA<br />
Department Total 37 100.0% 36 100.0% -2.7%<br />
Chemistry & Physics:<br />
Chemistry (BS) 12 92.3% 9 69.2% -25.0%<br />
Physics (BS) 1 7.7% 4 30.8% 300.0%<br />
Department Total 13 100.0% 13 100.0% 0.0%<br />
Ma<strong>the</strong>matics:<br />
Ma<strong>the</strong>matics (BS) 6 100.0% 3 100.0% -50.0%<br />
Department Total 6 100.0% 3 100.0% -50.0%<br />
Nursing & Allied Health:<br />
Medical Radiography (AAS) 33 14.6% 33 15.6% 0.0%<br />
Mortuary Science (AAS) 28 12.4% 12 5.7% -57.1%<br />
Nursing (AAS) 86 38.1% 82 38.6% -4.7%<br />
Nursing (BS) 67 29.6% 75 35.4% 11.9%<br />
Respiratory Therapy (AAS) 12 5.3% 10 4.7% -16.7%<br />
Department Total 226 100.0% 212 100.0% -6.2%<br />
17
ENTERING FRESHMEN BY COLLEGE, SCHOOL, DEPARTMENT,<br />
DECLARED MAJOR, FALL <strong>2005</strong> AND <strong>2006</strong><br />
Fall <strong>2005</strong> Fall <strong>2006</strong> %<br />
School/College/Dept./Major Students Percentage Students Percentage Change<br />
COLLEGE OF ARTS AND SCIENCES<br />
Psychology & Counseling:<br />
Psychology 39 100.00% 30 100.00% -23.1%<br />
Department Total 39 100.00% 30 100.00% -23.1%<br />
Urban Affairs, Social Sciences & Social Work:<br />
Administration <strong>of</strong> Justice (BA) 44 34.4% 30 36.6% -31.8%<br />
History (BA) 0 5.5% 7 8.5% 0.0%<br />
Corrections Administration (AA) 0 0.8% 0 0.0% -100.0%<br />
Law Enforcement (AS) 15 11.7% 6 7.3% -60.0%<br />
Political Science (BA) 17 13.3% 10 12.2% -41.2%<br />
Social Work (BSW) 31 24.2% 20 24.4% -35.5%<br />
Sociology & Anthropology (BA) 9 7.0% 6 7.3% -33.3%<br />
Urban Studies (BA) 4 3.1% 3 3.7% -25.0%<br />
Department Total 128 100.0% 82 100.0% -35.9%<br />
Undeclared* 144 17.8% 149 21.0% 3.5%<br />
College Total 810 71.3% 711 49.9% -12.2%<br />
SCHOOL OF BUSINESS AND PUBLIC ADMINISTRATION<br />
Accounting, Finance & Economics:<br />
Accounting (BBA) 25 52.1% 86 81.9% 244.0%<br />
Accounting Technology (AAS) 0 0.0% 0 0.0% NA<br />
Computer Accounting Tech. (AAS) 2 4.2% 4 3.8% 100.0%<br />
Economics (BS) 4 8.3% 10 9.5% 150.0%<br />
Finance (BA) 17 35.4% 5 4.8% -70.6%<br />
Department Total 48 100.00% 105 100.0% 118.8%<br />
Management, Hospitality & Graduate Studies:<br />
Administrative Office Mgt. (AAS) 3 1.9% 4 1.7% 33.3%<br />
Business Management (BBA) 97 62.6% 192 81.7% 97.9%<br />
Business Technology (AAS) 3 1.9% 6 2.6% 100.0%<br />
(Computer Science) Infor. Systems (BA) 13 8.4% 7 3.0% -46.2%<br />
Hospitality Mgt. & Tourism (AAS) 6 3.9% 9 3.8% 50.0%<br />
Legal Assistant (AAS) 9 5.8% 2 0.9% -77.8%<br />
Marketing (BBA) 16 10.3% 10 4.3% -37.5%<br />
Office Administration (BS) 5 3.2% 4 1.7% -20.0%<br />
Procurement & Pub. Cont.(BBA) 3 1.9% 1 0.4% -66.7%<br />
Department Total 155 100.0% 235 100.0% 51.6%<br />
School Total 203 17.9% 340 23.9% 67.5%<br />
SCHOOL OF ENGINEERING AND APPLIED SCIENCES<br />
Engineering, Architecture & Aerospace Technology:<br />
Airway Science (BS) 1 2.1% 3 3.8% 200.0%<br />
Arch. Engineering Technology (AAS) 2 4.2% 4 5.1% 100.0%<br />
Architecture (BA) 11 22.9% 5 6.4% -54.5%<br />
Aviation Maintenance (AAS) 8 16.7% 9 11.5% 12.5%<br />
Civil Engineering (BS) 5 10.4% 7 9.0% 40.0%<br />
Construction Engineering Tech. (BS) 0 0.0% 0 0.0% NA<br />
Fire Science (AAS) 5 10.4% 8 10.3% 60.0%<br />
Fire Science Administration (BS) 11 22.9% 12 15.4% 9.1%<br />
Mechanical Engineering (BS) 5 10.4% 30 38.5% 500.0%<br />
Department Total 48 100.0% 78 100.0% 62.5%<br />
* Percentages are calculated out <strong>of</strong> totals <strong>of</strong> College <strong>of</strong> Arts & Sciences<br />
Source: Office <strong>of</strong> Institutional Research, Assessment and Planning. Report # RTO3155 – Students Enrolled by Classification for respective terms.<br />
18
ENTERING FRESHMEN BY COLLEGE, SCHOOL, DEPARTMENT,<br />
DECLARED MAJOR, FALL <strong>2005</strong> AND <strong>2006</strong><br />
Fall <strong>2005</strong> Fall <strong>2006</strong> %<br />
School/College/Dept./Major Students Percentage Students Percentage Change<br />
Electrical Engineering, Computer Science & Information Technology:<br />
Applied Computer Science (BA) 0 0.0% 0 0.0% NA<br />
Computer Science (BS) 25 62.5% 74 92.5% 196.0%<br />
Computer Science Technology (AAS) 13 32.5% 3 3.8% -76.9%<br />
Information Technology (BS) 1 2.5% 3 3.8% 200.0%<br />
Printing Management (BS) 0 0.0% 0 0.0% NA<br />
Printing Technology (AAS) 1 2.5% 0 0.0% -100.0%<br />
Department Total 40 100.0% 80 100.0% 100.0%<br />
Electrical Engineering:<br />
Electrical Engineering (BS) 28 80.0% 215 99.5% 667.9%<br />
Electronics Engineering Tech. (AAS) 7 20.0% 1 0.5% -85.7%<br />
Electronics Engineering (BS) 0 0.0% 0 0.0% NA<br />
Departmental Total 35 100.0% 216 100.0% 517.1%<br />
School Total 123 10.8% 374 26.3% 204.1%<br />
UNIVERSITY TOTAL 1,136 100.00% 1,425 100.00% 25.4%<br />
Source: Office <strong>of</strong> Institutional Research, Assessment and Planning. Report # RTO3155 – Students Enrolled by Classification for<br />
respective terms.<br />
19
SECTION III<br />
ENROLLMENT AND<br />
STUDENT<br />
CHARACTERISTICS<br />
20
FULL AND PART-TIME ENROLLMENT BY COLLEGE AND DEPARTMENT<br />
FALL SEMESTER <strong>2005</strong><br />
College/Department<br />
Full Time<br />
Part Time<br />
Total<br />
UG G Total UG G Total<br />
College <strong>of</strong> Arts and Sciences<br />
Education 207 2 209 543 5 548 757<br />
English 24 4 28 45 12 57 85<br />
Languages and Communication Disorders 32 16 48 32 7 39 87<br />
Mass Media, Visual and Performing Arts 199 0 199 193 0 193 392<br />
Biological and Environmental Sciences 88 5 93 107 3 110 203<br />
Chemistry and Physics 21 0 21 24 0 24 45<br />
Ma<strong>the</strong>matics 10 1 11 17 3 20 31<br />
Nursing and Allied Health 296 0 296 598 0 598 894<br />
Psychology and Counseling 61 13 74 91 26 117 191<br />
Urban Affairs, Social Sci. & Soc. Work 190 0 190 235 0 235 425<br />
Subtotal 1128 41 1169 1885 56 1941 3110<br />
School <strong>of</strong> Business and Public Administration<br />
Accounting, Finance and Economics 174 0 174 144 0 144 318<br />
Mgt. Marketing and Information Systems 342 39 381 388 21 409 790<br />
Subtotal 516 39 555 532 21 553 1108<br />
School <strong>of</strong> Engineering and Applied Science<br />
Architecture, Graphic Comm. & Design 56 0 56 66 0 66 122<br />
Engineering and Aerospace Technology 106 0 106 103 0 103 209<br />
Electrical Eng. And Computer Science 107 0 107 104 0 104 211<br />
Subtotal 269 0 269 273 0 273 542<br />
Undeclared 235 4 239 255 0 365 604<br />
<strong>University</strong> Total 2,148 84 2232 2945 77 3132 5364<br />
Source: Office <strong>of</strong> Institutional Research, Assessment and Planning. Report #: RTO3270 – Full/Part-Time Enrollment & Student<br />
FTE, <strong>2005</strong>.<br />
FULL AND PART-TIME ENROLLMENT BY COLLEGE AND DEPARTMENT<br />
FALL SEMESTER <strong>2006</strong><br />
College/Department<br />
Full Time<br />
Part Time<br />
Total<br />
UG G Total UG G Total<br />
College <strong>of</strong> Arts and Sciences<br />
Education 255 1 256 455 5 460 716<br />
English 27 3 30 36 11 47 77<br />
Languages and Communication Disorders 31 16 47 30 8 38 85<br />
Mass Media, Visual and Performing Arts 187 0 187 176 0 176 363<br />
Biological and Environmental Sciences 126 4 130 90 2 92 222<br />
Chemistry and Physics 33 0 33 23 0 23 56<br />
Ma<strong>the</strong>matics 7 2 9 14 1 15 24<br />
Nursing and Allied Health 290 0 290 318 0 318 608<br />
Psychology and Counseling 60 16 76 80 25 105 181<br />
Urban Affairs, Social Sci. & Soc. Work 189 0 189 194 0 194 383<br />
Subtotal 1205 42 1247 1416 52 1468 2715<br />
School <strong>of</strong> Business and Public Administration<br />
Accounting, Finance and Economics 234 0 234 128 0 128 362<br />
Mgt. Marketing and Information Systems 420 42 462 321 41 362 824<br />
Subtotal 654 42 696 449 41 490 1186<br />
School <strong>of</strong> Engineering and Applied Science<br />
Architecture, Graphic Comm. & Design 74 0 74 51 0 51 125<br />
Engineering and Aerospace Technology 318 0 318 196 0 196 514<br />
Electrical Eng. And Computer Science 121 0 121 79 0 79 200<br />
Subtotal 513 0 513 326 0 326 839<br />
Undeclared 375 7 382 362 5 0 412 794<br />
<strong>University</strong> Total 2747 91 2838 2533 143 2696 5534<br />
Source: Office <strong>of</strong> Institutional Research, Assessment and Planning. Report #: RTO3270 – Full/Part Time Enrollment & Student<br />
FTE, <strong>2006</strong>.<br />
21
TOTAL ENROLLMENT BY COLLEGE/SCHOOL, FALL <strong>2005</strong> AND <strong>2006</strong><br />
3500<br />
3,110<br />
3000<br />
2,715<br />
2500<br />
2000<br />
<strong>2005</strong>F<br />
<strong>2006</strong>F<br />
1500<br />
1,108 1,186<br />
1000<br />
839<br />
794<br />
542<br />
604<br />
500<br />
0<br />
Arts & Sciences Business Engineering Undeclared<br />
Source: Office <strong>of</strong> Institutional Research, Assessment and Planning. Report #: RTO3270 –<br />
Full/Part Time Enrollment & Student FTE, <strong>2006</strong>.<br />
22
STUDENT ENROLLMENT BY WARD, FALL <strong>2005</strong> AND <strong>2006</strong><br />
Ward <strong>2005</strong> <strong>2006</strong><br />
% Change<br />
# % # %<br />
1 610 (11.4%) 566 (10.2%) -7.2%<br />
2 87 (1.6%) 74 (1.3%) -14.9%<br />
3 231 (4.3%) 212 (3.8%) -8.2%<br />
4 1,077 (20.0%) 1,028 (18.6%) -4.5%<br />
5 563 (10.5%) 495 (8.9%) -12.1%<br />
6 399 (7.4%) 354 (6.4%) -11.3%<br />
7 934 (17.4%) 909 (16.4%) -2.7%<br />
8 304 (5.7%) 276 (5.0%) -9.2%<br />
Non-D.C. 1,159 (21.6%) 1,620 (29.3%) 39.8%<br />
Total 5,364 (100%) 5,534 (100% 3.2%<br />
Source: Office <strong>of</strong> Institutional Research, Assessment & Planning. Report## EXO3010J for respective terms<br />
Note: - The above table does not include <strong>the</strong> UDC David A. Clarke School <strong>of</strong> Law.<br />
23
Resident Student Enrollment by Ward: Fall Semesters <strong>2005</strong> and <strong>2006</strong><br />
1,200<br />
1,077<br />
1,000<br />
1,028<br />
934<br />
909<br />
Enrollment<br />
800<br />
600<br />
610<br />
563<br />
<strong>2005</strong> Fall<br />
<strong>2006</strong> Fall<br />
400<br />
200<br />
566<br />
231<br />
212<br />
495<br />
399<br />
354<br />
304<br />
276<br />
87<br />
74<br />
0<br />
1 2 3 4 5 6 7 8<br />
<strong>District</strong> <strong>of</strong> <strong>Columbia</strong> Wards<br />
Source: Office <strong>of</strong> Institutional Research, Assessment & Planning. Report# EXO3010J for respective terms.<br />
24
TOTAL ENROLLMENT BY CHARACTERSTICS, FALL <strong>2005</strong> AND <strong>2006</strong><br />
Characteristics <strong>2005</strong> <strong>2006</strong> % Change<br />
Total Enrollment 5,602 5,772 3.0% 1<br />
<strong>University</strong> <strong>of</strong> <strong>the</strong> <strong>District</strong> <strong>of</strong> <strong>Columbia</strong> 5,364 5,129 -4.4%<br />
Maadi Program - 405 0%<br />
David A. Clarke School <strong>of</strong> Law 238 238 0%<br />
FTE 3,296 3,664 11.2%<br />
Credit Hours 49,098 54,592 12.1%<br />
Gender<br />
Female 3,625 3,485 -3.9%<br />
Male 1,977 2,287 15.7%<br />
Total 5,602 5,772 3.0%<br />
Undergraduate Enrollment<br />
First-Time Entering Freshmen 1,136 1,425 25.4%<br />
Continuing Freshmen 1,296 1,142 -11.9%<br />
Sophomores 909 895 -1,5%<br />
Juniors 687 717 4.4%<br />
Seniors 1,056 1,052 -0.4%<br />
Special Undergraduate 86 69 -19.8%<br />
Subtotal 5,170 5,300<br />
2.5%<br />
(96.4%) (95.8%)<br />
Graduate Enrollment<br />
Graduate (1 st year) 71 94 32.4%<br />
Graduate (2 nd year) 81 81 0%<br />
Special Graduate 42 59 40.5%<br />
Subtotal 194<br />
234<br />
20.6%<br />
(3.6%) (4.2%)<br />
Total 5,364 5,534<br />
3.2%<br />
(100%) (100%)<br />
Residency<br />
Undergraduate<br />
Resident 3,792 3,513 -7.4%<br />
Non-Resident 1,378 1,787 29.7%<br />
Total 5,170 5,300 2.5%<br />
Graduate<br />
Resident 109 124 13.8%<br />
Non-Resident 85 110 29.4%<br />
Total 194 234 20.6%<br />
FTE Distribution<br />
Full-Time FTE 1,833 2,335 27.4%<br />
Part-Time FTE 1,463 1,329 -9.2%<br />
Total 3,296 3,664 11.0%<br />
Source: Office <strong>of</strong> Institutional Research, Assessment, and Planning. Report # EXO3010J – Student Count (Frozen File).<br />
1 Enrollment data for <strong>2005</strong> Maadi Program was not available at <strong>the</strong> time <strong>of</strong> <strong>the</strong> compilation <strong>of</strong> this Fact Book.<br />
25
ENROLLMENT IN THE MAADI PROGRAM BY CHARACTERISTICS, FALL <strong>2006</strong><br />
CHARACTERISTICS<br />
Number<br />
Total Enrollment 405<br />
Total FTE 410<br />
Total Credit Hours 6,156<br />
Classification<br />
First-Time Entering Freshmen 403 (99.5%)<br />
Seniors 2 (0.5%)<br />
Total 405 (100%)<br />
Academic Load<br />
Full-Time 382 (94.3%)<br />
Part-Time 23 (5.7%)<br />
Total 405 (100%)<br />
Gender<br />
Female 82 (20.2)<br />
Male 323 (79.8)<br />
Total 405 (100%)<br />
Age Group<br />
< 18 Years 40 (9.9%)<br />
18 – 19 Years 256 (63.2)<br />
20 – 21 Years 78 (19.3%)<br />
22 – 24 Years 18 (4.4%)<br />
25 – 29 Years 2 (0.5%)<br />
65 & Over 11 (2.7%)<br />
Total 405 (100%)<br />
FTE Distribution<br />
Full-Time FTE 396 (96.6%)<br />
Part-Time FTE 14 (3.4%)<br />
Total 410 (100%)<br />
Credit Hour Distribution<br />
Full-Time 5,936 (96.4%)<br />
Part-Time 220 (3.6%)<br />
Total 6,156 (100%)<br />
Program Area<br />
School <strong>of</strong> Business & Public Administration 137 (33.8%)<br />
School <strong>of</strong> Engineering & Applied Sciences 268 (66.2%)<br />
Total 405 (100%)<br />
Source: Office <strong>of</strong> Institutional Research, Assessment & Planning. Report # EXO3010 –E – Selected Special Program: EEP<br />
(Maadi Program). December 6, <strong>2006</strong>.<br />
Note: - Enrollment data for <strong>2005</strong> Maadi Program was not keyed in by <strong>the</strong> freeze date.<br />
26
ENROLLMENT CLASSIFICATION BY NATIONAL AND<br />
INTERNATIONAL STATUS, FALL <strong>2005</strong> AND <strong>2006</strong><br />
Fall <strong>2005</strong> Fall <strong>2006</strong><br />
Student<br />
Status Count/% Female Male Total Female Male Total<br />
Count 3,191 1,537 4,728 3,111 1,870 4,981<br />
National % 88.0% 77.7% 84.4% 89.3% 81.8% 86.3%<br />
Count 434 440 874 374 417 791<br />
International % 12.0% 22.3% 15.6% 10.7% 18.2% 13.7%<br />
Count 3,625 1,977 5,602 3,485 2,287 5,772<br />
Total % 100.0% 100.0% 100.0% 100.0% 100.0% 100.0%<br />
Source: Office <strong>of</strong> Institutional Research, Assessment and Planning. Report# EXO3010J & RTO3152<br />
27
STUDENT ENROLLMENT BY ETHNICITY, FALL <strong>2005</strong> AND <strong>2006</strong><br />
<strong>2005</strong> <strong>2006</strong><br />
ETHNICITY NUMBER PERCENT NUMBER PERCENT<br />
%<br />
CHANGE<br />
Black 4,301 80.2% 4,039 73.0% -6.1%<br />
American Indian 6 0.1% 6 0.1% 0.0%<br />
Asian 137 2.6% 133 2.4% -2.9%<br />
Hispanic 315 5.9% 291 5.3% -7.6%<br />
White 287 5.4% 350 6.3% 22.0%<br />
Unspecified 318 5.9% 715 12.9% 124.8%<br />
Total 5,364 100% 5,534 100% 3.2%<br />
Source: Office <strong>of</strong> Institutional Research, Assessment and Planning. Report# EXO3010J for respective terms.<br />
Note: - The above table does not include <strong>the</strong> UDC David A. Clarke School <strong>of</strong> Law<br />
STUDENT ENROLLMENT BY AGE GROUP,<br />
FALL <strong>2005</strong> AND <strong>2006</strong><br />
Age Group<br />
<strong>2005</strong> <strong>2006</strong><br />
Number Percent Number Percent<br />
< 18 174 3.2% 179 3.2%<br />
18-19 550 10.3% 805 14.5%<br />
20-21 556 10.4% 624 11.3%<br />
22-24 811 15.1% 825 14.9%<br />
25-29 1,041 19.4% 965 17.4%<br />
30-34 624 11.6% 591 10.7%<br />
35-39 455 8.5% 424 7.7%<br />
40-49 721 13.4% 654 11.8%<br />
50-64 359 6.7% 393 7.1%<br />
65+ 73 1.4% 74 1.3%<br />
Total 5,364 100% 5,534 100%<br />
Source: Office <strong>of</strong> Institutional Research, Assessment and Planning. Report# EXO3010J for respective terms.<br />
Note: - The above table does not include <strong>the</strong> UDC David A. Clarke School <strong>of</strong> Law<br />
28
STUDENT ENROLLMENT BY ETHNICITY, FALL <strong>2005</strong> AND <strong>2006</strong><br />
4500<br />
4000<br />
4,301<br />
4039<br />
3500<br />
3000<br />
Enrollment<br />
2500<br />
2000<br />
1500<br />
<strong>2005</strong><br />
<strong>2006</strong><br />
1000<br />
500<br />
6 6<br />
137 133<br />
315 291 287 350 318 715<br />
0<br />
Black Amer. Indian Asian Hispanic White Unspecified<br />
Ethnicity<br />
Source: Office <strong>of</strong> Institutional Research, Assessment and Planning. Report# EXO3010J for respective Terms<br />
Note: - The above graph does not include <strong>the</strong> UDC David A. Clarke School <strong>of</strong> Law<br />
29
Student Enrollment by Age Group: Fall <strong>2005</strong> and <strong>2006</strong><br />
1200<br />
1000<br />
800<br />
805<br />
811 825 1,041<br />
965<br />
E n ro llm e n t<br />
600<br />
400<br />
200<br />
174 179 550<br />
556<br />
624<br />
624<br />
591<br />
455 424<br />
721 654<br />
359<br />
393<br />
<strong>2005</strong> Fall<br />
<strong>2006</strong> Fall<br />
73<br />
74<br />
0<br />
< 18 18-19 20-21 22-24 25-29 30-34 35-39 40-49 50-64 65+<br />
Age Group<br />
Source: Office <strong>of</strong> Institutional Research, Assessment and Planning. Report# EXO3010J for respective terms.<br />
30
DAVID A. CLARKE SCHOOL OF LAW ENROLLMENT,<br />
FALL <strong>2005</strong> AND <strong>2006</strong><br />
Characteristics <strong>2005</strong> <strong>2006</strong> % Change<br />
Total Enrollment 238 238 0%<br />
Total FTE 238.0 238.0 0%<br />
Total Credit Hours 3,458 3,493 1.0%<br />
Classification<br />
First Year 81 96 18.5%<br />
Second Year 70 70 0%<br />
Third Year 83 69 -16.9%<br />
Total 234 235 0.4%<br />
Residency<br />
Resident 101 100 -0.9%<br />
Non-Resident 137 138 0.7%<br />
Total 238 238 0%<br />
Gender<br />
Female 146 146 0%<br />
Male 92 92 0%<br />
Total 238 238 0%<br />
Non-Degree Students<br />
Full-Time 0 0 NA<br />
Part-Time 4 3 -25.0%<br />
Total 4 3 -25.0%<br />
Source: Office <strong>of</strong> Institutional Research, Assessment & Planning. David A. Clarke School <strong>of</strong> Law, Office <strong>of</strong> <strong>the</strong> Registrar.<br />
31
INTERNATIONAL STUDENT ENROLLMENT,<br />
FALL <strong>2005</strong> AND <strong>2006</strong><br />
Characteristics <strong>2005</strong> <strong>2006</strong> % Change<br />
Total Enrollment 874 791 -9.5%<br />
# % # %<br />
Gender<br />
Female 434 (49.7%) 374 (47.3%) -13.8%<br />
Male 440 (50.3%) 417 (52.7%) -5.2%<br />
Total 874 (100%) 791 (100%) -9.5%<br />
Academic Load<br />
Full Time 540 (61.8%) 525 (66.4%) -2.8%<br />
Part Time 334 (38.2%) 266 (33.6%) -20.4%<br />
Total 874 (100%) 791 (100%) -9.5%<br />
Ethnicity<br />
Asian 73 (8.4%) 63 (8.0%) -13.7%<br />
Black 609 (69.7%) 543 (68.6%) -10.8%<br />
Hispanic 91 (10.4%) 75 (9.5%) -17.6%<br />
White 61 (7.0%) 66 (8.3%) 8.2%<br />
Unspecified 40 (4.6%) 44 (5.6%) 10.0%<br />
Total 874 (100%) 791 (100%) -9.5%<br />
Undergraduate<br />
First Time Entering<br />
104 (12.7%) 95 (13.2%) -8.7%<br />
Freshmen<br />
Continuing Freshmen 104 (12.7%) 95 (13.2%) -8.7%<br />
Sophomore 157 (19.2%) 132 (18.4%) -15.9%<br />
Junior 152 (18.6%) 140 (19.5%) -7.8%<br />
Senior 300 (36.6%) 257 (35.7%) -14.3%<br />
Special Undergraduate 2 (0.2%) 0 (0.0%) -100.0%<br />
Subtotal 819 (100%) 719 (100%) -12.2%<br />
Graduate<br />
1 st Year 27 (49.1%) 44 (62.9%) +63%<br />
2 nd Year 24 (43.6%) 23 (32.9%) -4.2%<br />
Special Graduate 4 (7.3%) 3 (4.3%) -25.0%<br />
Subtotal 55 (100%) 70 (100%) 27.3%<br />
Total 874 791 -9.5%<br />
Source: Office <strong>of</strong> Institutional Research, Assessment and Planning. Report # RTO3152 – International Student Enrollment for<br />
respective terms.<br />
32
INTERNATIONAL ENROLLMENT BY COUNTRY OF ORIGIN,<br />
FALL <strong>2005</strong> AND <strong>2006</strong><br />
(Top 11 Countries)<br />
Country <strong>of</strong><br />
<strong>2005</strong> <strong>2006</strong><br />
%<br />
Origin Enrollment Percentage Enrollment Percentage Change<br />
Nigeria 78 8.9% 62 7.8% -20.5%<br />
Kenya 65 7.4% 56 7.2% -13.8%<br />
Ethiopia 65 7.4% 59 7.4% -9.2%<br />
Cameroon 38 4.3% 36 4.6% -5.3%<br />
Mali 26 3.0% 24 3.0% -7.7%<br />
Liberia 26 3.0% 9 1.1% -65.4%<br />
Senegal 21 2.4% 20 2.5% -4.8%<br />
Trinidad 20 2.4% 26 3.3% 30.0%<br />
Ghana 19 2.2% 14 1.8% -26.3%<br />
Turkey 12 1.4% 17 2.1% 41.7%<br />
Vietnam 14 1.6% 11 1.4% -21.4%<br />
O<strong>the</strong>r<br />
485 56.0% 457 57.8% -5.8%<br />
Countries<br />
Total 874 100.0% 791 100.0% -9.5%<br />
No. <strong>of</strong><br />
Countries<br />
Served<br />
104 97<br />
Source: Office <strong>of</strong> Institutional Research, Assessment & Planning. Report # RTO3152 – International Student Enrollment for<br />
respective terms<br />
33
SECTION IV<br />
ACADEMIC PROGRAMS<br />
BY COLLEGE, SCHOOL AND<br />
DEPARTMENT<br />
34
PROGRAMS BY COLLEGE, SCHOOLS, AND DEPARTMENTS<br />
COLLEGE OF ARTS AND SCIENCES<br />
Dr. Rachel Petty, Dean<br />
DIVISION OF ARTS AND EDUCATION<br />
Department <strong>of</strong> Education<br />
Dr. Patricia Myers, Chairperson<br />
(202) 274-7404, Bldg. 38, Room 109<br />
Child Development and Nursery School<br />
Education – A.A.<br />
Early Childhood Education – B.A.,<br />
Elementary Education – B.A.<br />
Health Education – B.S.<br />
Early Childhood Education – M.A.<br />
Special Education – B.A., M.A.<br />
Department <strong>of</strong> English<br />
Dr. Helene Krauthamer, Acting Chairperson<br />
(202) 274-5137, Bldg. 41, Room 413-04<br />
English – B.A.<br />
English Composition and Rhetoric – M.A.<br />
Department <strong>of</strong> Languages and<br />
Communication Disorders<br />
Dr. Marc Christhope, Chairperson<br />
(202) 274-7405, Bldg. 41, Room 413-05<br />
French – B.A.<br />
Spanish – B.A.<br />
Speech and Language Pathology – B.S., M.S.<br />
Department <strong>of</strong> Mass Media, Visual<br />
And Performing Arts<br />
Dr. Meredith rode, (Interim) Chairperson<br />
(202) 274-7402, bldg. 46, Room A03-B<br />
Music – A.A., B.M.<br />
Art – B.A.<br />
Theatre Arts – B.A.<br />
Mass Media – B.A.<br />
Graphic Communications – B..S.<br />
Graphic Design - A.A.<br />
Graphic Communications Technology – A.A..S.<br />
DIVISION OF SCIENCE AND<br />
MATHEMATICS<br />
Department <strong>of</strong> Biological and<br />
Environmental Sciences<br />
Dr. Freddie Dixon, Chairperson<br />
(202) 274-7401, Bldg. 44, Room 200-03<br />
Water Quality and Marine Science – A.A.S., Biology<br />
– B.S., Environmental Science – B.S., Nutrition and<br />
Food Science – B.S., Cancer Biology, Prevention &<br />
Control – M.S.<br />
Department <strong>of</strong> Chemistry and<br />
Physics<br />
Dr. Isadora Posey, Chairperson<br />
(202) 274-7410, Bldg. 44, Room 200-18<br />
Chemistry – B.S., Physics – B.S.<br />
Department <strong>of</strong> Ma<strong>the</strong>matics<br />
Dr. Vernise Steadman, Chairperson<br />
(202) 274-7410 Bldg. 32, Room B06-F<br />
Ma<strong>the</strong>matics – B.S., Physics – B.S.<br />
Ma<strong>the</strong>matics – M.S.T.<br />
Department <strong>of</strong> Nursing and Allied<br />
Health<br />
Dr. Connie M. Webster, Chairperson<br />
(202) 274-5940 Bldg. 44, Room 102<br />
Medical Radiography – A.A.S., Mortuary<br />
Science – A.A.S.<br />
Respiratory Therapy – A.A.S., Nursing –<br />
A.A.S., B.S.<br />
DIVISION OF URBAN AFFAIRS,<br />
BEHAVIORAL AND SOCIAL<br />
SCIENCES<br />
Department <strong>of</strong> Psychology and<br />
Counseling<br />
Dr. Lisa Moon, Acting Chairperson<br />
(202) 274-7406 Bldg. 44, Room 200-35<br />
Psychology – B.S., Clinical Psychology – M.S.,<br />
Counseling – M.S.<br />
Department <strong>of</strong> Urban Affairs, Social<br />
Sciences, and Social Work<br />
Dr. Shiela Harmon-Martin, Chairperson<br />
(202) 274-7403 Bldg. 41, Room 413-09<br />
History – B.A., Political Science – B.A.,<br />
Sociology & Anthropology – B.A.,<br />
Administration <strong>of</strong> Justice – B.A., Social Work –<br />
BSW, Urban Studies – B.A., Certificate in Non-<br />
Pr<strong>of</strong>it Leadership<br />
35
SCHOOL OF BUSINESS AND PUBLIC<br />
ADMINISTRATION<br />
Dr. Melanie Anderson (Acting Dean)<br />
(202) 274-7000 Bldg. 52, Room 508<br />
Department <strong>of</strong> Accounting, Finance &<br />
Economics<br />
Dr. Tarsaim Goyal, Chairperson<br />
(202) 274-7002 Bldg.52, Room 415-F<br />
Computer Accounting Technology – A.A.S.,<br />
Economics – B.A., Finance – B.B.A., Accounting –<br />
B.B.A.,<br />
Department <strong>of</strong> Management,<br />
Hospitality & Graduate Studies<br />
Dr. Hany Makhlouf, Chairperson<br />
(202) 274-7001 Bldg. 52, Room 504-G<br />
Administrative Office Management – A.A.S.,<br />
Business Technology – A.A.S., Hospitality<br />
Management and Tourism – A.A.S., Business<br />
Administration – M.B.A., Business Management –<br />
B.B.A., Office Administration – B.S., Public<br />
Administration – M.P.A.<br />
Department <strong>of</strong> Legal Studies and<br />
Information Systems<br />
Dr. Leslie Vermillion, Chairperson<br />
(202) 274-7002, Bldg. 52, Room 504-P<br />
Legal Assistant – A.A.S., Marketing – B.B.A.,<br />
(Computer Science) Information Systems – B.A.,<br />
Procurement & Public Contracting – B.B.A.,<br />
DAVID A. CLARK SCHOOL OF LAW<br />
Ka<strong>the</strong>rine S. Broderick, J.D., Dean<br />
(202) 274-7345 Bldg. 38, Room 201<br />
SCHOOL OF ENGINEERING AND<br />
APPLIED SCIENCES<br />
Dr. Ben O. Latigo, Dean<br />
(202) 274-5220 Bldg. 42, Room 212<br />
Department <strong>of</strong> Engineering,<br />
Architecture and Aerospace<br />
Technology<br />
Dr. Abiose Adebayo, Chairperson<br />
(202) 274-5126 Bldg. 42, Room 213-G<br />
Architecture – B.S., Architectural Engineering<br />
Technology – A.A.S., Airway Science – B.S.,<br />
Civil Engineering – B.S., Mechanical<br />
Engineering – B.S.,<br />
Fire Science Administration – B.S., Aviation<br />
Maintenance Technology – A.A.S., Aviation<br />
Maintenance Management – B.S., Fire Science<br />
– A.A.S.<br />
Department <strong>of</strong> Computer Science<br />
and Information Technology<br />
Dr. Roger Marshall, Chairperson<br />
(202) 274-6289 Bldg. 42, Room 112<br />
Computer Science – B.S., M.S., Computer<br />
Science Technology – A.A.S., Information<br />
Technology – B.S.<br />
Department <strong>of</strong> Electrical<br />
Engineering<br />
Dr. Samuel Lakeou<br />
(202) 274-7409 Bldg. 42, Room 109-E<br />
Electrical Engineering – B.S., Electronics<br />
Engineering – B.S., Electronics Engineering<br />
Technology – A.A.S.<br />
36
SECTION V<br />
DEGREES CONFERRED<br />
37
DEGREES CONFERRED BY GRADUATION TERM, COLLEGE/SCHOOL AND MAJOR,<br />
ACADEMIC YEAR <strong>2005</strong>-06<br />
GRADUATION TERM<br />
DEGREE MAJOR <strong>2005</strong>F <strong>2005</strong>M <strong>2006</strong>S TOTAL<br />
COLLEGE OF ARTS AND SCIENCES<br />
AA<br />
Graphic Design 1 1 4 6<br />
Child Development & Nursery School Educ. 2 0 25 27<br />
Music 0 0 1 1<br />
TOTAL (AA) 3 1 30 34<br />
AAS<br />
Corrections Administration 0 0 1 1<br />
Graphic Communications Technology 0 0 1 1<br />
Law Enforcement 3 1 6 10<br />
Medical Radiography 0 2 22 24<br />
Mortuary Science 0 0 5 6<br />
Nursing 0 1 13 14<br />
Respiratory Therapy 1 0 21 22<br />
Water Quality and Marine Science 2 0 2 4<br />
TOTAL (AAS) 6 4 72 82<br />
BA Administration <strong>of</strong> Justice 1 1 9 11<br />
Art 0 0 6 6<br />
Early Childhood Education 5 0 1 6<br />
Elementary Education 1 0 3 4<br />
English 1 1 3 5<br />
French 1 0 0 1<br />
History 1 0 0 1<br />
Mass Media Art 1 0 9 10<br />
Political Science 3 5 3 11<br />
Sociology and Anthropology 1 2 7 10<br />
Spanish 1 0 6 6<br />
Theatre Arts 0 0 3 3<br />
Urban Studies 1 0 1 2<br />
TOTAL (BA) 17 9 50 76<br />
BM Music 0 0 1 1<br />
TOTAL (BM) 0 0 1 1<br />
BS<br />
Biology 0 1 8 9<br />
Chemistry 0 0 3 3<br />
Environmental Science 3 0 3 6<br />
Graphic Communications 1 0 5 6<br />
Health Education 1 2 10 13<br />
Ma<strong>the</strong>matics 1 1 0 2<br />
Nutrition and Food Science 1 0 1 2<br />
Nursing 0 1 6 7<br />
Psychology 1 1 1 3<br />
Speech/language Pathology 0 0 1 1<br />
TOTAL (BS) 8 6 38 52<br />
BSW Social Work 2 1 9 12<br />
TOTAL (BSW) 2 1 9 12<br />
38
DEGREES CONFERRED BY GRADUATION TERM, COLLEGE/SCHOOL AND MAJOR,<br />
ACADEMIC YEAR <strong>2005</strong>-06<br />
GRADUATION TERM<br />
DEGREE MAJOR <strong>2005</strong>F <strong>2005</strong>M <strong>2006</strong>S TOTAL<br />
COLLEGE OF ARTS AND SCIENCES<br />
MA<br />
English Composition & Rhetoric 0 2 2 4<br />
Special Education 0 1 0 1<br />
TOTAL (MA) 0 3 2 5<br />
MS<br />
Cancer Biology, Prevention & Control 0 0 2 2<br />
Clinical Psychology 1 0 0 1<br />
Counseling 1 1 6 8<br />
Speech/Language Pathology-Clinical 2 1 3 6<br />
TOTAL (MS) 4 2 11 17<br />
MST Ma<strong>the</strong>matics 0 0 2 2<br />
TOTAL (MST) 0 0 2 2<br />
COLLEGE TOTAL 40 26 215 281<br />
SCHOOL OF BUSINESS AND PUBLIC ADMINISTRATION<br />
AAS<br />
Administrative Office Management 0 1 4 5<br />
Business Technology 5 0 13 18<br />
Computer Accounting Technology 0 0 1 1<br />
Hospitality Management & Tourism 0 0 5 5<br />
Legal Assistant 1 0 3 4<br />
TOTAL (AAS) 6 1 26 33<br />
BA<br />
(Computer Science) Information Systems 1 1 13 15<br />
Economics 6 3 9 18<br />
TOTAL (BA) 7 4 22 33<br />
BBA<br />
Accounting 8 1 23 32<br />
Business Management 13 9 30 52<br />
Finance 6 2 7 15<br />
Marketing 1 2 4 7<br />
Procurement & Public Contracting 1 1 2 4<br />
TOTAL (BBA) 29 15 66 110<br />
BS Office Administration 2 0 0 2<br />
TOTAL (BS) 2 0 0 2<br />
MBA Business Administration 2 2 3 7<br />
TOTAL (MBA) 2 2 3 7<br />
MPA Public Management 5 0 7 12<br />
TOTAL (MPA) 5 0 7 12<br />
SCHOOL TOTAL 51 22 124 197<br />
39
DEGREES CONFERRED BY GRADUATION TERM, COLLEGE/SCHOOL AND MAJOR,<br />
ACADEMIC YEAR <strong>2005</strong>-06<br />
GRADUATION TERM<br />
DEGREE MAJOR <strong>2005</strong>F <strong>2005</strong>M <strong>2006</strong>S TOTAL<br />
SCHOOL OF ENGINEERING AND APPLIED SCIENCES<br />
AAS<br />
Architectural Engineering Technology 0 2 3 5<br />
Aviation Maintenance Technology 0 0 4 4<br />
Computer Science Technology 1 0 6 7<br />
Electronics Engineering Technology 0 0 3 3<br />
Fire Science 0 1 1 2<br />
TOTAL (AAS) 1 3 17 21<br />
BA Applied Computer Science 5 0 11 16<br />
TOTAL (BA) 5 0 11 16<br />
BARC Architecture 0 0 1 1<br />
TOTAL (BARC) 0 0 1 1<br />
BS Architecture 0 0 3 3<br />
Airway Science 1 0 0 1<br />
Computer Science 8 1 12 21<br />
Construction Engineering Technology 1 0 0 1<br />
Civil Engineering 1 0 1 2<br />
Electrical Engineering 3 9 8 20<br />
Fire Science Administration 0 2 2 4<br />
Information Technology 1 0 1 2<br />
Mechanical Engineering 1 0 2 3<br />
TOTAL (BS) 16 12 29 57<br />
SCHOOL TOTAL 22 15 58 95<br />
UNIVERSITY TOTAL 113 63 397 573<br />
Source: Office <strong>of</strong> Institutional Research, Assessment and Planning. Report # AAO3041X – Graduating Class <strong>2006</strong>. 6/18/06.<br />
40
DEGREES CONFERRED BY ETHNIC ORIGIN, COLLEGE/SCHOOL AND MAJOR,<br />
ACADEMIC YEAR <strong>2005</strong>-06<br />
ETHNIC ORIGIN<br />
DEGREE MAJOR Asian Black Hispanic White O<strong>the</strong>r TOTAL<br />
COLLEGE OF ARTS AND SCIENES<br />
AA Graphic Design 0 5 1 0 0 6<br />
Child Development & Nursery Sch. Educ. 0 23 3 1 0 27<br />
Music 0 1 0 0 0 1<br />
TOTAL (AA) 0 29 4 1 0 34<br />
AAS Corrections Administration 0 1 0 0 0 1<br />
Graphic Communications Technology 0 1 0 0 0 1<br />
Law Enforcement 0 9 1 0 0 10<br />
Medical Radiography 1 19 1 2 1 24<br />
Mortuary Science 0 6 0 0 0 6<br />
Nursing 0 10 0 2 2 14<br />
Respiratory Therapy 2 19 0 1 0 22<br />
Water Quality and Marine Science 0 3 0 0 1 4<br />
TOTAL (AAS) 3 68 2 5 4 82<br />
BA Administration <strong>of</strong> Justice 0 11 0 0 0 11<br />
Art 0 5 0 1 0 6<br />
Early Childhood Education 0 4 1 1 0 6<br />
Elementary Education 0 4 0 0 0 4<br />
English 0 4 0 0 1 5<br />
French 0 1 0 0 0 1<br />
History 0 1 0 0 0 1<br />
Mass Media Art 0 3 3 2 2 10<br />
Political Science 0 9 1 1 0 11<br />
Sociology and Anthropology 0 8 2 0 0 10<br />
Spanish 0 2 4 0 0 6<br />
Theatre Arts 0 3 0 0 0 3<br />
Urban Studies 0 1 1 0 0 2<br />
TOTAL (BA) 0 56 12 5 3 76<br />
BM Music 0 1 0 0 0 1<br />
TOTAL (BM) 0 1 0 0 0 1<br />
BS Biology 0 7 1 1 0 9<br />
Chemistry 0 2 0 0 1 3<br />
Environmental Science 0 5 0 0 1 6<br />
Graphic Communications 0 2 3 1 0 6<br />
Health Education 0 12 0 1 0 13<br />
Ma<strong>the</strong>matics 0 2 0 0 0 2<br />
Nutrition and Food Science 0 2 0 0 0 2<br />
Nursing 0 7 0 0 0 7<br />
Psychology 0 3 0 0 0 3<br />
Speech/language Pathology 0 0 0 0 1 1<br />
TOTAL (BS) 0 42 4 3 3 52<br />
BSW Social Work 0 9 1 1 1 12<br />
TOTAL (BSW) 0 9 1 1 1 12<br />
41
DEGREES CONFERRED BY ETHNIC ORIGIN, COLLEGE/SCHOOL AND MAJOR,<br />
ACADEMIC YEAR <strong>2005</strong>-06<br />
ETHNIC ORIGIN<br />
DEGREE MAJOR Asian Black Hispanic White O<strong>the</strong>r TOTAL<br />
MA English Composition & Rhetoric 1 2 0 0 1 4<br />
Special Education 0 1 0 0 0 1<br />
TOTAL (MA) 1 3 0 0 1 5<br />
MS Cancer Biology, Prevention & Control 0 2 0 0 0 2<br />
Clinical Psychology 0 0 1 0 0 1<br />
Counseling 0 6 2 0 0 1<br />
Speech/Language Pathology-Clinical 0 4 0 0 2 6<br />
TOTAL (MS) 0 12 3 0 2 17<br />
MST Ma<strong>the</strong>matics 0 2 0 0 0 2<br />
TOTAL (MST) 0 2 0 0 0 2<br />
COLLEGE TOTAL 4 222 26 15 14 281<br />
SCHOOL OF BUSINESS AND PUBLIC ADMINISTRATION<br />
AAS Administrative Office Management 0 5 0 0 0 5<br />
Business Technology 3 15 0 0 0 18<br />
Computer Accounting Technology 0 0 0 0 1 1<br />
Hospitality Management & Tourism 0 5 0 0 0 5<br />
Legal Assistant 0 3 0 1 0 4<br />
TOTAL (AAS) 3 28 0 1 1 33<br />
BA (Computer Science) Information System 2 13 0 0 0 15<br />
Economics 1 14 1 0 2 18<br />
TOTAL (BA) 3 27 1 0 2 33<br />
BBA Accounting 3 22 1 5 1 32<br />
Business Management 2 36 2 6 6 52<br />
Finance 2 10 0 2 1 15<br />
Marketing 0 4 0 0 3 7<br />
Procurement & Public Contracting 0 4 0 0 0 4<br />
TOTAL (BBA) 7 76 3 13 11 110<br />
BS Office Administration 0 1 0 1 0 2<br />
TOTAL (BS) 0 1 0 1 0 2<br />
MBA Business Administration 0 7 0 0 0 7<br />
TOTAL (MBA) 0 7 0 0 0 7<br />
MPA Public Management 0 10 0 1 1 12<br />
TOTAL (MPA) 0 10 0 1 1 12<br />
SCHOOL TOTAL (13) (149) (4) (16) (15) (197)<br />
42
DEGREES CONFERRED BY ETHNIC ORIGIN, COLLEGE/SCHOOL AND MAJOR,<br />
ACADEMIC YEAR <strong>2005</strong>-06<br />
ETHNIC ORIGIN<br />
DEGREE MAJOR Asian Black Hispanic White O<strong>the</strong>r TOTAL<br />
SCHOOL OF ENGINEERING AND APPLIED SCIENCES<br />
AAS Architectural Engineering Technology 0 2 1 1 1 5<br />
Aviation Maintenance Technology 0 3 0 1 0 4<br />
Computer Science Technology 2 2 1 2 0 7<br />
Electronics Engineering Technology 0 2 0 1 0 3<br />
Fire Science 0 2 0 0 0 2<br />
TOTAL (AAS) 2 11 2 5 1 21<br />
BA Applied Computer Science 3 10 1 1 1 16<br />
TOTAL (BA) 3 10 1 1 1 16<br />
BARC Architecture 0 1 0 0 0 1<br />
TOTAL (BARC) 0 1 0 0 0 1<br />
BS Architecture 0 3 0 0 0 3<br />
Airway Science 0 0 0 1 0 1<br />
Computer Science 3 7 0 9 2 21<br />
Construction Engineering Technology 0 1 0 0 0 1<br />
Civil Engineering 0 1 1 0 0 2<br />
Electrical Engineering 1 7 0 12 0 20<br />
Fire Science Administration 0 3 0 0 1 4<br />
Information Technology 1 0 1 0 0 2<br />
Mechanical Engineering 0 2 0 1 0 3<br />
TOTAL (BS) 5 24 2 23 3 57<br />
SCHOOL TOTAL (10) (46) (5) (29) (5) (95)<br />
UNIVERSITY TOTAL 27 417 35 60 34 573<br />
Source: Office <strong>of</strong> Institutional Research, Assessment and Planning. Report # AAO3041X – Graduating Class <strong>2006</strong>, 6/09/06.<br />
43
DEGREES CONFERRED BY GENDER, COLLEGE/SCHOOL AND MAJOR,<br />
ACADEMIC YEAR <strong>2005</strong>-06<br />
GENDER<br />
DEGREE MAJOR FEMALE MALE TOTAL<br />
COLLEGE OF ARTS AND SCIENCES<br />
AA Graphic Design 4 2 6<br />
Child Development & Nursery School Education 27 0 27<br />
Music 0 1 1<br />
TOTAL (AA) 31 3 34<br />
AAS Corrections Administration 1 0 1<br />
Graphic Communications Technology 1 0 1<br />
Law Enforcement 6 4 10<br />
Medical Radiography 14 10 24<br />
Mortuary Science 6 0 6<br />
Nursing 12 2 14<br />
Respiratory Therapy 15 7 22<br />
Water Quality and Marine Science 3 1 4<br />
TOTAL (AAS) 58 24 82<br />
BA Administration <strong>of</strong> Justice 9 2 11<br />
Art 3 3 6<br />
Early Childhood Education 6 0 6<br />
Elementary Education 4 0 4<br />
English 4 1 5<br />
French 0 1 1<br />
History 1 0 1<br />
Mass Media Art 6 4 10<br />
Political Science 4 7 11<br />
Sociology and Anthropology 6 4 10<br />
Spanish 4 2 6<br />
Theatre Arts 1 2 3<br />
Urban Studies 1 1 2<br />
TOTAL (BA) 49 27 76<br />
BM Music 1 0 1<br />
TOTAL (BM) 1 0 1<br />
BS Biology 6 3 9<br />
Chemistry 3 0 3<br />
Environmental Science 4 2 6<br />
Graphic Communications 5 1 6<br />
Health Education 10 3 13<br />
Ma<strong>the</strong>matics 1 1 2<br />
Nutrition and Food Science 1 1 2<br />
Nursing 7 0 7<br />
Psychology 3 0 3<br />
Speech/language Pathology 1 0 1<br />
TOTAL (BS) 41 11 52<br />
BSW Social Work 10 2 12<br />
TOTAL (BSW) 10 2 12<br />
44
DEGREES CONFERRED BY GENDER, COLLEGE/SCHOOL AND MAJOR,<br />
ACADEMIC YEAR <strong>2005</strong>-06<br />
GENDER<br />
DEGREE MAJOR FEMALE MALE TOTAL<br />
COLLEGE OF ARTS AND SCIENCES<br />
MA English Composition & Rhetoric 2 2 4<br />
Special Education 1 0 1<br />
TOTAL (MA) 3 2 5<br />
MS Cancer Biology, Prevention & Control 1 1 2<br />
Clinical Psychology 1 0 1<br />
Counseling 6 2 8<br />
Speech/Language Pathology-Clinical 6 0 6<br />
TOTAL (MS) 14 3 17<br />
MST Ma<strong>the</strong>matics 1 1 2<br />
TOTAL (MST) 1 1 2<br />
COLLEGE TOTAL 208 73 281<br />
SCHOOL OF BUSINESS AND PUBLIC ADMINISTRATION<br />
AAS Administrative Office Management 5 0 5<br />
Business Technology 13 5 18<br />
Computer Accounting Technology 0 1 1<br />
Hospitality Management & Tourism 5 0 5<br />
Legal Assistant 3 1 4<br />
TOTAL (AAS) 26 7 33<br />
BA (Computer Science) Information Systems 11 4 15<br />
Economics 9 9 18<br />
TOTAL (BA) 20 13 33<br />
BBA Accounting 15 17 32<br />
Business Management 37 15 52<br />
Finance 10 5 15<br />
Marketing 6 1 7<br />
Procurement & Public Contracting 4 0 4<br />
TOTAL (BBA) 72 38 110<br />
BS Office Administration 2 0 2<br />
TOTAL (BS) 2 0 2<br />
MBA Business Administration 3 4 7<br />
TOTAL (MBA) 3 4 7<br />
MPA Public Management 7 5 12<br />
TOTAL (MPA) 7 5 12<br />
SCHOOL TOTAL 130 67 197<br />
45
DEGREES CONFERRED BY GENDER, COLLEGE/SCHOOL AND MAJOR<br />
ACADEMIC YEAR <strong>2005</strong>-06<br />
GENDER<br />
DEGREE MAJOR FEMALE MALE TOTAL<br />
SCHOOL OF ENGINEERING AND APPLIED SCIENCES<br />
AAS Architectural Engineering Technology 1 4 5<br />
Aviation Maintenance Technology 0 4 4<br />
Computer Science Technology 2 5 7<br />
Electronics Engineering Technology 0 3 3<br />
Fire Science 0 2 2<br />
TOTAL (AAS) 3 18 21<br />
BA Applied Computer Science 5 11 16<br />
TOTAL (BA) 5 11 16<br />
BARC Architecture 0 1 1<br />
TOTAL (BARC) 0 1 1<br />
BS Architecture 0 3 3<br />
Airway Science 0 1 1<br />
Computer Science 4 17 21<br />
Construction Engineering Technology 0 1 1<br />
Civil Engineering 1 1 2<br />
Electrical Engineering 2 18 20<br />
Fire Science Administration 1 3 4<br />
Information Technology 1 1 2<br />
Mechanical Engineering 0 3 3<br />
TOTAL (BS) 9 48 57<br />
SCHOOL TOTAL 17 78 95<br />
UNIVERSITY TOTAL 355 218 573<br />
Source: Office <strong>of</strong> Institutional Research, Assessment and Planning. Report # AAO3041X – Graduating Class <strong>2006</strong>, 6/09/06.<br />
46
DEGREES CONFERRED BY CITIZENSHIP, ETHNICITY AND GENDER<br />
ACADEMIC YEAR <strong>2005</strong>-<strong>2006</strong><br />
ETHNIC ORIGIN AND GENDER<br />
CITIZENSHIP ASIAN BLACK HISPANIC WHITE OTHER TOTAL<br />
F M F M F M F M F M<br />
Algeria 1 1<br />
Argentina 1 1<br />
Bahrain 1 1<br />
Bangladesh 1 5 6<br />
Bechuanaland 1 1<br />
Brazil 1 1<br />
Bulgaria 1 1 2<br />
Chad 5 5<br />
Congo Brazil 1 1 2<br />
Ecuador 1 1<br />
Egypt 8 17 25<br />
El Salvador 4 4<br />
Ethiopia 6 6 1 1 14<br />
France 3 3<br />
Gabon 1 1<br />
Ghana 1 3 4<br />
Guatemala 2 2<br />
Guinea 1 1 2<br />
Guyana (Guiana) 1 1 2<br />
Honduras 2 2<br />
Hungary 1 1<br />
India 2 2<br />
Indonesia 1 1 2<br />
Ivory Coast 1 1<br />
Jamaica 6 2 8<br />
Kenya 7 4 11<br />
Korea, South 1 1<br />
Lesotho 1 1<br />
Liberia 4 1 5<br />
Mali 1 3 4<br />
Morocco 2 2 4<br />
Mozambique 1 1<br />
Nepal 1 1<br />
New Foundland, Canada 1 1<br />
Niger 1 1<br />
Nigeria 14 10 24<br />
Ontario, Canada 2 2<br />
Pakistan 2 2<br />
Peru 5 5<br />
Poland 2 2<br />
Prince Edward Island, Canada 1 1<br />
Quebec, Canada 1 1<br />
47
DEGREES CONFERRED BY CITIZENSHIP, ETHNICITY AND GENDER<br />
ACADEMIC YEAR <strong>2005</strong>-<strong>2006</strong><br />
ETHNIC ORIGIN AND GENDER<br />
CITIZENSHIP ASIAN BLACK HISPANIC WHITE OTHER TOTAL<br />
F M F M F M F M F M<br />
Senegal 1 3 4<br />
Sierra Leone 2 2<br />
South Africa 1 1<br />
Spain 2 2<br />
Sudan 2 2<br />
Suriname 1 1<br />
Sweden 2 2<br />
Tanzania 1 3 4<br />
Togo 1 2 3<br />
Trinidad & Tobago 2 3 5<br />
Tunisia 1 1<br />
Turkey 1 1 2<br />
United States 1 2 152 60 2 4 14 5 8 6 254<br />
Upper Volta 2 2<br />
Vanuatu 1 1<br />
Venezuela 3 1 4<br />
West Indies Federation 1 1<br />
Zambia 1 1 2<br />
Unspecified 2 5 3 63 28 2 2 3 2 9 2 119<br />
GRADUATION TOTAL 9 18 274 143 23 11 22 12 30 31 573<br />
Source: Office <strong>of</strong> Institutional Research, Assessment and Planning. Report # AAO3041X – Graduating Class <strong>2006</strong>, 6/09/06.<br />
2 This category includes students who did not specify <strong>the</strong>ir country <strong>of</strong> citizenship.<br />
48
DEGREES CONFERRED BY ETHNIC ORIGIN: ACADEMIC YEAR <strong>2005</strong>- 06<br />
Hispanic<br />
6%<br />
White<br />
6%<br />
O<strong>the</strong>r<br />
11%<br />
Asian<br />
5%<br />
Black<br />
72%<br />
Source: Office <strong>of</strong> Institutional Research, Assessment and Planning. Report # AAO3041X – Graduating Class. 6/18/06<br />
49
DEGREES CONFERRED BY COLLEGE/SCHOOL, ACADEMIC YEAR <strong>2005</strong>-06<br />
700<br />
600<br />
573<br />
500<br />
Degrees Awarded<br />
400<br />
300<br />
200<br />
100<br />
0<br />
116<br />
281<br />
141 145<br />
College <strong>of</strong> Arts &<br />
Sciences<br />
24 33<br />
19<br />
197<br />
School <strong>of</strong> Business &<br />
Public Administartion<br />
21<br />
74<br />
0<br />
95<br />
School <strong>of</strong> Engineering<br />
& Applied Sciences<br />
170<br />
360<br />
43<br />
UDC<br />
Total<br />
Associate Baccalaureate Masters Total<br />
Source: Office <strong>of</strong> Institutional Research, Assessment and Planning. Report # AAO3041X – Graduating Class. 6/18/06<br />
50
DEGREES CONFERRED BY GENDER<br />
ACADEMIC YEAR <strong>2005</strong>-06<br />
250<br />
209<br />
200<br />
150<br />
100<br />
118<br />
151<br />
Female<br />
Male<br />
52<br />
50<br />
28<br />
15<br />
0<br />
Associate Bachelors Masters<br />
Source: Office <strong>of</strong> Institutional Research, Assessment and Planning. Report # AAO3041X – Graduating<br />
51
SECTION VII<br />
UDC FACULTY<br />
52
AVERAGE ANNUAL SALARY OF FULL-TIME INSTRUCTIONAL<br />
FACULTY BY ACADEMIC RANK AND GENDER, FALL <strong>2006</strong><br />
Average Salary<br />
Academic Rank Male Female Total<br />
Pr<strong>of</strong>essor $85,609 $86,151 $85,831<br />
Associate Pr<strong>of</strong>essor $68,698 $69,061 $68,877<br />
Assistant Pr<strong>of</strong>essor $56,328 $56,714 $56,538<br />
Instructor $50,115 $50,213 $50,152<br />
Overall $73,385 $71,684 $72,594<br />
Source: Institutional Research, Assessment and Planning. Report # AAP3073A – Full Time Faculty Salaries,<br />
9/12/06.<br />
AVERAGE ANNUAL SALARY OF FULL-TIME INSTRUCTIONAL<br />
FACULTY BY ACADEMIC RANK AND ETHNICITY, FALL <strong>2006</strong><br />
Average Salary<br />
Academic Rank Indian Asian Black Hispanic White Total<br />
Pr<strong>of</strong>essor $91,717 $87,924 $85,633 - $85,072 $85,831<br />
Associate Pr<strong>of</strong>essor - $68,259 $69,470 $66,615 $68,449 $68,877<br />
Assistant Pr<strong>of</strong>essor - $53,765 $56,604 - $56,954 $56,538<br />
Instructor - - $50,152 - - $50,152<br />
Overall $91,718 $77,286 $70,906 $66,615 $73,054 $72,594<br />
Source: Institutional Research, Assessment and Planning. Report # AAP3073A – Full Time Faculty Salaries, 09/21/<strong>2006</strong><br />
53
AVERAGE ANNUAL SALARY FULL-TIME INSTRUCTIONAL FACULTY BY ACADEMIC<br />
RANK AND GENDER, FALL <strong>2006</strong><br />
$90,000<br />
$80,000<br />
$70,000<br />
Male<br />
Female<br />
Both<br />
$60,000<br />
$50,000<br />
$40,000<br />
$30,000<br />
$20,000<br />
$10,000<br />
$0<br />
Pr<strong>of</strong>essor<br />
Assoc.<br />
Pr<strong>of</strong>essor<br />
Asst.<br />
Pr<strong>of</strong>essor<br />
Instructor<br />
Male $85,609 $68,698 $56,328 $50,115<br />
Female $86,151 $69,061 $56,714 $50,213<br />
Both $85,831 $68,877 $56,714 $50,152<br />
Source: Office <strong>of</strong> Institutional Research, Assessment and Planning. Report # AAP3073A<br />
– Full-Time Faculty Salaries, 9/12/06.<br />
54
Race<br />
Asian<br />
FULL-TIME INSTRUCTIONAL FACULTY BY ETHNICITY,<br />
RANK AND GENDER, FALL <strong>2006</strong><br />
Academic Rank<br />
Gender<br />
Total<br />
Female<br />
Male<br />
Pr<strong>of</strong>essor 5 27.8% 13 72.2% 18 100.0%<br />
Associate Pr<strong>of</strong>essor 6 37.5% 10 62.5% 16 100.0%<br />
Assistant Pr<strong>of</strong>essor 0 0.0% 2 100.0% 2 100.0%<br />
Subtotal 11 30.6% 25 69.4% 36 100.0%<br />
Black<br />
Hispanic<br />
Pr<strong>of</strong>essor 24 50.0% 24 50.0% 48 100.0%<br />
Associate Pr<strong>of</strong>essor 23 60.5% 15 39.5% 38 100.0%<br />
Assistant Pr<strong>of</strong>essor 21 61.8% 13 38.2% 34 100.0%<br />
Instructor 3 37.5% 5 62.5% 8 100.0%<br />
Subtotal 71 55.5% 57 44.5% 128 100.0%<br />
Associate Pr<strong>of</strong>essor 2 100.0% 0 0.0% 2 100.0%<br />
Subtotal 2 100.0% 0 0.0% 2 100.0%<br />
American- Pr<strong>of</strong>essor 0 0.0% 3 100.0% 3 100.0%<br />
Indian Subtotal 0 0.0% 3 100.0% 3 100.0%<br />
White<br />
Pr<strong>of</strong>essor 7 38.9% 11 61.1% 18 100.0%<br />
Associate Pr<strong>of</strong>essor 6 31.6% 13 68.4% 19 100.0%<br />
Assistant Pr<strong>of</strong>essor 3 37.5% 5 62.5% 8 100.0%<br />
Subtotal 16 35.6% 29 64.4% 45 100.0%<br />
Pr<strong>of</strong>essor 0 0.0% 1 100.0% 1 100.0%<br />
Unspecified Subtotal 0 0.0% 1 100.0% 1 100.0%<br />
ALL<br />
Pr<strong>of</strong>essor 36 40.9% 52 59.1% 88 100.0%<br />
Associate Pr<strong>of</strong>essor 37 37.5% 38 62.5% 75 100.0%<br />
Assistant Pr<strong>of</strong>essor 24 54.5% 20 45.5% 44 100.0%<br />
Instructor 3 37.5% 5 2.5% 8 100.0%<br />
Total 100 46.5% 115 53.5% 215 100.0%<br />
Source: Office <strong>of</strong> Institutional Research, Assessment and Planning. Report # AAP3073 – Full-Time Faculty Salaries, 9/21/06.<br />
55
FULL-TIME INSTRUCTIONAL FACULTY BY COLLEGE/SCHOOLS,<br />
DEPARTMENT AND GENDER, FALL <strong>2006</strong><br />
College/<br />
School<br />
Department<br />
Gender<br />
Female Male<br />
Total<br />
Business &<br />
Public Mgt.<br />
Accounting, Finance & Economics 2 16.7% 10 83.3% 12 100.0%<br />
Mgt., Marketing & Infor. System 9 47.4% 10 52.6% 19 100.0%<br />
Total 11 35.5% 20 64.5% 31 100.0%<br />
Arts & Sciences<br />
Biology & Environmental Sciences 5 33.3% 10 66.7% 15 100.0%<br />
Chemistry & Physics 2 18.2% 9 81.8% 11 100.0%<br />
Education 8 66.7% 4 33.3% 12 100.0%<br />
English 11 64.7% 6 35.3% 17 100.0%<br />
Language & Comm. Disorder 11 78.6% 3 21.4% 14 100.0%<br />
Ma<strong>the</strong>matics 7 41.2% 10 58.8% 17 100.0%<br />
Mass Media, Visual &<br />
7 46.7% 8 53.3% 15 100.0%<br />
Performance Art<br />
Nursing & Allied Health 10 71.4% 4 28.6% 14 100.0%<br />
Psychology & Counseling 3 42.9% 4 57.1% 7 100.0%<br />
Urban Affairs, Social Science &<br />
Social Work<br />
8 61.5% 5 38.5% 13 100.0%<br />
Total 72 53.3% 63 46.7% 135 100.0%<br />
David A. Clarke<br />
School <strong>of</strong> Law<br />
Law 10 58.8% 7 41.2% 17 100.0%<br />
Total 10 58.8% 7 41.2% 17 100.0%<br />
Engineering and<br />
Applied Sciences<br />
Architecture &Aerospace<br />
0 0.0% 13 100.0% 13 100.0%<br />
Technology<br />
Computer Science & Information 3 50.0% 3 50.0% 6 100.0%<br />
Technology<br />
Electrical Engineering 1 16.7% 5 83.3% 6 100.0%<br />
Total 4 16.0% 21 84.0% 25 100.0%<br />
Learning<br />
Resources<br />
Learning Resources 3 42.9% 4 57.1% 7 100.0%<br />
Total 3 42.9% 4 57.1% 7 100.0%<br />
Source: Office <strong>of</strong> Institutional Research, Assessment and Planning. Report # AAP3073 – Full-Time Faculty Salaries, 9/21/06.<br />
56
FULL-TIME INSTRUCTIONAL FACULTY BY<br />
RANK AND ETHNICITY, FALL <strong>2006</strong><br />
Rank<br />
Ethnicity<br />
Total<br />
Pr<strong>of</strong>essor Associate<br />
Pr<strong>of</strong>essor<br />
Assistant<br />
Pr<strong>of</strong>essor<br />
Instructor<br />
Count % Count % Count % Count % Count %<br />
Asian 18 (20.5%) 16 (21.3%) 2 (4.6%) 0 (0.0%) 36 (16.7%)<br />
Black 48 (54.6%) 38 (50.7%) 34 (77.3%) 8 (100.0%) 128 (59.3%)<br />
Hispanic 0 (0.0%) 2 (2.7%) 0 (0.0%) 0 (0.0%) 2 (0.9%)<br />
Indian 3 3.40.0%) 0 (0.0%) 0 (0.0%) 0 (0.0%) 3 (1.4%)<br />
White 18 (20.5%) 19 (25.3%) 8 (18.2%) 0 (0.0%) 45 (20.9%)<br />
Unspecified 1 (1.1%) 0 (0.0%) 0 (0.0%) 0 (0.0%) 1 (0.5%)<br />
Total 88 (100.0%) 75 (100.0%) 44 (100.0%) 8 (100.0%) 215(100.0%)<br />
Source: Institutional Research, Assessment and Planning. Report # AAP3073A – Full Time Faculty Salaries, 09/21/<strong>2006</strong><br />
Ethnicity<br />
FULL-TIME INSTRUCTIONAL FACULTY BY<br />
ETHNICITY AND GENDER, FALL <strong>2006</strong><br />
Gender<br />
Male Percent Female Percent<br />
Total<br />
Count Percent<br />
Asian 25 (21.7) 11 (11.0%) 36 (16.7%)<br />
Black 57 (49.6) 71 (71.0%) 128 (59.5%)<br />
Hispanic 0 (0.0) 2 (2.0%) 2 (0.9%)<br />
Indian 3 (2.6) 0 (0.0%) 3 (1.4%)<br />
White 29 (25.2) 16 (16.0%) 45 (20.9%)<br />
Not Stated 1 (0.9) 0 (0.0%) 1 (0.5%)<br />
Total 115 (100.0) 100 (100.0%) 215 (100.0%)<br />
Source: Institutional Research, Assessment and Planning. Report # AAP3073A – Full Time Faculty Salaries, 09/21/<strong>2006</strong><br />
57
FULL-TIME INSTRUCTIONAL FACULTY BY ETHNICITY<br />
AND HIGHEST DEGREE, FALL <strong>2006</strong><br />
Highest Degree<br />
Total<br />
Ethnicity<br />
Doctorate Masters<br />
Bachelors<br />
# %<br />
# %<br />
# %<br />
Asian 29 (20.4%) 6 (8.6%) 1 (33.3%) 36 (16.7%)<br />
Black 81 (57.0 %) 45 (64.3%) 2 (66.7%) 128 (59.3%)<br />
Hispanic 2 (1.4%) 0 (0.0%) 0 (0.0%) 2 (0.9%)<br />
Indian 3 (2.1%) 0 (0.0%) 0 (0.0%) 3 (1.4%)<br />
White 26 (18.3%) 19 (27.1%) 0 (0.0%) 45 (20.9%)<br />
Not Stated 1 (0.7%) 0 (0.0%) 0 (0.0%) 1 (0.5%)<br />
Total 142 (100.0%) 70 (100.0%) 3 (100.0%) 215 (100.0%)<br />
Source: Institutional Research, Assessment and Planning. Report # AAP3073A – Full Time Faculty Salaries, 09/21/<strong>2006</strong><br />
58
FULL-TIME INSTRUCTIONAL FACULTY BY<br />
AGE GROUP, FALL <strong>2006</strong><br />
Age Group<br />
Percent<br />
30-34 1.0%<br />
35-39 2.6%<br />
40-44 2.6%<br />
45-49 3.1%<br />
50-54 7.2%<br />
55-59 14.9%<br />
60-64 28.4 %<br />
65-69 26.8%<br />
70-74 10.8%<br />
75&+ 2.6%<br />
Median Age<br />
63 Years<br />
Source: Institutional Research, Assessment and Planning. Report # AAP3073A – Full- Time Faculty<br />
Salaries, 9/21/<strong>2006</strong><br />
59
FULL-TIME INSTRUCTIONAL FACULTY BY<br />
ACADEMIC RANK AND GENDER, FALL <strong>2006</strong><br />
Gender<br />
Academic<br />
Male Female Total<br />
Rank Count % Count % Count %<br />
Pr<strong>of</strong>essor 52 45.2% 36 36.0% 88 40.9%<br />
Associate<br />
38 33.0% 37 37.0% 75 34.9%<br />
Pr<strong>of</strong>essor<br />
Assistant Pr<strong>of</strong>essor 20 17.4% 24 24.0% 44 20.5%<br />
Instructor 5 4.4% 3 3.0% 8 3.7%<br />
Total 115 100% 100 100% 215 100%<br />
Source: Institutional Research, Assessment and Planning. Report # AAP3073A – Full Time Faculty Salaries, 09/21/<strong>2006</strong><br />
60
NUMBER OF FULL TIME INSTRUCTIONAL FACULTY BY<br />
HIGHEST DEGREE AND GENDER, FALL <strong>2006</strong><br />
Gender<br />
Highest<br />
Male Female Total<br />
Degree Count Percent Count Percent Count Percent<br />
Doctorate 76 66.1% 66 66.0% 142 65.9%<br />
Masters 36 31.3 34 34.0% 70 32.7%<br />
Bachelor 3 2.6 0 0.0% 3 1.4%<br />
Total 115 100.0% 100 100.0% 215 100.0%<br />
Source: Institutional Research, Assessment and Planning. Report # AAPF3022A – Full Time Faculty Salaries, <strong>2006</strong><br />
61
FULL-TIME INSTRUCTIONAL FACULTY BY LENGTH<br />
OF SERVICE, FALL <strong>2006</strong><br />
Length <strong>of</strong> Service<br />
Female Percent<br />
Gender<br />
Male Percent<br />
Total Percent<br />
less than 5 years 25 (25.0%) 23 (20.0%) 48 (22.3%)<br />
5 - 9 10 (10.0%) 9 (7.8%) 19 (8.8%)<br />
10 -14 5 (5.0%) 1 (0.9%) 6 (2.8%)<br />
15-19 4 (4.0%) 5 (4.3%) 9 (4.2%)<br />
20 - 24 5 (5.0%) 4 (3.5%) 9 (4.2%)<br />
25 - 29 5 (5.0%) 4 (3.5%) 9 (4.2%)<br />
30 - 34 13 (13.0%) 25 (21.7%) 38 (17.7%)<br />
35 - 39 32 (32.0%) 43 (37.4%) 75 (34.9%)<br />
40 &+ 1 (1.0%) 1 (0.9%) 2 (0.9%)<br />
Total 100 (100.0%) 115 (100.0%) 215 (100.0%)<br />
Median 25 33 32<br />
Source: Institutional Research, Assessment and Planning. Report # AAP3073A – Full Time Faculty Salaries, 9/21/<strong>2006</strong>.<br />
62
SECTION VIII<br />
<strong>University</strong> <strong>of</strong> <strong>the</strong> <strong>District</strong><br />
Of <strong>Columbia</strong>’s Finance<br />
Statement<br />
September 30, <strong>2006</strong> and <strong>2005</strong><br />
63
Statements <strong>of</strong> Revenues, Expenses, and Changes in Net Assets<br />
Years Ended September 30, <strong>2006</strong> and <strong>2005</strong><br />
<strong>2006</strong> <strong>2005</strong><br />
REVENUES $ $<br />
OPERATING REVENUES:<br />
Student Tuition and fees, net <strong>of</strong> scholarships and discounts<br />
Of $827,786 and $994,878 in <strong>2006</strong> and <strong>2005</strong>, respectively 14,198,885 13,151,713<br />
Federal grants and contracts 15,954,473 14,577,876<br />
Local Grants and contracts 9,869,169 9,656,074<br />
Nongovernmental grants and contracts 824,597 943,439<br />
Sales and services <strong>of</strong> educational departments 1,831,548 1,799,566<br />
Auxiliary enterprise:<br />
Athletics Division 1,036,085 915,932<br />
Child Development Center 48,145 33,120<br />
Cable Television 283,784 99,575<br />
O<strong>the</strong>r operating revenues 1,814,373 2,395,600<br />
Total Operating Revenues 45,861,059 43,572,895<br />
EXPENSES<br />
Operating Expenses:<br />
Salaries 55,792,998 51,347,772<br />
Benefits 12,297,147 10,686,819<br />
Scholarships and fellowships 8,683,459 8,178,977<br />
Contractual Services 17,345,728 10,617,342<br />
Utilities 3,722,307 3,503,636<br />
Supplies and o<strong>the</strong>r services 7,136,148 4,734,677<br />
Depreciation 5,724,350 5,350,211<br />
Total Operating Expenses 110,702,137 94,419,434<br />
Operating Loss (64,841,078) (50,846,539)<br />
NON-OPERATING REVENUES<br />
<strong>District</strong> <strong>of</strong> <strong>Columbia</strong> Appropriations 61,266,493 51,580,602<br />
Investment Income 3,425,207 3,991,351<br />
Gifts for Scholarships 541,358 677,595<br />
Total Non-Operating Revenues 65,233,058 56,249,548<br />
Income before capital appropriations 391,980 5,403,009<br />
Capital appropriations 4,181,557 5,598,743<br />
Increase in net assets 4,573,537 11,001,752<br />
NET ASSETS<br />
Net Assets, beginning <strong>of</strong> year 98,062,355 87,060,603<br />
Net Assets, end <strong>of</strong> year 102,635,892 98,062,355<br />
Source: Office <strong>of</strong> Institutional Research, Assessment and Planning. <strong>University</strong> <strong>of</strong> <strong>the</strong> <strong>District</strong> <strong>of</strong> <strong>Columbia</strong>’s Finance Office – Financial<br />
Statement and Management’s Discussion and Analysis, September 30, <strong>2006</strong> and <strong>2005</strong>. Independent Auditors Report.<br />
64
Statements <strong>of</strong> Cash Flows<br />
Years Ended September 30, <strong>2006</strong> and <strong>2005</strong><br />
$ $<br />
STATEMENTS OF CASH FLOWS <strong>2006</strong> <strong>2005</strong><br />
CASH FLOWS FROM OPERATING ACTIVITIES<br />
Tuition and Fees 14,790,691 13,047,449<br />
Grants and contracts 26,832,485 23,064,963<br />
Payments to vendors (26,543,706) (19,258,191)<br />
Payments to employees (60,013,246) (63,570,042)<br />
O<strong>the</strong>r payments (3,179,178) (3,357,549)<br />
Not cash used in operating activities (48,112,954) (50,073,369)<br />
CASH FLOWS FROM NONCAPITAL FINANCING ACTIVITIES<br />
<strong>District</strong> <strong>of</strong> <strong>Columbia</strong> appropriations 61,266,493 51,580,602<br />
Change in advances to/ (from) <strong>District</strong> 1,182,643 (1,693,677)<br />
Gifts for scholarships 541,358 677,595<br />
Net cash provided by non-capital financing activities 62,990,494 50,564,520<br />
CASH FLOWS FROM CAPITAL AND RELATED FINANCING ACTIVITIES<br />
Purchase <strong>of</strong> capital assets (1,786,112) (1,754,550)<br />
CASH FLOWS FROM INVESTING ACTIVITIES<br />
Proceeds from sales/maturities <strong>of</strong> long-term investments 6,472,099 13,220,154<br />
Interest on investments 851,967 1,143,089<br />
Purchase <strong>of</strong> investments (8,043,704) (11,475,090)<br />
Net cash (used in ) provided by investing activities (719,638) 2,888,153<br />
Net increase in cash and cash equivalents 12,371,790 1,624,754<br />
Cash and cash equivalents, beginning <strong>of</strong> year 18,033,076 16,408,322<br />
Cash and cash equivalents, end <strong>of</strong> year 30,404,866 18,033,076<br />
Source: Office <strong>of</strong> Institutional Research, Assessment and Planning. <strong>University</strong> <strong>of</strong> <strong>the</strong> <strong>District</strong> <strong>of</strong> <strong>Columbia</strong>’s Finance Office – Financial<br />
Statement and Management’s Discussion and Analysis, September 30, <strong>2006</strong> and <strong>2005</strong>. Independent Auditors Report.<br />
65
Statements <strong>of</strong> Cash Flows<br />
Years Ended September 30, <strong>2006</strong> and <strong>2005</strong><br />
$ $<br />
STATEMENTS OF CASH FLOWS <strong>2006</strong> <strong>2005</strong><br />
Reconciliation <strong>of</strong> Operating Loss to Net Cash used in<br />
Operating Activities:<br />
Operating loss (64,841,078) (50,846,539)<br />
Adjustments to reconcile operating loss to net cash<br />
used in operating activities:<br />
Depreciation 5,724,350 5,350,211<br />
Bad debt expense 53,552 439,590<br />
Change in:<br />
Accounts receivable (964,523) (663,964)<br />
Grants receivable (4,140) (2,119,652)<br />
O<strong>the</strong>r current assets 66,153 (75,878)<br />
O<strong>the</strong>r non-current assets 362,417 (250,292)<br />
Notes receivable 272,230 -<br />
Accounts payable and accrued liabilities 8,799,149 (2,334,697)<br />
Deferred revenue 1,691,161 127,337<br />
O<strong>the</strong>r current liabilities (35,310) (287,815)<br />
Refundable advances (108,989) 115,741<br />
Accrued annual leave 872,074 472,589<br />
Net cash used in operating activities (48,112,954) (50,073,369)<br />
NON-CASH CAPITAL TRANSACTIONS<br />
Loss on disposal <strong>of</strong> capital assets 124,174 44,133<br />
Capital contributions 4,181,557 5,598,743<br />
Source: Office <strong>of</strong> Institutional Research, Assessment and Planning. <strong>University</strong> <strong>of</strong> <strong>the</strong> <strong>District</strong> <strong>of</strong> <strong>Columbia</strong>’s Finance Office – Financial<br />
Statement and Management’s Discussion and Analysis, September 30, <strong>2006</strong> and <strong>2005</strong>. Independent Auditors Report.<br />
66