

Sri Lanka - Institut de statistique de l'Unesco
Sri Lanka - Institut de statistique de l'Unesco
Sri Lanka - Institut de statistique de l'Unesco

Create successful ePaper yourself
Turn your PDF publications into a flip-book with our unique Google optimized e-Paper software.
Out-of-School Children in <strong>Sri</strong> <strong>Lanka</strong>: Country Study<br />
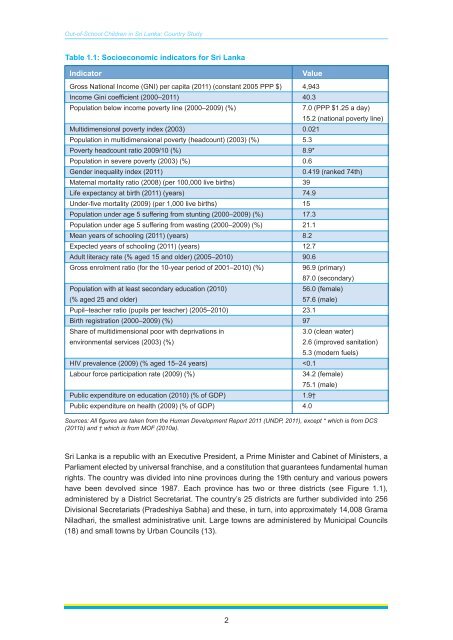
Table 1.1: Socioeconomic indicators for <strong>Sri</strong> <strong>Lanka</strong><br />
Indicator<br />
Value<br />
Gross National Income (GNI) per capita (2011) (constant 2005 PPP $) 4,943<br />
Income Gini coefficient (2000–2011) 40.3<br />
Population below income poverty line (2000–2009) (%)<br />
7.0 (PPP $1.25 a day)<br />
15.2 (national poverty line)<br />
Multidimensional poverty in<strong>de</strong>x (2003) 0.021<br />
Population in multidimensional poverty (headcount) (2003) (%) 5.3<br />
Poverty headcount ratio 2009/10 (%) 8.9*<br />
Population in severe poverty (2003) (%) 0.6<br />
Gen<strong>de</strong>r inequality in<strong>de</strong>x (2011)<br />
0.419 (ranked 74th)<br />
Maternal mortality ratio (2008) (per 100,000 live births) 39<br />
Life expectancy at birth (2011) (years) 74.9<br />
Un<strong>de</strong>r-five mortality (2009) (per 1,000 live births) 15<br />
Population un<strong>de</strong>r age 5 suffering from stunting (2000–2009) (%) 17.3<br />
Population un<strong>de</strong>r age 5 suffering from wasting (2000–2009) (%) 21.1<br />
Mean years of schooling (2011) (years) 8.2<br />
Expected years of schooling (2011) (years) 12.7<br />
Adult literacy rate (% aged 15 and ol<strong>de</strong>r) (2005–2010) 90.6<br />
Gross enrolment ratio (for the 10-year period of 2001–2010) (%)<br />
96.9 (primary)<br />
87.0 (secondary)<br />
Population with at least secondary education (2010)<br />
56.0 (female)<br />
(% aged 25 and ol<strong>de</strong>r) 57.6 (male)<br />
Pupil–teacher ratio (pupils per teacher) (2005–2010) 23.1<br />
Birth registration (2000–2009) (%) 97<br />
Share of multidimensional poor with <strong>de</strong>privations in<br />
3.0 (clean water)<br />
environmental services (2003) (%)<br />
2.6 (improved sanitation)<br />
5.3 (mo<strong>de</strong>rn fuels)<br />
HIV prevalence (2009) (% aged 15–24 years)


