Hazards, Disasters And Your Community - United Nations ...
Hazards, Disasters And Your Community - United Nations ...
Hazards, Disasters And Your Community - United Nations ...

You also want an ePaper? Increase the reach of your titles
YUMPU automatically turns print PDFs into web optimized ePapers that Google loves.
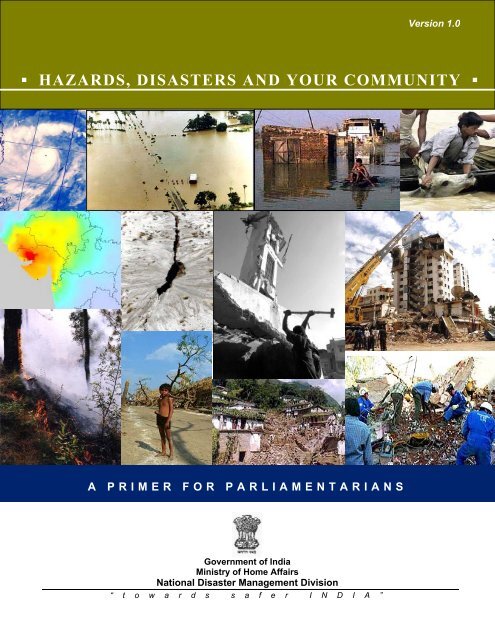
Version 1.0<br />
▪ HAZARDS, DISASTERS AND YOUR COMMUNITY ▪<br />
A PRIMER FOR PARLIAMENTARIANS<br />
Government of India<br />
Ministry of Home Affairs<br />
National Disaster Management Division<br />
“ t o w a r d s s a f e r I N D I A ”
▪ HAZARDS, DISASTERS AND YOUR COMMUNITY ▪<br />
VERSION 1.0<br />
A PRIMER FOR PARLIAMENTARIANS<br />
Published by National Disaster Management Division, Ministry of Home Affairs, Government of<br />
India<br />
“ t o w a r d s s a f e r I N D I A ” 2
This document is prepared by Prof Anand S Arya, Anup Karanth<br />
and Ankush Agarwal under the GoI-UNDP Disaster Risk Management Programme<br />
“ t o w a r d s s a f e r I N D I A ” 3
CONTENTS<br />
CHAPTER 1 HAZARDS AND DISASTERS 5<br />
CHAPTER 2 EARTHQUAKES HAZARDS AND DISASTERS 9<br />
CHAPTER 3 TSUNAMI HAZARDS AND DISASTERS 14<br />
CHAPTER 4 LANDSLIDE HAZARDS AND DISASTERS 18<br />
CHAPTER 5 CYCLONE HAZARDS AND DISASTERS 24<br />
CHAPTER 6 FLOOD HAZARDS AND DISASTERS 31<br />
CHAPTER 7 DROUGHT HAZARDS AND DISASTERS 36<br />
CHAPTER 8 FOREST FIRE HAZARDS AND DISASTERS 39<br />
CHAPTER 9 CHEMICAL AND INDUSTRIAL ACCIDENTS 44<br />
CHAPTER 10 OTHER TYPES OF NATURAL HAZARDS AND DISASTERS 46<br />
CHAPTER 11 EFFECTS OF NATURAL HAZARD ON ECONOMY & DEVELOPMENT 51<br />
CHAPTER 12 ROLE OF POLICY MAKERS IN DISASTER RISK REDUCTION 55<br />
ANNEX A<br />
DISASTER MANAGEMENT – INSTITUTIONAL ARRANGEMENTS IN<br />
INDIA<br />
57<br />
ANNEX B LIST OF RESOURCE INSTITUTIONS 60<br />
“ t o w a r d s s a f e r I N D I A ” 4
CHAPTER 1<br />
HAZARDS AND DISASTERS<br />
WHAT IS A HAZARD? HOW IS IT CLASSIFIED?<br />
A dangerous condition or events that threaten or have the potential for causing injury to life or damage to<br />
property or the environment. They can be categorized in various ways but, based on the origin, hazards<br />
worldwide are basically grouped in two broad headings:<br />
1. Natural <strong>Hazards</strong> (hazards with meteorological, geological or even biological origin)<br />
2. Unnatural <strong>Hazards</strong> (hazards with human-caused or technological origin)<br />
It is also important to know that natural phenomena are extreme climatological, hydrological, or<br />
geological, processes that do not pose any threat to persons or property. A massive earthquake in an<br />
unpopulated area, for example, is a natural phenomenon, not a hazard. It is when these natural<br />
phenomena interact with the man made environment or fragile areas which causes wide spread damage.<br />
WHAT ARE DISASTERS?<br />
Almost everyday we witness in the newspaper or on the TV, there are reports of disasters around the<br />
world. So what are disasters? How are they different from accidents? Disaster is defined as:<br />
",,,,,a serious disruption of the functioning of a society, causing widespread human, material, or<br />
environmental losses which exceed the ability of the affected society to cope using its own resources."<br />
A disaster is the product of a hazard<br />
such as earthquake, flood or<br />
windstorm coinciding with a vulnerable<br />
situation which might include<br />
communities, cities or villages. There<br />
are two main components in this<br />
definition: hazard and vulnerability.<br />
Without vulnerability or hazard there is<br />
no disaster. A disaster occurs when<br />
Vulnerability<br />
DISASTER<br />
Underlying Dynamic Unsafe<br />
Causes Pressure Conditions<br />
• Limited<br />
access to<br />
resources<br />
• Illness and<br />
disabilities<br />
• Age/sex<br />
• Poverty<br />
• ……………...<br />
• Lack of<br />
- institutions<br />
- education<br />
- training<br />
- skills<br />
• Population<br />
expansion<br />
• Urbanization<br />
• Uncontrolled<br />
development<br />
• Environmental<br />
degradation<br />
• ………………<br />
• Dangerous<br />
location<br />
• Dangerous<br />
buildings<br />
• Low income<br />
level<br />
• ……………..<br />
Hazard<br />
Trigger event<br />
Earthquake<br />
Tsunamis<br />
Floods<br />
Cyclones<br />
Volcanic eruption<br />
Drought<br />
Landslide<br />
War<br />
Technological accident<br />
Environmental pollution<br />
…………………………<br />
“ t o w a r d s s a f e r I N D I A ” 5
hazards and vulnerability meet. See the figure along with underlying issues under each.<br />
There are several important characteristics that make <strong>Disasters</strong> different from Accidents. The loss of a<br />
sole income earner in a car crash may be a disaster to a family, but only an accident to the community.<br />
Variables such as Causes, Frequency, Duration of the Impact, Speed of Onset, Scope of the Impact,<br />
Destructive Potential, Human Vulnerability etc determine the difference.<br />
WHAT IS VULNERABILITY?<br />
Vulnerability is defined as “The extent to which a community, structure, service, or geographic area is<br />
likely to be damaged or disrupted by the impact of particular hazard, on account of their nature,<br />
construction and proximity to hazardous terrain or a disaster prone area."<br />
Now take for example a house built from cane and thatch and the other a brick building. The house built<br />
from cane and thatch that can be blown in a tropical cyclone are more vulnerable to the wind than a brick<br />
building. A badly constructed brick building is more likely to disintegrate with the violent ground shaking<br />
of an earthquake than cane or thatch hut and is more vulnerable to earthquake hazard. Hence structures<br />
should be built strong enough to resist maximum force exerted by any event or for combination of event.<br />
Such measure will take care of the physical vulnerability.<br />
Social and economic conditions also determine the vulnerability of a society to an extent. It has been<br />
observed that human losses in disasters in developing countries like India tend to be high when<br />
compared to developed countries where material losses predominate.<br />
See the figure where the<br />
settlements are located in<br />
hazardous slopes. Many<br />
landslide and flooding disasters<br />
are linked to what you see in<br />
the figure below. Unchecked<br />
growth of settlements in unsafe<br />
areas exposes the people to the<br />
Unstable slope<br />
river<br />
Site<br />
river<br />
Site after pressures from population growth and urbanization<br />
hazard. In case of an earthquake or landslide the ground may fail and the houses on the top may topple<br />
or slide and affect the settlements at the lower level even if they are designed well for earthquake forces.<br />
WHAT IS RISK?<br />
Risk is a measure of the expected losses (deaths, injuries, property, economic activity etc) due to a<br />
hazard of a particular magnitude occurring in a given area over a specific time period.<br />
“ t o w a r d s s a f e r I N D I A ” 6
The figure on the right illustrates essentially the four<br />
factors essentially hazards, location, exposure, and<br />
vulnerability which contribute to risk. They are:<br />
• <strong>Hazards</strong> (physical effects generated in the naturally<br />
occurring event),<br />
• Location of the hazards relative to the community at<br />
risk,<br />
• Exposure (the value and importance of the various<br />
types of structures and lifeline systems such as watersupply,<br />
communication network, transportation network<br />
etc in the community serving the population, and<br />
• Vulnerability of the exposed structures and systems to<br />
the hazards expected to affect them during their useful life.<br />
Risk reduction can take place in two ways:<br />
1. Preparedness<br />
This protective process embraces measures which enable governments, communities and individuals to respond<br />
rapidly to disaster situations to cope with them effectively. Preparedness includes the formulation of viable<br />
emergency plans, the development of warning systems, the maintenance of inventories and the training of<br />
personnel. It may also embrace search and rescue measures as well as evacuation plans for areas that may be at<br />
risk from a recurring disaster.<br />
Preparedness therefore encompasses those measures taken before a disaster event which are aimed at minimising<br />
loss of life, disruption of critical services, and damage when the disaster occurs. All preparedness planning needs to<br />
be supported by appropriate legislation with clear allocation of responsibilities and budgetary provisions.<br />
2. Mitigation<br />
Mitigation embraces all measures taken to reduce both the effect of the hazard itself and the vulnerable conditions<br />
to it in order to reduce the scale of a future disaster. Therefore mitigation activities can be focused on the hazard<br />
itself or the elements exposed to the threat. Examples of mitigation measures which are hazard specific include<br />
modifying the occurrence of the hazard, e.g. water management in drought prone areas, avoiding the hazard by<br />
siting people away from the hazard and by strengthening structures to reduce damage when a hazard occurs.<br />
In addition to these physical measures, mitigation should also be aimed at reducing the physical, economic and<br />
social vulnerability to threats and the underlying causes for this vulnerability.<br />
DISASTER MANAGEMENT CYCLE<br />
Disaster management can be defined as the body of policy and administrative decisions and operational<br />
activities which pertain to the various stages of a disaster at all levels. Broadly disaster management can<br />
be divided into pre-disaster and post-disaster contexts. There are three key stages of activity that are<br />
taken up within disaster management. They are:<br />
“ t o w a r d s s a f e r I N D I A ” 7
1. Before a disaster strikes<br />
DISASTER MANAGEMENT<br />
(pre-disaster).<br />
Activities taken to reduce<br />
DISASTER RESPONSE (post-disaster)<br />
Emergency Response<br />
human and property losses<br />
caused by the hazard and<br />
Individual<br />
Disaster<br />
ensure that these losses are<br />
Response Response<br />
Immediate secure<br />
/ Relief<br />
also minimized when the<br />
your safety and of Immediate intervention.<br />
disaster strikes. Risk reduction<br />
others/rescue & (Search & rescue, Security,<br />
DISASTER<br />
provide first-<br />
Food, Water, Shelter &<br />
STRIKES aid/secure<br />
Sanitation, Clothes,<br />
supplies<br />
Medical & trauma care)<br />
activities are taken under this<br />
Duration: short-term<br />
Preparedness<br />
stage and they are termed as<br />
Contingency Planning/Warning<br />
mitigation and preparedness<br />
activities.<br />
2. During a disaster (disaster<br />
and Evacuation/consolidate<br />
Rehabilitation<br />
preparations for next disasters<br />
Restoration of basic<br />
services and functions.<br />
Duration: (weeks to<br />
Mitigation (Risk<br />
months)<br />
Assessment/Prevention)<br />
Hazard mapping/ Hazard and<br />
Reconstruction<br />
vulnerability assessment/<br />
occurrence).<br />
structural and non-structural<br />
Full resumption of<br />
measures<br />
services, plus preventive<br />
measures. Duration:<br />
Activities taken to ensure that<br />
(months to years)<br />
the needs and provisions of<br />
Pre-disaster: risk reduction<br />
victims are met and suffering<br />
is minimized. Activities taken<br />
under this stage are called as<br />
DISASTER MITIGATION and<br />
DISASTER PREPAREDNESS (pre-disaster)<br />
Post-disaster: recovery<br />
emergency response Reference: Are you Prepared? Learning from the Great Hanshin-Awaji Earthquake Disaster<br />
- Handbook for Disaster Reduction and Volunteer activities<br />
activities<br />
3. After a disaster (post-disaster)<br />
Activities taken to achieve early recovery and does not expose the earlier vulnerable conditions. Activities<br />
taken under this stage are called as response and recovery activities.<br />
PERSONAL AND COMMUNITY AWARENESS<br />
As Indians we need to be aware of likely hazards and potential hazards, how, when and where they are<br />
likely to occur, and the problems which may result of an event. With 60% of the land mass susceptible to<br />
seismic hazard damage (Moderate, High and Very High Zone); 40 million hectares (8%) of landmass<br />
prone to floods; 8000 Km long coastline with two cyclone seasons; 68% of the total area vulnerable to<br />
drought; Hilly regions vulnerable to avalanches/landslides/Hailstorms/cloudbursts; other Human caused<br />
hazards it is important most of all, we should be aware of how to cope with their effects.<br />
During the time of a disaster there will be delay before outside help arrives. At first, self-help is essential<br />
and depends on a prepared community – that is a community which has:<br />
• An alert, informed and actively aware population<br />
• A Preparedness and Response Plan<br />
• An active and involved local Government,<br />
• Agreed, coordinated arrangements for response, preparedness and mitigation measures.<br />
“ t o w a r d s s a f e r I N D I A ” 8
CHAPTER 2<br />
EARTHQUAKES HAZARDS AND DISASTERS<br />
ONSET TYPE AND WARNING<br />
Earthquake is a sudden onset hazard. They occur at any time of year,<br />
day or night, with sudden impact and without any warning sign.<br />
Extensive research has been conducted in recent decades but there is<br />
no accepted method of earthquake prediction as on date.<br />
Total Events: 3383<br />
Magnitudes<br />
M = 5<br />
M = 6<br />
M = 7<br />
M = 8<br />
AN<br />
EARTHQUAKE –<br />
is a series of<br />
underground shock<br />
waves and movements<br />
on the earth’s surface<br />
caused by natural<br />
processes writhing the<br />
earths crust.<br />
On January 26 2001 a<br />
devastating earthquake<br />
occurred in the Kachchh<br />
district of the state of Gujarat.<br />
The earthquake measured a<br />
magnitude of M6.9 on Richter<br />
Scale. According to official<br />
estimates, the total loss of life<br />
was 13,805 and 12, 05,198<br />
houses were damaged.<br />
ELEMENTS AT RISK<br />
Several key factors that contribute to vulnerability of human populations to earthquakes:<br />
• Location of settlements in an earthquake prone area, especially on soft ground, on area prone to<br />
landslides or along fault lines.<br />
• Dense collection of weak buildings with high occupancy.<br />
• Non-engineered buildings constructed by earth, rubble, buildings with heavy roofs (more vulnerable<br />
than light weight structures), poor quality and maintenance of buildings<br />
• Weak or flexible storey intending for parking purposes.<br />
INDIAN EARTHQUAKES<br />
The Indian subcontinent lies upon the Indian Plate. This<br />
plate is moving northward at about 5 centimetres per<br />
year and in doing so, collides with the Eurasian Plate.<br />
Upon the Eurasian Plate lie the Tibet plateau & Central<br />
Asia. Due to this collision, the Himalayas are thrust<br />
higher and very many earthquakes are generated in the<br />
process. This is the cause of earthquakes from the<br />
Himalayas to the Arakan Yoma.<br />
Figure to the left showing plot of Earthquakes (M>= 5.0) from<br />
IMD Catalogue for the period from 1800 to Sept, 2001 (Total<br />
events 3383 events).<br />
“ t o w a r d s s a f e r I N D I A ” 9
Date<br />
Location<br />
List of some significant earthquakes in India<br />
Magnitude<br />
M >6 Date Location<br />
Magnitude<br />
M >6<br />
1819 JUN 16 KUTCH,GUJARAT 8.0 1956 JUL 21 ANJAR, GUJARAT 7.0<br />
1869 JAN 10 NEAR CACHAR, ASSAM 7.5 1967 DEC 10 KOYNA, MAHARASHTRA 6.5<br />
1885 MAY 30 SOPOR, J&K 7.0 1975 JAN 19 KINNAUR, HP 6.2<br />
1897 JUN 12 SHILLONGPLATEAU 8.7 1988 AUG 06 MANIPUR-MYANMAR BORDER 6.6<br />
1905 APR 04 KANGRA, H.P 8.0 1988 AUG 21 BIHAR-NEPAL BORDER 6.4<br />
1918 JUL 08 SRIMANGAL, ASSAM 7.6 1991 OCT 20 UTTARKASHI, UP HILLS 6.6<br />
1930 JUL 02 DHUBRI, ASSAM 7.1 1993 SEP 30 LATUR-OSMANABAD,<br />
6.3<br />
MAHARASHTRA<br />
1934JAN 15 BIHAR-NEPALBORDER 8.3 1997 MAY 22 JABALPUR,MP 6.0<br />
1941 JUN 26 ANDAMAN ISLANDS 8.1 1999 MAR 29 CHAMOLI DIST, UP 6.8<br />
1943 OCT 23 ASSAM 7.2 2001 JAN 26 BHUJ , GUJARAT 6.9<br />
1950 AUG 15 ARUNACHAL PRADESH- 8.5<br />
CHINA BORDER<br />
Source: http://www.imd.ernet.in/section/seismo/static/signif.htm<br />
The same process, results in earthquakes in the <strong>And</strong>aman &<br />
Nicobar Islands. Sometimes earthquakes of different magnitudes<br />
occur within the Indian Plate, in the peninsula and in adjoining<br />
parts of the Arabian Sea or the Bay of Bengal. These arise due to<br />
localized systems of forces in the crust sometimes associated with<br />
ancient geological structures such as in the Rann of Kachchh. All<br />
earthquakes in peninsula India falls within this category.<br />
HAZARD ZONES<br />
Figure showing the Seismic Zones of India.<br />
The country is divided into four seismic<br />
Zones – II, III, IV and V<br />
(Source: IS1893 (Part 1) : 2002)<br />
As per the latest seismic<br />
zoning map of India the<br />
country is divided into<br />
four Seismic Zones.<br />
Zone V marked in red<br />
shows the area of Very<br />
High Risk Zone, Zone IV<br />
marked in orange shows<br />
the area of High Risk<br />
Zone. Zone III marked in<br />
Tectonic Map of India. Red lines showing<br />
active fault zones.<br />
(Source: www.asc-india.org)<br />
yellow shows the region of Moderate Risk Zone and Zone II<br />
marked in blue shows the region of Low risk Zone. Zone V is<br />
the most vulnerable to earthquakes, where historically some of<br />
the country's most powerful shock has occurred.<br />
Geographically this zone includes the <strong>And</strong>aman & Nicobar<br />
Islands, all of North-Eastern India, parts of north-western Bihar,<br />
eastern sections of Uttaranchal, the Kangra Valley in Himachal<br />
Pradesh, near the Srinagar area in Jammu & Kashmir and the<br />
Rann of Kutchh in Gujarat. Earthquakes with magnitudes in<br />
excess of 7.0 have occurred in these areas, and have had<br />
intensities higher than IX.<br />
Much of India lies in Zone III, where a maximum intensity of VII can be expected. New Delhi lies in Zone<br />
IV whereas Mumbai and Chennai lie in Zone III. All states and UTs across the country have experienced<br />
earthquakes.<br />
“ t o w a r d s s a f e r I N D I A ” 10
Measuring the Size of an Earthquake - MSK 64 Intensity Scale<br />
Intensity is a qualitative measure of the actual shaking at a location during an earthquake, and is notated in a roman capital<br />
numeral. The MSK (Medvedev, Sponheuer and Karnik) scale is more convenient for application in field and is widely used in<br />
India. The zoning criterion of the map is based on likely intensity. The scale range from I (least perceptive) to XII (most severe).<br />
The intensity scales are bas ed on three features of shaking – perception by people, performance o f buildings, and changes to<br />
natural surroundings.<br />
The seismic zoning map broadly classifies India into zones where one can expect earthquake shaking of the more or less the<br />
same maximum intensity. The shaking intensity associated with different zones is shown in the table below:<br />
Zone<br />
II<br />
III<br />
Area liable<br />
to shaking<br />
intensity<br />
VI (and<br />
lower)<br />
VII<br />
Description<br />
(Arrangement in paragraphs of scale as follows: i) Persons and surroundings, ii) Structures of all<br />
kinds, iii) Nature)<br />
VI Frightening<br />
i) Felt by most indoors and outdoors. Many people in buildings are frightened and run outdoors. A<br />
few persons loose their balance. Domestic animals rum out of their stalls.<br />
In many instances, dishes and glassware may break, and books fall down, pictures move, and<br />
unstable objects overturn. Heavy furniture may possibly move and small steeple bells may ring.<br />
ii) Damage of Grade 1*** is sustained in single** buildings of Type B* and in many** of Type A*.<br />
Damage in some buildings of Type A is of Grade 2***.<br />
iii) Cracks up to widths of 1cm possible in wet ground; in mountains occasional landslips: change in<br />
flow of springs and in level of well water are observed.<br />
VII Damage of Buildings<br />
i) Most people are frightened and run outdoors. Many find it difficult to stand. The vibration is noticed<br />
by persons driving motor cars. Large bells ring.<br />
ii) In many buildings of Type C* damage of Grade 1 is caused; in many buildings of Type B damage<br />
is of Grade 2. Most** buildings of Type A suffer damage of Grade 3***, few of Grade 4***. In single<br />
instances, landslides of roadway on steep slopes: crack in roads; seams of pipelines damaged;<br />
cracks in stone walls.<br />
iii) Waves are formed on water, and is made turbid by mud stirred up. Water levels in wells change,<br />
and the flow of springs changes. Some times dry springs have their flow resorted and existing<br />
springs stop flowing. In isolated instances parts of sand and gravelly banks slip off.<br />
VIII Destruction of buildings<br />
i) Fright and panic; also persons driving motor cars are disturbed, Here and there branches of trees<br />
break off. Even heavy furniture moves and partly overturns. Hanging lamps are damaged in part.<br />
ii) Most buildings of Type C suffer damage of Grade 2, and few of Grade 3, Most buildings of Type B<br />
IV VIII<br />
suffer damage of Grade 3. Most buildings of Type A suffer damage of Grade 4. Occasional breaking<br />
of pipe seams. Memorials and monuments move and twist. Tombstones overturn. Stone walls<br />
collapse.<br />
iii) Small landslips in hollows and on banked roads on steep slopes; cracks in ground up to widths of<br />
several centimeters. Water in lakes becomes turbid. New reservoirs come into existence. Dry wells<br />
refill and existing<br />
IX General damage of buildings<br />
i) General panic; considerable damage to furniture. Animals run to and fro in confusion, and cry.<br />
ii) Many buildings of Type C suffer damage of Grade 3, and a few of Grade 4. Many buildings of Type<br />
B show a damage of Grade 4 and a few of Grade 5. Many buildings of Type A suffer damage of<br />
V<br />
Grade 5. Monuments and columns fall. Considerable damage to reservoirs; underground pipes partly<br />
IX (and<br />
broken. In individual cases, railway lines are bent and roadway damaged.<br />
higher)<br />
iii) On flat land overflow of water, sand and mud is often observed. Ground cracks to widths of up to<br />
10 cm, on slopes and river banks more than 10 cm. Further more, a large number of slight cracks in<br />
ground; falls of rock, many land slides and earth flows; large waves in water. Dry wells renew their<br />
flow and existing wells dry up.<br />
X General Destruction of Buildings XI Destruction XII Landscape Changes<br />
Note: Fore more information on MSK 64 Intensity Scale refer Indian Seismic Code IS 1893 (Part 1)<br />
*a) Type of Structures (Buildings)<br />
Type A - Building in field-stone, rural structures, unburnt-brick houses, clay houses.<br />
Type B - Ordinary brick buildings, buildings of large block and prefabricated type, half timbered structures, buildings in natural hewn stone.<br />
Type C - Reinforced buildings, well built wooden structures.<br />
**b) Definition of Quantity<br />
Single Few - About 5 percent Many About 50 percent Most About 75 percent<br />
*** Classification of Damage to buildings<br />
Grade 1 Slight damage Fine cracks in plaster; fall of small pieces of plaster<br />
Grade 2 Moderate<br />
damage<br />
Small cracks in walls; fall of fairly larger pieces of plaster; pantiles slip off; cracks in chimneys parts of<br />
chimney fall down.<br />
Grade 3 Heavy damage Large and deep cracks in walls; fall of chimneys.<br />
Grade 4 Destruction Gaps in walls; parts of buildings may collapse; separate parts of the buildings lose their cohesion; and inner<br />
walls collapse.<br />
Grade 5 Total damage Total collapse of the buildings<br />
“ t o w a r d s s a f e r I N D I A ” 11
TYPICAL EFFECTS<br />
Physical Damage – damage or loss of buildings and service structures. Fires, floods due to dam failures,<br />
landslides could occur.<br />
Casualties – often high, near to the epicenter and in places where the population density is high (say,<br />
multistoried buildings) and structures are not resistant to earthquake forces.<br />
Partial collapse of non engineered building (stone<br />
masonry walls) during 1991 Uttarkashi earthquake.<br />
(Source: Earthquake Tips IITK-BMTPC)<br />
Improperly designed weak or flexible storey leads to poor<br />
performance during earthquakes. Many buildings with open<br />
ground storeys intended for parking collapsed in the Bhuj<br />
earthquake. Seen is the picture is a vertical split of a building due<br />
to collapse of a partially open ground storey building.<br />
(Source www.nicee.org Earthquake Tips IITK-BMTPC)<br />
Public health – multiple fracture injuries, moderately and severely injured is the most widespread<br />
problem, breakdown in sanitary conditions and large number of casualties could lead to epidemics.<br />
Water supply – severe problems due to failure of the water supply distribution network and storage<br />
reservoirs. Fire hydrants supply lines if vulnerable could hamper fire service operations.<br />
Transport network – severely affected due to failure of roads and bridges, railway tracks, failure of airport<br />
runways and related infrastructure.<br />
Electricity and Communication – all links affected. Transmission towers, transponders, transformers<br />
collapse.<br />
MAIN MITIGATION STRATEGIES<br />
Engineered structures (designed and built) to withstand ground shaking. Architectural and engineering<br />
inputs put together to improve building design and construction practice. Analyze soil type before<br />
construction and do not build structures on soft soil. To accommodate on weak soils adopt safety<br />
measures in design. Note: Buildings built on soft soils are more likely to get damaged even if the<br />
earthquake is not particularly strong in magnitude. Similar problem persists in the alluvial plains and<br />
conditions across the river banks. Heavy damages are concentrated when ground is soft.<br />
Good soil conditions<br />
– sharp rumbling<br />
Weak soil conditions<br />
– violent shaking<br />
Hypocenter<br />
Effect of soil type on ground shaking<br />
Essential requirements in a Masonry building<br />
“ t o w a r d s s a f e r I N D I A ” 12
Follow Indian Standard Codes for construction of buildings.<br />
Enforcement of the Byelaws including Land use control and restriction<br />
on density and heights of buildings<br />
Strengthening of important lifeline buildings which need to be<br />
functional after a disaster. Upgrade level of safety of hospital, fire<br />
service buildings etc.<br />
Public awareness, sensitization and training programmes for<br />
Architects, Builders, Contractors, Designers, Engineers, Financiers,<br />
Government functionaries, House owners, Masons etc.<br />
Reduce possible damages from secondary effects such as like fire,<br />
floods, landslides etc. e.g. identify potential landslide sites and restrict<br />
construction in those areas.<br />
Indian Standard<br />
IS 1893 (Part 1):2002<br />
Criteria for Earthquake Resistant<br />
Design of Structures<br />
Part 1 General Provisions and Buildings<br />
(Fifth revision)<br />
COMMUNITY BASED MITIGATION<br />
<strong>Community</strong> preparedness along with public education is vital for<br />
mitigating the earthquake impact. Earthquake drills and Public<br />
awareness programme.<br />
<strong>Community</strong> based Earthquake Risk Management Project should be<br />
developed and sustainable programmes launched. Retrofitting of<br />
schools and important buildings, purchase of emergency response<br />
equipment and facilities, establishing proper insurance can be the<br />
June 2002<br />
Bureau of Indian Standards<br />
This Indian Standard is<br />
adopted by Bureau of Indian<br />
Standards and it gives<br />
recommendations for design<br />
criteria of structures.<br />
programmes under Earthquake Risk Management Project. A large number of local masons and<br />
engineers will be trained in disaster resistant construction techniques. A large number of masons,<br />
engineers and architects can get trained in this process.<br />
Retrofitting of School Building<br />
of Ahmedabad Municipal<br />
Corporation.<br />
This building was partly<br />
damaged during the<br />
earthquake. The school was<br />
retrofitted and is functioning.<br />
WEB RESOURCES:<br />
• www.nicee.org: Website of The National Information Center of Earthquake Engineering (NICEE) hosted at Indian Institute of<br />
Technology Kanpur (IITK) is intended to collect and maintain information resources on Earthquake Engineering and make<br />
these available to the interested professionals, researchers, academicians and others with a view to mitigate earthquake<br />
disasters in India. The host also gives IITK-BMTPC Earthquake Tips.<br />
• www.imd.ernet.in/section/seismo/static/welcome.htm Earthquake Information – India Meteorological Department, India. IMD<br />
detects and locates earthquakes and evaluates seismicity in different parts of the country.<br />
• www.bmtpc.org In order to bridge the gap between research and development and large scale application of new building<br />
material technologies, the erstwhile Ministry of Urban Development, Government of India, had established the Building<br />
Materials <strong>And</strong> Technology Promotion Council in July 1990.<br />
• www.earthquake.usgs.gov Source for science about the Earth, its natural and<br />
living resources, natural hazards, and the environment.<br />
• www.neic.cr.usgs.gov National Earthquake Information Center (NEIC) - World Data Center for Seismology Earthquake<br />
information and observation station: The site hosts one of the most comprehensive systems.<br />
• www.quake.wr.usgs.gov Earthquake Reporting Service: U.S. Geological Survey and UC Berkeley service for earthquake<br />
reporting. Earthquake basics and educational material; geological and historical information; links to professional and<br />
amateur organizations; online access to earthquake data. Current research activities and results in seismology, crystal<br />
structure and deformation, geology and borehole physics. for more<br />
• www.asc-india.org Amateur Seismic Centre is a comprehensive website carrying details of state wise seismicty for the<br />
country. This also has extensive reports on various past earthquakes with rare photographs and maps.<br />
“ t o w a r d s s a f e r I N D I A ” 13
CHAPTER 3<br />
TSUNAMI HAZARDS AND DISASTERS<br />
•<br />
TSUNAMI –<br />
is a Japanese word<br />
meaning “harbour<br />
wave”. These waves,<br />
which often affect<br />
distant shores,<br />
originate from undersea<br />
or coastal seismic<br />
activity, landslides, and<br />
volcanic eruptions.<br />
Whatever the cause,<br />
sea water is displaced<br />
with a violent motion<br />
and swells up,<br />
ultimately surging over<br />
land with great<br />
destructive power.<br />
ONSET TYPE and CAUSES<br />
If the earthquake or under water land movement is near the coast then<br />
tsunami may strike suddenly and if the earth movement is far in the sea<br />
then it may take few minutes to hours before striking the coast. The onset is<br />
extensive and often very destructive. The general causes of Tsunamis are<br />
geological movements. It is produced in three major ways. The most<br />
common of these is fault movement on the sea floor, accompanied by an<br />
earthquake. To say that an earthquake causes a tsunami is not<br />
completely correct. Rather, both earthquakes and tsunamis result from fault<br />
movements. Probably the second most common cause of tsunamis is a<br />
landslide either occurring underwater or originating above the sea and<br />
then plunging into the water. The third major cause of tsunamis is<br />
volcanic activity. The flank of a volcano, located near the shore or<br />
underwater, may be uplifted or depressed similar to the action of a fault.<br />
Or, the volcano may actually explode. In 1883, the violent explosion of<br />
the famous volcano, Krakatoa in Indonesia, produced tsunamis<br />
measuring 40 meters which crashed upon Java and Sumatra. over 36,000<br />
people lost their lives as a result of tsunami waves from Krakatoa. The<br />
giant tsunamis that are capable of crossing oceans are nearly always<br />
26th December, 2004, A<br />
massive earthquake of<br />
Magnitude 9.0 hit Indonessia<br />
generating Tsunami waves in<br />
South-east Asia & eastern<br />
coast of India. Height of<br />
tsunami waves ranged from 3<br />
– 10 m affecting a total<br />
coastal length of 2260 km in<br />
the States of <strong>And</strong>hra<br />
Pradesh, Tamil Nadu, Kerala<br />
& UTs of Pondicherry,<br />
<strong>And</strong>aman & Nicobar Islands.<br />
Tsunami waves travelled<br />
upto a depth of 3 km from the<br />
coast killing more than<br />
10,000 people & affected<br />
more than lakh of houses<br />
leaving behind a huge trail of<br />
destruction.<br />
“ t o w a r d s s a f e r I N D I A ” 14
created by movement of the sea floor associated with<br />
earthquakes which occur beneath the sea floor or near the<br />
ocean.<br />
WARNING<br />
Tsunami is not a single giant wave. It consists of ten or<br />
more waves which is termed as a “tsunami wave train”.<br />
Since scientists cannot predict when earthquakes will<br />
occur, they cannot predict exactly when a tsunami will be<br />
generated. Studies of past historical tsunamis indicate<br />
where tsunamis are most likely to be generated, their<br />
potential heights, and flooding limits at specific coastal<br />
locations. With use of satellite technology it is possible to<br />
provide nearly immediate warnings of potentially<br />
tsunamigenic earthquakes. Warning time depends upon<br />
the distance of the epicenter from the coast line. The<br />
warning includes predicted times at selected coastal<br />
communities where the tsunami cold travel in a few hours.<br />
In case of tsunamigenic earthquakes or any other<br />
geological activity people near to the coastal areas may<br />
get very little time to evacuate on receiving of warning.<br />
Note: Ground shaking signals the occurrence of the earthquake. It is important to move away from the coastal areas<br />
since a tsunami may accompany the earthquake.<br />
ELEMENTS AT RISK<br />
All structures located within 200 m of the low lying coastal area are most vulnerable to the direct impact of<br />
the tsunami waves as well as the impact of debris & boulders brought by it. Settlements in adjacent areas<br />
will be vulnerable to floods & scour. Structures constructed of wood, mud, thatch, sheets and structures<br />
without proper anchorage to foundations are liable to be damaged by tsunami waves & flooding.<br />
Other elements at risk are infrastructure facilities like ports & harbours, telephone and electricity poles,<br />
cables. Ships & fishing boats/nets near the coast also add to the destruction caused by tsunami waves.<br />
TYPICAL EFFECTS<br />
Physical damage - Local tsunami events or those less<br />
than 30 minutes from the source cause the majority of<br />
damage. The force of can raze everything in its path. It is<br />
the flooding effect of a tsunami, however, that most greatly<br />
effects human settlements by water damage to homes and<br />
businesses, roads, bridges and other infrastructure. Ships,<br />
port facilities, boats/trawlers, fishing nets also get<br />
damaged.<br />
Tsunami wave train formation: Seen in the figure is<br />
the rupture in the seafloor shunted in the vertical<br />
direction. This movement displaces hundreds of<br />
cubic kilometres of the overlaying water, generating<br />
a massive tsunami, or sea surge.<br />
Environmental damage - There is evidence of ever<br />
increasing impact upon the environment on account of the<br />
effects of tsunamis. The range varies from generation of<br />
tonnes of debris on account of structural collapse of<br />
weaker buildings, release of toxic chemicals into the<br />
environment on account of chemical leak/spillage/process<br />
failure/utility breakages/ collateral hazards and negative<br />
impact on the already fragile ecosystems.<br />
Men walk pass damaged fishing trawlers hit by a<br />
tsunami at Nagapattinam port<br />
Casualties and public health: Deaths occur principally from drowning as water inundates homes or<br />
neighborhoods. Many people may be washed out to sea or crushed by the giant waves. There may be some<br />
injuries from battering by debris and wounds may become contaminated.<br />
“ t o w a r d s s a f e r I N D I A ” 15
Water supply: sewage pipes may be damaged causing major sewage disposal problems. Drinking water<br />
shortage arises due to breakage of water mains and contamination. Open wells and ground water may<br />
become unfit for drinking due to contamination of salt water and debris.<br />
Standing Crops and food supplies: flooding by tsunami causes damage to the standing crops and also to the<br />
food supplies in the storage facilities. The land may be rendered infertile due to salt water incursion from the<br />
sea.<br />
An aerial view of a bridge destroyed by tsunamis near<br />
Pondicherry, in the southern Indian state of Tamil Nadu.<br />
An aerial view of Pattinapakam, a slum which was<br />
destroyed by a tsunami, near Madras.<br />
SPECIFIC PREPAREDNESS MEASURES<br />
Hazard mapping – a hazard map should be prepared with designated areas expected to be damaged by<br />
flooding by tsunami waves. Historical data could be of help ion showing areas inundated in the past.<br />
Keeping in mind the vulnerable areas, evacuation routes should be constructed and mapped. The plan<br />
should be followed by evacuation drill.<br />
Early warning systems – a well networked system in place can warn the communities of the coastal<br />
areas when the threat is perceived. Tsunami warning should be disseminated to local, state, national as<br />
well as the international community so as to be prepared as they are capable of crossing across<br />
continents. The information can be broadcasted to the local emergency officers and the general public.<br />
On receiving of the warning the action should be to evacuate the place as decided in the evacuation plan.<br />
<strong>Community</strong> Preparedness – communities in the coastal areas are faced by the wrath of cyclones, storm<br />
surge and tsunami waves. It is important that the community is better prepared to take suitable actions on<br />
receiving of the threat and follow emergency evacuation plans and procedures. a community which<br />
choose to ignore warning may get severely effected if<br />
they are not prepared to take immediate measures.<br />
MAIN MITIGATION STRATEGIES<br />
Site Planning and Land Management- Within the<br />
broader framework of a comprehensive plan, site<br />
planning determines the location, configuration, and<br />
density of development on particular sites and is,<br />
therefore, an important tool in reducing tsunami risk.<br />
• The designation and zoning of tsunami hazard<br />
areas for such open-space uses as agriculture,<br />
parks and recreation, or natural hazard areas is<br />
recommended as the first land use planning<br />
strategy. This strategy is designed to keep<br />
development at a minimum in hazard areas.<br />
• In areas where it is not feasible to restrict land to<br />
Bad siting - A view of a village that was destroyed by a<br />
tsunami at Kolachal, in Tamil Nadu<br />
“ t o w a r d s s a f e r I N D I A ” 16
open-space uses, other land use planning measures can be used. These include strategically<br />
controlling the type of development and uses allowed in hazard areas, and avoiding high-value and<br />
high-occupancy uses to the greatest degree possible.<br />
• The capital improvement planning and budgeting process can be used to reinforce land use planning<br />
policies.<br />
Engineering structures – As most of the structures<br />
along the coast area comprises of fisherman<br />
LOWEST HORIZONTAL<br />
STRUCTURAL<br />
community, which are constructed of light weight<br />
MEMBER LOCATED<br />
ABOVE 100- YEAR<br />
materials without any engineering inputs. Therefore<br />
WAVE CREST<br />
there is an urgent need to educate the community<br />
ELEVATION<br />
about the good construction practices that they should<br />
adopt such as:<br />
LATERAL BRACING<br />
• Site selection – Avoid building or living in buildings<br />
HORIZONTAL<br />
within several hundred feet of the coastline as<br />
MEMBER<br />
DEEP<br />
PERPENDICULAR<br />
these areas are more likely to experience damage<br />
PROTECTED<br />
TO WAVE CREST<br />
LILES<br />
from tsunamis.<br />
• Construct the structure on a higher ground level<br />
with respect to mean sea level.<br />
Design Solution to Tsunami effect<br />
• Elevate coastal homes: Most tsunami waves are<br />
less than 3 meters in height. Elevating house will help reduce damage to property from most<br />
tsunamis. Structural columns resist the impact while other walls are expendable. It is important to also<br />
take note that adequate measures are also brought into the design to cater for earthquake forces.<br />
• Construction of water breakers to reduce the velocity of waves.<br />
• Use of water & corrosion resistant materials for construction.<br />
• Construction of community halls at higher locations, which can act as shelters at the time of a<br />
disaster.<br />
Flood management - Flooding will result from a tsunami. Tsunami waves will flood the coastal areas.<br />
Flood mitigation measures could be incorporated (see section on floods for additional information).<br />
Building barriers or buffers such as special breakwaters or seawalls can be an effective risk reduction<br />
measure against gushing waters in case of Tsunami/Storm surge during cyclones.<br />
Source: Part.1 Geologic <strong>Hazards</strong> – Tsunamis, INTRODUCTION TO HAZARDS, 3 rd Edition DMTP 1997<br />
WEB RESOURCES:<br />
• http://ioc.unesco.org/itsu/ IOC/UNESCO International Coordination group for the Tsunami Warning System in<br />
the Pacific (ICG/ITSU), Paris, France<br />
• http://quake.usgs.gov/tsunami/ Tsunamis and Earthquakes, USGS, USA<br />
• www.asc-india.org Amateur Seismic Centre is a comprehensive website carrying details of state wise seismicity<br />
for the country. This also has extensive reports on various past Earthquakes/Tsunamis.<br />
• http://www.prh.noaa.gov/pr/itic/ International Tsunami Information Center, Honolulu, Hawaii<br />
• http://www.tsunami.org/ Pacific Tsunami Museum site. Includes answers to frequently asked questions, links,<br />
and information related to Pacific Ocean tsunamis.<br />
“ t o w a r d s s a f e r I N D I A ” 17
CHAPTER 4<br />
LANDSLIDE HAZARDS AND DISASTERS<br />
LANDSLIDES –<br />
are slippery masses of<br />
rock, earth or debris which<br />
move by force of their own<br />
weight down mountain<br />
slopes or river banks<br />
In the picture:<br />
(Top)House wrecked in landslide -<br />
Twenty-five residents of a private<br />
building in the heart of the Shimla<br />
town had a miraculous escape when<br />
a major portion of house collapsed<br />
following a landslide. The landslide<br />
was triggered by haphazard cutting<br />
of the hill below it for construction of<br />
a hotel.<br />
(Bottom Left): The Varunavat<br />
mountain rising on the edge of<br />
Uttarkashi town. Huge cracks on its<br />
side have set off several landslides.<br />
A building in danger of being buried.<br />
(Bottom Right): A building partly<br />
buried under rocks and other debris.<br />
ONSET TYPE and WARNING<br />
Though they occur gradually, however sudden failure (sliding) can occur without warning. They may take<br />
place in combination with earthquakes, floods and volcanoes. There are no clearly established warnings<br />
in place indicating occurrence of landslide and hence difficult to predict the actual occurrence. Areas of<br />
high risk can be determined by use of information on geology, hydrology, vegetation cover, past<br />
occurrence and consequences in the region.<br />
CAUSES OF LANDSLIDES<br />
Geological Weak material: weathered materials, jointed or fissured materials, contrast in permeability<br />
and contrast in stiffness (stiff, dense material over plastic materials).<br />
Erosion: Wave erosion of slope toe, glacial erosion of slope toe, subterranean erosion (Deposition<br />
loading slope or its crest, Vegetation removal.<br />
Intense rainfall: Storms that produce intense rainfall for periods as short as several hours or have a<br />
more moderate intensity lasting several days have triggered abundant landslides.<br />
“ t o w a r d s s a f e r I N D I A ” 18
Bhachau Landslide - The land slipped during the 26 th<br />
January 2001 earthquake event in Bhachau. Note<br />
people are still camped beneath. Monsoon rains could<br />
possibly wash the soil downslope.<br />
ELEMENTS AT RISK<br />
The most common elements at risk are the settlements<br />
built on the steep slopes, built at the toe and those built<br />
at the mouth of the streams emerging from the<br />
mountain valley. All those buildings constructed without<br />
appropriate foundation for a given soil and in sloppy<br />
areas are also at risk. Roads, communication line and<br />
buried utilities are vulnerable.<br />
Human Excavation of slope and its toe,<br />
Loading of slope/toe, draw down in reservoir,<br />
mining, deforestation, irrigation, vibration/blast,<br />
Water leakage from services.<br />
Earthquake shaking has triggered landslides in<br />
many different topographic and geologic<br />
settings. Rock falls, soil slides and rockslides<br />
from steep slopes involving relatively thin or<br />
shallow dis-aggregated soils or rock, or both<br />
have been the most abundant types of<br />
landslides triggered by historical earthquakes.<br />
Volcanic eruption Deposition of loose volcanic<br />
ash on hillsides commonly is followed by<br />
accelerated erosion and frequent mud or debris<br />
flows triggered by intense rainfall.<br />
Elements at risk<br />
Toe<br />
Slip surface<br />
Head<br />
INDIAN LANDSLIDES<br />
Landslide constitute a major natural hazard in our<br />
country, which accounts for considerable loss of life<br />
and damage to communication routes, human<br />
settlements, agricultural fields and forest lands. The<br />
Indian subcontinent, with diverse physiographic,<br />
seismotectonic and climatological conditions is<br />
subjected to varying degree of landslide hazards; the<br />
Himalayas including Northeastern mountains ranges<br />
being the worst affected, followed by a section of<br />
Western Ghats and the Vindhyas. Removal of<br />
vegetation and toe erosion have also triggered slides<br />
Torrential monsoon on the vegetation cover removed<br />
slopes was the main causative factors in the<br />
Peninsular India namely in Western Ghat and Nilgiris.<br />
Human intervention by way of slope modification has<br />
added to this effect.<br />
H eave<br />
Red spot on the map<br />
show major landslides<br />
HAZARD ZONES<br />
The Landslide Hazard Zonation Map of India is<br />
produced in the next page. The Landslide Map needs<br />
to be popularized among the architects, engineers and<br />
development planners and also to the public so that it<br />
is used as a tool for regulating construction or<br />
development activities and means of managing or<br />
mitigating landslide disasters.<br />
(Source: www.csre.iitb.ac.in)<br />
Spots showing major landslides in India<br />
“ t o w a r d s s a f e r I N D I A ” 19
Figure showing Landslide Hazard Zonation Map of India<br />
Note: Fore more information refer Landslide Hazard<br />
Zonation Atlas of India (with reflections on some of the Major<br />
Landslides of India), published jointly by Building Materials<br />
and Technology Promotion Council – New Delhi & Centre<br />
for Disaster Mitigation and Management - Chennai.<br />
Zone Significance of Landslides<br />
The four point hazard scale of the Landslide Zones are – (1) Severe to<br />
Very High, (2) High, (3) Moderate to low, (4) Unlikely, was considered<br />
adequate. The zonal significance is given below:<br />
Zone Significance<br />
Severe to<br />
Very High<br />
High<br />
Moderate<br />
to Low<br />
Unlikely<br />
The area is well known for the danger of landslides, and<br />
for the perennial threat to life and property. Restrictions<br />
on all new constructions and adoption of improved land<br />
use and management practices deserve to be<br />
encouraged. Investments on landslide remediation<br />
measures, on public education and on early warning<br />
systems are strongly indicated.<br />
This is a zone in which landslides have occurred in the<br />
past and are already to be expected in the future. New<br />
constructions in this zone should be strictly regulated<br />
and construction should be done only after proper site<br />
investigation and implementation of appropriate<br />
remedial package. Before the new construction projects<br />
are cleared in this zone, environment impact<br />
assessment should be made mandatory.<br />
Engineered and well-regulated new construction<br />
activities and well-planned agricultural practices could<br />
be permitted. All construction activities should however<br />
be based on technically evaluated and certified plans by<br />
established institutions and authorized consultants.<br />
No visible sign of slope instability are seen in this zone<br />
in the present stage of knowledge. No blanket<br />
restriction needs to be imposed on various land use<br />
practices provided they confirm to the prevailing<br />
building regulations and bye-laws. Location specific<br />
limitations may become necessary for high-density<br />
urban areas.<br />
Snow covered areas<br />
Major Landslides of India<br />
Date/Year Location Damage<br />
1867 and 1880 Nainital,<br />
Uttaranchal<br />
There have been two major landslides on the Sher-ka-Danda slope in Nainital. The<br />
1180 landslide took place on account of rainfall and an earth tremor. A large portion of<br />
the range and the buildings were swept away in minutes. He slide permanently filled a<br />
1913 to 1993 NH 1A, from<br />
Jammu to Srinagar<br />
at km 138, J&K<br />
Almost annual NH 1A, Jammu-<br />
feature<br />
1957, July 1966<br />
and 1972<br />
Srinagar Highway.<br />
Gangtok-Siliguri<br />
road, Sikkim<br />
portion of the Naini lake.<br />
It is a old and notorious landslide. Nashri landslide causes disruptions and blockage of<br />
the road several times in the same year, requiring urgent action. Often many vehicles<br />
and equipments are buried in the huge debris generated.<br />
Almost every year landslides occur at the Khuni Nallah site destroying vital bridges and<br />
disrupting the traffic and the communication system.<br />
The seimicity of the area and the rainfall both are the triggering factors of this slide. An<br />
average rainfall of about 3000mm is common in the slide area. The slope uphill of the<br />
road is a complex landform.<br />
September 1968 Himachal Pradesh Active Maling slide- 1km of road and a bridge washed out<br />
July 1968 Garhwal Himalaya Active Kaliasaur slide- continuous damage to road<br />
July 1970 Alaknanda,<br />
Uttaranchal<br />
Landslide dam broke, huge boulders were thrown far and wide causing wide spread<br />
damage. There were numerous landslides in the region, besides reactivating the old<br />
ones.<br />
December 1982<br />
January 1982<br />
Himachal Pradesh<br />
Nashri, J&K<br />
Near Solding nallah 3 bridges & 1.5km length of road washed away<br />
Active slide from 1953. Every year road and communication network is damaged.<br />
September 1985 Hardwar-Badrinath<br />
Road<br />
First time in 1920, then in 1952, 1963, 1964, 1965 and a major landslide in 1969, 1970,<br />
1971, 1972 and Sept 1985 and so on. The Kaliasaur Landslide is the most persistent<br />
and regular occurring Landslide.<br />
March 1989 Himachal Pradesh Nathpa, 500m road section is frequently damaged during successive year<br />
October 1990 Nilgris 36 people killed and several injured. Several buildings and communication network<br />
damaged<br />
July 1991 Assam 300 people killed, road and buildings damaged, Millions of rupees<br />
November 1992 Nilgiris Road network and buildings damaged, Rs.5 million damage estimate<br />
June 1993 Aizawal Four persons were buried<br />
“ t o w a r d s s a f e r I N D I A ” 20
July 1993 Itanagar Arunachal 25 people buried alive 2 km road damaged<br />
Pradesh<br />
August 1993 Kalimpong, West 40 people killed, heavy loss of property<br />
Bengal<br />
August 1993 Kohima, Nagaland 200 houses destroyed, 500 people died, about5km road stretch was damaged<br />
November 1993 Nilgris, Tamil Nadu Occurrence of Landslide is widespread in Nilgiris. During 1993, about 408 landslides<br />
occurred of which Marapplam is the severest in terms of loss and magnitude. 40<br />
people killed, property worth several lakhs damaged<br />
June 1994 Varundh Ghat, 20 people killed, breaching of ghat road damaged to the extent of 1km. At several<br />
Konkan Coast places<br />
May 1995 Aizwal Mizoram 25 people killed road severely damaged<br />
June 1995 Malori Jammu 6 persons killed, NH 1A damaged<br />
January 1994 Kashmir National Highway 1A severely damaged<br />
September 1995 Kullu, HP 22 persons killed and several injured about 1 km road destroyed<br />
14 August 1998 Okhimath 69 people killed<br />
18 August 1998 Malpa, Kali river 210 people killed. The heap of debris created were about 15m high. The village was<br />
wiped out in the event.<br />
The Malpa village as on 17 August 1998, a few hours<br />
before the rock avalanche wiped out the village<br />
around 0300hours on the 18 August, 1998.<br />
The two pictures were taken from the same location<br />
upstream of Kali River. They provide a direct<br />
comparison of scenarios before and after the event.<br />
9 Nov 2001 Amboori, Kerala This landslide caused the death of 38 persons and inflicted damage to houses. A large<br />
numbr of huge sized boulders, some of them weighing 5 to 10 tonnes rolled down<br />
during the slide.<br />
Landslide in Kerala<br />
In the Kerala part of the Western Ghats<br />
several types of mass movements /landslides<br />
have been recorded. The most prevalent,<br />
recurring and disastrous type of mass<br />
movements noted in Kerala are the "debris<br />
flows". The swift and sudden down slope<br />
movement of highly water saturated<br />
overburden containing a varied assemblage<br />
of debris material ranging in size from soil<br />
particles to huge boulders destroying and<br />
carrying with it every thing that is lying in its<br />
path. Note the boulder movement along the<br />
path.<br />
(Source: www.gisdevelopment.net)<br />
TYPICAL EFFECTS<br />
Physical Damage: Landslides destroy anything that comes in their path. They block or bury roads, lines<br />
of communication, settlements, river flow, agricultural land, etc. It also includes loss to agricultural<br />
production and land area. In addition physical effects such as flooding may also occur.<br />
“ t o w a r d s s a f e r I N D I A ” 21
Casualties: They cause maximum fatalities depending on the place and time of occurrence. Catastrophic<br />
landsides have killed many thousands of persons, such as the debris slide on the slopes of Huascaran in<br />
Peru triggered by an earthquake in 1970, which killed over 18,000 people.<br />
MAIN MITIGATION STRATEGIES<br />
Hazard mapping will locate areas prone to slope failures. This will permit to identify avoidance of areas<br />
for building settlements. These maps will serve as a tool for mitigation planning.<br />
Land use practices such as:<br />
• Areas covered by degraded natural vegetation in upper slopes are to be afforested with suitable<br />
species. Existing patches of natural vegetation (forest and natural grass land) in good condition,<br />
should be preserved<br />
• Any developmental activity initiated in the area should be taken up only after a detailed study of the<br />
region and slope protection should be carried out if necessary.<br />
• In construction of roads, irrigation canals etc. proper care is to be taken to avoid blockage of natural<br />
drainage<br />
• Total avoidance of settlement in the risk zone should be made mandatory.<br />
• Relocate settlements and infrastructure that fall in the possible path of the landslide<br />
• No construction of buildings in areas beyond a certain degree of slope.<br />
Retaining Walls can be built to stop land from slipping<br />
(these walls are commonly seen along roads in hill<br />
stations). It’s constructed to prevent smaller sized and<br />
secondary landslides that often occur along the toe portion<br />
of the larger landslides.<br />
Surface Drainage Control Works. The surface drainage<br />
control works are implemented to control the movement of<br />
landslides accompanied by infiltration of rain water and<br />
spring flows.<br />
Engineered structures with strong foundations can<br />
withstand or take the ground movement forces.<br />
Underground installations (pipes, cables, etc.) should be<br />
made flexible to move in order to withstand forces caused<br />
by the landslide<br />
Increasing vegetation cover is the cheapest and most effective way<br />
of arresting landslides. This helps to bind the top layer of the soil with<br />
layers below, while preventing excessive run-off and soil erosion.<br />
Insurance will assist individuals whose homes are likely to be<br />
damaged by landslides or by any other natural hazards. For new<br />
constructions it should include standards for selection of the site as<br />
well as construction technique.<br />
Source: http://www.geoengineer.org/photos/reearth1.jpg<br />
Retaining wall - Reinforced wall constructed<br />
as a mitigation measure.<br />
COMMUNITY BASED MITIGATION<br />
The most damaging landslides are often related to human intervention<br />
such as construction of roads, housing and other infrastructure in<br />
vulnerable slopes and regions. Other community based activities that<br />
can mitigate landslides are education and awareness generation<br />
among the communities, establishing community based monitoring,<br />
timely warning and evacuation system.<br />
Communities can play a vital role in identifying the areas where there is<br />
land instability. Compacting ground locally, slope stabilization<br />
(procedures such as terracing and tree planting may reduce damages<br />
to some extent), and avoiding construction of houses in hazardous<br />
locations are something that the community has to agree and adhere<br />
to avoid damage from the possible landslides. This would also reduce<br />
Source: www.tuat.ac.jp/~sabo/lj/ljap4.htm<br />
Surface drain ditch.<br />
“ t o w a r d s s a f e r I N D I A ” 22
the burden of shifting of settlements from hazardous slopes and rebuild in safe site as it is less practical<br />
to do in large scale.<br />
DEBRIS FLOWS OR MUDSLIES<br />
Fast-moving flows of mud and rock, called debris flows or mudslides, are among the most numerous and<br />
dangerous types of landslides in the world. They are particularly dangerous to life and property because of their<br />
high speeds and the sheer destructive force of their flow.<br />
Hazardous Areas Debris flows start on steep slopes-slopes steep enough to make walking difficult. Once started,<br />
however, debris flows can travel even over gently sloping ground. The most hazardous areas are canyon bottoms,<br />
stream channels, areas near the outlets of canyons, and slopes excavated for buildings and roads.<br />
A<br />
B<br />
C<br />
D<br />
A: Canyon bottoms, stream channels, and areas near the outlets of canyons or channels are particularly hazardous.<br />
Multiple debris flows that start high in canyons commonly funnel into channels. There, they merge, gain volume,<br />
and travel long distances from their sources.<br />
B: Debris flows commonly begin in swales (depressions) on steep slopes, making areas downslope from swales<br />
particularly hazardous.<br />
C: Roadcuts and other altered or excavated areas of slopes are particularly susceptible to debris flows. Debris flows<br />
and other landslides onto roadways are common during rainstorms, and often occur during milder rainfall conditions<br />
than those needed for debris flows on natural slopes.<br />
D: Areas where surface runoff is channeled, such as along roadways and below culverts, are common sites of<br />
debris flows and other landslides.<br />
(Source: http://geohazards.cr.usgs.gov/factsheets/html_files/debrisflow/fs176-97.html)<br />
WEB RESOURCES:<br />
• http://www.csre.iitb.ac.in/rn/resume/landslide/lsl.htm Landslide Information System - Center of Studies in<br />
Resource Engineering IIT Mumbai.<br />
• http://landslides.usgs.gov USGS National Landslide <strong>Hazards</strong> Program (NLHP)<br />
• http://www.fema.gov/hazards/landslides/landslif.shtm Federal Emergency Management Agency FEMA, USA is<br />
tasked with responding to, planning for, recovering from and mitigating against disasters.<br />
• http://ilrg.gndci.pg.cnr.it/ The International Landslide Research Group (ILRG) is an informal group of individuals<br />
concerned about mass earth movement and interested in sharing information on landslide research.<br />
“ t o w a r d s s a f e r I N D I A ” 23
CHAPTER 5<br />
CYCLONE HAZARDS AND DISASTERS<br />
ONSET TYPE<br />
They strike suddenly although it takes time to build up. They can be tracked<br />
on the development but accurate landfall is predictable barely few hours.<br />
The onset is extensive and often very destructive.<br />
WARNING<br />
Low pressure and the development can be detected hours or days before its<br />
damage effects start. Satellite tracking can track the movement since the<br />
build up and the likely path is projected. Warning and evacuation is done<br />
along the projected path. It is difficult to predict the accuracy. Accurate<br />
landfall predictions can give only a few hours' notice to threatened<br />
populations. In addition, people generally opt to wait until the very last<br />
minute before abandoning their home and possessions. Deaths from<br />
drowning in the high tides and sudden flooding and material losses are<br />
therefore often very high.<br />
The India Meteorological Department (IMD) issues warning against severe<br />
weather phenomena like tropical cyclones, heavy rains and snow, cold and<br />
heat waves, etc., which cause destruction of life and property. Cyclone<br />
warning is disseminated by several means such as satellite based disaster<br />
CYCLONES –<br />
a violent storm,<br />
often of vast extent,<br />
characterized by<br />
high winds rotating<br />
about a calm center<br />
of low atmospheric<br />
pressure. This<br />
center moves<br />
onward, often with a<br />
velocity of 50km an<br />
hour.<br />
29 th October 1999, Supercyclone<br />
with winds 260-300<br />
km/hour hit the 140 km coast<br />
of Orissa with a storm surge<br />
that created the Bay-of-<br />
Bengal water level 9 metres<br />
higher than normal. The<br />
super storm traveled more<br />
than 250 km inland and<br />
within a period of 36 hrs<br />
ravaged more than 200 lakh<br />
hectares of land, devouring<br />
trees and vegetation, leaving<br />
behind a huge trail of<br />
destruction. The violent<br />
cyclone was merciless and<br />
giant, broke the backbone of<br />
Orissa state and killed<br />
thousands and devastated<br />
millions.<br />
In the picture: Destruction<br />
caused by the 1999 Orissa<br />
supercyclone.<br />
“ t o w a r d s s a f e r I N D I A ” 24
warning systems, radio, television, telephone, fax, high<br />
priority telegram, public announcements and bulletins in<br />
press. Advancement in Information Technology in the form<br />
of Internet, Geograhical Information System (GIS), Remote<br />
Sensing, Satellite communication, etc. can help a great<br />
deal in planning and implementation of hazards reduction<br />
schemes.<br />
ELEMENTS AT RISK<br />
All lightweight structures and those built of mud, wood,<br />
older buildings with weak walls and structures without<br />
proper anchorage to the foundations will be at great risk.<br />
Settlements located in low lying coastal areas will be<br />
vulnerable to the direst effects of the cyclones such as<br />
wind, rain and storm surge. Settlements in adjacent areas<br />
will be vulnerable to floods, mudslides or landslides due to<br />
heavy rains. Other elements at risk are fences, telephone<br />
& electricity poles, cables, light elements of structures –<br />
roofs, signboards, hoardings, coconut crowns, fishing<br />
boats & large trees.<br />
A helicopter turned turtle at the Bhubaneshwar<br />
airport during the cyclonic storm of 1999.<br />
TYPICAL EFFECTS<br />
First, in a sudden, brief onslaught, high winds cause major<br />
damage to infrastructure and housing, in particular fragile<br />
constructions. They are generally followed by heavy rains<br />
and floods and, in flat coastal areas by storm surge riding<br />
on tidal waves and inundating the land over long distances<br />
of even upto 15km inland..<br />
Physical damage – structures will be damaged or<br />
destroyed by the wind force, flooding and storm surge.<br />
Light pitched roofs of most structures especially the ones<br />
fitted on to industrial buildings will suffer severe damage.<br />
A bridge destroyed by the high-velocity winds<br />
and floods during the cyclone.<br />
Casualties and public heath – caused by flooding and flying elements, contamination of water supplies<br />
may lead to viral outbreaks, diarrhea, and malaria.<br />
Water supplies – Ground and piped water supply may get contaminated by flood waters<br />
Crops and food supplies – high winds and rains will ruin the standing crop and food stock lying in low<br />
lying areas. Plantation type crops such as banana and coconut are extremely vulnerable. Salt from the<br />
sea water may be deposited on the agricultural land and increase the salinity. The loss of the crop may<br />
lead to acute food shortage.<br />
Communication – severe disruption in the communication links as the wind may bring down the electricity<br />
and communication towers, electricity and telephone poles, telephone lines, antennas and satellite disk<br />
and broadcasting services. Transport lines (road and rail) may be curtailed. Relief materials may not<br />
reach the affected site.<br />
INDIAN CYCLONES<br />
The coastal areas are subjected to severe wind storms and cyclonic storms. A full-grown cyclone is a<br />
violent whirl in the atmosphere 150 to 1000 km across, 10 to 15 km high. Gale winds of 150 to 250 kmph<br />
or more spiral around the center of very low pressure area. Torrential rains, occasional thunder and<br />
lightning flashes - join these under an overcast black canopy. Through these churned chaotic sea and<br />
atmosphere, the cyclone moves 300 to 500 km, in a day to hit or skirt along a coast, bringing with it storm<br />
surges as high as 3 to 12 metres, as if splashing a part of the sea sometimes up to 30 km inland leaving<br />
behind death and destructions. A storm surge is the sudden abnormal rise in the sea level caused by<br />
cyclone. The sea water flows across the coast as well as inland and then recedes back to the sea. Great<br />
loss of life and property takes place in the process.<br />
“ t o w a r d s s a f e r I N D I A ” 25
East Coast: Cyclones affect both the Bay of Bengal and the Arabian Sea. They are rare in Bay of Bengal<br />
from January to March. Isolated ones forming in the South Bay of Bengal move west north westwards<br />
and hit Tamil Nadu and Sri Lanka coasts. In April and May, these form in the South and adjoining Central<br />
Bay and move initially northwest, north and then recurve to the northeast striking the Arakan coasts in<br />
April and <strong>And</strong>hra-Orissa-West Bengal-Bangla desh coasts in May. Most of the monsoon (June -<br />
September) storms develop in the central and in the North Bay and move west-north-westwards affecting<br />
<strong>And</strong>hra-Orissa-West Bengal coasts. Post monsoon (October-December) storms form mostly in the south<br />
and the central Bay, recurve between 15 O and 18 O N affecting Tamil Nadu-<strong>And</strong>hra Orissa-West Bengal-<br />
Bangladesh coasts.<br />
West Coast: Cyclones do not form in Arabian Sea during the months of January, February and March<br />
and are rare in April, July, August and September. They generally form in southeast Arabian Sea and<br />
adjoining central Arabian Sea in the months of May, October, November and December and in east<br />
central Arabian Sea in the month of June. Some of the cyclones that originate in the Bay of Bengal travel<br />
across the peninsula, weaken and emerge into Arabian Sea as low pressure areas. These may again<br />
intensify into cyclonic storms. Most of the storms in Arabian Sea move in west-north-westerly direction<br />
towards Arabian Coast in the month of May and in a northerly direction towards Gujarat Coast in the<br />
month of June. In other months, they generally move northwest north and then recurve northeast<br />
affecting Gujarat-Maharashtra coasts; a few, however, also move west north westwards towards Arabian<br />
coast.<br />
The criteria followed by the Meteorological Department of India to classify the low pressure<br />
systems in the Bay of Bengal and in the Arabian Sea as adopted by the World Meteorological<br />
Organisation (WMO) are:<br />
Associated wind speed in the Circulation<br />
Types of Disturbances<br />
1. Low Pressure Area<br />
2. Depression<br />
3. Deep Depression<br />
4. Cyclonic Storm<br />
5. Severe Cyclonic Storm<br />
6. Very Severe Cyclonic Storm<br />
7. Super Cyclonic Storm<br />
(1 knot = 1.85 km/hr)<br />
Less than 17 knots ( < 31 kmph)<br />
17 to 27 knots ( 31 to 49 kmph)<br />
28 to 33 knots ( 50 to 61 kmph)<br />
34 to 47 knots ( 62 to 88 kmph)<br />
48 to 63 knots ( 89 to 118 kmph)<br />
64 to 119 knots ( 119 to 221 kmph)<br />
120 knots and above ( 222 kmph and above)<br />
HAZARD ZONES<br />
The wind zone map illustrates the area<br />
vulnerable to high wind speeds. The macro-level<br />
wind speed zones of India have been formulated<br />
and published in IS 875 (Part-3) – 1987. There<br />
are six basic wind speeds considered for zoning,<br />
namely:<br />
55m/s (198km/hr) Very High Damage Risk Zone-A<br />
50m/s (180 km/hr) Very High Damage Risk Zone-B<br />
47m/s (169.2 km/hr) High Damage Risk Zone<br />
44m/s (158.4 km/hr) Moderate Damage Risk Zone-A<br />
39m/s (140.4 km/hr) Moderate Damage Risk Zone-B<br />
33m/s (118.8 km/hr) Low Damage Risk Zone<br />
The cyclone affected areas of the country are<br />
classified in 50 and 55m/s zones. It is known<br />
that in certain events, the wind gusts could<br />
appreciably exceed the given basic wind speeds.<br />
For design of structures and classification of<br />
vulnerability and risk to buildings, the above<br />
macro-level zoning is considered as sufficient.<br />
Basic<br />
wind<br />
speed<br />
(m/s)<br />
Color<br />
Scheme<br />
Surge prone coasts of India<br />
Storm surge heights depend on the intensity of<br />
the cyclone, i.e., very high-pressure gradient and<br />
Wind Speed Zones of India bsed on IS: 875 (Part 3) Code<br />
“ t o w a r d s s a f e r I N D I A ” 26
consequent very strong winds and the topography of seabed near the point where a cyclone crosses the<br />
coast. Sea level also rises due to astronomical high tide. Elevation of the total sea level increases when<br />
peak surge occurs at the time of high tide. Vulnerability to storm surges is not uniform along Indian<br />
coasts.<br />
The following segments of the East Coast of India are most vulnerable to high surges:<br />
• North Orissa, and West Bengal coasts.<br />
• <strong>And</strong>hra Pradesh coast between Ongole and Machilipatnam.<br />
• Tamil Nadu coast, south of Nagapatnam.<br />
The West Coast of India is less vulnerable to storm surges than the east coast of India in terms of both<br />
the height of storm surge as well as frequency of occurrence. However, the following segments are<br />
vulnerable to significant surges:<br />
• Maharashtra coast, north of Harnai and adjoining south Gujarat coast and the coastal belt<br />
around the Gulf of Bombay.<br />
• The coastal belt around the Gulf of Kutch.<br />
Date and Year<br />
Brief History of Most Intense Cyclones (in particular from 1970 to 2001)<br />
Damage<br />
Observed/<br />
Estimated<br />
Max. Wind<br />
After<br />
Landfall<br />
Over the Arabian Sea<br />
Oct 19-24, 1975 180 Kmph 85 people died in the districts of Junagadh. Jamnager and Rajkot of Gujarat state. This<br />
Cyclone caused considerable damage to property (estimated to be about Rs. 75 Crores)<br />
May 31 - June 5,<br />
1976<br />
167 Kmph This Cyclone Caused damege to property which was estimated to be about Rs. 3 Crore. 4<br />
Burges each. Containing Rs. 5 Lakh and 6 fishing boats were swept away. Mehsana,<br />
Bhavnagar, Kaira, Panchmahal, Rajkot and Broach districts of Gujarat State were most<br />
affected areas.<br />
Nov 13-23, 1977 167 Kmph Kerala and Laccadives were most affected areas due to this storm people killed. 72 .House<br />
damaged - 8400 and 620 fishing Vessels damaged in Kerala coast. Total loss was estimated<br />
to be about Rs 10 crores.<br />
Nov 5-13, 1978 278 Kmph Gujarat Cyclone Damage to property reported<br />
Oct 28 -<br />
Nov3,1981<br />
120 Kmph Junagadh, Rajkot and Jamnagar of Gujarat state were most affected areas, Total loss of<br />
damage to property was estimated to be about Rs. 52 Crores.<br />
Nov 4-9, 1982 N/A Saurastra Coast of Gujarat about 45 km east of Veraval was attected very much by this<br />
storm. 507 people died and 1.5 lakh livestock perished.<br />
Nov 4-9, 1982 93 Kmph 50 fisher men were reported missing in Gujarat Coast.<br />
June 17-20, 1996 111 Kmph 19 Districts of Gujarat State were affected 33 people died. 27964 pucca houses were<br />
destroyed total estimated loss was Rs.1803.52 lakh.<br />
Oct 23-28, 1996 111 Kmph Severe Cyclonic Storm over the Arabian sea. As the system did not cross the coast. No<br />
significant damage was reported.<br />
June 4-10, 1998 167 Kmph Gujarat & Rajasthan states were affected ** Porbanderof Gujarat state was the most affected<br />
areas. Loss incurred due to storm was estimated to be about Rs.1855.38 Crores in Kandla.<br />
May 16-22, 1999 195 Kmph This system caused severe damage in Kutch and Jamnagar district of Gujarat 453 people<br />
died. Loss of property estimated to about Rs. 80 Cr in Rajasthan one person died and 5104<br />
cattle heads perished. 5133 houses were partially damaged.<br />
Over the Bay of Bengal<br />
Oct 1942 225 kmph Over 10,000 people perished in the cyclone that hit Midnapore on October 14-15, 1942,<br />
during World War-II.<br />
Nov 8-13, 1970 224 Kmph Bangladesh Cyclone of which crossed Bangladesh coast in the night of 12th was one of the<br />
worst in recent times, with storm surges of 4 to 5 metres height at the time of high tides, and<br />
with 25 cm of rain in the areas, the inundation took toll of about 3,00,000 people.<br />
Oct 26-31, 1971 185 Kmph Balasore (Orissa) 10,000 people died and 1 million people rendered homeless<br />
Nov 14-20, 1977 259 Kmph <strong>And</strong>hra Cyclone that crossed coast near Nizampatnam in the evening of 19th, took a toll of<br />
about 8,547 lives. The Ship Jagatswamini, which went right into the eye of the storm in the<br />
evening of 17th experienced maximum wind speed of 194 kmph. As the storm approached<br />
the coast, gale winds reaching 200 kmph lashed Prakasam Guntur, Krishna, East and West<br />
Godavari districts. Storm surge of 5 meters high inundated Krishna estuary and the coasts<br />
south of Machilipatnam.<br />
Nov 9-14, 1984 213 Kmph Sri Harikota (A.P.)604 people died<br />
Nov 24-30, 1988 213 Kmph 2000 people died. 6000 people missing in Bangladesh<br />
Nov 1-9, 1989 235 Kmph Kavali (A.P.)69 people died<br />
May 4-9, 1990 235 Kmph Machalipatnam 967 people died.<br />
“ t o w a r d s s a f e r I N D I A ” 27
Apr 25-30, 1991 235 Kmph Bangladesh 1,38,882 people died. 1,39,054 people injured<br />
Apr24-May2, 1994 215 Kmph Bangladesh 184 people killed<br />
May 15-19, 1997 230 Kmph Teknaf Bangladesh, 155 people died. 9663 people injured<br />
June 5 - 9, 1998 167 Kmph Kandla Cyclone. 1680 people died<br />
May 16-22, 1999 195 Kmph Arabian Sea (crossed Sind coast of Pakistan). 454 people died and 5104 cattle heads<br />
perished in India.<br />
Oct 15-19, 1999 170 Kmph Gopalpur Cyclone – Orissa 198 people died, 402 persons injured.<br />
Oct 25-29, 1999 260 Kmph The Orissa SuperCyclone causec heavy destruction to coastal districts of Orissa. 9887<br />
people died. 129.22 lakh people affected.<br />
Nov 26-30 , 2000 189 kmph Two states viz., Tamil Nadu and Pondicherry were mainly affected by this storm.The loss is<br />
mainly due to crop damage. Uprooting of big trees and partial damages to more than one<br />
thousand kuchha houses. 30,000, Plantain trees and 50,000 Plantain saplings got destroyed<br />
and 30,000 trees were Uprooted in Tamil Nadu state. In Pondicherry two persons lost their<br />
lives Damage to paddy Crops plantains, Coconut Plantation were the major loss in<br />
Pondicherry.<br />
Dec 23-28, 2000 167 Kmph Three districts of Tamil Nadu state were affected by this storm in the Ramnathanpuram<br />
district, 350 houses were damaged in thirunelveli. Houses damaged - 318. In Tutocorin<br />
houses damaged-318, Fishing boats, lost - 95, loss to crops - 281 hectares paddy crops<br />
destroyed, plaintain- 650 hectares and betal 80 hectares .<br />
POTENTIAL FOR REDUCING HAZARD<br />
Coastal belt plantation (green belt plantation along the coastal line in a scientific interweaving pattern)<br />
can reduce the effect of the hazard. Providing a cover through green belt sustains less damage. Forests<br />
act as a wide buffer zone against strong winds and flash floods. Without the forest the cyclone travel<br />
freely inland. The lack of protective forest cover allows water to inundate large areas and cause<br />
destruction. With the loss of the forest cover each consecutive cyclone can penetrate further inland.<br />
Flood protection measures can be taken to reduce the impact of flood hazards.<br />
MAIN MITIGATION STRATEGIES<br />
Hazard mapping – Meteorological records of the wind<br />
speed and the directions give the probability of the<br />
winds in the region. Cyclones can be predicted several<br />
days in advance. The onset is extensive and often very<br />
destructive. Past records and paths can give the<br />
pattern of occurrence for particular wind speeds. A<br />
hazard map will illustrate the areas vulnerable to the<br />
cyclone in any given year. It will be useful to estimate<br />
the severity of the cyclone and various damage<br />
intensities in the region. The map is prepared with data<br />
inputs of past climatological records, history of wind<br />
speed, frequency of flooding etc.<br />
Land use control designed so that least critical<br />
activities are placed in vulnerable areas. Location of<br />
settlements in the flood plains is at utmost risk. Siting of<br />
key facilities must be marked in the land use. Policies<br />
should be in place to regulate land use and<br />
enforcement of building codes. Vulnerable areas<br />
should be kept for parks, grazing or play grounds.<br />
Engineered structures – structures need to be built to<br />
withstand wind forces. Good site selection is also<br />
important. Majority of the buildings in coastal areas are<br />
built with locally available materials and have no<br />
engineering inputs. Good construction practice should<br />
be adopted such as:<br />
- Cyclonic wind storms inundate the coastal areas. It is<br />
advised to construct on stilts or on earth mound.<br />
- Houses can be strengthened to resist wind and flood<br />
damage. All elements holding the structures need to be<br />
<strong>And</strong>hra Pradesh state wind and cyclone zone<br />
A shelter with special feature to withstand cyclones<br />
and floods. Traditional homes can be improved by<br />
building in disaster resistant features. Such homes<br />
could withstand cyclones with moderate speeds.<br />
“ t o w a r d s s a f e r I N D I A ” 28
properly anchored to resist the uplift or flying off of the objects. For example, avoid large overhangs of roofs,<br />
and the projections should be tied down.<br />
- A row of planted trees will act as a shield. It reduces the energy.<br />
- Buildings should be wind and water resistant.<br />
- Buildings storing food supplies must be protected against the winds and water.<br />
- Protect river embankments. Communication lines should be installed underground.<br />
- Provide strong halls for community shelter in vulnerable locations.<br />
Construction at ground level –risk of inundation<br />
If natural elevation is not available construction<br />
on stilts or on artificially raised earth mounds<br />
Tie<br />
Large overhangs get lifted and broken.<br />
Avoid large overhangs and use ties.<br />
Flood management – Flooding will result from a cyclonic storm. Storm surge will flood the coastal areas.<br />
Heavy rains will bring in flash floods. There are possibilities of landslides too. Flood mitigation measures<br />
could be incorporated (see section on floods for additional information).<br />
Improving vegetation cover – improvement of the vegetation will increase water infiltaration capacity of<br />
the soil. The roots of the plants and trees will keep the soil<br />
intact and prevent erosion and slow runoff to prevent or<br />
lessen flooding. The use of tree planted in rows will act as a<br />
windbreak. Coastal shelterbelt plantations can be<br />
developed to break severe wind speeds. It minimizes<br />
devastating effects. The Orissa calamity has also<br />
highlighted the need for urgent measures like shelterbelt<br />
plantation along cyclone-prone coastal areas. Species<br />
chosen for this purpose should not only be able to withstand<br />
the impact of strong cyclonic winds, but also check soil<br />
erosion.<br />
COMMUNITY BASED MITIGATION<br />
Coastal Shelterbelt Plantation Programme<br />
Construction of cyclone resistant houses and strengthening The adverse impact of the super cyclone in the<br />
of existing houses can be done through community coastal districts of Orissa, has drawn attention to<br />
participation. Local engineers and masons can take part in the need to take up, on an emergency basis,<br />
the construction of the buildings in their area and shelterbelt plantations. It is proposed to afforest<br />
the coastal areas in the country with suitable tree<br />
demonstrate to the people about disaster resistant species to form a shelterbelt, under the<br />
construction methods. Construction of multipurpose cyclone Integrated Afforestation & Eco-Development<br />
shelters in the vulnerable locations are desirable. During Project Scheme (IAEPS). The proposed<br />
normal time these buildings can be used as schools or as shelterbelt along the coastline will mitigate the<br />
impact of strong cyclonic winds and thus check<br />
community centres. In case of cyclones or floods,<br />
soil erosion and inward sand drift, thereby<br />
community can take shelter in these designed buildings. protecting cultivated fields, houses and<br />
The local communities will be responsible for the homesteads adjoining the coasts.<br />
maintenance and management of these community Picture showing Restoration of land: Plantation<br />
shelters. Protection measures need to be taken for the over reclaimed (back filled) area.<br />
“ t o w a r d s s a f e r I N D I A ” 29
livestock, the boats, fishing nets, household items and other possessions.<br />
Other activities that can be taken up as part of the community based mitigation are construction of saline<br />
embankments for protection against sea water ingress, reforestation, conservation of green belt areas<br />
and participating in coastal shelterbelt plantation programme.<br />
<strong>Community</strong> based mitigation activities relating to floods can also be taken up (for more details on<br />
community based mitigation on floods, refer the flood section for additional information).<br />
WEB RESOURCES:<br />
• www.imd.ernet.in Indian Meteorological Department (IMD) provides all India weather report, end of monsoon season<br />
report, weather charts, satellite images, rainfall maps, earthquake reports and severe weather warnings. IMD provides<br />
cyclone warnings from the Area Cyclone Warning Centres (ACWCs) It has developed the necessary infrastructure to<br />
originate and disseminate the cyclone warnings at appropriate levels. It has made operational a satellite based<br />
communication system called Cyclone Warning Dissemination System for direct dissemination of cyclone warnings to the<br />
cyclone prone coastal areas.<br />
• www.ndmindia.nic.in Natural Disaster Management India. Provides current news on Flood, Drought and Cyclones, Weather<br />
Links from NIC and weather conditions/temperatures on Indian Ocean (www.weather.nic.in).<br />
• www.bmtpc.org/disaster.htm In order to bridge the gap between research and development and large scale application of<br />
new building material technologies, the erstwhile Ministry of Urban Development, Government of India, had established the<br />
Building Materials <strong>And</strong> Technology Promotion Council in July 1990.<br />
• www.gsdma.org/cycpre.htm Link to Cyclone preparedness on the Gujarat State Disaster Management Authority website.<br />
The Government of Gujarat (GOG) established the Gujarat State Disaster Management Authority to co-ordinate the<br />
comprehensive earthquake recovery program.<br />
• www.osdma.org website of Orissa State Disaster Mitigation Authority. The Government of Orissa established the Orissa<br />
State Disaster Management Authority to co-ordinate the comprehensive Orissa Super Cyclone recovery program. Visit the<br />
section ‘Safety Tips’ for cyclones and other hazards.<br />
• www.tropmet.res.in The IITM functions as a national centre for basic and applied research in monsoon meteorology of the<br />
tropics in general with special reference to monsoon meteorology of India and neighborhood. Its primary functions are to<br />
promote, guide and conduct research in the field of meteorology in all its aspects.<br />
• www.colorado.edu/hazards is an excellent site having a comprehensive coverage of disaster-related information organized<br />
in an easy to read way.<br />
• www.wmo.ch World Meteorological Organization is an intergovernmental organization with a membership of 187 Member<br />
States and Territories. WMO is a specialized agency of the <strong>United</strong> <strong>Nations</strong> for meteorology (weather and climate),<br />
operational hydrology and related geophysical sciences.<br />
Multi-purpose Cyclone Shelters<br />
Multi-purpose Cyclone Shelters of suitable<br />
designs have been constructed in vulnerable<br />
locations of coastal Orissa and <strong>And</strong>hra Pradesh.<br />
Multi-purpose Cyclone Shelters<br />
Multipurpose Cyclone Shelter at Binchhanapalli<br />
(Ganjam). Vulnerable locations in coastal Orissa have<br />
been identified for constructing suitably designed Multipurpose<br />
Cyclone Shelters. Local communities will be<br />
responsible for their maintenance and management<br />
“ t o w a r d s s a f e r I N D I A ” 30
CHAPTER 6<br />
FLOOD HAZARDS AND DISASTERS<br />
1 2<br />
3 4<br />
FLOODS –<br />
is a temporary<br />
inundation of large<br />
regions as the result<br />
of an increase in<br />
reservoir, or of rivers<br />
flooding their banks<br />
because of heavy<br />
rains, high winds,<br />
cyclones, storm surge<br />
along coast, tsunami,<br />
melting snow or dam<br />
bursts.<br />
In the picture:<br />
1. Floods in Bihar, 2002<br />
2. Assam Floods 2002<br />
2,3 Flood in Assam, 2002<br />
4 The air force dropped relief<br />
ONSET TYPE<br />
Floods may happen gradually and take hours, or can even happen suddenly due to breach of the<br />
structures, spillover etc. heavy downpour can cause flash floods in the region.<br />
WARNING<br />
Flood forecasting and warning has become highly developed in the past two decades. With the<br />
advancement in the technology such as satellite and remote-sensing equipments flood waves can be<br />
tracked as they move downwards. Except for flash floods there is usually a reasonable warning period.<br />
Heavy precipitation will give sufficient warning of the coming river flood. High tides with high winds may<br />
indicate flooding in the coastal areas. Evacuation is possible with suitable monitoring and warning.<br />
Warning is issued by the Central Water Commission (CWC), Irrigation & Flood Control Department, and<br />
Water Resources Department. Flood forecasting activities started by CWC has about 132 Forecasting<br />
Stations to cover most of the interstate flood prone rivers besides inflow forecasts for 25 major reservoirs<br />
of the country. Over 6000 forecasts are issued by CWC every year with about 95% of the forecasts falling<br />
within the permissible range. CWC maintains close liaison with the administrative and state engineering<br />
agencies, local civil authorities to communicate advance warning for appropriate mitigation and<br />
preparedness measures.<br />
“ t o w a r d s s a f e r I N D I A ” 31
Flash floods defined as floods which occurs within six hours of the beginning of heavy rainfall, and are<br />
usually associated with cloud bursts, storms and cyclones requiring rapid localized warnings and<br />
immediate response if damage is to be mitigated. Wireless network and telephone connections are used<br />
to monitor flood conditions. In case of flash floods, warnings for timely evacuation may not always be<br />
possible.<br />
ELEMENTS AT RISK<br />
Anything in the flood plains will get inundated. Buildings built of earth, weak foundations and water<br />
soluble materials will collapse endangering humans and their property. Basements of buildings are under<br />
risk. Utilities such as sewerage, water supply, communication lines, and power are put at risk. Food stock<br />
in the godowns, agricultural fields, salt pans, livestock, vehicles, machinery and equipments mounted on<br />
the ground, fishing boats are also put at risk.<br />
INDIAN FLOODS<br />
Floods occur in almost all rivers basins of the country. Heavy rainfall, inadequate capacity of rivers to<br />
carry the high flood discharge, inadequate drainage to carry away the rainwater quickly to Streams/<br />
Rivers are the main causes of floods. Ice jams or land slides blocking streams; typhoons and cyclones<br />
also cause floods. Excessive rainfall combined with inadequate carrying capacity of streams resulting in<br />
over spilling of banks is the cause for flooding in majority of cases. Rashtriya Barh Ayog (RBA)<br />
constituted by the Government of India in 1976 carried out an extensive analysis to estimate the floodaffected<br />
area in the country. RBA in its report (1980) has assessed the area liable to floods as 40 million<br />
hectares. It was determined by summing up the maximum area affected by floods in any one year in<br />
each state during the period from 1953 to 1978 for which data was analysed by the Ayog. This sum has<br />
been corrected for the area that was provided with protection at that time and for the protected area that<br />
got affected due to failure of protection works during the period under analysis to arrive at the total area<br />
liable to floods in the country as per break-up given below:<br />
State<br />
Area liable to<br />
Floods<br />
(million Ha.)<br />
1. <strong>And</strong>hra Pradesh 1.39<br />
2. Assam 3.15<br />
3. Bihar 4.26<br />
4. Gujarat 1.39<br />
5. Haryana 2.35<br />
6. Himachal Pradesh 0.23<br />
7. Jammu & Kashmir 0.08<br />
8. Karnataka 0.02<br />
9.Kerala 0.87<br />
10. Madhya Pradesh 0.26<br />
11. Maharashtra 0.23<br />
12. Manipur 0.08<br />
13. Meghalaya 0.02<br />
14. Orissa 1.40<br />
15. Punjab 3.70<br />
16. Rajasthan 3.26<br />
17. Tamil Nadu 0.45<br />
18. Tripura 0.33<br />
19. Uttar Pradesh 7.336<br />
20. West Bengal 2.65<br />
21. Delhi 0.05<br />
22. Pondichery 0.01<br />
Total 33.516<br />
Year Flood Affected Area<br />
(Million Ha.)<br />
Year Flood Affected Area<br />
(Million ha.)<br />
1953 2.290 1954 7.490<br />
1955 9.440 1956 9.240<br />
1957 4.860 1958 6.260<br />
1959 5.770 1960 7.530<br />
1961 6.560 1962 6.120<br />
1963 3.490 1964 4.900<br />
1965 1.460 1966 4.740<br />
1967 7.150 1968 7.150<br />
1969 6.200 1970 8.460<br />
1971 13.250 1972 4.100<br />
1973 11.790 1974 6.700<br />
1975 6.170 1976 11.910<br />
1977 11.460 1978 17.500 (max)<br />
1979 3.990 1980 11.460<br />
1981 6.120 1982 8.870<br />
1983 9.020 1984 10.710<br />
1985 8.380 1986 8.810<br />
1987 8.890 1988 16.290<br />
1989 8.060 1990 9.303<br />
1991 6.357 1992 2.645<br />
1993 11.439 1994 4.805<br />
1995 5.245 1996 8.049<br />
1997 4.569 1998* 9.133<br />
1999* 3.978 2000* 5.166<br />
2001* 3.008 2002* 2.808<br />
* Figures are tentative.<br />
The area affected by flood in the country from 1953 to 2000 is given in this<br />
table. The annual average area affected is 7.181 million ha.<br />
Maximum flood affected area from Data for the period 1953-78<br />
Add Area protected till then (1978)<br />
Deduct Area flooded due to failure of Protection works which might have<br />
Been added in the reported flooded Area<br />
Total Flood Prone Area in the Country<br />
34 million ha.<br />
10 million ha.<br />
4 million ha.<br />
40 million ha.<br />
“ t o w a r d s s a f e r I N D I A ” 32
HAZARD ZONES<br />
The Vulnerability Atlas of India shows pictorially the areas liable<br />
to floods. The flood hazard map is based on the Flood Atlas of<br />
India brought out by the Central Water Commission, state wise<br />
marking both the areas which are liable to flooding as well as<br />
those which have been protected. The maps given in the<br />
Vulnerability Atlas of India show the district boundaries and the<br />
location of the district towns along with the rivers district wise<br />
identification of vulnerable areas will be easy.<br />
Besides the problems of flooding in the river plains, heavy<br />
intensity rains could cause local; flooding in certain areas where<br />
the drainage is either naturally poor or the drains are choked<br />
due to various reasons such as careless dumping of refuse in<br />
the drains and lack of maintenance. Much of the flooding in the<br />
towns and cities occur due to such cases.<br />
Under cyclonic winds in coastal areas, the sea coast of India can<br />
be flooded due to heavy down pour on the one hand and storm<br />
surge on the other. The depth of inland water inundation could Map showing Flood Zones in India<br />
be worked out by taking the storm surge heights.<br />
Death Toll in major floods of India<br />
Year Number of Location<br />
people killed<br />
1968 4,892 (1) Rajasthan, Gujarat - (2) North-East, West Bengal, Assam<br />
1978 3,800 North, Northeast<br />
1994 2,001 Assam, Arunachal Pradesh, Jammu and Kashmir, Himachal, Punjab, Uttar Pradesh, Goa, Kerala,<br />
Gujarat states<br />
1961 2,000 North<br />
1998 1,811 Assam, Arunachal, Bihar, Kerala, Meghalaya, Punjab, Sikkim, Uttar Pradesh, West Bengal states<br />
1980 1,600 Uttar Pradesh, Bihar, Gujarat, Kerala, Haryana<br />
1989 1,591 Maharashtra, <strong>And</strong>hra Pradesh, Gujarat<br />
1995 1,479 Bihar, Haryana, Jammu & Kashmir, Punjab, Uttar Pradesh, West Bengal, Maharashtra<br />
1997 1,442 <strong>And</strong>hra Pradesh, Arunachal Pradesh, Assam, Bihar, Gujarat, Himachal Pradesh, Jammu and<br />
Kashmir, Karnataka, Kerala, Maharashtra, Madyha Pradesh, Orissa, Punjab, Rajasthan, Sikkim,<br />
Uttar Pradesh, West Bengal states<br />
2000 1,290 Gujarat, <strong>And</strong>hra Pradesh, Assam, Arunachal Pradesh, Bihar, Himachal Pradesh, Kerala, Madhya<br />
Pradesh, Punjab, Uttar Pradesh, West Bengal<br />
1971 1,023 North India<br />
TYPICAL EFFECTS<br />
Physical damage – structures damaged or collapsed by washing waters, landslide triggered on account<br />
of water getting saturated. Boats and fishing equipments may be lost or damaged in coastal areas.<br />
Road damage by floods Bridge collapse in the Assam floods Outbreak of encephalitis<br />
(transmitted by mosquitoes)<br />
comes with the floods<br />
“ t o w a r d s s a f e r I N D I A ” 33
Casualties and pubic health – people and livestock deaths caused by drowning, very few serious<br />
injuries. Outbreak of epidemics, diarrhea, viral infections, malaria.<br />
Water supplies – contamination of water (wells, ground water, piped water supply). Clean water may be<br />
unavailable.<br />
Crops and food supplies – sudden food shortage can be caused due to loss of entire harvest, spoiling of<br />
grains when saturated in water along with loss of animal fodder. The crop storage facilities and godowns<br />
may get submerged resulting in immediate food shortage. Floods may also affect the soil characteristics.<br />
The land may be rendered infertile due to erosion of top layer or may turn saline if sea water floods the<br />
area.<br />
POTENTIAL FOR REDUCING HAZARD<br />
Embankments along the rivers, sea walls along the coasts<br />
may keep water away from the flood plains. Water flow can<br />
be regularized through construction of the reservoirs, check<br />
dams, alternate drainage channels/routes, increasing<br />
vegetation cover and by providing storm drains.<br />
MAIN MITIGATION STRATEGIES<br />
Mapping of the flood prone areas is a primary step<br />
involved in reducing the risk of the region. Historical records<br />
give the indication of the flood inundation areas and the<br />
period of occurrence and the extent of the coverage. The<br />
basic map is combined with other maps and data to form a<br />
complete image of the floodplain. Warning can be issued<br />
looking into the earlier marked heights of the water levels in<br />
case of potential threat. In the coastal areas the tide levels<br />
and the land characteristics will determine the submergence<br />
areas. Flood hazard mapping will give the proper indication<br />
of water flow during floods.<br />
Land use control will reduce danger of life and property<br />
when waters inundate the floodplains and the coastal areas.<br />
The number of casualties is related to the population in the<br />
area at risk. It’s better to reduce the densities in areas where<br />
neighborhoods are to be developed. In areas where people<br />
already have built their settlements, measures should be<br />
taken to relocate to better sites so as to reduce vulnerability.<br />
No major development should be permitted in the areas<br />
which are subjected to high flooding. Important facilities<br />
should be built in safe areas. In urban areas, water holding<br />
areas can be created in ponds, lakes or low-lying areas.<br />
Construction of engineered structures in the flood plains<br />
and strengthening of structures to withstand flood forces and<br />
seepage. The buildings should be constructed on a elevated<br />
area. If necessary build on stilts or platform.<br />
Flood Control aims to reduce flood damage. This can be<br />
done by Flood Reduction by decreasing the amount of runoff<br />
by treatment like reforestation (to increase absorption could<br />
be a mitigation strategy in certain areas), protection of<br />
vegetation, clearing of debris from streams and other water<br />
holding areas, conservation of ponds and lakes etc. Flood<br />
Diversion include levees, embankments, dams and channel<br />
improvement. Dams can store water and can release water<br />
Bihar state Flood Zone Map<br />
Do not construct buildings in areas of turn<br />
of rivers, flood plains, or mudflows.<br />
Pedestal<br />
Buildings on stilts or on a platform<br />
Construction in a flood prone area<br />
at a manageable rate. But failure of dams in earthquakes and operation of releasing the water can cause<br />
floods in the lower areas. Flood Proofing reduces the risk of damage. Measures include use of sand bags<br />
“ t o w a r d s s a f e r I N D I A ” 34
to keep flood water away, blocking or sealing of doors and windows of houses etc. Houses may be<br />
elevated by building on raised land. Buildings should be constructed away from water bodies.<br />
Flood Management In India, systematic planning for<br />
flood management commenced with the Five Year<br />
Plans, particularly with the launching of National<br />
Programme of Flood Management in 1954. During the<br />
last 48 years, different methods of flood protection<br />
structural as well as non-structural have been adopted in<br />
different states depending upon the nature of the<br />
problem and local conditions. Structural measures<br />
include storage reservoirs, flood embankments, drainage<br />
channels, anti-erosion works, channel improvement<br />
works, detention basins etc. and non-structural<br />
measures include flood forecasting, flood plain zoning,<br />
flood proofing, disaster preparedness etc. The flood Slum stilt houses in the outskirts of Dhaka city.<br />
management measures undertaken so far have provided<br />
reasonable degree of protection to an area of 15.81<br />
million hectares through out the country. The various<br />
flood management measures undertaken through the<br />
successive five year plans (upto 3/2000) are<br />
summarized below:<br />
Flood embankments<br />
Drainage channels<br />
Towns protection works<br />
Villages raised<br />
33630 km<br />
37904 km<br />
2337 Nos.<br />
4713Nos.<br />
COMMUNITY BASED MITIGATION<br />
Sedimentation clearance, reforestation programme, dike<br />
and flood wall construction can be taken as part of the<br />
community based mitigation programme. The community<br />
can participate in flood fighting by organizing work<br />
parties to repair embankments, pile sandbags and<br />
stockpile needed materials. Farming practices have to<br />
be flood compatible. Special varieties of seeds are<br />
available which can be harvested during the flood<br />
season. Houses constructed need to be flood resistant<br />
and multipurpose shelter should be constructed by the<br />
community. Banks of the earth can be raised and it can<br />
give shelter to the community as well as the livestock<br />
during the time of floods.<br />
WEB RESOURCES:<br />
• www.cwc.nic.in website of the Central Water Commission of<br />
India, (CWC) of India.<br />
• http://wrmin.nic.in website of the Ministry of Water Resources,<br />
GoI.<br />
• www.imd.ernet.in Indian Meteorological Department (IMD)<br />
provides all India weather report, end of monsoon season<br />
report, weather charts, satellite images, rainfall maps,<br />
earthquake reports and severe weather warnings.<br />
• www.ndmindia.nic.in Natural Disaster Management India.<br />
Provides current news on Flood, Drought and Cyclones,<br />
Weather Links from NIC and weather conditions/temperatures on<br />
Indian Ocean (www.weather.nic.in).<br />
www.nih.ernet.in India National Institute of Hydrology perform tasks<br />
such as Ground water zone mapping, Flood plain mapping, land use,<br />
salinity, sedimentation, Soil erosion, water-logging etc.<br />
Khash Dhalai Flood Shelter.<br />
Flood shelters like this are just one example of how<br />
communities can protect themselves from the worst of<br />
the floods. Banks of earth are raised by up to 5 metres<br />
and cover an area of several kilometres. The people<br />
dig a huge pond in the middle and use this earth to<br />
raise the ground. Whenever the floods come, people<br />
can bring their livestock, possessions – even their<br />
homes – to safety. The pond in the middle becomes an<br />
important source of food, as it is used to farm fish.<br />
Mobile homes<br />
Families build specially designed homes made of<br />
jute canes. During the floods they can be dismantled<br />
and taken to higher ground.<br />
“ t o w a r d s s a f e r I N D I A ” 35
CHAPTER 7<br />
DROUGHT HAZARDS AND DISASTERS<br />
1<br />
DROUGHTis<br />
an insidious natural<br />
hazard that results from<br />
a departure of<br />
precipitation from<br />
expected or normal that,<br />
2<br />
when extended over a<br />
season or longer period<br />
of time, is insufficient to meet the demands of<br />
human, plant and animal activities.<br />
3<br />
In the picture:<br />
1. Drought affected communities praying God for rainfall.<br />
2. Drought forces people to walk miles in search of drinking water.<br />
3. Crop failure is a common phenomenon when drought strikes. Watch<br />
the scanty vegetation in the background.<br />
ONSET TYPE AND WARNING<br />
Drought is a slow-onset disaster and as it is difficult to demarcate the time of its onset and end. Falling<br />
rainfall levels, falling groundwater levels, drying wells, rivers and reservoirs, and poor agricultural<br />
production warn the onset of drought. According to the Indian Meteorological Department, the country is<br />
said to be drought affected when the overall rainfall deficiency is more than 10 per cent of the long<br />
period average and more than 20 per cent of the country area is affected by such drought conditions.<br />
ELEMENTS AT RISK<br />
Drought impacts mostly rainfed crops to start<br />
with and subsequently the irrigated crops.<br />
Areas with minimum of alternative water<br />
sources to rainfall (ground and canal water<br />
supplies), areas subjected to drastic<br />
environmental degradation such as denuded<br />
forest lands and altered ecosystems, and areas<br />
where livelihoods alternative to agriculture are<br />
least developed are most vulnerable to<br />
drought. The herdsman, landless laborers,<br />
subsistence farmers, the women, children, and<br />
farm animals are the most vulnerable groups<br />
affected by the drought conditions.<br />
Precipitation<br />
Groundwater<br />
Reservoirs<br />
Canals<br />
Soil moisture<br />
Ponds/tanks<br />
Water Sources<br />
Agriculture<br />
Domestic<br />
Industry<br />
Natural vegetation<br />
Recreation<br />
Wild life<br />
Water Users<br />
A simple way of finding drought vulnerability of a region is<br />
to calculate the balance between different sources and<br />
users of water.<br />
“ t o w a r d s s a f e r I N D I A ” 36
TYPICAL EFFECTS<br />
Drought, different from other natural disasters, do not cause any<br />
structural damages. The typical effects include loss of crop,<br />
dairy, timber (forest fires), and fishery production; increase in<br />
energy demand for pumping water; reduced energy production;<br />
increased unemployment, loss of biodiversity, reduced water, air,<br />
and landscape quality; groundwater depletion, food shortage,<br />
health reduction and loss of life, increased poverty, reduced<br />
quality of life, and social unrest leading to migration.<br />
MAIN MITIGATION STRATEGIES<br />
Drought monitoring is continuous observation of rainfall<br />
situation, water availability in reservoirs, lakes, rivers and<br />
comparing with the existing water needs of various sectors of the<br />
society.<br />
Water supply augmentation and conservation through<br />
rainwater harvesting in houses and farmers’ fields increases the<br />
content of water available. Water harvesting by either allowing<br />
the runoff water from all the fields to a common point (e.g. Farm<br />
ponds, see the picture) or allowing it to infiltrate into the soil<br />
where it has fallen (in situ) (e.g. contour bunds, contour<br />
cultivation, raised bed planting etc) helps increase water<br />
availability for sustained agricultural production.<br />
Expansion of irrigation facilities reduces the drought<br />
vulnerability. Land use based on its capability helps in optimum<br />
use of land and water and can avoid the undue demand created<br />
due to their misuse.<br />
Livelihood planning identifies those livelihoods which are least<br />
affected by the drought. Some of such livelihoods include<br />
increased off-farm employment opportunities, collection of non-timber forest produce from the community<br />
forests, raising goats, and carpentry etc.<br />
Drought planning<br />
The basic goal of drought planning is to improve the effectiveness of preparedness and response efforts<br />
by enhancing monitoring, mitigation and response measures. Planning would help in effective<br />
coordination among state and national agencies in dealing with the drought. Components of drought plan<br />
include establishing drought taskforce which is a team<br />
of specialists who can advise the government in taking<br />
decision to deal with drought situation, establishing<br />
coordination mechanism among various agencies which<br />
deal with the droughts, providing crop insurance<br />
schemes to the farmers to cope with the drought related<br />
crop losses, and public awareness generation.<br />
Public awareness and education<br />
Educating the masses on various strategies you learned<br />
above would help in effective drought mitigation. This<br />
includes organizing drought information meetings for the<br />
public and media, implementing water conservation<br />
awareness programs in the mass media like television,<br />
publishing and distributing pamphlets on water<br />
conservation techniques and agricultural drought<br />
management strategies like crop contingency plans and<br />
A watershed showing collection of water to<br />
common point. ImageSource: http://www.4j.lane.edu<br />
Rooftop rainwater harvesting: Roof acts as<br />
catchment draining the water to a cistern.<br />
Farm ponds collected the rainwater and<br />
helped in escaping the drought impacts in<br />
Karnool District of <strong>And</strong>hra Pradesh.<br />
rainwater harvesting and establishing drought<br />
information centers for easy access to the farmers.<br />
“ t o w a r d s s a f e r I N D I A ” 37
Watersheds: For water supply augmentation & conservation<br />
Watersheds are the geographic areas where the water flows to a common point. To mitigate the drought impact, all<br />
kinds of soil and water conservation measures are taken up with the involvement of the local communities. This<br />
approach helped these areas to manage efficiently the soil, vegetation, water and other resources. By conserving<br />
scarce water sources and improving the management of soil and vegetation, watersheds have the potential to<br />
create conditions conducive to higher agricultural productivity while conserving natural resources.<br />
Checkdams (Bhanadaras)<br />
These are check dams or diversion weirs built across rivers. A<br />
traditional system found in Maharashtra, their presence raises the<br />
water level of the rivers so that it begins to flow into channels.<br />
They are also used to impound water and form a large reservoir.<br />
Where a bandhara was built across a small stream, the water<br />
supply would usually last for a few months after the rains.<br />
Source: http://www.rainwaterharvesting.org<br />
What a mitigation approach can do? A success story<br />
Ralegan, before drought mitigation efforts<br />
Ralegan, after drought mitigation efforts<br />
The people of Ralegan Siddhi in Maharashtra transformed the dire straits to prosperity. Twenty years ago the<br />
village showed all traits of abject poverty. It practically had no trees, the topsoil had blown off, there was no<br />
agriculture and people were jobless. Anna Hazare, one of the India's most noted social activists, started his<br />
movement concentrating on trapping every drop of rain, which is basically a drought mitigation practice.<br />
So the villagers built check dams and tanks. To conserve soil they planted trees. The result: from 80 acres of<br />
irrigated area two decades ago, Ralegan Siddhi has a massive area of 1300 acres under irrigation. The migration<br />
for jobs has stopped and the per capita income has increased ten times from Rs.225 to 2250 in this span of time.<br />
The entire effort was only people’s enterprise and involved no funds or support from the Government.<br />
Drought affected villagers working on the construction of a<br />
'check dam' as part of a government cash for work programme.<br />
The dam is constructed in a dry river bed and is intended to<br />
collect the monsoon rains and replenish the water table.<br />
A government relief site in Kutch, western Gujarat. Drought<br />
hit villagers are employed as daily laborers constructing water<br />
catchment which are a series of interconnecting grids which<br />
capture rainwater preventing the run off of the monsoon rains.<br />
WEB RESOURCES:<br />
http://dmc.kar.nic.in/default.htm; www. watershedindia.net; www.rainwaterharvesting.org; www.drought.unl. edu;<br />
“ t o w a r d s s a f e r I N D I A ” 38
CHAPTER 8<br />
FOREST FIRE HAZARDS AND DISASTERS<br />
FOREST FIRE –<br />
Forest Fire/Wild Fire is one of the destructive<br />
natural forces known to mankind. While<br />
sometimes caused by lightning, nine out of<br />
ten wildfires are human-caused. "Wild Fire"<br />
is the term applied to any unwanted and<br />
unplanned fire burning in forest, shrub or<br />
grass.<br />
(Left) A forest fire in the Badai forest area near Shimla.<br />
(Right) June 5 2003 - A forest fire rages near the village of<br />
Dwarahat in Uttaranchal State.<br />
INTRODUCTION<br />
As per the latest state of forests report of the Forest Survey of India, the actual forest cover of India is<br />
19.27% of the geographic area, corresponding to 63.3 million ha. Only 38 million ha of forests are well<br />
stocked (crown density above 40%). This resource has to meet the demand of a population of 950 million<br />
people and around 450 million cattle. As such, country has to meet the needs of 16% of the world's<br />
population from 1% of the world forest resources. The same forest has also to cater for 19% of the world<br />
cattle population. The forests of the country are therefore, under tremendous pressure.<br />
Forest fires are a major cause of degradation of India's forests. About 90% of the forest fires in India are<br />
created by humans. The normal fire season in India is from the month of February to mid June. India<br />
witnessed the most severe forest fires in the recent time during the summer of 1995 in the hills of<br />
Uttaranchal & Himachal Pradesh. The fires were very severe and attracted the attention of whole nation.<br />
An area of 677,700 ha was affected by fires.<br />
“ t o w a r d s s a f e r I N D I A ” 39
WILDFIRE STATISTICS<br />
In India there are no comprehensive data to<br />
indicate the loss to forests in terms of area burned,<br />
values, and volume and regeneration damaged by<br />
fire. The available forest fire statistics are not<br />
reliable because they under estimate fire numbers<br />
and area burned. The reason behind this is<br />
attributed to the fear of accountability. However,<br />
Forest Survey of India in a country-wide study in<br />
1995 estimated that about 1.45 million hectares of<br />
forest are affected by fire annually. According to an<br />
assessment of the Forest Protection Division of the<br />
Ministry of Environment and Forests, Government<br />
of India, 3.73 million hectares of forests are<br />
affected by fires, annually in India.<br />
The Forest Survey of India, data on forest fire<br />
attribute around 50% of the forest areas as fire<br />
prone. This does not mean that country's 50% area<br />
is affected by fires annually. Very heavy, heavy and<br />
frequent forest fire damages are noticed only over 0.8%, 0.14% and 5.16% of the forest areas<br />
respectively.Thus, only 6.17% of the forests are prone to severe fire damage. In the absolute term, out of<br />
the 63 million ha. of forests, an area of around 3.73 million ha can be presumed to be affected by fires<br />
annually.<br />
In India there are very few cases of fire due to natural<br />
causes. The majority of the forest fires (99 percent) in<br />
the country are human caused. It is widely<br />
acknowledged that most of these fires are caused by the<br />
people deliberately and have a close relationship to their<br />
socio-economic conditions. Grazing, shifting cultivation,<br />
and collection of minor forest products by villagers are<br />
major causes of fires in India. Carelessness of the<br />
picnickers, travellers, and campers are also responsible<br />
for forest fires.<br />
Estimate (in %) of Forest Survey of India of the extent of<br />
forest fire incidences in India<br />
FOREST FIRE DAMAGES IN INDIA<br />
Forest fires are a major cause of degradation of India's<br />
forests. While statistical data on fire loss are weak, it is<br />
estimated that the proportion of forest areas prone to<br />
forest fires annually ranges from 33% in some states to<br />
over 90% in others. Forest Fires cause wide ranging<br />
adverse ecological, economic and social impacts. In a<br />
nutshell, fires cause:<br />
• Loss of valuable timber resources and depletion of<br />
carbon sinks<br />
• Degradation of water catchment areas resulting in<br />
loss of water<br />
• Loss of biodiversity and extinction of plants and<br />
animals<br />
• Loss of wild life habitat and depletion of wild life<br />
• Loss of natural regeneration and reduction in forest<br />
cover and production<br />
A large fraction of rural people in India are living in<br />
forest lands or are dependent on forest use.<br />
Forest grazing is an important source of income.<br />
Burning of forest understorey at the peak of the dry<br />
season helps to stimulate grass growth before the<br />
monsoon rains break.<br />
“ t o w a r d s s a f e r I N D I A ” 40
Frequent surface fire, cattle grazing<br />
and trampling impacts characterize the<br />
mountain forests in the Himalayan<br />
foothills and mountains of Northern<br />
India. This site in Uttar Pradesh has<br />
been repeatedly burned and is<br />
subjected to severe erosion damage.<br />
The old generation of pine trees (Pinus<br />
roxburghii) is fire tolerant but is lacking<br />
regeneration and a higher mixed<br />
proportion of fire-susceptible<br />
broadleaved trees, e.g. oaks (Quercus<br />
spp.). In the long run the multiple<br />
stresses by fire, cattle, and fuelwood<br />
cutting will lead to the complete<br />
destruction of these forests.<br />
fire watchers are recruited by the state governments as<br />
a special provision. At the central level, the Ministry of<br />
Environment and Forests is the ministry responsible for<br />
forest conservation and protection. Forest fire<br />
management is administered by the “Forest Protection<br />
Division” of the Ministry, which is headed by a Deputy<br />
Inspector General of Forests. The Ministry is<br />
implementing a plan called “Modern Forest Fire Control<br />
Methods” in India under which state governments are<br />
provided financial assistance for fire prevention and<br />
control. This assistance is being used by the state<br />
governments for procuring hand tools, fire resistant<br />
clothes, firefighting tools, radios, fire watch towers, fire<br />
finders, creation of fire lines, research, training, and<br />
publicity on firefighting.<br />
• Global warming resulting in rising temperature<br />
• Loss of carbon sink resource and increase in percentage of CO 2<br />
in the atmosphere<br />
• Change in micro climate of the area making it unhealthy living<br />
conditions<br />
• Soil erosion affecting productivity of soils and production<br />
• Ozone layer depletion<br />
• Health problems leading to diseases<br />
• Indirect affect on agricultural production: Loss of livelihood for<br />
the tribals as approximately 65 million people are classified as<br />
tribals who directly depend upon collection of non-timber forest<br />
products from the forest areas for their livelihood.<br />
Various regions of the country have different normal and peak fire<br />
seasons, which normally vary from January to June. In the plains of<br />
northern and central India, most of the forest fires occur between<br />
February and June. In the hills of northern India fire season starts<br />
later and most of the fires are reported between April and June. In<br />
the southern part of the country, fire season extends from January<br />
to May. In the Himalayan region, fires are common in May & June.<br />
OPERATIONAL FIRE MANAGEMENT SYSTEMS AND<br />
ORGANIZATIONS<br />
According to the Constitution of India, the central and state<br />
governments in the country are enabled to legislate on forestry<br />
issues. The implementation part of the forest policy/programmes lies<br />
with the state government. Thus, fire prevention, detection, and<br />
suppression activities are the responsibility of the state<br />
governments’ forestry departments. The policy, planning, and<br />
financing are the primary responsibility of the Central Government.<br />
There is generally no separate department for carrying out forest fire<br />
management in the states. The regular staff of the forest<br />
departments in the states carries out various activities of forest fire<br />
management. During forest fire seasons in some of the divisions,<br />
Modern forest fire control in India involves the use of<br />
adapted technologies, including fire-proof safety<br />
clothing.<br />
COMMUNITY INVOLVEMENT<br />
In India, Joint Forest Management (JFM) Committees have been established at the village level to<br />
involve people in forest protection and conservation. At present there are 36,165 JFM committees<br />
throughout the country, covering an area of more than 10.24 million hectares. These JFM committees<br />
also have been given responsibilities to protect the forests from fires. For this purpose, the Modern<br />
“ t o w a r d s s a f e r I N D I A ” 41
Forest Fire Control plan is being revised and JFM is being made an integral component of the forest fire<br />
prevention strategy. Use of aircraft and helicopters has not been very cost effective in the fire<br />
management program and the Air Operation Wing is being closed down. For emergency purposes,<br />
however, a provision for hiring aircraft for transportation of crews and water is being maintained. The<br />
Government of India has issued national forest fire prevention and control guidelines. Salient features of<br />
the guidelines include identification of vulnerable areas on maps, creation of a data bank on forest fires,<br />
evolving fire dangers, fire forecasting system, provisions for a crisis management group, involvement of<br />
JFM committees, and efficient enforcement of legal provisions.<br />
PUBLIC POLICIES CONCERNING FIRE<br />
India’s National Forest Policy (1988) presents a visionary strategy for forest conservation and<br />
management and emphasizes protection of forests against encroachment, fire, and grazing. It states that<br />
“The incidence of forest fires in the country is high. Standing trees and fodder are destroyed on a large<br />
scale and natural regeneration annihilated by such fires. Special precautions should be taken during the<br />
fire season. Improved and modern management practices should be adopted to deal with forest fire”.<br />
This policy provides a positive step towards protection of forests from fire. The legal and policy<br />
framework exists in support of fire protection in the country.<br />
ROLE OF EDUCATION<br />
Nature camp participants. Nagarahole Conservation Education<br />
Project, an education project of WCS, India Program<br />
A lack of understanding of the value of the wildlife<br />
reserves among most local people and their<br />
Young minds participate in an anti forest fire campaign.<br />
Nagarahole Wildlife Conservation Education Project<br />
(NAWICOED) is an education project undertaken at<br />
Nagarahole supported by WCS, India Program. Started in<br />
1994 NAWICOED is a community project with the explicit<br />
consequent hostility towards reserve protection goal of supporting stronger law enforcement and in Nagarahole. law<br />
enforcement are identified as a major problem to<br />
be addressed at most wildlife reserves in India.<br />
Arson by local people is a frequent form of<br />
backlash against law enforcement by park staff in<br />
national parks and wildlife sanctuaries in our<br />
country. Such hostility makes law enforcement<br />
difficult and often renders the reserve staff<br />
ineffective. Therefore, educating local people<br />
through outreach activities is very important<br />
THE NEEDS OF THE FIRE MANAGEMENT<br />
The incidence of forest fires in the country is on the<br />
increase and more area is burned each year. The<br />
major cause of this failure is the piecemeal<br />
approach to the problem. Both the national focus<br />
Public education and information on forest fire in India.<br />
“ t o w a r d s s a f e r I N D I A ” 42
and the technical resources required for sustaining a systematic forest fire management programme are<br />
lacking in the country. Important forest fire management elements like strategic fire centres, coordination<br />
among Ministries, funding, human resource development, fire research, fire detection system by using<br />
satellite images, fire management, and extension programmes are missing. Taking into consideration the<br />
serious nature of the problem, it is necessary to make some major improvements in the forest fire<br />
management strategy for the country.<br />
The Ministry of Environment and Forests (MOEF), Government of India, has prepared a National Master<br />
Plan for Forest Fire Control. This plan proposes to introduce a well-coordinated and integrated firemanagement<br />
programme that includes the following components:<br />
• Prevention of human-caused fires through education and environmental modification. It will include<br />
silvicultural activities, engineering works, people participation, and education and enforcement. It is<br />
proposed that more emphasis be given to people participation through Joint Forest Fire Management<br />
for fire prevention.<br />
• Prompt detection of fires through a well coordinated network of observation points, efficient ground<br />
patrolling, and communication networks. Remote sensing technology is to be given due importance in<br />
fire detection. For successful fire management and administration, a National Fire Danger Rating<br />
System (NFDRS) and Fire Forecasting System are to be developed in the country.<br />
• Fast initial attack measures.<br />
• Vigorous follow up action.<br />
• Introducing a forest fuel modification system at strategic points.<br />
• Firefighting resources.<br />
Each of the above components plays an important role in the success of the entire system of fire<br />
management. Special emphasis is to be given to research, training, and development.<br />
Source: 1. Fire Situation in India (IFFN No. 26 - January 2002, p. 23-27) contribution submitted by: Vinod K. Bahuguna, Ministry<br />
of Environment and Forests and Satendra Singh, Ministry of Rural Development.<br />
2. Forest Fire Prevention and Control Strategies in India (IFFN No. 20 - March 1999,p. 5-9) by: Vinod K. Bahuguna, Deputy<br />
Inspector General of Forests, Ministry of Environment and Forests, New Delhi.<br />
3. Wildlife Conservation Society (WCS), India Program. (Source: http://www.wcsindia.org/index.htm)<br />
4. Forest fires in India: policy initiatives for community participation [International Forestry Review 4(2),<br />
2002], by V.K. BAHUGUNA Inspector General of Forest & A. Upadhyay Assistant Inspector General of Forests, MoEF, New<br />
Delhi<br />
WEB RESOURCES:<br />
http://www.envfor.nic.in/ website of<br />
Ministry of Environment and Forests.<br />
http://www.teriin.org/jfm/jfm.htm website<br />
of - The Energy and Resources Institute.<br />
(Documentation of the JFM programme,<br />
Tamil Nadu).<br />
http://www.iifm.org/databank/index.html<br />
Forest Information Service - a<br />
comprehensive Internet information<br />
bank on forest and related resources in<br />
India and around the world, prepared by<br />
Indian Institute of Forest Management,<br />
Bhopal.<br />
A large fraction of India's deciduous and<br />
semi-deciduous forests is characterized by<br />
open and frequently burned stands. To<br />
reduce water stress the deciduous trees shed<br />
their leaves during the dry season. These<br />
fuels, together with the grass layer, allow the<br />
development of low- and medium-intensity<br />
surface fires almost every year. Many open<br />
forests are even affected by fire twice or three<br />
times per year.<br />
Medium-intensity surface fire<br />
in an open Southern Tropical<br />
Dry Deciduous forest near<br />
Chandrapur, Maharashtra.<br />
“ t o w a r d s s a f e r I N D I A ” 43
CHAPTER 9<br />
CHEMICAL AND INDUSTRIAL ACCIDENTS<br />
Bhopal Chemical Gas leak Disaster (2-3 December 1984) one of the<br />
worst industrial disasters of all time occurred in Bhopal. The tragedy<br />
was a technological accident in which 45Tonnes of highly poisonous<br />
methyl isocyanate (MIC) gas along with Hydrogen Cyanide and other<br />
reaction products leaked out of the pesticide factory of Union Carbide<br />
into the night air of Bhopal at around 12.30 a.m. The official death toll<br />
reached 3,598 in 1989. Thousands, who survived, however, face a<br />
fate worse than death.<br />
ONSET TYPE and WARNING<br />
Onset in case of industrial disaster can be either rapid<br />
(minutes or hours) or sudden (no warning) depending on<br />
the nature of occurrence. As there is a series of processes<br />
and reactions involved the onset may vary accordingly.<br />
Release of chemicals may be because of human error,<br />
technological failure or natural activities which include<br />
geological activity like earthquakes, natural fires, floods<br />
etc. The industrial facility should have monitoring and<br />
warning systems for fire and building up of dangerous<br />
conditions. Explosion in some of the cases can be<br />
anticipated.<br />
In the event of fires, chemical<br />
leaks or explosions occurring in<br />
industrial facilities, people are<br />
exposed to the following dangers:<br />
• The fire spreading in the industry and the<br />
residential areas nearby<br />
• Heat conditions<br />
• Chemical gas leak (poisonous)<br />
• Combustion of various products and<br />
heat waves<br />
• Low oxygen levels<br />
• Falling of structural elements and<br />
machinery<br />
• Contamination of the nearby<br />
environment (land, water and air)<br />
In the picture: (Left) The killer MIC plant,<br />
(Right Top) Ruins of the Union Carbide<br />
Pesticide Factory – Toxic Gas Release,<br />
(Right bottom) Slogans on factory wall.<br />
Industrial Systems<br />
Facilities<br />
Equipments<br />
Products<br />
Wastes<br />
Environment<br />
Atmosphere<br />
Lithosphere<br />
Hydrosphere<br />
Biosphere<br />
People<br />
Operators<br />
Population at risk<br />
Plant manager<br />
ELEMENTS AT RISK<br />
The industrial set up and its near environment is under<br />
immediate threat. Employees of the work place, residents<br />
of nearby settlements, livestock, and crops in the nearby<br />
vicinity are at risk. The environment which includes land,<br />
water and air will get polluted. Hazardous substance<br />
released into the air or water can travel long distances and Components of Industrial Hazard<br />
“ t o w a r d s s a f e r I N D I A ” 44
cause contamination of air, water supply and land, making it uninhabitable for humans. Large scale<br />
disasters will threaten the ecological system.<br />
TYPICAL EFFECTS<br />
Physical Damage – Damage to structures and infrastructure. In case of explosion, fire, or release of<br />
toxins in the air the geographical spread can be high.<br />
Casualties – Many people may be killed, injured and would require immediate treatment. The routes of<br />
exposure in chemical accidents are<br />
inhalation, eye exposure, skin contact and<br />
ingestion. Health effects are described in<br />
terms of the system or organ getting<br />
affected and may include cancer, heart<br />
failure, brain damage, disfunction of<br />
immune system, deformation, genetic<br />
disorders, congenital (present since birth)<br />
disorders etc. Fire can spread to a large<br />
area and may cause deaths by burns and<br />
asphyxiation.<br />
Environmental – Contamination of air,<br />
water, land, and standing crops may<br />
occur. Particular areas may become<br />
uninhabitable due to the damage caused<br />
to the environment.<br />
POSSIBLE RISK REDUCTION MEASURES<br />
Hazard Mapping – inventories and maps of storage locations<br />
of toxins or hazardous substances along with the possible<br />
characteristics should be displayed and known to all. The<br />
community staying in the immediate vicinity should be aware<br />
of this hazard and possible effects in case of an accident<br />
should be known. The map should also determine the area<br />
that may get affected in case an accident occurs. Hazard map<br />
should determine possible zone getting affected and safe<br />
route for evacuation should be marked.<br />
Land use planning – densely populated residential areas<br />
should be separated far away from industrial areas. A buffer<br />
zone (green belt) should separate the industrial and the<br />
residential zone.<br />
<strong>Community</strong> preparedness – The community should be<br />
aware of the hazardous installations and know how to combat<br />
the situation. The local community has to be informed about<br />
the response steps to be taken in case of an accident.<br />
<strong>Community</strong> members should monitor the pollution levels of the<br />
industry and participate in mock drills.<br />
23 Dec 2003, Gas Well Blowout in Gao Qiao, Chongqing, China. 243 people<br />
died, 9,000 were injured, and 64,000 were evacuated. Many of the confirmed<br />
dead were children or elderly people who were unable to flee after the<br />
explosion. Those who did not escape in time suffered burns to their eyes, skin<br />
and lungs from the gas. (Source: www.uneptie.org)<br />
Bhopal, showing the area affected by the<br />
leakage of toxic gas.<br />
(Source:www.unu.edu/unupress/unupbooks/u<br />
u21le/uu21le07.jpg)<br />
Other possible risk reduction measures: Maintain the wind flow diagram of the region, improve fire<br />
resistance and warning systems, improve fire fighting and pollution dispersion capabilities, develop<br />
emergency relief and evacuation planning for employees and nearby settlements, limit storage capacity<br />
of the toxic substances, insurance for industries and safety legislation<br />
WEB RESOURCES<br />
http://sdnp.delhi.nic.in Sustainable Development Networking Programme India support decision-makers and key stakeholders<br />
from all sectors of civil society on issues related to sustainable human development<br />
www.lpaindia.org Loss Prevention Association of India Ltd. (LPA) is engaged in promoting safety and loss control through<br />
education, training and consultancy.<br />
“ t o w a r d s s a f e r I N D I A ” 45
www.uneptie.org/pc/apell the (UNEP) has developed a programme called as APELL, in conjunction with governments and<br />
CHAPTER industry with the 10 purpose of minimizing the occurrence and harmful effects of technological accidents and environmental<br />
emergencies.<br />
OTHER TYPES OF HAZARDS AND DISASTERS<br />
E P I D E M I C S<br />
AN EPIDEMIC–<br />
is defined as the occurrence of an<br />
illness or other health-related event<br />
that is clearly in excess of unexpected<br />
occurrence<br />
In the picture: Top (Left) - Bubonic plague spread by fleas on<br />
rat. Top (Right) - Male Xenopsylla cheopis (oriental rat flea)<br />
engorged with blood. This flea is the primary vector of plague<br />
in most large plague epidemics in Asia, Africa, and South<br />
America. Both male and female fleas can transmit the<br />
infection. Bottom (Left) - Pneumonic plague sufferers in our<br />
country. Bottom (Right) - Plague outbreak in India reported in<br />
Newsweek, 1996.<br />
The Surat plague outbreak killed 56 people nationwide. This<br />
outbreak served as a chilling reminder of how rapid<br />
urbanization and deterioration of the urban environment can<br />
bring people into contact with forgotten disease vectors.<br />
ONSET TYPE and WARNING<br />
The onset of an epidemic can be either rapid or sudden and this depends on several factors. An<br />
epidemic can be anticipated by the rise in number of people suffering from a particular disease. In some<br />
cases an epidemic can be anticipated or predicted by an increase in the vector breading sites or in the<br />
death of the disease carriers (say plague is carried by the flea on rodents).<br />
BASIC PRINCIPLES<br />
A disease epidemic or outbreak is the occurrence of cases of a particular disease in excess of the<br />
expected, therefore, demanding that emergency control measures be implemented.<br />
The threat of communicable disease outbreaks is greater after a disaster than in non-emergency<br />
situations, particularly when large populations have been displaced. However, an epidemic or outbreak<br />
will only occur if the equilibrium between the population’s susceptibility (host or reservoir), the virulence of<br />
“ t o w a r d s s a f e r I N D I A ” 46
the infectious agent (bacteria, viruses, parasites, or fungi or their products) and the environment that<br />
promotes the exposure (refer to the figure below) is upset.<br />
CAUSES<br />
The main cause for an epidemic is the<br />
pathogen (virus, bacteria, protozoa or rarely<br />
fungi). Reports of outbreaks of communicable<br />
diseases are increasing in number and reported<br />
in many of the national dailies. This is because<br />
of a number of reasons. For instance poor<br />
sanitary conditions may contaminate food and<br />
water and also suffice the environment for<br />
breeding conditions for the vector. Other factors<br />
include the seasonal changes that favour the<br />
breeding of an insect vector such as mosquito<br />
in the rainy season, exposure of non-immune<br />
persons say tourists and migrants, poverty,<br />
overcrowding etc. Poverty is one of the major<br />
factor contributing to the vulnerability. Impact<br />
of natural disasters on the environment also<br />
leads to outbreak of epidemic. Part of the<br />
increase in the number of outbreaks is due to<br />
exposure of unreported cases of diseases as a<br />
result of better reporting and increased<br />
coverage of health services.<br />
AGENT<br />
Virulence,<br />
infectious dose,<br />
susceptibility to<br />
drugs mode of<br />
transmission ability<br />
to adapt to change<br />
POPULATION<br />
Age<br />
genetic susceptibility<br />
nutritional status<br />
previous exposure<br />
immunisation status<br />
general physical<br />
condition<br />
ENVIRONMENT<br />
Shelter, altitude<br />
humidity, sanitation<br />
food supply, water<br />
supply temperature<br />
overcrowding<br />
essential services<br />
Equilibrium between the Population, Infectious Agent, and the<br />
Environment<br />
ELEMENTS AT RISK<br />
Population or a particular community is under risk. It can be localized or pandemic (spread across<br />
countries).<br />
TYPICAL EFFECTS<br />
Epidemics cause illness and death. There are other secondary effects such as disruption in the society<br />
and economic losses. Vulnerability is high among those are poorly nourished, people living in<br />
unhygienic sanitary conditions, poor water supply, individuals who do not have an access to the health<br />
services or those who have weak immune systems. The outbreak of an epidemic in situations where<br />
already a natural calamity has struck will cause life threatening situations.<br />
POTENTIAL RISK REDUCTION MEASURES<br />
Structuring the health services is important to have clear understanding of roles and responsibilities of<br />
the public health system. Organizational preparedness and the coordination mechanism is required right<br />
from the State and District to the sub center level which is manned by the Village Health Nurses or the<br />
Health Workers.<br />
Contingency Plan for response should be prepared after identifying the epidemics that are likely to<br />
occur in the region. Early warning system through a surveillance system is the primary requirement so as<br />
to have an effective response and prevent any outbreaks. For this, surveillance need to be carried out at<br />
a regular basis through the routine surveillance system by involving the health tier system. Maps of all the<br />
health facilities in the region with an inventory of drugs and vaccines, laboratory set ups, list of number of<br />
doctors and supporting staff etc. need to be kept ready and updated at regular intervals.<br />
Training need to be given to so as to build the capacity at all levels. Training will help to cope better<br />
during the emergency response period for epidemics.<br />
Personnel protection through vaccination is an effective mitigation strategy and will protect the persons<br />
at risk.<br />
“ t o w a r d s s a f e r I N D I A ” 47
Common sources of infection carriers can be tackled by many measures. Strategies included are<br />
improving the sanitary conditions, drive to check and fumigate breeding places of any vector (source of<br />
infection), improving disposal methods of waste, disinfecting the water source etc.<br />
WEB RESOURCES<br />
http://mohfw.nic.in; http://icmr.nic.in/wel.htm; http://indmed.nic.in/; www.who.int/en/; www.cdc.gov<br />
H E A T W A V E S<br />
A HEATWAVE–<br />
Heatwave claims several lives at different locations across the country.<br />
News report as on Oct 2004 put across fierce heat wave that left at least<br />
622 dead over the past week as unseasonably dry winds push<br />
temperatures to sweltering levels in southern India. The deadly conditions,<br />
causing temperatures to soar as high as 46 degrees Celsius and above,<br />
have affected mainly the most vulnerable populations: the poor, elderly and<br />
outdoor workers, such at street vendors and farmers. Nearly 100 others<br />
have suffered heat-related deaths in the northern states of Punjab,<br />
Haryana and Orissa.<br />
is a complex phenomenon<br />
resulting from a certain<br />
combination of temperature,<br />
huimidity, air movement and<br />
duration. Simply stated, a<br />
heatwave is an extended period<br />
of very high summer<br />
temperatures with the potential<br />
to adversely affect<br />
communities.<br />
HEATWAVE DANGERS AND EFFECTS<br />
Human Effects: in many parts of the country and the world, every summer thousands of people suffer<br />
from heat stress when the bodies absorb more heat than they can dispel. Unless prompt<br />
preventive/treatment is received, they suffer the serious or even fatal consequences of heat stroke.<br />
Regardless of these statistics, heat wave is probably the most under-rated of all natural hazards. The<br />
level of discomfort experienced in warm, moist tropical and sub-tropical conditions is determined by a<br />
range of climatic variables, principally air temperature, humidity and wind; as well as cultural variables<br />
including clothing, occupation and accommodation; and physiological variables such as health, fitness,<br />
age and the level of becoming accustomed. The main factor involved in the degree to which we feel<br />
uncomfortable in such conditions is not so much because we feel hot, but rather we sense how difficult it<br />
has become for us to lose body heat at the rate necessary to keep our inner body temperature close to<br />
37 o C.<br />
The body responds to this stress progressively through three stages:<br />
• heat cramps – muscular pains and spasms caused by heavy exertion. Although heat cramps are the<br />
least severe stage they are an early signal that the body is having trouble with the heat;<br />
• heat exhaustion – typically occurs when people exercise heavily or work in a hot, humid place where<br />
body fluids are lost through heavy sweating. Blood flow to the skin increases causing a decrease of flow<br />
to vital organs. This results in mild shock with the symptoms of cold, clammy and pale skin together with<br />
fainting and vomiting. If not treated the victim may suffer heat stroke;<br />
• heat stroke – is life threatening. The victims temperature control system, which produces sweating to<br />
cool the body, stops working. The body temperature may exceed 40.6 O C potentially causing brain<br />
damage and death if the body is not cooled quickly. (Source: American Red Cross Website)<br />
Agriculture: animals suffer the same way as humans do., particularly when left without shade and<br />
adequate water. During heatwaves, especially in times of drought, livestock losses can be very high.<br />
“ t o w a r d s s a f e r I N D I A ” 48
Plants, crops and vegetables are also subject to the effects of the heat. The damage to the standing<br />
crops is a common feature during such events.<br />
Infrastructure: it is observed that during heatwaves railway lines can expand to the point where they<br />
buckle and cause derailments of trains. Road damage can also occur, where bitumen melting and<br />
concrete expanding and cracking occur. This may lead to disruption of traffic.<br />
Utilities and services: Water and electricity consumption services increase rapidly during severe heat<br />
conditions, often causing shortages. This causes extra demands on electricity and water supplies.<br />
FORECASTING AND WARNINGS<br />
The National Centre for Medium Range Weather Forecasting (NCMRWF) of Department of Science of<br />
Technology is the premier institution in India to provide Medium Range Weather Forecasts through<br />
deterministic methods and to render Agro Advisory Services (AAS) to the farmers. Advice will be<br />
included in the weather forecasts advising of the dangers of heat stress.<br />
Agricultural Meteorology Division, India Meteorological Department(IMD), Pune looks into minimizing the<br />
impact of adverse weather on crops and to make use of crop-weather relationships to boost agricultural<br />
production. The Agricultural Meteorology Division was established at Pune in 1932 and from its inception<br />
the Division supports and participates in multi-disciplinary activities in this field. It is also the centre for<br />
research programmes in agricultural meteorology and has field units in various parts of the country.<br />
Besides, forecasts and advisories for farmers are issued by IMD’s Forecasting Offices located at different<br />
State capitals.<br />
COMMUNITY AWARENESS<br />
There appears to be a significant lack of community awareness of the risks associated with heat wave,<br />
even though several parts of the country experience such events with some regularity. It is a widely<br />
overlooked, even unknown, killer. It is ideal to create awareness among the communities and ask them to<br />
take suitable precautionary steps during the peak summer months. Media and <strong>Community</strong> education can<br />
be launched prior to the onset of the heatwave conditions.<br />
WEB RESOURCES<br />
http://imdagrimet.org/ Website of Agricultural Meteorology Division, IMD, Pune<br />
http://www.ncmrwf.gov.in/ Website of National Centre for Medium Range Weather Forecasting<br />
http://www.imd.ernet.in/ website of India Meteorological Department<br />
U R B A N S T R U C T U R E F I R E S<br />
Fires are very dangerous. It is an event of something burning and is<br />
often destructive taking up toll of life and property. It is observed that<br />
more people die in fires than in cyclones, earthquakes, floods and all<br />
other natural disasters combined.<br />
The most common human-caused hazard is fire in large occupied<br />
buildings and in slums built of combustible materials. Causes can be<br />
accidental or deliberate, but unless structures are built to safe fire<br />
standards as mentioned in the National Building Code, and sound<br />
emergency procedures are used, heavy loss of life can result.<br />
There are numerous causes of Fire. It could be<br />
1. Heating sources are often causes of Fire. Space heaters, electric heaters<br />
“ t o w a r d s s a f e r I N D I A ” 49
and fireplaces should be used with caution.<br />
2. Cooking accidents are a major cause of home fires and cause us a lot of concern. Fires can result due to<br />
unattended cooking or due to mechanical failure of the stove or any cooking equipment.<br />
3. Electrical wiring can cause a fire if it is not large enough to carry the load being supplied. Overheating of<br />
electrical appliances, poor wiring connections, use of unauthorized appliances, multi-point adaptors can result in<br />
fires starting.<br />
4. Rubbish and Waste Materials that are left to accumulate can easily contribute to the spread of fire; they are also<br />
a place for malicious fires to be started. Make sure that you remove all waste materials from the workplace on a<br />
regular basis and place them in a suitable container located in a safe position outside the building premises. Do not<br />
burn rubbish on bonfire, even if it is thought safe to do so. They can easily get out of control and spread fire to<br />
nearby buildings or structures.<br />
5. Combustible Materials such as packing materials, glues, solvents, flammable liquids or gases stored in work<br />
place can be extremely dangerous. It is recommended to store materials both in terms of required quantity and in a<br />
secure area outside the premises.<br />
6. Hazardous Materials such as paints, solvents, adhesive, chemicals or gas cylinders should be kept in separate<br />
storage areas and well away from any sources of ignition.<br />
7. Arson and Deliberate Fire Setting is also a cause.<br />
8. Smoking is also a major cause of fire.<br />
WEB RESOURCES<br />
www.ifeindia.org; www.fire-wind.net;<br />
T R A N S P O R T A C C I D E N T S<br />
Source: www.kingoftheroad.com<br />
Road network is laid for better connectivity<br />
and service but at the same time the number<br />
of accidents is also on the rise. The main<br />
causes are the violation of traffic regulations,<br />
speeding, drunk driving and poor<br />
maintenance of the vehicle and the roads. All<br />
these reasons add to the rising number of<br />
accidents and road fatalities.<br />
India has one of the highest accident rates in<br />
the world. Every year more than 300.000<br />
accidents are reported. Fatality rate is as<br />
high as 60,000. Studies on accidents, the<br />
world over, have shown that the human<br />
factor is responsible for a majority of<br />
accidents.<br />
Source: wwcw.the-week.com<br />
Many factors govern the safety of<br />
passenger in an aircraft. It include<br />
technical problems, fire, landing and<br />
take off conditions, the environment an<br />
airline operates in (mountainous<br />
terrain or frequent storms), factors like<br />
airport security in cases of hijackings,<br />
bombing attempts etc.<br />
The most common types of rail<br />
accident are derailment due to lack<br />
of maintenance, aging<br />
infrastructure, collateral hazards<br />
(ground shaking during an<br />
earthquake, rock fall on tracks after<br />
a landslide etc causing damage to<br />
railway tracks) human error or<br />
sabotage. Various type of<br />
In India, vehicle users are the causative<br />
dangerous cargo are also<br />
factor, in 70% of the road accidents.<br />
transported such as fuel oil<br />
Pedestrians are responsible for 4.1% of the<br />
products, etc.<br />
road accidents and poor condition of the<br />
In the picture, bogies of the derailed<br />
“ t o w a r d s Bangalore s aExpress f e lying r on I the N D I A ” 50<br />
roads accounts for about 0.4% of the<br />
accidents. It is evident, that nearly 80% of<br />
the accidents occur due to bad driving habits<br />
and human error.<br />
tracks near Pendakal station, 250<br />
km south of Hyderabad, on Dec 21<br />
2002. 20 persons were killed and
CHAPTER 11<br />
EFFECTS OF NATURAL HAZARD ON ECONOMY &<br />
DEVELOPMENT<br />
700<br />
Earthquake, Gujarat<br />
26 Jan 2001, 13805<br />
lives lost<br />
Tsunami, 26 Dec 2004,<br />
more than 10000 lives lost<br />
Losses in US dollars (2002 values)<br />
Locations of some major Natural <strong>Disasters</strong> in India<br />
600<br />
500<br />
400<br />
300<br />
While no country in the world is entirely<br />
safe, lack of capacity to limit the impact of<br />
hazards remains a major burden for<br />
developing countries. An estimated 97% of<br />
natural disaster related deaths each year<br />
occur in developing countries and, although<br />
smaller in absolute figures, the percentage<br />
of economic loss in relation to the Gross<br />
National Product (GNP) in developing<br />
countries far exceeds the ones in developed<br />
countries.<br />
Natural disasters are a potentially serious<br />
shock to an economy. The <strong>United</strong> <strong>Nations</strong><br />
estimated the total cost of disasters<br />
worldwide during the 1980s at $120 billion<br />
(in constant (1990) US dollars). Moreover,<br />
there is clear evidence of a rising trend, with<br />
total costs increasing from $70 billion in the<br />
1970s and $40 billion in the 1960s.<br />
These figures are typically based on only<br />
the direct, visible, financial impacts of a<br />
disaster such as damage to homes,<br />
hospitals, schools, factories, infrastructure<br />
and crops.<br />
The true costs of disasters, taking into<br />
account less quantifiable effects such as the<br />
loss of personal belongings or jobs, widening<br />
trade or government budget deficits, or the<br />
increasing scale & depth of poverty, are<br />
even higher.<br />
200<br />
100<br />
0<br />
1950-1959 1960-1969 1970-1979 1980-1989 1990-1999<br />
Source: Munich Re<br />
VULNERABILITY<br />
Vulnerability to disasters is a function of<br />
human action and behavior. It describes<br />
“ t o w a r d s s a f e r I N D I A ” 51<br />
Economic Losses due to Natural <strong>Disasters</strong> from 1950 -2000
the degree to which a socio-economic system or physical assets are either susceptible or resilient to the<br />
impact of natural hazards. It is determined by a combination of several factors, including awareness of<br />
hazards, the condition of human settlements 250<br />
and infrastructure, public policy &<br />
administration, the wealth of a given society<br />
200<br />
and organized abilities in all fields of<br />
disaster and risk management.<br />
150<br />
Lack of awareness among the public and<br />
decision-makers about factors and human<br />
activities that contribute to environmental<br />
100<br />
degradation and disaster vulnerability are<br />
aggravating these trends.<br />
50<br />
There is a close correlation between the<br />
trends of increased demographic pressure<br />
especially in developing countries, and 1970 1980 1990<br />
2000<br />
particularly in least developed countries, Source: Hazard, Risk and Disaster – Bill McGuire<br />
escalated environmental degradation, Natural disaster trends worldwide:1971 - 2000<br />
increased human vulnerability and the<br />
intensity of the impact of hazards. For example, river and lake floods are aggravated or even caused by<br />
deforestation, which causes erosion and clogs rivers, siltation of riverbeds and other factors. Poverty and<br />
hazard vulnerability is integrally linked and mutually reinforcing.<br />
The accelerated, and often uncontrolled, growth of cities has contributed to the ecological transformation<br />
of their immediate surroundings (pressure on scarce land, deforestation, etc.) In addition, the lack of<br />
appropriate drainage systems and/or sealing (use of concrete and asphalt) increase the volume and<br />
speed of rainfall runoff thus making many cities more vulnerable to flash floods.<br />
Recent catastrophic earthquakes highlight other key deficiencies and trends in the approach to disaster<br />
risk reduction, such as a poor understanding by decision makers of seismic related risk, as well as the<br />
tendency of some builders, to use the cheapest designs and construction materials to increase shortterm<br />
economic returns on their investment.<br />
ECONOMIC VULNERABILITY<br />
The degree of severity and nature of impact of a disaster depend on a range of factors. These include the<br />
type of hazard, the size of the economy and its economic structure, and the sectors affected by the<br />
disaster.<br />
Looking at hazard types, we see that droughts do not damage buildings or physical structures but their<br />
lengthy duration creates other problems: for example, agricultural households may be forced into<br />
considerable debt following the loss of crops & livestock.<br />
In contrast, sudden-onset disasters such as floods or earthquakes have a direct impact on infrastructure<br />
and productive facilities and resources, as well as on social resources and infrastructure, especially<br />
housing.<br />
The economic costs of disasters can be broken down into three types.<br />
Direct costs<br />
- relate to the capital cost of assets (such as buildings, other physical infrastructure, raw materials and<br />
the like) destroyed or damaged in a disaster. Crop losses are often included in such calculations.<br />
“ t o w a r d s s a f e r I N D I A ” 52
Indirect costs<br />
- refer to the damage to the flow of goods and services. They include, for example, lower output from<br />
factories that have been destroyed or damaged; loss of sales income due to damaged infrastructure such<br />
as roads and ports; and the costs associated with having to purchase more expensive materials or other<br />
inputs where normal - cheaper - sources of supply are affected. They also include the costs of medical<br />
expenses and lost productivity arising from increased disease, injury and death.<br />
Secondary effects<br />
- concern the short- and long-term impacts of a disaster on overall economic performance. These may<br />
include deterioration in external trade and government budget balances, the reallocation of planned<br />
government spending and increased indebtedness. <strong>Disasters</strong> can also affect the pattern of income<br />
distribution or the scale and incidence of poverty.<br />
Some sectors of the economy are more vulnerable to hazards than others. Most obviously, the agricultural<br />
sector is potentially vulnerable, implying that countries which rely heavily on agriculture may be<br />
particularly threatened by hazards. However, even here, the types of crops cultivated and techniques for<br />
growing them play a role in determining the scale of vulnerability. As the Philippines has learnt to its<br />
expense, new hybrid varieties of coconut trees, while giving high yields, are much more vulnerable to<br />
typhoons than traditional varieties which have longer root systems and so are better able to withstand<br />
very strong winds.<br />
DEVELOPED & DEVELOPING COUNTRIES<br />
As one moves along the spectrum from developing to highly developed economies, the nature of a<br />
disaster's impact alters. The absolute cost of physical damage increases, but its relative cost (as a<br />
proportion of national or local wealth) decreases; and the number of lives lost also declines. The rise<br />
in the cost of disasters reflects increase in the quality and quantity of property and infrastructure.<br />
Wealthier countries can also afford increasingly sophisticated early warning and communications<br />
systems, allowing people more time to move to safe places and resulting in fewer deaths and injuries.<br />
ECONOMIC LOSS AS AN INDICATOR OF DISASTER IMPACT<br />
Economic losses are often reported with reference to only the direct losses from infrastructure and<br />
assets destroyed during large-scale disasters. They seldom take into account the economic<br />
implications of reduced levels of production linked to damage in productive assets or infrastructure<br />
that in turn access to raw materials, energy labour or markets.<br />
The use of economic loss indicator of disaster impact on development varies for different natural<br />
hazards. For example, earthquakes often appear to trigger the most expensive disasters, but losses<br />
are concentrated. Individual floods may not record large losses, but total human impact may be<br />
higher. Asian countries experience the greatest collective economic losses to disaster.<br />
Economic Development<br />
Social Development<br />
Disaster<br />
Limits<br />
Developments<br />
Development<br />
causes<br />
disaster risk<br />
Development<br />
reduces<br />
disaster risk<br />
Destruction of fixed assets. Loss of<br />
production capacity, market access or<br />
material inputs. Damage to transport,<br />
communications or energy infrastructure.<br />
Erosion of livelihoods, savings & physical<br />
capital.<br />
Unsuitable development practices that<br />
create wealth for some at the expense of<br />
unsafe working or living conditions for<br />
others or degrade the environment.<br />
Access to adequate drinking water, food,<br />
waste management and a secure dwelling<br />
increases people’s resiliency. Trade and<br />
technology can reduce poverty. Investing<br />
Destruction of health or education<br />
infrastructure and personnel. Death,<br />
disablement or migration of key social<br />
actors leading to an erosion of social<br />
capital.<br />
Development paths generating<br />
cultural norms that promote social<br />
isolation or political exclusion.<br />
Building community cohesion,<br />
recognizing excluded individuals or<br />
social groups (such as women)and<br />
providing opportunities for greater<br />
“ t o w a r d s s a f e r I N D I A ” 53
in financial mechanisms and social<br />
security can cushion against vulnerability.<br />
involvement in decision-making,<br />
enhanced educational and health<br />
capacity increases resiliency.<br />
DISASTER LIMITS ECONOMIC DEVELOPMENT<br />
<strong>Disasters</strong> can wipe out the grains of economic development. Catastrophic disasters result in the<br />
destruction of fixed assets and physical capital, interruption of production and trade, diversion and<br />
depletion of savings and public and private investment. While absolute level of economic loss are greater<br />
in developed countries due to the far higher density and cost of infrastructure and production levels, lessdeveloped<br />
countries suffer higher levels of relative loss when seen as a proportion of Gross Domestic<br />
Product (GDP).<br />
At the local level, disasters can seriously impact household livelihoods and push already vulnerable<br />
groups into poverty. The loss of income earners, through death or injury, the interruption of production or<br />
access to markets and the destruction of productive assets, such as home-based workshops, are all<br />
examples of ways in which disasters affect local & household economies. The capacity of a household or<br />
local community to absorb the impact and recover from a major natural hazard will be seriously limited if<br />
already weakened overtime by a series of smaller-scale losses.<br />
DISASTER LIMITS SOCIAL DEVELOPMENT<br />
A population that has weakened and depleted by natural disaster, particularly when it coincides with<br />
losses from malnutrition etc., will be less likely to have the organizational capacity to maintain irrigation<br />
works, bunds in fields for water harvesting, hillslope terraces, shelter belts. Without these social assets<br />
communities become more vulnerable.<br />
In addition to the loss of social assets themselves, there are many examples of disaster events<br />
destroying the gains of the health, sanitation, drinking water, housing and education sectors that underpin<br />
social development. Examples include the Kutch-Bhuj earthquake in 2001, which completely damaged<br />
district hospital, 992 primary schools & 18 secondary schools; or the cyclone that hit Orissa, India in<br />
1999, which led to the contamination of drinking water wells and damaged many schools in the direct<br />
impact of a single event.<br />
Women suffer additional stresses in disaster situations and also bear a disproportionate burden of the<br />
additional domestic & income-generating work necessary for survival following a disaster event. When<br />
women are exposed to additional stresses, the level of social development is reduced.<br />
DEVELOPMENT PROJECTS<br />
Projects should take into account risk assessment at the appraisal stage. Environmental Impact Reviews<br />
should systematically include a section on hazard proneness and consider disaster reduction measures<br />
where appropriate, with particular regard to the protection of lifeline infrastructure and critical facilities. In<br />
rural programmes and drought prone areas, specific regard should be given to food-security and<br />
promotion of agriculture techniques and inter-cropping that reduce hazard-related agriculture losses.<br />
Disaster reduction policies and measures need to be implemented, with a two-fold<br />
aim: to enable societies to be resilient to natural hazards while ensuring that development efforts do not<br />
increase the vulnerability to these hazards.<br />
“ t o w a r d s s a f e r I N D I A ” 54
CHAPTER 12<br />
ROLE OF POLICY MAKERS IN DISASTER RISK<br />
REDUCTION<br />
Disaster risk management falls under global trends of causing policymakers to rethink the institutional<br />
setup of governments, and the roles and responsibilities of different levels of government in achieving<br />
developmental objectives. Actors such as local governments, municipal authorities and local communities<br />
play an increasingly important role in emerging national disaster risk management systems.<br />
There is a wide variety of ways in which disaster risk can be reduced as part of development policies.<br />
These involve institutional reforms, improved analytical and methodological capabilities, education,<br />
awareness, financial planning and political commitment. Disaster reduction is aimed at motivating<br />
societies at risk to become engaged in the conscious management of risk and reduction of vulnerability.<br />
This must expand beyond traditional response (Relief & Rehabilitation) to defense against the impact of<br />
natural hazards, as an ongoing process that does not focus on singular disaster events.<br />
Based on the lessons from the International Decade for Natural Disaster Reduction (IDNDR, 1990-99)<br />
four overriding objectives have been formulated in order to effectively reduce the impact of disasters, as<br />
the guiding principles for the International Strategy for Disaster Reduction. These overall objectives set<br />
the stage for the course of action for Governments, regional bodies and civil society organizations:<br />
• Obtaining the commitment from public authorities. This objective needs to be addressed<br />
through an increased inter-sectoral coordination at all levels, risk management strategies, the<br />
allocation of appropriate resources including development of new funding mechanisms.<br />
Disaster reduction should be dealt with as a separate policy issue as well as cross cutting in<br />
relevant fields of government (public works, rural development, health, agriculture, food<br />
security, environment, etc.) aiming at policy integration among the various sectors.<br />
• Increasing public awareness and public participation on how to reduce vulnerability to<br />
hazards. This involves programmes related to formal and non- formal education and needs to<br />
be addressed through public information, education and multi-disciplinary professional<br />
training.<br />
• Stimulating inter-disciplinary and inter-sectoral partnerships and the expansion of<br />
risk reduction networking amongst governments at national and local levels, greater<br />
involvement of the legislators, private sector, academic institutions, NGOs and communitybased<br />
organizations (CBOs). This calls for strong coordination mechanisms, such as<br />
appropriate institutional structures for disaster management, preparedness, emergency<br />
response and early warning, as well as the incorporation of disaster reduction concerns in<br />
national/state planning processes. Efforts to link natural resource management with disaster<br />
reduction should also be encouraged.<br />
• Fostering better understanding and knowledge of the causes of disasters through<br />
the transfer and exchange of experience and greater access to relevant data and<br />
information. The issues to be addressed in this context are the assessment and analysis of<br />
socio-economic impacts of disasters, disaster databases, coping<br />
strategies of different social groups, early warning processes, as well as the promotion<br />
of scientific research, valuing of indigenous knowledge and the development and<br />
transfer of knowledge and technologies.<br />
• The causes and impacts of natural hazards some times occur in a number of neighbouring<br />
States, highlighting the need for a harmonized approach in the management of such a<br />
“ t o w a r d s s a f e r I N D I A ” 55
phenomenon. Efficiency can be optimized via exchange of experiences amongst states and<br />
constructive dialogue amongst stakeholders via participatory processes. Prioritization of tasks<br />
in the various phases of disaster management (prevention, preparedness, response,<br />
rehabilitation and recovery) has to be agreed upon to cope with such situations.<br />
COURSE FOR SPECIFIC ACTION<br />
The policy makers can play a very vital role for fulfillment of the objectives outlined above. The<br />
following areas should be considered as key elements for development actions:<br />
1. To help create the legislative instruments in the State for framing of Disaster Management Policy.<br />
2. Capacity building and strengthening of institutional arrangements at all levels<br />
to address risk reduction as an ongoing function, including disaster reduction related<br />
legislation, covering land- use regulation, building codes and reinforced links to<br />
environmental protection. Capacity building at State level needs to include the<br />
development of an integrated disaster risk management plan that covers areas of risk<br />
assessment, early warning systems, training programmes, as well as<br />
emergency response management, recovery resources, including the strengthening of<br />
community based organizations. It also includes the increased capacity and sectoral<br />
synergies for sustainable management of forest and water-resources.<br />
3. Development of public educational programmes and campaigns on the relationships between<br />
sustainable development, natural hazards, vulnerabilities and disaster to enhance disaster reduction<br />
measures. The process starts in schools with educational programmes including curricula revision,<br />
teachers training and development of resource centres. It needs to expand to all levels of society by<br />
training efforts, with special emphasis on professionals and community based leaders and<br />
organizations.<br />
4. Creating and implementing comprehensive urban development strategies and land use plans,<br />
which provide a number of opportunities to mitigate damages caused by hazards. As location is the<br />
key factor, which determines the level of risk associated with a hazard, land- use plans and mapping<br />
should be used as tools to identify the most suitable usage for vulnerable areas (e.g., location of<br />
buildings, roads, power plants, storage of fuels). Local governments need to play an increasing role<br />
with regard to factors such as building standards, land and property markets, land and housing<br />
taxation, planning processes and infrastructure construction and management.<br />
5. Legally mandate building codes: - To improve resistance to the effects of natural hazards, better<br />
building practices are essential. Until there are building codes with the force of law, they will not be<br />
taken seriously by the construction industry. Such codes must incorporate modern technical<br />
standards.<br />
6. Enforce codes effectively:- Legally mandating codes is not enough; they must be enforced. Great<br />
care should be exercised in selecting the enforcement system for the codes, since some are easier to<br />
ignore, manipulate, or corrupt than others.<br />
7. To help develop techno-financial regime.<br />
- Allotment of some percentage development funds for disaster mitigation.<br />
- To earmark some percentage of Local Area Development Funds for retrofitting of lifeline buildings (like<br />
schools, hospitals etc.).<br />
“ t o w a r d s s a f e r I N D I A ” 56
ANNEXURE A<br />
DISASTER MANAGEMENT – INSTITUTIONAL<br />
ARRANGEMENTS IN INDIA<br />
The institutional and policy mechanisms for carrying out response, relief and rehabilitation have been<br />
well-established since Independence. These mechanisms have proved to be robust and effective insofar<br />
as response, relief and rehabilitation are concerned. The changed policy/approach, however, mandates a<br />
priority to pre-disaster aspects of mitigation, prevention and preparedness and new institutional<br />
mechanisms are being put in place to address the policy change.<br />
CENTRAL LEVEL<br />
Although the primary responsibility for disaster management is of the concerned state Governments, the<br />
Central Government plays a key role for providing financial and logistic support in case of major disasters<br />
and co-ordinate the effort of all Central Ministries/Departments/Organizations. Cabinet Committee on<br />
Natural Calamities is placed at the apex level. The scope of the Committee has also been enlarged so as<br />
to address mitigation and preparedness measures also.<br />
Cabinet Secretary, who is the highest executive officer, heads the National Crisis Management<br />
Committee (NCMC). Secretaries of all the concerned Ministries/Departments as well as organizations are<br />
the members of the Committee. The NCMC gives direction to the Crisis Management Group as deemed<br />
necessary. The Secretary, Ministry of Home Affairs is responsible for ensuring that all developments are<br />
brought to the notice of the NCMC promptly. The NCMC gives direction to any Ministries/Departments/<br />
Organizations for specific action needed for meeting the crisis situation.<br />
The Central Relief Commissioner in the Ministry of Home Affairs is the Chairman of the Crisis<br />
Management Group (CMG) consisting of senior officers (called nodal officers) from various concerned<br />
Ministries. The CMG’s functions are to review every year contingency plans formulated by various<br />
Ministries/Departments/Organizations in their respective sectors, measures required for dealing with a<br />
natural disaster, coordinate the activities of the Central Ministries and the State Governments in relation<br />
to disaster preparedness and relief and to obtain information from the nodal officers on measures relating<br />
to the above. The CMG, in the event of a disaster, meets frequently to review the relief operations and<br />
extend all possible assistance required by the affected States to overcome the situation effectively. The<br />
Resident Commissioner of the affected state is also associated with such meetings.<br />
Mitigation, preparedness and response are multi-disciplinary functions, involving a number of<br />
Ministries/Departments. Institutional mechanisms which would facilitate this inter-disciplinary approach<br />
are being put in place. It is proposed to create Disaster/Emergency Management Authorities, both at the<br />
National and State levels, with representatives from the relevant Ministries/Departments to bring about<br />
this coordinated and multi-disciplinary with experts covering a large number of branches. The National<br />
Emergency Management Authority is proposed to be constituted. The organization will be multidisciplinary<br />
with experts covering a large number of branches. The National Emergency Management<br />
Authority is proposed as a combined Secretariat/Directorate structure – a structure which will be an<br />
integral part of the Government while, at the same time, retaining the flexibility of a field organization.<br />
“ t o w a r d s s a f e r I N D I A ” 57
The Authority will be responsible for:<br />
• Providing necessary support and assistance to State Governments by way of resource data,<br />
macro-management of emergency response, specialized emergency response teams, sharing<br />
of disaster related data base etc.<br />
• Coordinating/mandating Government’s policies for disaster reduction/mitigation<br />
• Ensuring adequate preparedness at all levels in order to meet disasters<br />
• Coordinating response to a disaster when it strikes<br />
• Assisting the Provincial Government in coordinating post disaster relief<br />
• Coordinating resources of all National Government Department/agencies involved.<br />
• Monitor and introduce a culture of building requisite features of disaster mitigation in all<br />
development plans and programmes.<br />
• Any other issues of work, which may be entrusted to it by the Government.<br />
STATE LEVEL<br />
The States have also been asked to set up Disaster Management Authorities under the Chief Minister<br />
with Ministers of relevant Departments as members. 11 States and UTs – Tamil Nadu, Arunachal<br />
Pradesh, Uttaranchal, Orissa, Gujarat, Kerala, Nagaland, Rajasthan, Delhi, A&N administration and<br />
Chandigarh Administration have notified the authority. The other States are in the process of setting up<br />
similar authorities.<br />
Re-structuring of the Relief Department in the States: At the State level, the work of post calamity<br />
relief was being handled by the Departments of Relief & Rehabilitation. The Government of India is<br />
working with the State Governments to restructure the Departments of Relief & Rehabilitation into<br />
Departments of Disaster Management with an enhanced area of responsibility to include mitigation and<br />
preparedness apart from their present responsibilities of relief and rehabilitation. The changeover has<br />
already happened in 11 States/UTs - <strong>And</strong>hra Pradesh, Arunachal Pradesh, Bihar, Himachal Pradesh,<br />
Rajasthan, Tamil Nadu, Uttaranchal, Nagaland, <strong>And</strong>aman & Nicobar Administration, Sikkim and<br />
Lakshadweep. The change is under process in other States.<br />
The States have been advised to restructure/re-group the officers/staff within the Department of Disaster<br />
Management with definite functions to pursue the holistic approach to disaster management. The four<br />
functional groups to be assigned with specific tasks within the departments are as indicted below:-<br />
• Functional Group 1: Hazard Mitigation<br />
• Functional Group 2: Preparedness and Capacity Building<br />
• Functional Group 3: Relief and Response<br />
• Functional Group 4: Administration and Finance<br />
DISTRICT LEVEL<br />
At the district level, the District Magistrate who is the chief coordinator will be the focal point for<br />
coordinating all activities relating to prevention, mitigation and preparedness apart from his existing<br />
responsibilities pertaining to response and relief. The District Coordination and Relief Committee is being<br />
reconstituted/ re-designated into Disaster Management Committees with officers from relevant<br />
departments being added as members. Because of its enhanced mandate of mitigation and prevention,<br />
the district heads of the departments engaged in development are now being included in the Committee<br />
so that mitigation and prevention is mainstreamed into the district plan. The existing system of drawing<br />
up preparedness and response plans will continue. There will, however, also be a long term mitigation<br />
plan. District Disaster Management Committees have already been constituted in 256 districts and are in<br />
the process of being constituted in the remaining districts.<br />
BLOCK/TALUKA LEVEL<br />
Similarly, sub-divisional and Block/Taluka level Disaster Management Committees are also being<br />
constituted. At the village level Disaster Management Committees and Disaster Management Teams are<br />
“ t o w a r d s s a f e r I N D I A ” 58
eing constituted. Each village in multi-hazard prone district will have a Disaster Management Plan. The<br />
process of drafting the plans at all levels has already begun. The Disaster Management<br />
Committee which draws up the plans consists of elected representatives at the village level, local<br />
authorities; Government functionaries including doctors/paramedics of primary health centres located in<br />
the village, primary school teachers etc. The plan encompasses prevention, mitigation and preparedness<br />
measures. The Disaster Management Teams at the village level will consist of members of youth<br />
organizations like Nehru Yuvak Kendra Sanghathan (NYKS) and National Service Scheme (NSS) and<br />
other nongovernmental organizations as well as able bodied volunteers from the village.<br />
The teams are provided basic training in evacuation, evacuation, search and rescue, first aid trauma<br />
counseling etc. The Disaster Management Committee will review the disaster management plan at least<br />
once in a year. It would also generate awareness among the people in the village about dos’ and don’ts<br />
for specific hazards depending on the vulnerability of the village. A large number of village level Disaster<br />
Management Committees and Disaster Management Teams have already been constituted.<br />
“ t o w a r d s s a f e r I N D I A ” 59
ANNEXURE B<br />
LIST OF RESOURCE INSTITUTIONS<br />
National Institute of Disaster Management (NIDM)<br />
(Ministry of Home Affairs)<br />
I.P. Estate, Ring Road<br />
New Delhi - 110002<br />
Tel.Fax : 91-11-23702442<br />
http://www.nidm.net/<br />
Building Materials and Technology Promotion Council<br />
(BMTPC)<br />
Core 5 -A, First Floor ,<br />
India Habitat Centre, Lodi Road<br />
New Delhi- 110 003<br />
Tel. 91-11-24638096, 24638097, 24651243, 24636759 Fax:<br />
91-11-24642849<br />
E-mail: info@bmtpc.org<br />
www.bmtpc.org<br />
Department of Science & Technology<br />
Technology Bhavan,<br />
New Mehrauli Road, New Delhi - 110016<br />
Tel: 91-11-26567373, 26962819<br />
Fax: 91-11-26864570, 26862418<br />
Email: dstinfo@alpha.nic.in<br />
http://dst.gov.in/<br />
Indian Council of Agricultural Research<br />
Krishi Bhavan, Dr. Rajendra Prasad Road,<br />
New Delhi-110 001<br />
Email: gsi_chq@vsnl.com<br />
http://www.icar.org.in/<br />
Indian Institute of Remote Sensing<br />
National Remote Sensing Agency<br />
Dept. of Space, Govt. of India<br />
4, Kalidas Road,<br />
Dehradun - 248 001<br />
Tel: 91 - (0)135 - 2744583<br />
91 - (0)135 - 2741987, 2748041<br />
http://www.iirs-nrsa.org/<br />
Disaster Management Institute<br />
Paryavaran Parisar,<br />
E-5, Arera Colony,<br />
Bhopal - 462 016.<br />
Tel: 91-0755-2466715, 2461348,2461538.<br />
Fax: 91-755-2466653<br />
E-mail:dmibpl@sancharnet.in<br />
Web: www.dmibpl.org<br />
Bureau of Indian Standards (BIS)<br />
Manak Bhavan<br />
9 Bahadur Shah Zafar Marg<br />
New Delhi 110 002, India<br />
Tel : 23230131, 23233375, 23239402 (10 lines)<br />
Fax : 23234062, 23239399, 23239382<br />
Email: info@bis.org.in<br />
www.bis.org.in<br />
India Meteorological Department (IMD)<br />
Mausam Bhawan,<br />
Lodhi Road,<br />
New Delhi-110003<br />
http://www.imd.ernet.in/<br />
National Institute of Hydrology<br />
Jal Vigyan Bhawan,<br />
Roorkee - 247 667 (Uttaranchal)<br />
Tel: 91 - 1332 – 272106/272123<br />
Email: root@nih.ernet.in<br />
Geological Survey of India<br />
27 Jawaharlal Nehru road,<br />
Kolkata 700016.<br />
Tel: 91-33-22861641/65/73/72<br />
91-33-22861656<br />
http://www.gsi.gov.in/<br />
Center for Disaster Management<br />
Yeshwantrao Chavan Academy of Development<br />
Administration (YASHADA),<br />
Rajbhavan Complex,<br />
Baner Road,<br />
Pune: 411 007<br />
Tel: + 91- 20 - 25608000<br />
After Office Hours: + 91- 20 - 25608000<br />
Fax : + 91- 20 - 25659135.<br />
E-mail: yashada@vsnl.com<br />
www.yashada.org<br />
National Information Centre of Earthquake Engineering<br />
(NICEE)<br />
IIT, Kanpur<br />
Department of Civil Engineering<br />
Indian Institute of Technology Kanpur<br />
Kanpur 208016<br />
Tel: 91-0512-2597866<br />
http://www.nicee.org<br />
“ t o w a r d s s a f e r I N D I A ” 60
Center for Disaster Mitigation & Management<br />
Anna University<br />
Chennai-600025<br />
Tel: 91-044-2301772/2350397<br />
Council of Architecture (CoA)<br />
India Habitat Centre,<br />
Core 6A, 1st Floor,<br />
Lodhi Road,<br />
New Delhi-110003<br />
Tel: 91-11-24654172/24648415<br />
Fax: 91-11-24647746<br />
Email: coa@ndf.vsnl.net.in<br />
http://www.coa-india.org<br />
Lal Bahadur Shastri National Academy of Administration<br />
(LBSNAA)<br />
Charieville,<br />
Mussoorie-248179<br />
Tel :0135-2632289<br />
Fax:0135-2632350,2632720<br />
Central Water Commission (CWC)<br />
Sewa Bhavan,<br />
R.K. Puram,<br />
New Delhi 110 066<br />
Tel: +91-26108855 , 26187232<br />
Disaster Mitigation and Management Centre (DMMC)<br />
Secretariat Campus, Govt. of Uttaranchal<br />
Dehradun -248001 (Uttaranchal), India<br />
Ph: 91-135-2710232, 2710233<br />
Fax: 2710199<br />
E-mail: dmmc_eoc@yahoo.co.in<br />
dmmc_ua@epatra.com<br />
http://gov.ua.nic.in/dmmc/<br />
Indian Institute of Chemical Technology (IICT)<br />
Tarnaka, Hyderabad – 500007<br />
Tel: 91-40-27160123<br />
Fax: 040-27160387; 27160757<br />
http://www.iictindia.org/<br />
North Eastern Council<br />
Secretariat, Taxation Building,<br />
Shillong 793001, Meghalaya<br />
Tel: 0364-2224960<br />
Fax: 0364-2222140<br />
Email: necsect@shillong.meg.nic.in<br />
http://necouncil.nic.in/<br />
Indian Institute of Technology, Guwahati<br />
North Guwahati,<br />
Guwahati 781039<br />
Assam<br />
Tel Nos:<br />
Director: +91 - 361 - 2583000<br />
Registrar: +91 - 361 - 2690761<br />
EPABX: +91 - 361 - 2583000<br />
Fax: +91 - 361 - 2690762<br />
http://www.iitg.ernet.in/<br />
Indian Institute of Engineers<br />
Bahadur Shah Zafar Marg<br />
New Delhi 110 002<br />
Tel: (011) 2337 9948 / 2337 9052<br />
(011) 2337 0489<br />
E-Mail : ieidsc@del3.vsnl.net.in<br />
Web : http://www.ieidsc.org<br />
Institute of Town Planners India<br />
4-A Ring Road, I.P. Estate<br />
New Delhi 110002<br />
Tel: 011-23702452, 23702454, 23702455,<br />
23702456,23702457<br />
Fax: 011-23702453<br />
Email: itpidel@giasdl01.vsnl.net.in<br />
http://www.itpindia.org/<br />
Structural Engineering Research Centre (SERC)<br />
CSIR Campus,<br />
Taramani,<br />
Chennai 600 113<br />
Tel: (+91)-(44)-2254-2139/2175<br />
Fax: (+91)-(44)-2254-1508/ 2254-1973<br />
E-mail; director@sercm.org<br />
http://www.sercm.org/<br />
Central Board of Secondary Education (CBSE)<br />
“Shiksha Kendra” 2, community Centre<br />
Preet Vihar, Delhi – 1100092 INDIA<br />
Tel: 91-011-22509252-57/59<br />
Fax: 91-011-22515826<br />
Email: cbsedli@nda.vsnl.net.in<br />
www.cbse.nic.in<br />
Indian National Centre for Ocean Information Services<br />
(INCOIS)<br />
"Ocean Valley",<br />
Gajularamaram B.O,<br />
Via-IDA Jeedimetla S.O,<br />
Hyderabad 500055<br />
Tel: 91-40-23895000<br />
Fax: 91-40-23895001<br />
www.incois.gov.in<br />
National Civil Defence College<br />
Civil Lines,<br />
Nagpur-440 001. (M.S)<br />
Telephone : 91-0712-2531614,2531611,2531772<br />
Fax : 91-0712-531614,<br />
Email :ncdcngp_ngp@sancharnet.in<br />
http://ncdcnagpur.nic.in/<br />
“ t o w a r d s s a f e r I N D I A ” 61
National Disaster Management Division<br />
Ministry of Home Affairs<br />
North Block, New Delhi. India<br />
Tel: 91-11-23093178/23092698/230992795/23092489/23094019<br />
Fax: 91-11-23093750/23092763<br />
Email: ndmindia@nic.in<br />
Website : www.ndmindia.nic.in<br />
“ t o w a r d s s a f e r I N D I A ” 62