Best Practices for Organic Policy - What developing country - UNEP
Best Practices for Organic Policy - What developing country - UNEP
Best Practices for Organic Policy - What developing country - UNEP
Create successful ePaper yourself
Turn your PDF publications into a flip-book with our unique Google optimized e-Paper software.
Agriculture conditions<br />
Annex 3. Denmark<br />
Denmark has a temperate climate, especially suitable <strong>for</strong> growing grain (wheat and barley), which is<br />
done on 60 per cent of the farmland. Most of the grain is used <strong>for</strong> the pig industry, and 23 million pigs<br />
are produced <strong>for</strong> slaughtering every year, three quarters of which are exported. Dairy is another<br />
important sector, <strong>for</strong> both the domestic market and export. In total, two thirds of agricultural<br />
production is exported, which constitutes seven per cent of total Danish exports. Farming represents<br />
2.7 per cent of the GDP 58 , 62 per cent of the Danish surface is cultivated and the proportion of<br />
marginal land is low.<br />
For centuries, farming has been the main industry in Denmark and, even though the impact of farming<br />
in the Danish economy is declining, it still plays a vital role. The number of farms has rapidly<br />
declined as farm size has increased and employment has shifted from primary agriculture to the<br />
processing industry. Owner-occupancy is widespread and the majority of the enterprises within the<br />
Danish food industry are cooperatives owned and governed by the farmers themselves 59 .<br />
<strong>Organic</strong> agriculture<br />
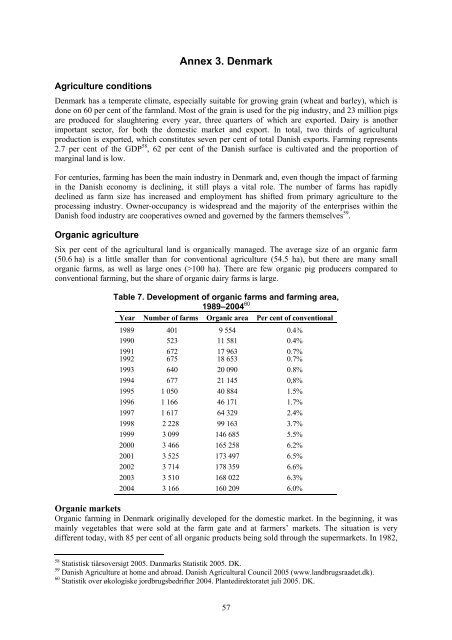
Six per cent of the agricultural land is organically managed. The average size of an organic farm<br />
(50.6 ha) is a little smaller than <strong>for</strong> conventional agriculture (54.5 ha), but there are many small<br />
organic farms, as well as large ones (>100 ha). There are few organic pig producers compared to<br />
conventional farming, but the share of organic dairy farms is large.<br />
Table 7. Development of organic farms and farming area,<br />
1989–2004 60<br />
Year Number of farms <strong>Organic</strong> area Per cent of conventional<br />
1989 401 9 554 0.4%<br />
1990 523 11 581 0.4%<br />
1991<br />
1992<br />
672<br />
675<br />
17 963<br />
18 653<br />
0.7%<br />
0.7%<br />
1993 640 20 090 0.8%<br />
1994 677 21 145 0,8%<br />
1995 1 050 40 884 1.5%<br />
1996 1 166 46 171 1.7%<br />
1997 1 617 64 329 2.4%<br />
1998 2 228 99 163 3.7%<br />
1999 3 099 146 685 5.5%<br />
2000 3 466 165 258 6.2%<br />
2001 3 525 173 497 6.5%<br />
2002 3 714 178 359 6.6%<br />
2003 3 510 168 022 6.3%<br />
2004 3 166 160 209 6.0%<br />
<strong>Organic</strong> markets<br />
<strong>Organic</strong> farming in Denmark originally developed <strong>for</strong> the domestic market. In the beginning, it was<br />
mainly vegetables that were sold at the farm gate and at farmers’ markets. The situation is very<br />
different today, with 85 per cent of all organic products being sold through the supermarkets. In 1982,<br />
58 Statistisk tiårsoversigt 2005. Danmarks Statistik 2005. DK.<br />
59 Danish Agriculture at home and abroad. Danish Agricultural Council 2005 (www.landbrugsraadet.dk).<br />
60 Statistik over økologiske jordbrugsbedrifter 2004. Plantedirektoratet juli 2005. DK.<br />
57


