Fundamentals of Progressive Lens Design - Laramy-K Optical
Fundamentals of Progressive Lens Design - Laramy-K Optical
Fundamentals of Progressive Lens Design - Laramy-K Optical

Create successful ePaper yourself
Turn your PDF publications into a flip-book with our unique Google optimized e-Paper software.
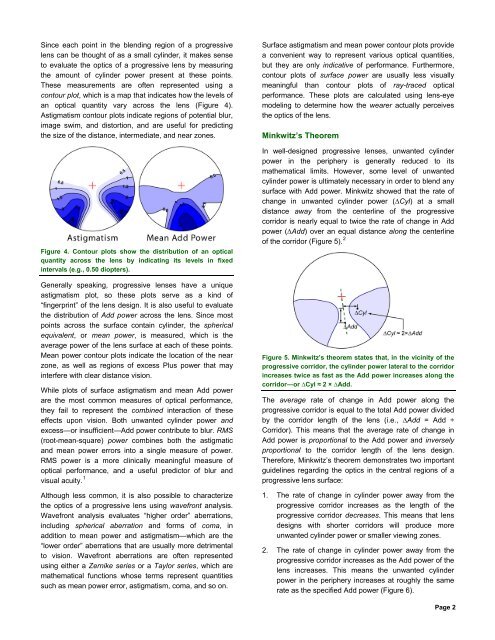
Since each point in the blending region <strong>of</strong> a progressive<br />
lens can be thought <strong>of</strong> as a small cylinder, it makes sense<br />
to evaluate the optics <strong>of</strong> a progressive lens by measuring<br />
the amount <strong>of</strong> cylinder power present at these points.<br />
These measurements are <strong>of</strong>ten represented using a<br />
contour plot, which is a map that indicates how the levels <strong>of</strong><br />
an optical quantity vary across the lens (Figure 4).<br />
Astigmatism contour plots indicate regions <strong>of</strong> potential blur,<br />
image swim, and distortion, and are useful for predicting<br />
the size <strong>of</strong> the distance, intermediate, and near zones.<br />
Figure 4. Contour plots show the distribution <strong>of</strong> an optical<br />
quantity across the lens by indicating its levels in fixed<br />
intervals (e.g., 0.50 diopters).<br />
Generally speaking, progressive lenses have a unique<br />
astigmatism plot, so these plots serve as a kind <strong>of</strong><br />
“fingerprint” <strong>of</strong> the lens design. It is also useful to evaluate<br />
the distribution <strong>of</strong> Add power across the lens. Since most<br />
points across the surface contain cylinder, the spherical<br />
equivalent, or mean power, is measured, which is the<br />
average power <strong>of</strong> the lens surface at each <strong>of</strong> these points.<br />
Mean power contour plots indicate the location <strong>of</strong> the near<br />
zone, as well as regions <strong>of</strong> excess Plus power that may<br />
interfere with clear distance vision.<br />
While plots <strong>of</strong> surface astigmatism and mean Add power<br />
are the most common measures <strong>of</strong> optical performance,<br />
they fail to represent the combined interaction <strong>of</strong> these<br />
effects upon vision. Both unwanted cylinder power and<br />
excess—or insufficient—Add power contribute to blur. RMS<br />
(root-mean-square) power combines both the astigmatic<br />
and mean power errors into a single measure <strong>of</strong> power.<br />
RMS power is a more clinically meaningful measure <strong>of</strong><br />
optical performance, and a useful predictor <strong>of</strong> blur and<br />
visual acuity. 1<br />
Although less common, it is also possible to characterize<br />
the optics <strong>of</strong> a progressive lens using wavefront analysis.<br />
Wavefront analysis evaluates “higher order” aberrations,<br />
including spherical aberration and forms <strong>of</strong> coma, in<br />
addition to mean power and astigmatism—which are the<br />
“lower order” aberrations that are usually more detrimental<br />
to vision. Wavefront aberrations are <strong>of</strong>ten represented<br />
using either a Zernike series or a Taylor series, which are<br />
mathematical functions whose terms represent quantities<br />
such as mean power error, astigmatism, coma, and so on.<br />
Surface astigmatism and mean power contour plots provide<br />
a convenient way to represent various optical quantities,<br />
but they are only indicative <strong>of</strong> performance. Furthermore,<br />
contour plots <strong>of</strong> surface power are usually less visually<br />
meaningful than contour plots <strong>of</strong> ray-traced optical<br />
performance. These plots are calculated using lens-eye<br />
modeling to determine how the wearer actually perceives<br />
the optics <strong>of</strong> the lens.<br />
Minkwitz’s Theorem<br />
In well-designed progressive lenses, unwanted cylinder<br />
power in the periphery is generally reduced to its<br />
mathematical limits. However, some level <strong>of</strong> unwanted<br />
cylinder power is ultimately necessary in order to blend any<br />
surface with Add power. Minkwitz showed that the rate <strong>of</strong><br />
change in unwanted cylinder power (∆Cyl) at a small<br />
distance away from the centerline <strong>of</strong> the progressive<br />
corridor is nearly equal to twice the rate <strong>of</strong> change in Add<br />
power (∆Add) over an equal distance along the centerline<br />
<strong>of</strong> the corridor (Figure 5). 2<br />
Figure 5. Minkwitz’s theorem states that, in the vicinity <strong>of</strong> the<br />
progressive corridor, the cylinder power lateral to the corridor<br />
increases twice as fast as the Add power increases along the<br />
corridor—or ∆Cyl ≈ 2 × ∆Add.<br />
The average rate <strong>of</strong> change in Add power along the<br />
progressive corridor is equal to the total Add power divided<br />
by the corridor length <strong>of</strong> the lens (i.e., ∆Add = Add ÷<br />
Corridor). This means that the average rate <strong>of</strong> change in<br />
Add power is proportional to the Add power and inversely<br />
proportional to the corridor length <strong>of</strong> the lens design.<br />
Therefore, Minkwitz’s theorem demonstrates two important<br />
guidelines regarding the optics in the central regions <strong>of</strong> a<br />
progressive lens surface:<br />
1. The rate <strong>of</strong> change in cylinder power away from the<br />
progressive corridor increases as the length <strong>of</strong> the<br />
progressive corridor decreases. This means that lens<br />
designs with shorter corridors will produce more<br />
unwanted cylinder power or smaller viewing zones.<br />
2. The rate <strong>of</strong> change in cylinder power away from the<br />
progressive corridor increases as the Add power <strong>of</strong> the<br />
lens increases. This means the unwanted cylinder<br />
power in the periphery increases at roughly the same<br />
rate as the specified Add power (Figure 6).<br />
Page 2