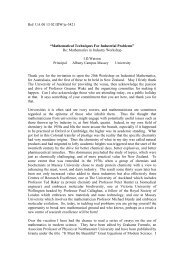
Chapter 2 Modelling Quality and Warranty Cost - Mathematics in ...
Chapter 2 Modelling Quality and Warranty Cost - Mathematics in ...
Chapter 2 Modelling Quality and Warranty Cost - Mathematics in ...

Create successful ePaper yourself
Turn your PDF publications into a flip-book with our unique Google optimized e-Paper software.
34 CHAPTER 2. MODELLING QUALITY AND WARRANTY COST<br />
200<br />
160<br />
154<br />
1<br />
0.9<br />
160<br />
140<br />
150<br />
155<br />
152<br />
150<br />
0.8<br />
0.7<br />
120<br />
100<br />
0 0.5 1<br />
q1<br />
158<br />
150<br />
0 0.5 1<br />
q2<br />
180<br />
148<br />
0 0.5 1<br />
q3<br />
156<br />
SDE<br />
0.6<br />
0.5<br />
100<br />
80<br />
156<br />
154<br />
152<br />
160<br />
140<br />
154<br />
152<br />
0.4<br />
0.3<br />
60<br />
150<br />
0 0.5 1<br />
q4<br />
154<br />
120<br />
0 0.5 1<br />
q5<br />
154<br />
150<br />
0 0.5 1<br />
q6<br />
154<br />
0.2<br />
40<br />
152<br />
153<br />
153.5<br />
0.1<br />
20<br />
150<br />
152<br />
153<br />
0<br />
0 0.1 0.2 0.3 0.4 0.5 0.6 0.7 0.8 0.9 1<br />
Component Failure Rate<br />
(a)<br />
148<br />
0 0.5 1<br />
q7<br />
151<br />
0 0.5 1<br />
q8<br />
(b)<br />
152.5<br />
0 0.5 1<br />
q9<br />
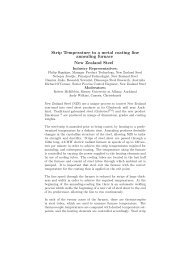
Figure 2.5: Behaviour of the quality function. (a) Trend <strong>in</strong> cost of quality as a function of component<br />
failure rate J K <strong>and</strong> SDE JTv . (b) Trend of cost of quality <strong>in</strong> <strong>in</strong>dividual attributes J>c .<br />
EK Here E ªK , Ežv , E ª v , ÈTN , È ªN , ÈÉP , ÈTg , È ªg , ÈTw , Èx , ÈÉS , È ªS , are constant parameters which need to be determ<strong>in</strong>ed<br />
by fitt<strong>in</strong>g actual data to the model.<br />
The first term of the hardware <strong>and</strong> software portions <strong>in</strong> this model capture the importance of the<br />
component failure J K rate <strong>and</strong> the software development JOv environment <strong>in</strong> the overall cost model. As<br />
decreases, the overall likelihood of failure decreases. This improvement costs more, especially after<br />
JMK<br />
a certa<strong>in</strong> threshold is achieved. Improvements beyond this level are <strong>in</strong>creas<strong>in</strong>gly expensive, as captured<br />
by an exponential function with the negative exponent. On the other h<strong>and</strong>, as JTv SDE <strong>in</strong>creases, the<br />
software development environment becomes better <strong>and</strong> thus costs more. These trends are captured <strong>in</strong><br />
Figures 2.5(a) <strong>and</strong> (b).<br />
The terms collected <strong>in</strong> equation (2.8) under hardware describe the effects of the <strong>in</strong>fant mortality<br />
JON rate , the diagnostics JTP capability <strong>and</strong> the work<strong>in</strong>g environment JOg range . In terms of the overall<br />
hardware quality costs, these are higher-order effects <strong>in</strong> the sense that their contribution may not be<br />
as significant as that of the component failure JMK rate, . This reason<strong>in</strong>g dictated the functional relationships<br />
as be<strong>in</strong>g at best quadratic. Similarly, the costs collected under software describe the effects of<br />
controll<strong>in</strong>g the code JTw complexity <strong>and</strong> the stability JMx <strong>in</strong>dex . These costs contribute less significantly<br />
to the overall quality costs for the software than the software development JTv environment . Indeed,<br />
the effects of <strong>in</strong>creas<strong>in</strong>g the coverage test<strong>in</strong>g <strong>and</strong> decreas<strong>in</strong>g the fault density are captured (to a large<br />
extent) by the cost JTv of , <strong>and</strong> are therefore ignored <strong>in</strong> this cost model. The trends of the cost as each of<br />
these attributes vary is pictured graphically <strong>in</strong> Figure 2.5. The results us<strong>in</strong>g the test data are described<br />
<strong>in</strong> Section 2.8.<br />
2.5 The <strong>Warranty</strong> <strong>Cost</strong>s<br />
<strong>Warranty</strong> costs can be broadly broken up <strong>in</strong>to the hardware <strong>and</strong> software costs, <strong>and</strong> we thus modelled<br />
each of these separately. As <strong>in</strong> the cost of quality, the dom<strong>in</strong>ant factors <strong>in</strong>volved are the component