20-India's Manufacturing Strategy - Global Perspective.pdf - Mimts.org
20-India's Manufacturing Strategy - Global Perspective.pdf - Mimts.org
20-India's Manufacturing Strategy - Global Perspective.pdf - Mimts.org

Create successful ePaper yourself
Turn your PDF publications into a flip-book with our unique Google optimized e-Paper software.
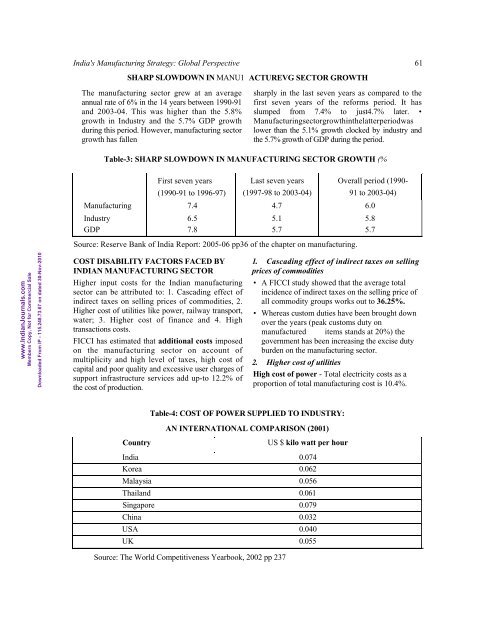
<strong>India's</strong> <strong>Manufacturing</strong> <strong>Strategy</strong>: <strong>Global</strong> <strong>Perspective</strong> 61<br />
SHARP SLOWDOWN IN MANU1<br />
The manufacturing sector grew at an average<br />
annual rate of 6% in the 14 years between 1990-91<br />
and <strong>20</strong>03-04. This was higher than the 5.8%<br />
growth in Industry and the 5.7% GDP growth<br />
during this period. However, manufacturing sector<br />
growth has fallen<br />
ACTUREVG SECTOR GROWTH<br />
sharply in the last seven years as compared to the<br />
first seven years of the reforms period. It has<br />
slumped from 7.4% to just4.7% later. •<br />
<strong>Manufacturing</strong>sect<strong>org</strong>rowthinthelatterperiodwas<br />
lower than the 5.1% growth clocked by industry and<br />
the 5.7% growth of GDP during the period.<br />
Table-3: SHARP SLOWDOWN IN MANUFACTURING SECTOR GROWTH (%<br />
First seven years<br />
(1990-91 to 1996-97)<br />
Last seven years<br />
(1997-98 to <strong>20</strong>03-04)<br />
Overall period (1990-<br />
91 to <strong>20</strong>03-04)<br />
<strong>Manufacturing</strong> 7.4 4.7 6.0<br />
Industry 6.5 5.1 5.8<br />
GDP 7.8 5.7 5.7<br />
Source: Reserve Bank of India Report: <strong>20</strong>05-06 pp36 of the chapter on manufacturing.<br />
www.IndianJournals.com<br />
Members Copy, Not for Commercial Sale<br />
Downloaded From IP - 115.248.73.67 on dated 30-Nov-<strong>20</strong>10<br />
COST DISABILITY FACTORS FACED BY<br />
INDIAN MANUFACTURING SECTOR<br />
Higher input costs for the Indian manufacturing<br />
sector can be attributed to: 1. Cascading effect of<br />
indirect taxes on selling prices of commodities, 2.<br />
Higher cost of utilities like power, railway transport,<br />
water; 3. Higher cost of finance and 4. High<br />
transactions costs.<br />
FICCI has estimated that additional costs imposed<br />
on the manufacturing sector on account of<br />
multiplicity and high level of taxes, high cost of<br />
capital and poor quality and excessive user charges of<br />
support infrastructure services add up-to 12.2% of<br />
the cost of production.<br />
1. Cascading effect of indirect taxes on selling<br />
prices of commodities<br />
• A FICCI study showed that the average total<br />
incidence of indirect taxes on the selling price of<br />
all commodity groups works out to 36.25%.<br />
• Whereas custom duties have been brought down<br />
over the years (peak customs duty on<br />
manufactured items stands at <strong>20</strong>%) the<br />
government has been increasing the excise duty<br />
burden on the manufacturing sector.<br />
2. Higher cost of utilities<br />
High cost of power - Total electricity costs as a<br />
proportion of total manufacturing cost is 10.4%.<br />
Country<br />
Table-4: COST OF POWER SUPPLIED TO INDUSTRY:<br />
AN INTERNATIONAL COMPARISON (<strong>20</strong>01)<br />
US $ kilo watt per hour<br />
India 0.074<br />
Korea 0.062<br />
Malaysia 0.056<br />
Thailand 0.061<br />
Singapore 0.079<br />
China 0.032<br />
USA 0.040<br />
UK 0.055<br />
Source: The World Competitiveness Yearbook, <strong>20</strong>02 pp 237