Transportation & Infrastructure - University of Nevada, Reno
Transportation & Infrastructure - University of Nevada, Reno
Transportation & Infrastructure - University of Nevada, Reno

Create successful ePaper yourself
Turn your PDF publications into a flip-book with our unique Google optimized e-Paper software.
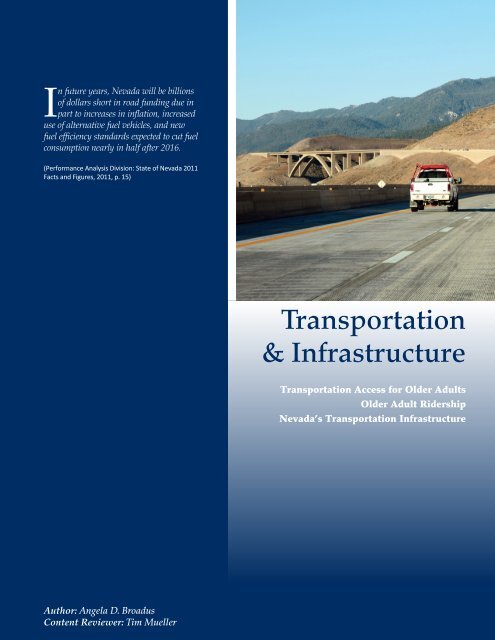
In future years, <strong>Nevada</strong> will be billions<br />
<strong>of</strong> dollars short in road funding due in<br />
part to increases in inflation, increased<br />
use <strong>of</strong> alternative fuel vehicles, and new<br />
fuel efficiency standards expected to cut fuel<br />
consumption nearly in half after 2016.<br />
(Performance Analysis Division: State <strong>of</strong> <strong>Nevada</strong> 2011<br />
Facts and Figures, 2011, p. 15)<br />
<strong>Transportation</strong><br />
& <strong>Infrastructure</strong><br />
<strong>Transportation</strong> Access for Older Adults<br />
Older Adult Ridership<br />
<strong>Nevada</strong>’s <strong>Transportation</strong> <strong>Infrastructure</strong><br />
Author: Angela D. Broadus<br />
Content Reviewer: Tim Mueller
TRANSPORTATION & INFRASTRUCTURE<br />
Highlights<br />
Mobility and transportation safety are crucial to<br />
the health and welfare <strong>of</strong> <strong>Nevada</strong>’s residents and<br />
are <strong>of</strong> utmost concern to the <strong>Nevada</strong> Department<br />
<strong>of</strong> <strong>Transportation</strong> (NDOT) and the Department<br />
<strong>of</strong> Public Safety (DPS). NDOT addresses mobility<br />
needs through various forms <strong>of</strong> public transportation,<br />
administration <strong>of</strong> the government’s Federal Transit<br />
Administration grants, and monitoring rural<br />
transit providers to ensure compliance with federal<br />
guidelines. In <strong>Nevada</strong>’s Strategic Highway Safety<br />
Plan for fiscal year 2012, the DPS also addressed<br />
transportation safety through the identification <strong>of</strong><br />
five areas the DPS deemed crucial to the reduction <strong>of</strong><br />
traffic accidents and fatalities: seat belt use, impaired<br />
driving, lane departures, intersection crashes and<br />
pedestrian safety (<strong>Nevada</strong> Department <strong>of</strong> Public<br />
Safety, 2011, p. 5).<br />
The following sections highlight transportation<br />
and infrastructure issues and resources particularly<br />
relevant to <strong>Nevada</strong>’s older adults.<br />
<strong>Transportation</strong> Safety<br />
• Age-related changes in vision, hearing,<br />
cognition and response time can compromise an<br />
individual’s ability to drive safely, resulting in the<br />
potential for decreased mobility and increased<br />
concerns about transportation safety.<br />
Older Adult Ridership<br />
• From 2009 to 2001, total public-transportation<br />
ridership, including seniors, increased by almost<br />
14%.<br />
• In 2009 and 2011, Douglas County reported the<br />
highest level <strong>of</strong> ridership, while Storey County<br />
reported no use <strong>of</strong> public transportation. (Note:<br />
Ridership data did not provide a rationale for<br />
zero reported use <strong>of</strong> transportation within Storey<br />
County.)<br />
• From 2009 to 2011, ridership increased<br />
significantly in Washoe, Douglas and Lander<br />
counties and Carson City.<br />
<strong>Nevada</strong>’s <strong>Transportation</strong> <strong>Infrastructure</strong><br />
• In 2011, NDOT began the second phase <strong>of</strong> the<br />
multi-agency study Connecting <strong>Nevada</strong>. Goals<br />
<strong>of</strong> this study included redefining <strong>Nevada</strong>’s<br />
transportation planning process through<br />
collaboration with federal, state, regional and<br />
local agencies and stakeholders, and improving<br />
<strong>Nevada</strong>’s transportation network for future<br />
generations. The study was expected to be<br />
completed in the first quarter <strong>of</strong> 2013 followed by<br />
data analysis and planning. To date, the project<br />
has connected with more than 150 stakeholders<br />
across the state.<br />
<strong>Transportation</strong> Access for Older Adults<br />
• <strong>Nevada</strong> has four transportation agencies that<br />
work to increase mobility for seniors:<br />
— Regional <strong>Transportation</strong> Commission <strong>of</strong><br />
Washoe County<br />
— Regional <strong>Transportation</strong> Commission for<br />
Southern <strong>Nevada</strong><br />
— Carson Area Metropolitan Planning<br />
Organization<br />
— Tahoe Metropolitan Planning Organization<br />
• Annual federal funding <strong>of</strong> approximately $8<br />
million allows <strong>Nevada</strong>’s public-transportation<br />
system to provide more than 1 million rides per<br />
year to seniors, people with disabilities, and the<br />
public.<br />
32
<strong>Transportation</strong> Safety<br />
As people age, many experience changes in<br />
vision, hearing, cognition and response time that<br />
compromise an individual’s ability to drive safely,<br />
resulting in the potential for decreased mobility<br />
and increased concerns about transportation safety<br />
(Staplin, Lococo, Stewart, & Decina, 1999). For<br />
example, in one Texas study, adults older than 65 who<br />
had been in an automobile accident were 1.8 times<br />
more likely than all adults 55-64 to have had a health<br />
condition or physical limitation prior to the accident<br />
(Griffin, 2004, p. 41). This association increased to 2.4<br />
times in adults 75 and older and to 3.1 times in adults<br />
85 and older (ibid, p. 42). In addition, after controlling<br />
for other factors, increases in age were associated with<br />
significant increases in the probability <strong>of</strong> dying from<br />
an automobile accident (see Figure T1).<br />
<strong>Transportation</strong> Access for Older Adults<br />
4<br />
3.5<br />
3<br />
2.5<br />
2<br />
1.5<br />
1<br />
0.5<br />
0<br />
Fig. T1: Relative Likelihood <strong>of</strong> Death in<br />
Automobile Accident by Age<br />
1.78<br />
2.59<br />
Death<br />
(Griffin, 2004, p. 35-36)<br />
To minimize the risk <strong>of</strong> unsafe drivers while meeting<br />
the mobility needs <strong>of</strong> older adults, it is essential<br />
that <strong>Nevada</strong> <strong>of</strong>fers safe and reliable transportation<br />
alternatives. In the sections below, we first highlight<br />
<strong>Nevada</strong>’s general transportation infrastructure issues<br />
and the efforts to resolve the issues. Next, we discuss<br />
the availability and use <strong>of</strong> alternative modes <strong>of</strong><br />
transportation for seniors.<br />
3.72<br />
65 Years and Older<br />
75 Years and Older<br />
85 Years and Older<br />
TRANSPORTATION & INFRASTRUCTURE<br />
<strong>Nevada</strong> has four transportation agencies that<br />
increase mobility for seniors (see Table T1). In<br />
addition, the <strong>Nevada</strong> Department <strong>of</strong> <strong>Transportation</strong><br />
(NDOT) has three regional centers, in Las Vegas,<br />
<strong>Reno</strong> and Elko, and six sub-district <strong>of</strong>fices, in<br />
Las Vegas, Carson City, Elko, Ely, Tonopah and<br />
Winnemucca.<br />
Public transportation improves the quality <strong>of</strong><br />
life for many <strong>Nevada</strong> seniors and individuals<br />
with disabilities by providing access to needed<br />
services, food, medical assistance, social activities<br />
and employment. Annual federal funding <strong>of</strong><br />
approximately $8 million allows <strong>Nevada</strong>’s public<br />
transportation system to provide more than 1 million<br />
rides per year to seniors, those with disabilities,<br />
and the general public (see, Table T3; Performance<br />
Analysis Division: State <strong>of</strong> <strong>Nevada</strong> 2011 Facts and<br />
Figures, 2011). Between 2010 and 2011, Federal<br />
Transit Administration funds allowed NDOT to<br />
purchase 400 buses and transit vehicles, and to hire<br />
additional rural drivers (p. 4). This funding was<br />
essential to meet growing public-transportation<br />
needs in 60 <strong>Nevada</strong> communities and the state’s 25<br />
federally recognized Indian colonies.<br />
The Grants Management Advisory Committee for<br />
the <strong>Nevada</strong> Department <strong>of</strong> Health and Human<br />
Services conducted a statewide needs survey in May<br />
2012 that included items about barriers to obtaining<br />
public transportation. Of the 3,059 participants<br />
who completed the online version <strong>of</strong> the survey,<br />
the highest percentage <strong>of</strong> respondents (~80%)<br />
identified the cost <strong>of</strong> gasoline as a barrier to travel<br />
(Grants Management Unit, 2012, p. 20). Other<br />
barriers included vehicle maintenance costs, lack<br />
<strong>of</strong> public transportation, lack <strong>of</strong> knowledge about<br />
how to use public transportation, lack <strong>of</strong> funds to<br />
use public transportation, and not driving. Survey<br />
participants believed that rural communities have<br />
greater problems accessing transportation than do<br />
urban communities. For example, respondents noted<br />
that Ely is more than a two-hour drive from Elko or<br />
a four-hour drive from <strong>Reno</strong>, but Ely has no public<br />
transit system and only one commercial airline<br />
flight per week. Over 50% <strong>of</strong> residents in Humboldt<br />
County live in outlying areas with no access to<br />
public transportation. However, Elko County has<br />
a good public-transportation system. Finally, the<br />
public transportation system in Las Vegas, although<br />
sophisticated, is not adequate to meet the needs <strong>of</strong><br />
all its residents (Grants Management Unit, 2012).<br />
33
TRANSPORTATION & INFRASTRUCTURE<br />
Older Adult Ridership<br />
Although public transportation is essential to<br />
meeting the growing mobility needs <strong>of</strong> <strong>Nevada</strong>’s<br />
seniors, obtaining accurate data on senior ridership is<br />
problematic. Total ridership data do not exist specific<br />
to the older adult population. Where data have been<br />
collected, the data on riders 65 and older have been<br />
confounded with the inclusion <strong>of</strong> individuals with<br />
disabilities <strong>of</strong> all ages and the general public. Other<br />
transportation services that receive NDOT funds (i.e.,<br />
sub-recipients), such as senior centers and regional<br />
services, do not collect age-specific data, although<br />
their passengers are primarily from local senior<br />
centers. For example, Churchill County and other<br />
sub-recipients in Douglas, Esmeralda, Humboldt,<br />
Lander, Lincoln, Lyon, Mineral and Pershing counties<br />
might not report ridership by age alone, even though<br />
they regularly pick up passengers from the county<br />
senior centers. Also, Douglas County operates the<br />
BlueGo transit with Lake Tahoe tourists, and the<br />
senior centers in Minden and Gardnerville operate<br />
the DART public transit system. Rural transit in White<br />
Pine operates through the White Pine County Senior<br />
Services (M. Gardner, Personal Communication,<br />
August 30, 2012).<br />
From the available data, it appears that total ridership,<br />
including seniors, increased by almost 14% between<br />
2009 and 2011 (see Table T2). By region, ridership<br />
increased in the Northern Urban/Metropolitan (0.2%<br />
to 3.9%) and Rural/Frontier (69.2% to 74.2%) regions<br />
and decreased in the Southern Urban/Metropolitan<br />
region (30.5% to 21.9%; see Figure T2). Douglas<br />
County had the highest level <strong>of</strong> ridership in both<br />
years. Interestingly, Storey County reported no use<br />
(or failed to report use) <strong>of</strong> the public transportation<br />
system. From 2009 to 2011, ridership increased<br />
significantly in Washoe, Douglas and Lander, counties<br />
and Carson City 1 .<br />
Fig. T2: Transit Ridership: Year by Region<br />
0.2%<br />
30.5%<br />
69.2%<br />
3.9%<br />
21.9%<br />
2009 2011<br />
74.2%<br />
Northern Urban/Metro Southern Urban/Metro Rural/Frontier<br />
(M. Gardner, Personal Communication, August 30, 2012; Performance<br />
Analysis Division: State <strong>of</strong> <strong>Nevada</strong> 2011 Facts and Figures, 2011)<br />
<strong>Nevada</strong>’s <strong>Transportation</strong> <strong>Infrastructure</strong><br />
Building our state’s transportation infrastructure<br />
is essential to meet the growing mobility needs <strong>of</strong><br />
<strong>Nevada</strong>’s growing senior population. According<br />
to Senator Harry Reid, “<strong>Nevada</strong>’s transportation<br />
infrastructure is stretched to the limit...44% <strong>of</strong> the<br />
state’s roads are congested, and many state roads<br />
are in need <strong>of</strong> repair” (Reid-Issues, n.d., para. 1 and<br />
7). In 2008, the American Society <strong>of</strong> Civil Engineers<br />
(ASCE, 2009-2012) identified three top infrastructure<br />
concerns for <strong>Nevada</strong>: bridges, roads, and drinking<br />
water/hazardous waste (see Table T3). In this<br />
next section, we review current bridge and road<br />
infrastructure issues that highlight the barriers to<br />
mobility faced by <strong>Nevada</strong> seniors.<br />
Bridges are categorized as deficient if they have<br />
structural issues (poor load-carrying conditions),<br />
functional issues (below current design standards) or<br />
seismic issues [below current earthquake-resistant<br />
standards (Performance Analysis Division: State <strong>of</strong><br />
<strong>Nevada</strong>, 2011 Facts and Figures, 2011)]. <strong>Nevada</strong> has<br />
1,922 public bridges. Of these, NDOT maintains<br />
1,092; various governmental agencies maintain 792;<br />
and private citizens maintain 38. In 2011, NDOT<br />
designated almost 15% (or 285) <strong>of</strong> the bridges as<br />
deficient due to structural (18), functional (139),<br />
and seismic (128) problems (<strong>Nevada</strong> State Highway<br />
Preservation Report, 2011, page 39).<br />
34<br />
1<br />
Ridership data does not include the metropolitan transit services operating in Las Vegas, <strong>Reno</strong> and Carson City.
NDOT also is responsible for 20% <strong>of</strong> <strong>Nevada</strong>’s<br />
roads with over half <strong>of</strong> all vehicle miles traveled on<br />
NDOT-maintained roads. In 2007 and 2009, ASCE<br />
graded the U.S. road infrastructure with a “D” and a<br />
“D-” for poor-to-mediocre road conditions that cost<br />
Americans time and fuel and increase stress due to<br />
congestion. The conditions also cost motorists money<br />
in terms <strong>of</strong> road-induced need for auto repairs (see<br />
Table T3).<br />
In 2009, the American Recovery and Reinvestment<br />
Act allocated approximately $201 million to the<br />
<strong>Nevada</strong> Department <strong>of</strong> <strong>Transportation</strong> to improve<br />
the state’s transportation infrastructure and put<br />
<strong>Nevada</strong> residents back to work (NDOT: Projects and<br />
Programs, American Recovery and Reinvestment Act<br />
Overview, 2012). Approximately 30% <strong>of</strong> the money<br />
was allocated for transportation projects in the urban<br />
areas <strong>of</strong> the state (e.g., Clark and Washoe counties);<br />
3.5% was allocated to rural areas; and the remaining<br />
money was earmarked for other statewide projects.<br />
The 2011 Urban Mobility Report suggested that<br />
demand for new road construction and infrastructure<br />
repair in Las Vegas outstripped supplies by 30%<br />
(Schrank, Lomax, & Eisele, p. 50). In addition, in a<br />
review <strong>of</strong> 101 U.S. cities, Las Vegas ranked 36th in<br />
terms <strong>of</strong> traffic congestion. This resulted in 28 hours<br />
<strong>of</strong> delay per commuter annually, seven gallons <strong>of</strong><br />
excess fuel per auto per year, and an estimated $532<br />
total annual cost per auto (Schrank, et al., 2011).<br />
These congestion figures translate into a total annual<br />
congestion cost <strong>of</strong> $530 million in <strong>Nevada</strong> when the<br />
excess fuel costs are taken into account and delays<br />
are valued at $16 per hour for individuals and $88 per<br />
hour for large commercial trucks.<br />
In 2011, NDOT embarked on the second phase <strong>of</strong><br />
the two-part, multi-agency study called Connecting<br />
<strong>Nevada</strong>. A goal <strong>of</strong> this study was to redefine<br />
<strong>Nevada</strong>’s transportation-planning process through<br />
collaboration with federal, state, regional and local<br />
agencies and stakeholders. Another goal was to<br />
improve <strong>Nevada</strong>’s transportation network for seniors<br />
and future generations.<br />
Tasks <strong>of</strong> the study included increasing public and<br />
stakeholder involvement in planning for <strong>Nevada</strong>’s<br />
future transportation needs through formal needs<br />
analysis and group discussion, and development <strong>of</strong><br />
a statewide travel-demand model, population and<br />
employment forecasts, and web map. The study<br />
was expected to be completed in the first quarter<br />
<strong>of</strong> 2013 followed by data analysis and planning. At<br />
the time <strong>of</strong> the publication <strong>of</strong> Elders Count <strong>Nevada</strong><br />
(2013), the project had connected with more than 150<br />
stakeholders across the state. For more information,<br />
please see www.connectingnevada.org.<br />
TRANSPORTATION & INFRASTRUCTURE<br />
35
TRANSPORTATION & INFRASTRUCTURE<br />
Table T1<br />
<strong>Nevada</strong> <strong>Transportation</strong> Agencies<br />
• Regional <strong>Transportation</strong> Commission Washoe County (RTC Washoe)<br />
• Regional <strong>Transportation</strong> Commission for Southern <strong>Nevada</strong> (RTC)<br />
• Carson Area Metropolitan Planning Organization (CAMPO)<br />
• Tahoe Metropolitan Planning Organization (TMPO)<br />
(NDOT-Personal Communication, 2012)<br />
Table T2<br />
Transit Ridership by County: Statewide Small Urban and Rural <strong>Transportation</strong> 2009 & 2011<br />
County Total Rides** Percent <strong>of</strong> Total<br />
2009 2011 2009 2011<br />
Carson City 1,257 4,094 0.1% 0.3%<br />
Churchill 44,795 36,970 3.6% 2.6%<br />
Clark 378,829 309,357 30.5% 21.9%<br />
Douglas 604,363 869,241 48.7% 61.6%<br />
Elko 96,726 50,412 7.8% 3.6%<br />
Esmeralda 7,742 6,957 0.6% 0.5%<br />
Eureka 2,991 0 0.2% 0.0%<br />
Humboldt 12,582 12,641 1.0% 0.9%<br />
Lander 1,490 2,962 0.1% 0.2%<br />
Lincoln 2,164 2,523 0.2% 0.2%<br />
Lyon 33,614 25,566 2.7% 1.8%<br />
Mineral 6,476 7,283 0.5% 0.5%<br />
Nye 21,685 18,512 1.7% 1.3%<br />
Pershing 11,254 6,638 0.9% 0.5%<br />
Storey 0 0 0.0% 0.0%<br />
Washoe 1,750 51,289 0.1% 3.6%<br />
White Pine 13,394 7,493 1.1% 0.5%<br />
Total 1,241,112 1,411,938 100.0% 100.0%<br />
Northern Urban/Metro 3,007 55,383 0.2% 3.9%<br />
Southern Urban/Metro 378,829 309,357 30.5% 21.9%<br />
Rural/Frontier 859,276 1,047,198 69.2% 74.2%<br />
**Includes adults over age 65, disabled adults, and the general public<br />
(http://www.nevadadot.com/uploadedFiles/NDOT/About_NDOT/NDOT_Divisions/Planning/Performance_Analysis/Fact%20Book%202011%20<br />
Final(1).pdf, p. 48; M. Gardner, Personal Communication, August 30, 2012)<br />
36
Table T3<br />
ASCE: Key <strong>Infrastructure</strong> Facts<br />
Bridges:<br />
• Sixteen percent <strong>of</strong> <strong>Nevada</strong>’s bridges are structurally deficient or functionally obsolete.<br />
• There are 165 high hazard dams in <strong>Nevada</strong>...whose failure would cause a loss <strong>of</strong> life and significant<br />
property damage.<br />
• Twenty-seven <strong>of</strong> <strong>Nevada</strong>’s 744 dams are in need <strong>of</strong> rehabilitation to meet applicable state dam safety<br />
standards.<br />
• Thirty-five percent <strong>of</strong> high hazard dams in <strong>Nevada</strong> have no emergency action plan (EAP). An EAP<br />
is a predetermined plan <strong>of</strong> action to be taken including roles, responsibilities and procedures for<br />
surveillance, notification and evacuation to reduce the potential for loss <strong>of</strong> life and property damage in<br />
an area affected by a failure or mis-operation <strong>of</strong> a dam.<br />
Roads:<br />
• Vehicle travel on <strong>Nevada</strong>’s highways increased 117% from 1990 to 2007.<br />
• Thirteen percent <strong>of</strong> <strong>Nevada</strong>’s roads are in poor or mediocre condition.<br />
• Fifty-nine percent <strong>of</strong> <strong>Nevada</strong>’s major urban highways are congested.<br />
• <strong>Nevada</strong>’s transportation department has identified 10 mega projects costing an estimated $4.8 billion<br />
that need to be completed by 2015 to avoid gridlock in urban areas.<br />
(ASCE, 2009-2012, para. #1, http://www.infrastructurereportcard.org/state-page/nevada)<br />
TRANSPORTATION & INFRASTRUCTURE<br />
37