S ongquan D eng / Shutterstock .com - University of Nevada School ...
S ongquan D eng / Shutterstock .com - University of Nevada School ...
S ongquan D eng / Shutterstock .com - University of Nevada School ...

You also want an ePaper? Increase the reach of your titles
YUMPU automatically turns print PDFs into web optimized ePapers that Google loves.
S<strong>ongquan</strong> D<strong>eng</strong> / <strong>Shutterstock</strong>.<strong>com</strong>
Elders Count <strong>Nevada</strong> 2013<br />
Sanford Center for Aging/146<br />
Division <strong>of</strong> Health Sciences<br />
<strong>University</strong> <strong>of</strong> <strong>Nevada</strong>, Reno<br />
Reno, NV 89557-0146<br />
www.unr.edu/sanford<br />
Report Prepared by:<br />
Angela D. Broadus, PhD<br />
Teresa M. Sacks, MPH<br />
Elizabeth R. Fadali, ABD<br />
Marketing and Communications:<br />
Richelle W. O’Driscoll, MA<br />
Director, Public Affairs<br />
Division <strong>of</strong> Health Sciences, <strong>School</strong> <strong>of</strong> Medicine<br />
Editor:<br />
Edward G. Cohen, MS<br />
Graphic Design:<br />
Lori Kunder<br />
Kunder Design Studio<br />
This report was funded by the Marion G. Thompson Charitable Trust and the Graham and<br />
Jean Sanford Endowment and made possible through partnerships between Sanford Center for<br />
Aging, <strong>University</strong> <strong>of</strong> <strong>Nevada</strong>, Reno, the Center for Economic Development at the <strong>University</strong> <strong>of</strong><br />
<strong>Nevada</strong>, Reno, the <strong>Nevada</strong> State Health Division, the <strong>Nevada</strong> State Office <strong>of</strong> Rural Health, and<br />
<strong>Nevada</strong> Aging and Disability Services Division.<br />
Copyright Information: Information contained in this report may be reproduced or disseminated without permission;<br />
however, appropriate citation is appreciated.<br />
Re<strong>com</strong>mended Citation: Broadus, A.D., Sacks, T.M., & Fadali, E.R. (2013). Elders Count <strong>Nevada</strong>. <strong>University</strong> <strong>of</strong> <strong>Nevada</strong>,<br />
Reno: Sanford Center for Aging.<br />
Report Availability: To receive a copy <strong>of</strong> Elders Count <strong>Nevada</strong>, please visit the Sanford Center for Aging website for a<br />
free download at http://www.unr.edu/sanford/programs/elderscount2013.
Sanford Center for Aging<br />
Mission and vision<br />
Vision:<br />
To be<strong>com</strong>e recognized across <strong>Nevada</strong> and beyond as leaders in aging-related research,<br />
education, and <strong>com</strong>munity outreach.<br />
Mission:<br />
The mission <strong>of</strong> the Sanford Center for Aging is to enhance the quality <strong>of</strong> life for older persons<br />
through innovation and leadership in interdisciplinary aging-related research, education, and <strong>com</strong>munity outreach.<br />
Significant Background:<br />
The Sanford Center for Aging is funded in the large part through a substantial endowment made by<br />
Mrs. Jean Sanford in 1992. The express purpose <strong>of</strong> this endowment was “…to support the activities…<br />
which are directed in whole or substantial part towards research, teaching, and publicizing ways and means<br />
to improve quality <strong>of</strong> life for [older adults].”<br />
“The best policies are driven by the best data. This report is an excellent start toward developing<br />
the training programs necessary to expand the workforce <strong>Nevada</strong> needs to care for its growing and<br />
diverse population <strong>of</strong> older adults. The Division <strong>of</strong> Health Sciences is <strong>com</strong>mitted to improving the<br />
health and well-being <strong>of</strong> our seniors through excellence in education and research.”<br />
Thomas L. Schwenk, M.D., Vice President, Division <strong>of</strong> Health Sciences, <strong>University</strong> <strong>of</strong> <strong>Nevada</strong>, Reno and<br />
Dean, <strong>University</strong> <strong>of</strong> <strong>Nevada</strong> <strong>School</strong> <strong>of</strong> Medicine<br />
“Our aging society is the greatest demographic shift <strong>of</strong> the 21st Century.<br />
As concerned and <strong>com</strong>passionate <strong>Nevada</strong>ns, we need to prepare our <strong>com</strong>munities<br />
to meet the needs <strong>of</strong> this growing population.”<br />
Grady Tarbutton, Director<br />
Washoe County Senior Services
Advisory Committee<br />
In alphabetical order…<br />
Caleb Cage<br />
Executive Director, <strong>Nevada</strong> Office <strong>of</strong> Veterans<br />
Services<br />
5460 Reno Corporate Dr. Suite 131<br />
Reno, NV 89511<br />
Phone: (775) 688-1653<br />
cagec@veterans.nv.gov<br />
Jeff Fontaine<br />
Executive Director, <strong>Nevada</strong> Association <strong>of</strong><br />
Counties<br />
Phone: (775) 883-7863<br />
jfontaine@nvnaco.org<br />
Pam Gallion, M.Ed., MBA<br />
Director, Cannon Survey Center<br />
Division <strong>of</strong> Educational Outreach<br />
<strong>University</strong> <strong>of</strong> <strong>Nevada</strong>, Las Vegas<br />
Phone: (702) 895-0486<br />
pam.gallion@unlv.edu<br />
Tina Gerber-Winn, MSW<br />
Deputy Division Administrator<br />
<strong>Nevada</strong> Aging and Disability Services Division<br />
Phone: (775) 687-4210<br />
trgerber@adsd.nv.gov<br />
Tabor Griswold, MS<br />
Health Services Research Analyst<br />
<strong>Nevada</strong> Office <strong>of</strong> Rural Health &<br />
Office <strong>of</strong> Health Pr<strong>of</strong>essions Research Policy<br />
<strong>University</strong> <strong>of</strong> <strong>Nevada</strong> <strong>School</strong> <strong>of</strong> Medicine<br />
Phone: (775) 682-8475<br />
tgriswold@medicine.nevada.edu<br />
Jeff Hardcastle, AICP<br />
<strong>Nevada</strong> State Demographer<br />
<strong>Nevada</strong> Small Business Development Center<br />
<strong>University</strong> <strong>of</strong> <strong>Nevada</strong>, Reno<br />
Phone: (775) 784-6353<br />
jhardcas@unr.edu<br />
Thomas R. Harris, PhD<br />
Director, UCED, State Extension Specialist<br />
Economics Department<br />
<strong>University</strong> <strong>of</strong> <strong>Nevada</strong>, Reno<br />
Phone: (775) 784-1681<br />
harris@cabnr.unr.edu<br />
Denise Montcalm, PhD<br />
Interim Director, Sanford Center for Aging<br />
Director, <strong>School</strong> <strong>of</strong> Social Work<br />
<strong>University</strong> <strong>of</strong> <strong>Nevada</strong>, Reno<br />
Phone: (775) 784-6542<br />
Montcalm@unr.edu<br />
Tim Mueller<br />
Special Projects Manager<br />
NDOT Transportation/Multimodal Planning<br />
Phone: (775) 888-7351<br />
tmueller@dot.state.nv.us<br />
Betty Munley, BA<br />
Senior Advocate<br />
<strong>University</strong> <strong>of</strong> <strong>Nevada</strong> Alumni 1955<br />
1865 Simpson Avenue<br />
Reno, NV 89503<br />
Cell: (775) 345-5144<br />
Home: (775) 747-3574<br />
John F. Packham, PhD<br />
Director <strong>of</strong> Health Policy Research<br />
<strong>Nevada</strong> Office <strong>of</strong> Rural Health &<br />
Office <strong>of</strong> Health Pr<strong>of</strong>essions Research Policy<br />
<strong>University</strong> <strong>of</strong> <strong>Nevada</strong> <strong>School</strong> <strong>of</strong> Medicine<br />
Phone: (775) 784-1235<br />
jpackham@medicine.nevada.edu<br />
Julia Peek, MHA<br />
Manager, Office <strong>of</strong> Public Health Informatics and<br />
Epidemiology<br />
Bureau <strong>of</strong> Health Statistics, Planning,<br />
Epidemiology and Response<br />
<strong>Nevada</strong> State Health Division<br />
Phone: (775) 684-4192<br />
jpeek@health.nv.gov<br />
Luana Ritch, PhD<br />
Quality Assurance Specialist<br />
Health and Human Services Division<br />
Mental Health/Developmental Services Agency<br />
<strong>Nevada</strong> Aging and Disability Services Division<br />
Phone: (775) 684-5912<br />
lritch@mhds.nv.gov<br />
Grady Tarbutton<br />
Director<br />
Washoe County Senior Services<br />
Phone: (775) 328-6141<br />
GTarbutton@washoecounty.us
Wei Yang, MD, PhD<br />
Pr<strong>of</strong>essor <strong>of</strong> Epidemiology and Biostatistics<br />
<strong>School</strong> <strong>of</strong> Community Health Sciences<br />
Director, <strong>Nevada</strong> Center for Health Statistics and<br />
Informatics<br />
Phone: (775) 682-7094<br />
weiyang@unr.edu<br />
Significant Contributors<br />
Jill R. Berntson, Social Services Chief, Aging and<br />
Disability Services Division, Elder Rights<br />
Kirsten Bugenig, MPA, MSG, Research Division,<br />
Legislative Counsel Bureau<br />
Edward G. Cohen, MS, Mendoza College <strong>of</strong><br />
Business, <strong>University</strong> <strong>of</strong> Notre Dame, Elders Count<br />
<strong>Nevada</strong> (2013), Editor<br />
Robert Dick, PhD, Temp Faculty, Economics<br />
Department, <strong>University</strong> <strong>of</strong> <strong>Nevada</strong>, Reno<br />
Betty Dodson, PhD, Director, Gerontology<br />
Academic Program, Emerita<br />
Elizabeth Fadali, MA, ABD, Economics<br />
Department, <strong>University</strong> <strong>of</strong> <strong>Nevada</strong>, Reno<br />
Lori Kunder, Graphic Designer, Kunder Design<br />
Studio<br />
<strong>Nevada</strong> State Health Division: Bureau <strong>of</strong><br />
Health Statistics, Planning, Epidemiology and<br />
Response, Office <strong>of</strong> Public Health Informatics<br />
and Epidemiology<br />
• Jay Kvam, MSPH, State Biostatistician<br />
• Kyra Morgan, Biostatistician II<br />
• Sandi N<strong>of</strong>fsinger, MPH, HIV/Hepatitis/<br />
STD/TB Surveillance and Control Manager<br />
• Jennifer Thompson, Biostatistician II<br />
• Brad Towle, MA, MPA, Health Program<br />
Specialist<br />
Student Contributors<br />
Julie Kilgore, Field Study, Community Health<br />
Sciences, <strong>University</strong> <strong>of</strong> <strong>Nevada</strong>, Reno<br />
• Adviser: Gerold B. Dermid, PhD,<br />
Coordinator, Community Relations and<br />
Field Studies, Community Health Sciences,<br />
<strong>University</strong> <strong>of</strong> <strong>Nevada</strong>, Reno<br />
Shawna Dale Koehler-Larson, Gerontology<br />
Independent Study, Community Health Sciences,<br />
<strong>University</strong> <strong>of</strong> <strong>Nevada</strong>, Reno<br />
• Adviser: Susan G. Harris, PhD, Coordinator,<br />
Gerontology Academic Program, Sanford<br />
Center for Aging, Health Science Division,<br />
<strong>University</strong> <strong>of</strong> <strong>Nevada</strong>, Reno<br />
Jeffery Stroup, Graduate Research Assistant,<br />
Economics Department, <strong>University</strong> <strong>of</strong> <strong>Nevada</strong>,<br />
Reno<br />
• Adviser: Thomas Harris, Director, UCED,<br />
State Extension Specialist, Economics<br />
Department, <strong>University</strong> <strong>of</strong> <strong>Nevada</strong>, Reno<br />
Eugenia Larmore, Graduate Research Assistant,<br />
Economics Department, <strong>University</strong> <strong>of</strong> <strong>Nevada</strong>,<br />
Reno<br />
• Adviser: Thomas Harris, Director, UCED,<br />
State Extension Specialist, Economics<br />
Department, <strong>University</strong> <strong>of</strong> <strong>Nevada</strong>, Reno<br />
Sanford Center for Aging<br />
Teresa M. Sacks, MPH (Project Director)<br />
Health Research Analyst<br />
Sanford Center for Aging<br />
<strong>University</strong> <strong>of</strong> <strong>Nevada</strong>, Reno<br />
Phone: (775) 784-1612<br />
sackst@unr.edu<br />
Angela D. Broadus, PhD (Primary Author)<br />
Special Projects Coordinator<br />
Sanford Center for Aging<br />
<strong>University</strong> <strong>of</strong> <strong>Nevada</strong>, Reno<br />
Phone: (775) 784-6824<br />
broadusad@gmail.<strong>com</strong>
Elders Count <strong>Nevada</strong> 2013<br />
Executive Summary 1<br />
POPULATION<br />
Highlights 6<br />
Population Growth & Projections 7<br />
Population by County 8<br />
Migration 9<br />
Population Distribution by Age & Sex 10<br />
Race & Ethnicity 12<br />
Education 12<br />
Living Arrangements 13<br />
Marital Status & Grandparenting 14<br />
Civic Engagement 15<br />
Veterans 17<br />
Data Tables 19<br />
TRANSPORTATION &<br />
INFRASTRUCTURE<br />
Highlights 32<br />
Transportation Safety 33<br />
Transportation Access for Older Adults 33<br />
Older Adult Ridership 34<br />
<strong>Nevada</strong>’s Transportation Infrastructure 34<br />
Data Tables 36<br />
ECONOMICS<br />
Highlights 40<br />
Labor Force Participation 41<br />
Median Household In<strong>com</strong>e 42<br />
Household In<strong>com</strong>e by Quintile 44<br />
Assets 45<br />
Social Security Benefits 45<br />
Poverty 46<br />
Consumer Expenditure Shares 47<br />
Veterans 48<br />
Data Table 50<br />
HEALTH STATUS<br />
Highlights 52<br />
Life Expectancy 54<br />
Mortality (Causes <strong>of</strong> Death) 54<br />
Self-Reported Health Status 56<br />
Disability 57<br />
Visual & Hearing Health 61<br />
Oral Health 62<br />
Mental Health 64<br />
Suicide 65<br />
Veterans 67<br />
Data Tables 70<br />
HEALTH RISKS & BEHAVIORS<br />
Highlights 92<br />
Tobacco Use 95<br />
Alcohol Use 96<br />
Illicit Drug Use 98<br />
Gambling & Other Process Addictions 100<br />
Dietary Quality 101<br />
Physical Activity 103<br />
Overweight & Obesity 105<br />
Cholesterol & Blood Pressure 107<br />
Influenza & Pneumonia Vaccinations 109<br />
Cancer Screenings 110<br />
HIV/AIDS & Other Sexually<br />
Transmitted Diseases 112<br />
Falls & Fall-Related Injuries 114<br />
Elder Abuse, Neglect, & Exploitation 115<br />
Motor Vehicle Accidents 117<br />
Veterans 118<br />
Data Tables 121<br />
HEALTH CARE<br />
Highlights 156<br />
Medical Services Use & Health<br />
Insurance Coverage 158<br />
Health Policy Reform 159<br />
Medicare & Medicaid Enrollment 160<br />
Workforce Resources 162<br />
Caregivers 163<br />
Prescription Drugs 165<br />
Expenditures 167<br />
Nursing Home Facilities 168<br />
Nursing Home Residents 170<br />
Veterans 171<br />
Data Tables 173<br />
APPENDIX<br />
Data Limitations, Chall<strong>eng</strong>es & Cautions 187<br />
References 189<br />
Table <strong>of</strong> Contents<br />
9
Executive Summary<br />
This report was <strong>com</strong>piled by the Sanford Center for<br />
Aging, Division <strong>of</strong> Health Sciences, at the <strong>University</strong><br />
<strong>of</strong> <strong>Nevada</strong>, Reno, in partnership with the <strong>Nevada</strong><br />
State Health Division and the <strong>Nevada</strong> Aging and<br />
Disability Services Division, Department <strong>of</strong> Health<br />
and Human Services. Significant contributors to<br />
this report include the <strong>Nevada</strong> State Demographer;<br />
Department <strong>of</strong> Economics, College <strong>of</strong> Business at<br />
the <strong>University</strong> <strong>of</strong> <strong>Nevada</strong>, Reno; the <strong>Nevada</strong> Office<br />
<strong>of</strong> Veterans Services; and the <strong>Nevada</strong> Department <strong>of</strong><br />
Transportation/Multimodal Planning. In particular,<br />
we thank the Elders Count <strong>Nevada</strong> (2013) Advisory<br />
Committee for members’ expertise, guidance,<br />
and tireless chapter reviews and The Marion G.<br />
Thompson Charitable Trust for their support in<br />
making this report possible.<br />
Elders Count <strong>Nevada</strong> (2013) is the third installment<br />
(the first two appeared in 2007 and 2009) in a series<br />
<strong>of</strong> reports designed to provide insight into the overall<br />
health and well-being <strong>of</strong> <strong>Nevada</strong>’s elders. The vision<br />
for Elders Count <strong>Nevada</strong> originated with Dr. Lawrence<br />
J. Weiss, former director <strong>of</strong> the Sanford Center for<br />
Aging, who believed the voice <strong>of</strong> <strong>Nevada</strong>’s elders<br />
needed to be heard and their circumstances known<br />
in a state with one <strong>of</strong> the fastest-growing senior<br />
populations. We are honored to continue this legacy<br />
with the publication <strong>of</strong> Elders Count <strong>Nevada</strong> (2013).<br />
The 2013 report utilizes data from authoritative<br />
sources and has been expanded considerably<br />
to include information by geographic region <strong>of</strong><br />
residency (i.e., urban and rural/frontier regions);<br />
our state’s older veteran population; the burden <strong>of</strong><br />
substance use, misuse and abuse; and a new chapter<br />
on transportation and infrastructure as it relates to<br />
access, safety and ridership.<br />
The report contains vital information on six key<br />
topics: population, transportation and infrastructure,<br />
economics, health status, health risks and behaviors,<br />
and health care. New this year are chapter highlights<br />
presented at the beginning <strong>of</strong> each section. These are<br />
intended to provide fast facts on key findings. More<br />
extensive information is located within each section<br />
and sub-section <strong>of</strong> the report. Source citations for<br />
the highlighted information are located within the<br />
individual sections. Where available, information has<br />
been presented by region, gender, and age cohort. In<br />
some instances, data specific to <strong>Nevada</strong> elders age 65<br />
and older was not available.<br />
A departure has been made from the original format<br />
<strong>of</strong> Elders Count <strong>Nevada</strong> to provide the reader with<br />
additional information in a narrative format. The data<br />
and information are presented for interpretation and<br />
use by the reader. For this report, descriptive analysis<br />
is provided. More advanced statistical analysis would<br />
be required for interpreting relationships among<br />
variables.<br />
For the purposes <strong>of</strong> this report, the terms “elder,”<br />
“senior” and “older adult” have been used<br />
interchangeably. In most cases, these terms refer to<br />
an individual 65 or older; however, data have also<br />
been presented by age group categories, 50-64 year<br />
olds, 65-74 (the “young old”), 75-84 (the “old”) and<br />
age 85 and older (the “oldest old”).<br />
EXECUTIVE SUMMARY<br />
1
EXECUTIVE SUMMARY<br />
A special note concerning the three geographic regions<br />
identified in the report:<br />
<strong>Nevada</strong>’s 17 counties are designated as urban,<br />
metropolitan, rural, frontier, micropolitan or nonmetro<br />
depending on the specific group responsible<br />
for making the designation. For example, the Office<br />
<strong>of</strong> Management and Budget (OMB) delineates<br />
three metropolitan statistical areas based upon each<br />
having a minimum <strong>of</strong> one city with a population<br />
<strong>of</strong> 50,000 or more, the centrality <strong>of</strong> the county or<br />
counties, and the fact that the county has adjacent<br />
counties with economic and social ties to the county<br />
(Griswold & Packham, 2011). These areas include<br />
Carson City, Las Vegas-Paradise, and the Reno-<br />
Sparks Metropolitan Statistical Area. Storey County<br />
is included as part <strong>of</strong> the Reno-Sparks area because<br />
<strong>of</strong> its economic ties to Washoe County. Of the<br />
remaining counties, five are micropolitan counties<br />
with an urbanized population between 10,000 and<br />
50,000 and adjacent counties with economic and<br />
social ties. <strong>Nevada</strong>’s micropolitan counties are<br />
Churchill, Douglas, Elko, Eureka and Nye. The<br />
remaining eight counties are designated as “nonmetro.”<br />
In order to meet the needs <strong>of</strong> Elders Count <strong>Nevada</strong><br />
(2013) stakeholders statewide, this report divides<br />
county data into three regional groups: 1) Northern<br />
Urban/Metropolitan (i.e., Washoe County and<br />
Carson City), 2) Southern Urban/Metropolitan (i.e.,<br />
Clark County), and 3) Rural/Frontier. Classification<br />
criteria from the National Center for Frontier<br />
Communities (NCFC, 2012) were utilized for<br />
regional distinctions. More detail is presented in the<br />
Population by County sub-section.<br />
Regional designations are important for highlighting<br />
the differences in older adults’ ability to access<br />
health care and other core services. Regional data<br />
allow stakeholders and partners to quickly see the<br />
differences between the two largest urban centers<br />
in the state. Information by individual counties<br />
has been provided where appropriate. The three<br />
metropolitan statistical areas also are characterized<br />
as urban areas in the 2010 Census. The remaining<br />
counties are rural, but a number <strong>of</strong> them have urban<br />
clusters within them (U.S. Census Bureau, 2010).<br />
Latest Count<br />
Elder population is growing: Between 2000 and<br />
2010, when <strong>Nevada</strong>’s population grew faster than<br />
any other state, on a percentage basis, the state’s<br />
senior population grew by 48.2%, more than any<br />
state except Alaska. As <strong>of</strong> 2011, <strong>Nevada</strong> had 340,000<br />
people 65 or older in the total population <strong>of</strong> 2.72<br />
million.<br />
Proportion <strong>of</strong> elders is growing: Nationally and<br />
in <strong>Nevada</strong>, as the baby boom generation ages, the<br />
proportion <strong>of</strong> the population that is 65 and older is<br />
growing. The elder segment is currently 11.5% in<br />
<strong>Nevada</strong> and is projected to grow to about 16% by<br />
2030.<br />
Positive Findings and Trends<br />
Lower prevalence <strong>of</strong> obesity: In 2011, an estimated<br />
18.1% <strong>of</strong> <strong>Nevada</strong> adults 65 and older met the criteria<br />
for obesity, <strong>com</strong>pared with about a third <strong>of</strong> seniors<br />
nationally.<br />
Relatively healthier finances: Despite the recession<br />
and despite having the highest unemployment<br />
rate in the nation between 2008 and 2010, <strong>Nevada</strong><br />
seniors managed to maintain a lower poverty rate<br />
and a higher median in<strong>com</strong>e than seniors nationally.<br />
Medical students staying in <strong>Nevada</strong> upon<br />
graduation is higher than the national average:<br />
Between 2000 and 2010, medical school enrollment<br />
nearly tripled in <strong>Nevada</strong>, and the state is retaining<br />
a higher percentage <strong>of</strong> its medical school graduates<br />
than other states. In addition, all medical schools<br />
now require coursework in geriatric medicine, which<br />
promises more effective treatment <strong>of</strong> senior illnesses<br />
in the future. In spite <strong>of</strong> this encouraging news,<br />
the current number <strong>of</strong> active physicians, physician<br />
assistants, nurse practitioners, nurses, and dentists in<br />
<strong>Nevada</strong> is discouraging.<br />
Familiar Issues<br />
Problem gambling: <strong>Nevada</strong> has the nation’s<br />
highest rate <strong>of</strong> adults who meet diagnostic criteria<br />
for pathological gambling. Problem gambling is less<br />
prevalent among older than younger adults, but<br />
older adults have fewer economic resources and less<br />
time to recoup losses.<br />
2
Divorce: Sixteen percent <strong>of</strong> <strong>Nevada</strong> men 60 and<br />
older are divorced, <strong>com</strong>pared with 10.8% nationally.<br />
For older women, the rate is 18.7%, <strong>com</strong>pared with<br />
13.3% nationally.<br />
Suicides: Since 2008, <strong>Nevada</strong> has ranked either<br />
fourth or fifth in the nation for the number <strong>of</strong><br />
suicides. The state’s rate is consistently above the<br />
national rate and in 2009 suicide was the seventhleading<br />
cause <strong>of</strong> death among <strong>Nevada</strong> adults 55-64.<br />
Tobacco: Although tobacco use in <strong>Nevada</strong> has<br />
steadily declined—from 28.2% in 1996 to 21.3% in<br />
2010—the state continues to rank in the top third<br />
and is the worst in the West.<br />
Excess drinking: The rate <strong>of</strong> heavy alcohol use<br />
among older adults in <strong>Nevada</strong> (4.8%) is much higher<br />
than the national rate (1.7%).<br />
Civic apathy: Since 1989 the trend in <strong>Nevada</strong> has<br />
been toward increasing volunteerism, but between<br />
2008 and 2010, older adults in <strong>Nevada</strong> had the<br />
nation’s lowest average level <strong>of</strong> volunteerism.<br />
Many factors may contribute to this issue including<br />
<strong>Nevada</strong>’s transient population, a largely rural/frontier<br />
geography, an individualistic versus group-focused<br />
culture, or volunteer hours being under-reported.<br />
Wide disparities in wealth: Between 2006 and<br />
2010, the wealthiest one-fifth <strong>of</strong> households with<br />
someone 65 or older reported estimated average<br />
household in<strong>com</strong>e 12 times greater than the lowest<br />
fifth ($123,000 vs. $9,900). Sixty percent <strong>of</strong> 65+<br />
households reported in<strong>com</strong>e <strong>of</strong> less than $32,000.<br />
Emergent Concerns<br />
More AIDS among older adults: Among <strong>Nevada</strong><br />
adults 55 and older, the rate <strong>of</strong> AIDS diagnosis in<br />
2010 (6.3 per 100,000) was significantly higher than<br />
the rate nationally (5.4 per 100,000).<br />
A big rise in Alzheimer’s: From 2000 to 2010, the<br />
incidence <strong>of</strong> Alzheimer’s disease among <strong>Nevada</strong><br />
adults 65 and older rose by 38%. This <strong>com</strong>pares with<br />
12% nationwide.<br />
Health and Wellness Divide Along<br />
Wealth, Education Lines<br />
Education: More than 85% <strong>of</strong> college graduates<br />
65 and older rate their health as good to excellent,<br />
<strong>com</strong>pared with 58.3% <strong>of</strong> people the same age with<br />
less than a high school diploma.<br />
In<strong>com</strong>e: Nearly 90% <strong>of</strong> residents 65 and older who<br />
have in<strong>com</strong>es over $75,000 rate their health as good<br />
to excellent, <strong>com</strong>pared with only about 52% with<br />
in<strong>com</strong>es less than $15,000 a year.<br />
Other Key Findings<br />
Veterans are concentrated around Vegas:<br />
In 2010, almost two-thirds <strong>of</strong> the state’s nearly<br />
150,000 veterans 55 or older lived in the Las Vegas-<br />
Henderson area.<br />
Families are carrying an increasing care load:<br />
Between 2006 and 2009, the number <strong>of</strong> <strong>Nevada</strong>’s<br />
unpaid or family caregivers increased by 40%.<br />
Lack <strong>of</strong> public transit may accelerate nursing<br />
home placement: Although 4 out <strong>of</strong> 5 residents<br />
surveyed rank transportation as either very or most<br />
important in preventing nursing home placement,<br />
accessibility is <strong>of</strong>ten lacking in rural areas. More than<br />
50% <strong>of</strong> Humboldt County residents in outlying areas<br />
have no access to public transportation and Ely has<br />
no public transit system.<br />
Prevalent nursing home dangers: In 2009, more<br />
than 1 in 4 (27.1%) <strong>Nevada</strong> nursing homes were<br />
found to have deficiencies severe enough to lead<br />
to actual harm or place residents in jeopardy. This<br />
reverses a decreasing trend between 2005 through<br />
2007.<br />
Acknowledgements<br />
As employees <strong>of</strong> an institution <strong>of</strong> higher learning,<br />
we are pleased to have provided practical experience<br />
to two undergraduate students who assisted in the<br />
research and development <strong>of</strong> the report. We thank<br />
their advisers in the Gerontology Academic Program<br />
(GAP), and the <strong>School</strong> <strong>of</strong> Community Health<br />
Sciences for the opportunity to <strong>eng</strong>age their students.<br />
EXECUTIVE SUMMARY<br />
Recent rise in abuse, neglect: Between 2011 and<br />
2012, allegations <strong>of</strong> abuse, neglect and exploitation <strong>of</strong><br />
elders each increased by 22%.<br />
3
As indicated in the Executive<br />
Summary, the Elders Count<br />
<strong>Nevada</strong> (2013) expands the<br />
2009 report with the addition <strong>of</strong><br />
information on older <strong>Nevada</strong> veterans<br />
and a focus on regional and gender<br />
differences. The following section<br />
examines <strong>Nevada</strong>’s elder population<br />
in 10 areas, including:<br />
• Growth projections<br />
• Counties<br />
• Migration to and from the state<br />
• Population distribution by age and<br />
sex<br />
• Race/ethnicity<br />
• Educational attainment<br />
• Living arrangements<br />
• Marital status and grandparenting<br />
• Civic <strong>eng</strong>agement<br />
• Older veterans<br />
Within each area and where possible,<br />
data is cross-tabulated by age cohort,<br />
sex and region. Cross-tabulation helps<br />
convey how specific demographic<br />
variables interrelate. For example,<br />
through cross-tabulation it is easier<br />
to see the distribution <strong>of</strong> males and<br />
females living in different regions <strong>of</strong><br />
the state.<br />
Population<br />
Population Growth & Projections<br />
Population by County<br />
Migration<br />
Population Distribution by Age & Sex<br />
Race & Ethnicity<br />
Education<br />
Living Arrangements<br />
Marital Status & Grandparenting<br />
Civic Engagement<br />
Veterans<br />
Photo courtesy <strong>of</strong> <strong>Nevada</strong> Office <strong>of</strong> Veterans Services<br />
Author: Angela D. Broadus<br />
Content Reviewers: Jeff Hardcastle, Caleb Cage
Population<br />
Highlights<br />
Population Growth and Projections<br />
• From 2000 to 2010, <strong>Nevada</strong>’s population <strong>of</strong><br />
adults 65 and older increased by 48.2%, while<br />
the population <strong>of</strong> adults 85 and older increased<br />
77.7%.<br />
• From 2010 to 2030, the percentage <strong>of</strong> <strong>Nevada</strong>ns<br />
65 and older is projected to increase from 11.5%<br />
to 16.1% <strong>of</strong> the state’s population.<br />
Population by County<br />
• The <strong>Nevada</strong> counties with the highest percentage<br />
<strong>of</strong> older adults are located in Esmeralda (26.2%),<br />
Nye (24.6%), Mineral (22.7%), and Douglas<br />
(21.1%) counties.<br />
Migration<br />
• Migration to <strong>Nevada</strong>’s urban areas from outside<br />
the state accounted for 92% (26,824 individuals)<br />
<strong>of</strong> the total migration by older adults. In addition,<br />
24% <strong>of</strong> the adults 75 and older who migrated to<br />
<strong>Nevada</strong> moved to the Rural/Frontier regions <strong>of</strong><br />
the state.<br />
Population Distribution by Age<br />
• 29.6% <strong>of</strong> the state population is 50 or older; and<br />
11.5% <strong>of</strong> the state population is 65 or older.<br />
Education<br />
• Fewer older <strong>Nevada</strong>ns (33.2%) than older<br />
U.S. adults (34.4%) have earned a high school<br />
diploma or GED; however, more <strong>Nevada</strong> seniors<br />
than U.S. seniors have <strong>com</strong>pleted an associate’s<br />
(5.1% versus 3.9%) or bachelor’s (11.7% versus<br />
11.3%) degree. Fewer older <strong>Nevada</strong>ns (8.1%)<br />
have <strong>com</strong>pleted graduate or pr<strong>of</strong>essional degree<br />
<strong>com</strong>pared with older U.S. adults (8.8%).<br />
Living Arrangements<br />
• In <strong>Nevada</strong>, higher percentages <strong>of</strong> older women<br />
than older men live alone.<br />
• A higher percentage <strong>of</strong> older males live alone<br />
in the Rural/Frontier regions than in the urban/<br />
metropolitan regions.<br />
• A higher percentage <strong>of</strong> older females live alone<br />
in the Northern Urban/Metropolitan region than<br />
do so in other regions.<br />
Marital Status and Grandparenting<br />
• The highest percentage <strong>of</strong> married adults 60 and<br />
older live in the Rural/Frontier regions (62.8%).<br />
• The majority (73.6%) <strong>of</strong> <strong>Nevada</strong> children 18 and<br />
younger living with a grandparent reside in the<br />
Southern Urban/Metropolitan region.<br />
• Almost all (94.7%) <strong>of</strong> <strong>Nevada</strong> grandparents who<br />
are solely responsible for their grandchildren live<br />
in Rural/Frontier regions <strong>of</strong> the state.<br />
Civic Engagement<br />
• Between 2008 and 2010 <strong>Nevada</strong> had the lowest<br />
average level <strong>of</strong> civic <strong>eng</strong>agement across the<br />
nation for older adults and the highest level <strong>of</strong><br />
unemployment.<br />
• Since 1989 the trend in <strong>Nevada</strong> has been toward<br />
increasing volunteerism.<br />
• Volunteerism was highest among <strong>Nevada</strong>ns<br />
16-19 and 45-54; and lowest among <strong>Nevada</strong>ns<br />
20-24 and 75 and older.<br />
Race and Ethnicity<br />
• <strong>Nevada</strong>’s population continues to show<br />
increasing diversity.<br />
• Although the state is majority White (54.1%),<br />
Hispanics/Latinos(as) make up the largest<br />
historically under-represented group (26.5%<br />
<strong>Nevada</strong> versus 16.3% U.S.), and all minorities<br />
except Black or African American make up a<br />
larger percent <strong>of</strong> the population than do the<br />
same races/ethnicities on a national level.<br />
Veterans<br />
• In 2010 <strong>Nevada</strong> had 149,070 veterans 55 and<br />
older.<br />
• Of these, 22,842 resided in Rural/Frontier<br />
regions, 29,680 resided in the Northern Urban/<br />
Metropolitan region, and 96,548 resided in the<br />
Southern Urban/Metropolitan region.<br />
6
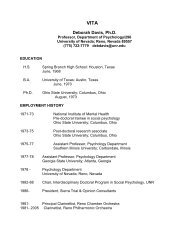
Population Growth & Projections<br />
Historically, <strong>Nevada</strong>’s population growth has<br />
been dramatic (see Figure P1). From 1950 to 1960,<br />
<strong>Nevada</strong> experienced the second-largest percentage<br />
increase <strong>of</strong> any state, 78.2% (2011; Smith & Ahmed,<br />
1990). Over the next five decades, <strong>Nevada</strong> was<br />
the fastest-growing state. From 2000 to 2010, the<br />
U.S. population increased 9.7% while <strong>Nevada</strong>’s<br />
population increased 35.1% or by approximately<br />
702.300 individuals (Mackun, et al., 2011). Between<br />
2000 and 2010, <strong>Nevada</strong>’s population grew more than<br />
any other state, on a percentage basis. But <strong>Nevada</strong>’s<br />
growth slowed almost to a stop between 2010 and<br />
2011.<br />
During that year, the state’s growth rank dropped<br />
from first to 27th with an increase <strong>of</strong> only 0.8% (State<br />
& County Quickfacts, 2012; U.S. Census Bureau:<br />
Texas Gains, 2011). Wharton (2012) predicted<br />
<strong>Nevada</strong>’s rate <strong>of</strong> population growth will continue<br />
to fall with an estimated increase <strong>of</strong> only 0.6%<br />
from 2011 to 2012. Jeff Hardcastle, the <strong>Nevada</strong><br />
State Demographer (2010) also projected slower<br />
population growth until at least until 2014.<br />
4,000,000<br />
3,500,000<br />
3,000,000<br />
2,500,000<br />
Fig. P1: <strong>Nevada</strong>'s Historic and Projected Total and 65<br />
Years <strong>of</strong> Age and Over Population 1950 to 2030<br />
<strong>Nevada</strong><br />
Population 65 and over<br />
600,000<br />
500,000<br />
400,000<br />
Possible explanations include the national economic<br />
recession, high unemployment rates, housing<br />
bubble, escalating gasoline prices, and high cost <strong>of</strong><br />
living in <strong>Nevada</strong> (Hardcastle, 2012).<br />
The U.S. Census Bureau predicts that the share <strong>of</strong><br />
the U.S. population 65 and older will increase from<br />
13.3% in 2010 to 19.7% by 2030 (U.S. Census Bureau,<br />
2012). Likewise, the <strong>Nevada</strong> State Demographer<br />
(Hardcastle, 2012) predicts that the share <strong>of</strong> the<br />
<strong>Nevada</strong> population 65 and older will increase from<br />
11.5% in 2010 to 16.1% by 2030. Table P1 and Figure<br />
P2 depict estimated (2010) and projected (2020, 2030)<br />
population changes for adults 65 and older. Using<br />
these data, Hardcastle (2012) projects that adults<br />
65-74 will grow the most as a percent <strong>of</strong> the state’s<br />
population (from 7.1% to 9.3%) between 2011 and<br />
2012. The next-largest gain will be by adults 75-84,<br />
expected to grow by 1.5% during the same period.<br />
350,000<br />
300,000<br />
250,000<br />
200,000<br />
150,000<br />
100,000<br />
50,000<br />
0<br />
Fig. P2: <strong>Nevada</strong> Population Growth: Year by<br />
Age<br />
65 to 74 Years <strong>of</strong> Age<br />
2010 2020 2030<br />
(Hardcastle, 2012)<br />
75 to 84 Years <strong>of</strong> Age<br />
85 Years <strong>of</strong> Age and<br />
Over<br />
Population<br />
Total<br />
2,000,000<br />
1,500,000<br />
1,000,000<br />
500,000<br />
300,000<br />
200,000<br />
100,000<br />
Over 65<br />
0<br />
1950 1960 1970 1980 1990 2000 2010 2020 2030<br />
0<br />
(U.S. Census Bureau, 2010 1 )<br />
1<br />
Source: U.S. Census Bureau Population <strong>of</strong> States and Counties <strong>of</strong> the United States: 1790 to 1990 http://www.census.gov/population/www/<br />
censusdata/pop1790-1990.html Accessed 9/23/2012; DP-1 Pr<strong>of</strong>ile <strong>of</strong> General Demographic Characteristics: 2000 Census 2000 Summary File 1 (SF 1)<br />
100-Percent Data; DP-1 Pr<strong>of</strong>ile <strong>of</strong> General Population and Housing Characteristics: 2010, 2010 Census Summary File 1; U.S. Census Bureau \DP-1 Pr<strong>of</strong>ile<br />
<strong>of</strong> General Demographic Characteristics: 2000, Census 2000 Summary File 1 (SF 1) 100-Percent Data; DP-1 Pr<strong>of</strong>ile <strong>of</strong> General Population and Housing<br />
Characteristics: 2010 Census Summary File 1; Census <strong>of</strong> Population:1950, Vol II Characteristics <strong>of</strong> the Population Part 28 <strong>Nevada</strong>; United States Census <strong>of</strong><br />
Population 1960 <strong>Nevada</strong> General Social and Economic Characteristics; 1970 Census <strong>of</strong> Population Vol 1 Characteristics <strong>of</strong> the Population Part 30 <strong>Nevada</strong>;<br />
1980 Census <strong>of</strong> Population Detailed Population Characteristics <strong>Nevada</strong> PC80-1-D30; NV State Demographer’s Office, <strong>Nevada</strong> Population Information<br />
1990. 234,081 - U.S. Census Bureau’s five-year American Community Survey (2006-2010); 242,205 – Veterans Office <strong>of</strong> the Actuary, September 2011<br />
estimate (U.S. Department <strong>of</strong> Veterans Affairs, 2007); 243,865 - <strong>Nevada</strong> Rural and Frontier Health Data Book; Griswold & Packham (2011); 243,900 -<br />
<strong>Nevada</strong> Veterans Services Commission Quarterly Report, which includes <strong>Nevada</strong> and four California counties (2012, but data represents September<br />
2010); 300,000 – <strong>Nevada</strong> Office <strong>of</strong> Veterans Services (2011)<br />
7
Population<br />
From 2000 to 2010, the number <strong>of</strong> U.S. adults 65 and<br />
older increased 15.1% (or 5.3 million), higher than<br />
the 9.7% growth in the overall population during<br />
the same decade (Werner, 2011). This growth also<br />
was higher for older males (20.5%) than for older<br />
females (11.3%) and highest in those ranging from<br />
65 to 69 (30.4%). Between 2000 and 2010 <strong>Nevada</strong>’s<br />
65-and-older population increased by 48.2%<br />
(105,430 people), while the 85-and-older population<br />
increased by 77.7% (13,198 people; Werner, 2011).<br />
Figures P3 and P4 depict cohort population changes<br />
between 2010 and 2012 for <strong>Nevada</strong> adults 65 and<br />
older. The largest population changes occurred in the<br />
65- to 74-year-old cohort from 2011 to 2012 (3.9%)<br />
and in the 85-and-older cohort from 2010 to 2011<br />
(3.8%). The 65- to 74-year-old’s share <strong>of</strong> the <strong>Nevada</strong><br />
population increased the most, while the 85-andolder<br />
percentage decreased the most.<br />
250,000<br />
200,000<br />
150,000<br />
100,000<br />
50,000<br />
0<br />
Fig. P3: <strong>Nevada</strong> Population Growth: Year by Age<br />
Cohort<br />
65-74 Yrs<br />
3.9%<br />
2.1% 2.0% 2.0%<br />
2010 2011 2012<br />
(Hardcastle, 2012)<br />
Fig. P4: Percent Population Change<br />
3.8%<br />
2.7%<br />
65 to 74 Yrs 75 to 84 Yrs 85 Yrs <strong>of</strong> Age and<br />
Over<br />
(Hardcastle, 2012)<br />
2.6%<br />
2.4%<br />
Total Age 60+<br />
75-84 Yrs<br />
85 Yrs and Older<br />
% Change 2010-2011<br />
% Change 2011-2012<br />
1.0%<br />
0.6%<br />
Total <strong>Nevada</strong><br />
Population by County<br />
The National Center for Frontier Communities<br />
(NCFC) added a designation <strong>of</strong> “Frontier” to the<br />
U.S. Census classifications <strong>of</strong> “urban” and “rural”<br />
based on a matrix <strong>of</strong> criteria that includes population<br />
density (i.e., seven or fewer persons per square<br />
mile) and travel distance (miles or minutes) from a<br />
market or service center (2012). Per these criteria,<br />
<strong>Nevada</strong> has three urban areas (Carson City, Clark<br />
and Washoe counties), two rural areas (Douglas and<br />
Storey counties) and 12 frontier counties (see Table<br />
P2).<br />
In 2011, 12 <strong>Nevada</strong> counties had higher estimated<br />
percentages <strong>of</strong> adults over the age <strong>of</strong> 65 than the rate<br />
for the United States as a whole (13.0%; see Table<br />
P3). All <strong>of</strong> these except the urban area <strong>of</strong> Carson City<br />
were located in the rural/frontier areas <strong>of</strong> the state<br />
(Quickfacts, U.S. Census Bureau, 2011). The highest<br />
percentages <strong>of</strong> older adults were located in Douglas<br />
(21.1%), Esmeralda (26.2%), Mineral (22.7%) and<br />
Nye (24.6%) counties. The lowest percentages were<br />
in Elko (8.7%) and Humboldt (10.3%) counties.<br />
Between 2007 and 2011, all counties experienced<br />
growth in the percentage <strong>of</strong> adults 65 and older<br />
except for Eureka and Lincoln, which dropped, and<br />
White Pine, which stayed the same (Elders Count<br />
<strong>Nevada</strong>, 2009). Counties with the largest percentage<br />
change included Storey (9.1%) and Pershing (5.0%).<br />
Population differences between 2007 and 2011 in the<br />
remaining counties ranged from 0.8% in Humboldt<br />
County to 3.9% in Lyon County.<br />
8
Migration<br />
As indicated in the section on Population Growth<br />
and Projections, <strong>Nevada</strong> was either the fastestgrowing<br />
or one <strong>of</strong> the fastest-growing states from<br />
1950 until 2010. Based on the 2009 American<br />
Community Survey, net migration from California<br />
accounted for the largest portion <strong>of</strong> this change<br />
(Ihrke, Faber, & Koerber, 2011). According to<br />
the Pew Research Center and based on a singleyear,<br />
2010 estimate, unauthorized immigrants are<br />
represented in the highest percentages in <strong>Nevada</strong><br />
(7.2%), California (6.8%) and Texas (6.7%) (Passel &<br />
Cohn, 2011). Estimates for this population nationally<br />
ranged from 260,000 in 2009 (Department <strong>of</strong><br />
Homeland Security, 2011; Hoefer, Rytina, & Baker,<br />
2010) to 190,000 in 2010 (Pew Research Center,<br />
Passel & Cohn, 2011). The 2009 Elders Count <strong>Nevada</strong><br />
report indicated that the most likely country <strong>of</strong> origin<br />
for unauthorized immigrants was Mexico (Elders<br />
Count <strong>Nevada</strong>, 2009, p. 8); however, this is no<br />
longer the case. Recent findings reported by the Pew<br />
Research Center suggest that net migration from<br />
Mexico fell to virtually zero in 2012 (Passel, Cohn, &<br />
Gonzalez-Barerra, 2012).<br />
Five-year (2006-2010) estimates from the American<br />
Community Survey suggest that 141,414 people<br />
migrated to <strong>Nevada</strong> between 2006 and 2010. Of<br />
these, 87.1% migrated from a different state and<br />
12.9% moved to <strong>Nevada</strong> from abroad. In addition,<br />
approximately 6.6%, or 9,312, <strong>of</strong> the immigrants<br />
were 65 or older. In the same period, an estimated<br />
108,062 people emigrated from <strong>Nevada</strong> to a different<br />
state. Of these, approximately 7.7%, or 8,338 people,<br />
were 65 or older. The majority <strong>of</strong> adults 50 and older<br />
(92%, n = 26,824) migrated to urban areas <strong>of</strong> the<br />
state (see Figure P5 and Table P4). Of these, 76.4%<br />
migrated to the Southern Urban/Metro area, and<br />
approximately 16% migrated to the Northern Urban/<br />
Metro area. An additional 8% migrated to the Rural/<br />
Frontier area.<br />
15.6%<br />
Fig. P5: Percent <strong>of</strong> Total Migration<br />
76.4%<br />
8.0%<br />
Northern Migration<br />
Southern Migration<br />
Northern Migration Southern Migration Rural/Frontier Migration<br />
Rural/Frontier Migration<br />
(American Community Survey, 5-year Estimates-B07001, 2006-2010)<br />
The largest age group was adults in the preretirement<br />
age range (50-64, see Tables P4 and<br />
P10). In addition, almost 24% <strong>of</strong> adults 75 and older<br />
migrated to the Rural/Frontier areas <strong>of</strong> the state.<br />
This may be <strong>of</strong> concern as these areas <strong>of</strong>ten lack easy<br />
access to health care and other resources.<br />
Migration percentages by county and age (see Table<br />
P5) reveal that 76.4% <strong>of</strong> adults 50 and older migrated<br />
to Clark County, 14.1% to Washoe County, and<br />
1.5% to Carson City. Rural/Frontier counties with the<br />
highest migration percentages included Nye (2.3%),<br />
Douglas (1.6%) and Lyon (1.2%). More <strong>of</strong> <strong>Nevada</strong>’s<br />
oldest adults (75 and older) moved to Churchill<br />
(37.7%), Lander (24.2%), Lyon (51.2%) and Nye<br />
(27.2%) counties than did adults 65-74.<br />
Of total migration to <strong>Nevada</strong> by older adults, 89.6%<br />
moved to <strong>Nevada</strong> from a different state and 10.4%<br />
moved from abroad (see Table P6 and Figure P6).<br />
Older adults moving from abroad primarily moved to<br />
the urban areas <strong>of</strong> the state.<br />
% Rural/Frontier<br />
% Southern Urban<br />
% Northern Urban<br />
Fig. P6: Senior Migration to <strong>Nevada</strong> by Age and Area<br />
State Total<br />
12.8%<br />
19.1%<br />
23.8%<br />
14.8%<br />
11.2%<br />
20.1%<br />
15.0%<br />
16.6%<br />
61.4%<br />
68.1%<br />
68.7%<br />
68.3%<br />
75 and older<br />
65-74<br />
50-64<br />
Population<br />
(American Community Survey, 5-year Estimates-B07401, 2006-2010)<br />
9
Population<br />
Given current state and national economic<br />
conditions, it could be important to examine<br />
emigration from <strong>Nevada</strong> to another state (see Figure<br />
P7). In 2009 an estimated 108,062 individuals, or<br />
4.2%, <strong>of</strong> <strong>Nevada</strong> residents living in the state one<br />
year prior to the ACS survey moved from <strong>Nevada</strong> to<br />
another state. Of these, 21.1% (22,787) were 50 or<br />
older, and 7.7% (8,338) were 65 or older. Of those<br />
who moved out <strong>of</strong> <strong>Nevada</strong>, more than two-thirds <strong>of</strong><br />
adults 50 or older (16,261 individuals) moved from<br />
the Southern Urban/Metro region; 17.8% (4,048)<br />
moved from the Northern Urban/Metro region; and<br />
10.9% (2,478) moved from the Rural/Frontier regions<br />
<strong>of</strong> the state.<br />
Fig. P7: Migration from <strong>Nevada</strong><br />
A closer look at migration by age group and area<br />
reveals that, regardless <strong>of</strong> age, emigration from<br />
<strong>Nevada</strong> was highest among those living in the<br />
Southern Urban/Metro region (see Figure P8).<br />
Fig. P8: Annual Migration from Area: Age and Area<br />
73.5%<br />
67.1% 68.7%<br />
17.1% 19.0% 18.6%<br />
13.9% 12.6%<br />
9.4%<br />
50 to 64 years 65 to 74 years 75 years and over<br />
(U.S. Census Bureau, ACS 5-year Estimates-B07401, 2006-2010)<br />
% N. Urban<br />
% S. Urban<br />
71.4%<br />
17.8%<br />
10.9%<br />
N. Urban/Metropolitan S. Urban/Metropolitan Rural/Frontier<br />
(American Community Survey, 5-year Estimates-B07401, 2006-2010)<br />
Population Distribution by Age & Sex<br />
The 2010 Census found that males (50.6%) slightly<br />
outnumber females (49.4%) in <strong>Nevada</strong>, a reverse <strong>of</strong><br />
the proportions nationally (males, 49.2%; females,<br />
50.8%). In addition, 29.6% (779,179) <strong>of</strong> the state’s<br />
population is 50 or older, and 11.5% is 65 or older<br />
(American Community Survey, 5-Year, 2006-2010).<br />
Of the total population 50 and older (see Table P7<br />
and Figure P9), the shares that are female 75-84<br />
(12.2%) and female 85+ (4.5%) are larger than the<br />
shares that are male in the same age ranges (11.2%<br />
and 2.8%, respectively; Hardcastle, 2012).<br />
Fig. P9: <strong>Nevada</strong> Population by Age and Sex<br />
Negligible differences exist across area <strong>of</strong> residence<br />
by gender or age (see Table P8 and Figure P10).<br />
70%<br />
60%<br />
50%<br />
40%<br />
30%<br />
20%<br />
10%<br />
0%<br />
Fig. P10: Population Percentages: Gender, Age, and<br />
Area<br />
S. Urban/Metropolitan<br />
50-64 65-74 75-84 85+ 50-64 65-74 75-84 85+<br />
Male<br />
Female<br />
(U.S. Census Bureau: PCT 12 Sex by Age, 2010)<br />
N. Urban/Metropolitan<br />
Rural/Frontier<br />
59.4%<br />
61.8%<br />
23.8%<br />
24.3%<br />
Female<br />
Male<br />
12.2%<br />
11.2%<br />
4.5%<br />
2.8%<br />
10<br />
50 to 64 years 65 to 74 years 75 to 84 years 85 years and over<br />
(Hardcastle, 2012)
Population pyramids provide a quick visual<br />
representation <strong>of</strong> a particular state population by<br />
demographics such as age and gender. For example,<br />
the following <strong>Nevada</strong> population pyramids highlight<br />
the larger older population living in the rural/frontier<br />
regions <strong>of</strong> the state as <strong>com</strong>pared to the southern<br />
and northern urban regions. As illustrated in the<br />
population pyramid Figure P11, the widest estimated<br />
population bands in <strong>Nevada</strong> span 25 to 49 years <strong>of</strong><br />
age. In the 2007 population pyramid (2009 Elders<br />
Count <strong>Nevada</strong>), post-World War II baby boomers<br />
constituted the largest group.<br />
85 years and over<br />
80 to 84 years<br />
75 to 79 years<br />
70 to 74 years<br />
65 to 69 years<br />
60 to 64 years<br />
55 to 59 years<br />
50 to 54 years<br />
45 to 49 years<br />
40 to 44 years<br />
35 to 39 years<br />
30 to 34 years<br />
25 to 29 years<br />
20 to 24 years<br />
15 to 19 years<br />
10 to 14 years<br />
5 to 9 years<br />
Under 5 years<br />
85 years and over<br />
85 years and over<br />
80 to 84 years<br />
80 to 84 years<br />
75 to 79 years<br />
75 to 79 years<br />
70 to 74 years<br />
70 to 74 years<br />
65 to 69 years<br />
65 to 69 years<br />
60 to 64 years<br />
60 to 64 years<br />
55 to 59 years<br />
55 to 59 years<br />
50 to 54 years<br />
50 to 54 years<br />
45 to 49 years<br />
45 to 49 years<br />
40 to 44 years<br />
40 to 44 years<br />
35 to 39 years<br />
35 to 39 years<br />
30 to 34 years<br />
30 to 34 years<br />
25 to 29 years<br />
25 to 29 years<br />
20 to 24 years<br />
20 to 24 years<br />
15 to 19 years<br />
15 to 19 years<br />
10 to 14 years<br />
10 to 14 years<br />
5 to 9 years<br />
5 to 9 years<br />
Under 5 years<br />
Under 5 years<br />
Fig. P11: <strong>Nevada</strong> Population Pyramid 2010<br />
8.0% 6.0% 4.0% 2.0% 0.0% 2.0% 4.0% 6.0% 8.0%<br />
Percentage <strong>of</strong> Total Population<br />
(U.S. Census Bureau: SF1, 2010)<br />
Fig. P20: Fig. Population P12: Population pyramid: Pyramid: Southern Southern<br />
Urban/Metroplitan Urban/Metroplitan Region Region<br />
% Male<br />
% Female<br />
Population distribution by age and area <strong>of</strong> the state<br />
shows significant differences (see Figures P12-P14).<br />
The Southern <strong>Nevada</strong> Urban/Metropolitan age<br />
distributions mirror those <strong>of</strong> the state as a whole.<br />
However, the largest population groups in the<br />
Northern Urban/Metropolitan region are ages 15-29<br />
and 45-64, while the largest groups for the Rural/<br />
Frontier region are ages 10-19 and 40-69.<br />
Male %<br />
Male %<br />
Female %<br />
Female %<br />
8.0% 6.0%<br />
8.0%<br />
4.0%<br />
6.0%<br />
2.0%<br />
4.0%<br />
0.0%<br />
2.0%<br />
2.0%<br />
0.0%<br />
4.0%<br />
2.0% 4.0%<br />
6.0%<br />
6.0%<br />
8.0%<br />
Percentage<br />
8.0%<br />
Percentage<br />
<strong>of</strong> Total Population<br />
<strong>of</strong> Total Population<br />
(U.S. Census Bureau: SF1, 2010)<br />
85 years and over<br />
80 to 84 years<br />
75 to 79 years<br />
70 to 74 years<br />
65 to 69 years<br />
60 to 64 years<br />
55 to 59 years<br />
50 to 54 years<br />
45 to 49 years<br />
40 to 44 years<br />
35 to 39 years<br />
30 to 34 years<br />
25 to 29 years<br />
20 to 24 years<br />
15 to 19 years<br />
10 to 14 years<br />
5 to 9 years<br />
Under 5 years<br />
80 to 84 years<br />
70 to 74 years<br />
60 to 64 years<br />
50 to 54 years<br />
40 to 44 years<br />
30 to 34 years<br />
20 to 24 years<br />
10 to 14 years<br />
Under 5 years<br />
Fig. P13: Population Pyramid: Northern<br />
Urban/Metropolitan Region<br />
8.0% 6.0% 4.0% 2.0% 0.0% 2.0% 4.0% 6.0% 8.0%<br />
Percentage <strong>of</strong> Total Population<br />
(U.S. Census Bureau: SF1, 2010)<br />
Fig. P14: Population Pyramid: Rural/Frontier Region<br />
8.0% 6.0% 4.0% 2.0% 0.0% 2.0% 4.0% 6.0% 8.0%<br />
Percentage <strong>of</strong> Population<br />
(U.S. Census Bureau: SF1, 2010)<br />
Male %<br />
Female %<br />
Male %<br />
Female %<br />
Population<br />
11
Population<br />
Race & Ethnicity<br />
Almost three-quarters <strong>of</strong> the <strong>Nevada</strong> population<br />
is White (54.1%). Hispanics/Latinos(as) represent<br />
the largest minority population (26.5%). With the<br />
exception <strong>of</strong> Black/African Americans (7.7% in<br />
<strong>Nevada</strong> versus 12.2% nationally), <strong>Nevada</strong> had a<br />
higher percentage <strong>of</strong> individuals from a racial or<br />
ethnic minority group than the nation as a whole<br />
(see Table P9).<br />
Among <strong>Nevada</strong> adults 65 and older, the majority<br />
are White (76.6%). The next three largest minority<br />
groups are Black/African American (5.8%), Asian<br />
(6.6%) and Hispanic/Latino/a (8.8%). <strong>Nevada</strong> has<br />
higher percentages <strong>of</strong> older adult minorities than the<br />
United States with the exception <strong>of</strong> Blacks/African<br />
Americans and those who self-identify as “some<br />
other race” (see Table P10).<br />
The Southern Urban/Metropolitan area <strong>of</strong> <strong>Nevada</strong><br />
has the most diverse population <strong>of</strong> older adults.<br />
Although Whites constitute the majority (80.1%),<br />
8% are Black/African American or Asian, and 9.7%<br />
are Hispanic/Latinos(as). The Northern Urban/<br />
Metropolitan area’s older adult population also is<br />
predominantly White (90.7%) with 6.2% Hispanic/<br />
Latino(a) and 4.1% Asian. <strong>Nevada</strong>’s Rural/Frontier<br />
areas are the most White (93.6%) and American<br />
Indian/Alaskan Native (2.2%). The Rural/Frontier<br />
areas have the state’s lowest share <strong>of</strong> Hispanics/<br />
Latinos(as), 4.2% (see Table P11).<br />
Education<br />
Education is believed to be a social determinant<br />
<strong>of</strong> health as it is highly correlated with socioeconomic<br />
status (World Health Organization, 2008).<br />
Education also appears to be a protective factor<br />
for specific health-related issues such as diabetes<br />
(Geyer, Hemstrom, Peter, & Vagero, 2006), obesity<br />
(HealthyPeople.gov, 2012) and heart disease (Cutler<br />
& Lleras-Muney, 2007). Research also has shown<br />
that the positive correlation between education and<br />
health appears to taper <strong>of</strong>f between ages 50 and<br />
60 (Cutler & Lleras-Muney, 2007), possibly due to<br />
higher mortality in older adults with less education<br />
(Jemal, Ward, Anderson, Murray, & Thun, 2008).<br />
% Rural/Frontier<br />
Adults in the urban areas <strong>of</strong> the state are more<br />
likely to have <strong>com</strong>pleted a bachelor’s, graduate or<br />
pr<strong>of</strong>essional degree than those living in rural areas.<br />
In addition, higher percentages <strong>of</strong> older adults living<br />
in the rural/frontier areas have <strong>com</strong>pleted a high<br />
school degree or GED (see Table P12 and Figure<br />
P15) than have those living in the urban areas.<br />
Fig. P15: <strong>Nevada</strong> Education Attainment: Adults Age 65 and<br />
Older by Area<br />
% Rural/Frontier<br />
% Northern Urban/Metro<br />
Slightly fewer <strong>Nevada</strong> adults 65 and older (33.2%)<br />
have <strong>com</strong>pleted high school, a GED or an alternative<br />
than have adults <strong>of</strong> the same age nationally (34.4%;<br />
see Table P12; American Community Survey, 5-Year<br />
Estimates-B15001, 2006-2010). However, slightly<br />
more <strong>Nevada</strong> adults 65 and older have <strong>com</strong>pleted<br />
some college (23.3% vs. 17.2% nationally), have<br />
associate’s degrees (5.1% vs. 3.9%) or have<br />
bachelor’s degrees [11.7% vs. 11.3%, (see Table<br />
P12)].<br />
% Southern Urban/Metro<br />
0% 5% 10% 15% 20% 25% 30% 35% 40%<br />
High <strong>School</strong> or less High school graduate, GED, or alternative<br />
Some college, no degree Associate's degree<br />
Bachelor's degree Graduate or pr<strong>of</strong>essional degree<br />
(American Community Survey, 5-Year Estimates-B15001, 2006-2010)<br />
12
Living Arrangements<br />
According to the United States <strong>of</strong> Aging Survey (2012),<br />
older adults prefer to remain in their homes and<br />
“age in place” due their perception that this provides<br />
the best emotional and physical support. For some,<br />
however, this decision may increase isolation and<br />
its associated negative consequences. Seniors living<br />
alone with minimal social support face greater health<br />
consequences such as depression and substance<br />
abuse (Bosworth, Hays, George, & Steffens, 2002),<br />
hypertension (Cornwell & Waite, 2012), and decline<br />
in cognitive performance (Dickinson, Potter, Hybels,<br />
McQuoid & Steffens, 2011). This may be significant<br />
when considering U.S. Census Bureau estimates that<br />
27.6% <strong>of</strong> U.S. adults 65 years and older and 24.6%<br />
<strong>of</strong> <strong>Nevada</strong> adults in the same age category live alone<br />
(ACS 5-Year Estimate, 2006-2010).<br />
Women are more likely than are men to live alone<br />
due to several factors, including: 1) traditionally,<br />
women tend to marry men who are older than<br />
they are; 2) women are less likely to remarry when<br />
widowed, and 3) women tend to live longer than<br />
men. Seventy-two percent <strong>of</strong> U.S. women 65 and<br />
older live alone, <strong>com</strong>pared with 27.6% <strong>of</strong> U.S. men.<br />
Although this same trend occurs in <strong>Nevada</strong>, the<br />
percentage <strong>of</strong> men living alone is higher (36.8%)<br />
than in the U.S. as a whole (see Figure P16).<br />
27.6%<br />
Fig. P16: Adults Age 65 and Older Living Alone<br />
36.8%<br />
72.4%<br />
63.2%<br />
27.6%<br />
24.6%<br />
United States<br />
<strong>Nevada</strong><br />
% <strong>of</strong> Males 65+ Living Alone % Females 65+ Living Alone % <strong>of</strong> All Persons 65+ Living Alone<br />
(American Community Survey, 5-Year Estimates-B09017, 2006-2010)<br />
50%<br />
45% 50%<br />
40% 45%<br />
35% 40%<br />
30% 35%<br />
25% 30%<br />
25%<br />
20%<br />
20%<br />
15%<br />
15%<br />
10% 10%<br />
5% 5%<br />
0% 0%<br />
90%<br />
80%<br />
70%<br />
60%<br />
50%<br />
40%<br />
30%<br />
20%<br />
10%<br />
0%<br />
Older U.S. men <strong>of</strong> all races and ethnicities are more<br />
likely to live with their spouse than with relatives<br />
or other people or alone (Jacobsen, Kent, Lee, &<br />
Mather, 2011). In 2008 and 2010, 72% <strong>of</strong> older men<br />
and 42% <strong>of</strong> older women lived with their spouse<br />
(Federal Agency Forum: Older Americans, 2011, p.<br />
8; Federal Agency Forum: Older Americans, 2012, p.<br />
8). Alternatively, older Hispanic and Asian women<br />
are almost as likely to live with other relatives (31%<br />
and 32%, respectively) as they are to live with a<br />
spouse (41% and 45%, respectively; Jacobsen et al.,<br />
2011). Older White (41%) and Black (42%) women<br />
are more likely to live alone than either older Asian<br />
(22%) or Hispanic (27%) women. In addition, older<br />
White women are almost as likely to live alone (41%)<br />
as they are to live with a spouse (44%), and older<br />
Black women are almost as likely to live alone (42%)<br />
as to live with relatives (32%; see Figure P17 and<br />
P18).<br />
Fig. Fig. P17: P26: U.S. U.S. Living Living Arrangements: Arrangements: Female Female by by<br />
Race/Ethnicity Race/Ethnicity<br />
White White<br />
Black, Black, African African<br />
American American<br />
Asian Asian<br />
Hispanic Hispanic<br />
Alone Alone<br />
Living Living with Spouse with Spouse<br />
Living Living with Other with Other Relatives Relatives<br />
Living Living with Non-Relatives<br />
with Non-Relatives<br />
(Source: U.S. Census Bureau, Current Population Survey, Annual Social<br />
and Economic Supplement, 2008)<br />
(Jacobsen, Kent, Lee, & Mather, 2011)<br />
90%<br />
80%<br />
70%<br />
60%<br />
50%<br />
40%<br />
30%<br />
20%<br />
10%<br />
0%<br />
White<br />
White<br />
American<br />
Fig.<br />
Fig.<br />
P27:<br />
P18:<br />
U.S.<br />
U.S.<br />
Living<br />
Living<br />
Arrangements:<br />
Arrangements:<br />
Male<br />
Male<br />
by Race/Ethnicity<br />
by Race/Ethnicity<br />
Black, African<br />
American Black, African<br />
American<br />
Asian<br />
Asian<br />
Hispanic<br />
Hispanic<br />
Alone<br />
Alone<br />
Living with Spouse<br />
Living with Spouse<br />
Living with Other Relatives<br />
Living with Other Relatives<br />
Living with Non-Relatives<br />
Living with Non-Relatives<br />
Population<br />
Living arrangements for older adults vary from living<br />
alone to living with family or with non-relatives.<br />
In 2010, 30.1% <strong>of</strong> U.S. adults 18 and older lived in<br />
shared households with at least one additional adult<br />
(i.e., not the householder, spouse or cohabiting<br />
partner), and 1.4% <strong>of</strong> this population sharing<br />
households were 65 or older. The number <strong>of</strong> shared<br />
households nationally increased 11.4% from 2007 to<br />
2010 (Mykyta & Macartney, 2012).<br />
(Source: U.S. Census Bureau, Current Population Survey, Annual Social<br />
and Economic Supplement, 2008)<br />
(Jacobsen, Kent, Lee, & Mather, 2011)<br />
13
Population<br />
The lack <strong>of</strong> social support from living alone is an<br />
important issue for older <strong>Nevada</strong>ns, particularly as<br />
the number <strong>of</strong> older adults in the state increases.<br />
In 2010, almost a quarter <strong>of</strong> <strong>Nevada</strong>’s older adult<br />
population (74,441 people) lived alone. Of these,<br />
48,788 (65.5%) lived in the Southern Urban/Metro<br />
region, 15,573 (20.9%) lived in the Northern Urban/<br />
Metro region, and 10,080 (13.5%) lived in the Rural/<br />
Frontier region.<br />
In all regions, females were more likely than were<br />
males to live alone. The highest percent <strong>of</strong> females<br />
living alone (65.3%) reside in the Northern Urban/<br />
Metropolitan region, while 64% <strong>of</strong> females in the<br />
Southern Urban/Metropolitan region live alone. In<br />
the Rural/Frontier region, 56.4% <strong>of</strong> the females live<br />
alone (see Figure P19).<br />
36.0%<br />
Fig. P19: Adults Age 65+ Living Alone: Gender by<br />
Area<br />
34.7%<br />
43.6%<br />
64.0%<br />
65.3%<br />
56.4%<br />
23.7%<br />
27.7%<br />
Males Females % <strong>of</strong> Total<br />
Southern Urban/Metro<br />
Northern Urban/Metro<br />
Rural/Frontier<br />
24.5%<br />
(American Community Survey, 5-Year Estimates-B09017, 2006-2010)<br />
Marital Status & Grandparenting<br />
14<br />
Nationally, males 60 and older are more likely to<br />
be married (73.8%) than are older females (47.8%).<br />
Older adults in <strong>Nevada</strong> exhibit a similar pattern with<br />
69.2% <strong>of</strong> older males married <strong>com</strong>pared with 49.4%<br />
<strong>of</strong> older females (see Figure P20).<br />
Fig. P20: Comparison <strong>of</strong> Marital Status in Adults Age 60<br />
and Older: Location by Sex<br />
Never Married<br />
73.8%<br />
69.2%<br />
47.8% 49.4%<br />
34.0%<br />
10.8% 16.0%<br />
13.3%<br />
10.2% 9.5%<br />
5.2% 5.3% 5.0% 3.1%<br />
Married<br />
Divorced<br />
Widowed<br />
18.7%<br />
Male U.S. Male <strong>Nevada</strong> Female U.S. Female <strong>Nevada</strong><br />
28.7%<br />
(American Community Survey, 5-Year Estimates-B12002, 2006-2010)<br />
Divorce is more prevalent in <strong>Nevada</strong> than in other<br />
states. Sixteen percent <strong>of</strong> <strong>Nevada</strong> men 60 and older<br />
are divorced, <strong>com</strong>pared with 10.8% nationally. For<br />
older <strong>Nevada</strong> women, the rate is 18.7%, <strong>com</strong>pared<br />
with 13.3% nationally. In both <strong>Nevada</strong> and the<br />
United States as a whole, older women are much<br />
more likely than older men to be widowed (see Table<br />
P13).<br />
The majority <strong>of</strong> older <strong>Nevada</strong>ns are married (see<br />
Figure P21). The highest marriage rate is in the Rural/<br />
Frontier regions (62.8%); however, the proportions <strong>of</strong><br />
all marital statuses are similar across regions.<br />
Fig. P21: Marital Status, Adults Age 60 and Older:<br />
Location<br />
Never Married<br />
58.8%<br />
56.6%<br />
19.7% 19.5% 20.2%<br />
17.0%<br />
4.5% 3.7% 3.3%<br />
62.8%<br />
Southern Urban/Metro Northern Urban/Metro Rural/Frontier<br />
Married<br />
Divorced<br />
Widowed<br />
16.3% 17.6%<br />
(American Community Survey, 5-Year Estimates-B12002, 2006-2010)<br />
The 2010 Census estimated that 2.5 million<br />
grandparents nationally are caring for more than<br />
2.6 million children, and 7.8 million children live in<br />
homes where grandparents also reside (AARP, 2012).<br />
In <strong>Nevada</strong>, an estimated 42,103 children under age<br />
18 are living with a grandparent (ACS, B10001, 206-<br />
2010). Of those who live with their grandparents,<br />
the overwhelming majority, 73.6%, or approximately<br />
4,000 children, reside in the Southern Urban/<br />
Metropolitan area, 16.3% (approximately 6,862)<br />
reside in the Northern Urban/Metropolitan area, and<br />
4.1%, or approximately 1,726, reside in the Rural/<br />
Frontier area (see Figure P22).
Fig. P22: Percent <strong>of</strong> Children Living with<br />
Grandparents by Location<br />
73.6%<br />
16.3%<br />
(American Community Survey, 5-Year Estimates-B10001, 2006-2010)<br />
Of the estimated 62,500 grandparents living with<br />
their grandchildren in <strong>Nevada</strong>, 46.9% (29,310) are 60<br />
and older, a higher percentage than found nationally<br />
(44.2%). Almost 15% (9,231) <strong>of</strong> these older <strong>Nevada</strong><br />
grandparents are solely responsible for the children’s<br />
care <strong>com</strong>pared with 13.5% nationally. Who will care<br />
for the children under age 18 when their grandparent<br />
dies?<br />
4.1%<br />
Southern Urban/Metro Northern Urban/Metro Rural/Frontier<br />
In the Southern region, 46.9% <strong>of</strong> grandparents 60<br />
and older are living with their grandchildren (see<br />
Figure P23). Of these, 29.3% are solely responsible<br />
for their grandchildren. Of the grandparents residing<br />
in the Northern Urban/Metro region, 63.2% reside<br />
with their grandchildren. Of these, 26.3% are solely<br />
responsible for their grandchildren. In the Rural/<br />
Frontier region, 22.4% <strong>of</strong> grandparents live with<br />
their grandchildren, and almost all (94.7%) are solely<br />
responsible for their grandchildren.<br />
46.9%<br />
Fig. P23: Grandparenting Across <strong>Nevada</strong><br />
63.2%<br />
29.3% 26.3%<br />
22.4%<br />
94.7%<br />
Southern Urban/Metro Northern Urban/Metro Rural/Frontier<br />
% Age 60+ % Solely Responsible<br />
Population<br />
(American Community Survey, 5-Year Estimates-B10051, 2006-2010)<br />
Civic Engagement<br />
“Civic <strong>eng</strong>agement…actions wherein older adults<br />
participate in activities <strong>of</strong> personal and public concern<br />
that are both individually life enriching and socially<br />
beneficial to the <strong>com</strong>munity.”<br />
(Cuillnane, 2006)<br />
Civic <strong>eng</strong>agement includes formal and informal<br />
volunteering, helping and socializing with neighbors,<br />
voting or registering to vote, participation in<br />
public meetings, and advocacy to influence local<br />
governments (Corporation for National and<br />
Community Services, 2011). Research suggests that<br />
<strong>com</strong>munities benefit from civic <strong>eng</strong>agement. For<br />
example, positive correlations exist between states<br />
with higher civic <strong>eng</strong>agement and greater resilience<br />
against unemployment, and between higher civic<br />
<strong>eng</strong>agement and lower levels <strong>of</strong> unemployment<br />
[National Conference on Citizenship (NCOC),<br />
2011]. (Note: These correlations also occur in reverse<br />
– higher unemployment correlates with lower<br />
volunteerism.) Communities particularly benefit<br />
from older adults’ participation in civic <strong>eng</strong>agement<br />
through the use <strong>of</strong> social capital, experience<br />
and expertise found in this growing population<br />
(Cullinane, 2006). Older adults who <strong>eng</strong>age in civic<br />
<strong>eng</strong>agement also experience individual benefits.<br />
These include improvements in social connectedness,<br />
physical and mental health, and greater self-esteem<br />
(Martinez, Crooks, Kim & Tanner, 2011; Wilson &<br />
Simson, 2006, in Cullinane, 2006).<br />
Although the recorded number <strong>of</strong> <strong>Nevada</strong> volunteers<br />
has fallen from a high <strong>of</strong> 430,810 in 2007 to 418,017<br />
in 2010, the overall trend since 1989 has been toward<br />
greater volunteerism (see Figure P24). Despite this,<br />
between 2008 and 2010 <strong>Nevada</strong> had the lowest<br />
average level <strong>of</strong> civic <strong>eng</strong>agement <strong>of</strong> all U.S. states<br />
(20.9%) and the highest level <strong>of</strong> unemployment<br />
(NCOC, 2011; VolunteeringinAmerica.<strong>com</strong>, 2011).<br />
Number <strong>of</strong> Volunteers<br />
500,000<br />
400,000<br />
300,000<br />
200,000<br />
100,000<br />
0<br />
Fig. P24: <strong>Nevada</strong> Volunteerism<br />
(Volunteering in America, 2011)<br />
R² = 0.724<br />
1989 2002 2003 2004 2005 2006 2007 2008 2009 2010<br />
Year<br />
15
Population<br />
As shown in Figure P25 below, volunteer rates in<br />
<strong>Nevada</strong> decline in early adulthood and again after<br />
retirement. Between 2008 and 2010, the volunteer<br />
rate for baby boomers (i.e., born between 1946 and<br />
1964) was 24.3%, while the rate for adults 65 and<br />
older was 16.6%. Interestingly, the median volunteer<br />
time investment for baby boomers was 68 hours,<br />
while for older adults the median was over 100<br />
hours. This would suggest that the volunteerism rate<br />
might not account for the actual number <strong>of</strong> hours<br />
elders devote to civic <strong>eng</strong>agement.<br />
26.5%<br />
14.1%<br />
Fig. P25: <strong>Nevada</strong> Volunteer Rates<br />
19.0%<br />
23.2%<br />
26.9%<br />
19.3%<br />
(Volunteering in America, 2011)<br />
20.6%<br />
R² = 0.6626<br />
11.5%<br />
16-19 20-24 25-34 35-44 45-54 55-64 65-74 75+<br />
Age<br />
<strong>Nevada</strong> volunteer rates by age cohort are lower than<br />
national volunteer rates for the same age ranges (see<br />
Figure P26).<br />
As <strong>of</strong> February 2012, 2,929 seniors have participated<br />
in three Senior Corps programs: Foster Grandparent<br />
Program (290 participants), Retired and Senior<br />
Volunteer Programs (2,388 participants), and the<br />
Senior Companion Program (251; National and<br />
Community Service, 2012). These volunteers benefit<br />
their <strong>com</strong>munities by <strong>eng</strong>aging in a wide variety<br />
<strong>of</strong> activities that include tutoring and mentoring<br />
school-age children with special needs, providing<br />
<strong>com</strong>panionship and transportation for frail and<br />
homebound seniors, and assisting their <strong>com</strong>munities<br />
during crises (National and Community Service,<br />
2012).<br />
During the 2010 general election for Governor,<br />
Senator and federal Representative, the turnout rate<br />
for <strong>Nevada</strong>’s voting-eligible population was 41.1%,<br />
<strong>com</strong>pared with a 41.0% turnout for the United States<br />
as a whole (McDonald, 2011). This was a decline<br />
from the 2008 general presidential election, when<br />
<strong>Nevada</strong>’s turnout rate was 57% versus a U.S. rate <strong>of</strong><br />
61.6% (McDonald, 2011). When voter registration<br />
closed in May 2012, <strong>Nevada</strong> had approximately 1.05<br />
million active voters. Of these, approximately 24%<br />
(254,766) were 65 or older (Miller, 2012; see Table<br />
P14).<br />
Fig. P26: Volunteer Rates, 2008-2010:<br />
<strong>Nevada</strong> versus U.S.<br />
27.8%<br />
26.5%<br />
<strong>Nevada</strong> Volunteer<br />
Rates<br />
19.3%<br />
20.6%<br />
20.3%<br />
11.5%<br />
55-64 65-74 75+<br />
(Volunteering in America, 2011)<br />
16
Veterans<br />
Obtaining consistent population data for <strong>Nevada</strong><br />
veterans was chall<strong>eng</strong>ing. The source <strong>of</strong> data, time <strong>of</strong><br />
data collection, and differing definitions for veterans<br />
resulted in inconsistent findings. For example,<br />
authoritative sources list the population <strong>of</strong> <strong>Nevada</strong><br />
veterans anywhere from 234,081 to 300,000 2 .<br />
8.2%<br />
Fig. P27: <strong>Nevada</strong> Veterans: Percentage <strong>of</strong> Total by Age<br />
Group<br />
28.1%<br />
26.2%<br />
20.8%<br />
16.7%<br />
Population<br />
Information for this report <strong>com</strong>es primarily from<br />
the American Community Survey, 5-Year Estimates<br />
(2006-2010) because this data set is the most<br />
<strong>com</strong>prehensive and can be analyzed by any number<br />
<strong>of</strong> demographic variables. However, when available,<br />
we have also provided data from other sources,<br />
including the <strong>Nevada</strong> Office <strong>of</strong> Veterans Services<br />
(NOVS) and the <strong>Nevada</strong> Rural and Frontier Health<br />
Data Book (2011).<br />
18 to 34 years 35 to 54 years 55 to 64 years 65 to 74 years 75 years and older<br />
(U.S. Census Bureau: ACS 5-Year Estimates-B21001, 2006-2010)<br />
The majority <strong>of</strong> <strong>Nevada</strong>’s older adult veterans live in<br />
the Southern Urban/Metropolitan region <strong>of</strong> the state<br />
(64.8%); almost 20% live in the Northern Urban/<br />
Metropolitan region, and 15.3% live in the Rural/<br />
Frontier region (see Table P16 and Figure P28).<br />
Jurisdiction for the NOVS includes the state <strong>of</strong><br />
<strong>Nevada</strong> and the California counties <strong>of</strong> Alpine,<br />
Lassen, Modoc and Mono (<strong>Nevada</strong> Office <strong>of</strong><br />
Veterans Services, 2012). Per a 2011 quarterly report<br />
to the Veterans Services Commission, the veteran<br />
population for these <strong>com</strong>bined areas was 243,900<br />
as <strong>of</strong> September 2010. This was a 4% increase over<br />
the Census calculations (<strong>Nevada</strong> Office <strong>of</strong> Veterans<br />
Services, 2012; U.S. Census Bureau: ACS 5-Year<br />
Estimates-B21001, 2006-2010). The NOVS veteran<br />
population consisted <strong>of</strong> 222,500 (91.2%) males and<br />
21,400 (8.8%) females. In addition, the majority <strong>of</strong><br />
veterans served in at least one <strong>of</strong> four periods <strong>of</strong> war,<br />
while 26.4% were peacetime veterans (see Table P15;<br />
U.S. Department <strong>of</strong> Veterans Affairs, 2012)<br />
In 2010, the U.S. Census Bureau estimated the<br />
population <strong>of</strong> <strong>Nevada</strong> veterans at 234,081 (ACS<br />
5-Year Estimates, 2006-2010). Of these, 63.7%, or<br />
149,070, were 55 or older. This percentage is slightly<br />
lower than the national proportion (65.8%). By age<br />
group, 26.2%, or 61,419, were, 55-64; 20.8%, or<br />
48,686, were, 65-74; and 16.7%, 39,065, were 75 or<br />
older (see Figure P27).<br />
Fig. 28: <strong>Nevada</strong> Veterans, Age 55 and Older: Sex by<br />
Location<br />
64.8% 65.1% 64.8%<br />
19.9% 21.5% 19.9%<br />
15.4%<br />
13.4%<br />
Male Female Total<br />
Southern Urban/Metro Northern Urban/Metro Rural/Frontier<br />
15.3%<br />
(U.S. Census Bureau: ACS 5-Year Estimates-B21001, 2006-2010)<br />
The distribution <strong>of</strong> <strong>Nevada</strong> veterans across the state’s<br />
three population regions is similar (see Figure P29).<br />
Slightly more pre-retirement-age veterans (42.4%)<br />
live in the Northern Urban/Metropolitan region, and<br />
slightly more <strong>of</strong> <strong>Nevada</strong>’s oldest veterans live in the<br />
urban rather than rural or frontier regions. Finally,<br />
in the 65-74 age range, the share <strong>of</strong> veterans living<br />
in the Rural/Frontier region (35.4%) is higher than<br />
found in the other regions. This could be <strong>of</strong> concern<br />
when considering the possible lack <strong>of</strong> local resources,<br />
especially veteran-specific resources.<br />
2<br />
234,081 - U.S. Census Bureau’s five-year American Community Survey (2006-2010); 242,205 – Veterans Office <strong>of</strong> the Actuary, September 2011<br />
estimate (U.S. Department <strong>of</strong> Veterans Affairs, 2007); 243,865 - <strong>Nevada</strong> Rural and Frontier Health Data Book; Griswold & Packham (2011); 243,900 -<br />
<strong>Nevada</strong> Veterans Services Commission Quarterly Report, which includes <strong>Nevada</strong> and four California counties (2012, but data represents September<br />
2010); 300,000 – <strong>Nevada</strong> Office <strong>of</strong> Veterans Services (2011).<br />
17
Population<br />
Fig. P29: <strong>Nevada</strong> Veterans, Age 55 and Older: Age by<br />
Location<br />
41.0%<br />
42.4%<br />
32.3% 31.7%<br />
26.7% 25.9%<br />
40.4%<br />
35.4%<br />
24.2%<br />
Southern Urban/Metro Northern Urban/Metro Rural/Frontier<br />
55 to 64 years<br />
65 to 74 years<br />
75 years and over<br />
(U.S. Census Bureau: ACS 5-Year Estimates-B21001, 2006-2010)<br />
Griswold and Packham’s (2011) estimated veteran<br />
population figures were approximately 4% larger<br />
than U.S. Census Bureau estimates (n=243,861). Age<br />
groupings also differed from the U.S. Census with<br />
older adults divided into ages 45 and under, 45-64,<br />
65-85 and 86 and older (see Figure P30). Using these<br />
data, 78,364 (32.1%) are 65-85, and 9,772 (4%) are 86<br />
and older. Consistent with the U.S. Census Bureau<br />
data, the majority <strong>of</strong> older veterans reside in the<br />
Southern Urban/Metropolitan area.<br />
Looking only at <strong>Nevada</strong>’s Rural/Frontier counties,<br />
the greatest concentrations <strong>of</strong> veterans are in Nye<br />
(3%), Lyon (2.8%) and Douglas (2.5%) counties. The<br />
fewest are in Esmeralda (0.1%) and Eureka (0.1%)<br />
counties (see Table P17; U.S. Census Bureau ACS<br />
5-Year Estimates-B21001, 2006-2010). Analysis <strong>of</strong><br />
the rural veteran population by age group (e.g., 55-<br />
64, 65-74, 75 and older) across counties reveals the<br />
highest percentage <strong>of</strong> veterans 55 to 64 exists in Nye<br />
County (3.1%) with Douglas County (2.6%) a close<br />
second. For veterans 65-74, the highest percentages<br />
live in Nye (4.5%), Douglas (3.2%) and Lyon (2.9%)<br />
counties. Among rural veterans 75 and older, the<br />
highest percentages exist in Douglas (3.6%); Nye<br />
(3.3%) and Lyon (2.8%) counties (see Table P17).<br />
When the population <strong>of</strong> veterans within the Rural/<br />
Frontier counties was examined, more veterans 55-<br />
64 were found to live in Douglas (27.5%), Esmeralda<br />
(41.5%), Lander (45.5%), Pershing (27.1%) and<br />
White Pine (29.3%) than were veterans from any<br />
other age group. In addition, Eureka (37.6%) and<br />
Storey (37.5%) counties have more veterans 65-<br />
74 than from any other age group. Veterans in the<br />
remaining counties are most likely to be ages 35-54<br />
(U.S. Census Bureau ACS 5-Year Estimates-B21001,<br />
2006-2010).<br />
67.8%<br />
Fig. P30: Percentage <strong>of</strong> Older Veterans by Location<br />
72.2%<br />
17.0%<br />
Age 65 to 85<br />
16.0% 15.2% 15.9%<br />
Southern Urban/Metropolitan Northern Urban/Metropolitan Rural/Frontier<br />
(Griswold & Packham, 2011)<br />
Age 86 and Older<br />
Of the Rural/Frontier counties, the largest percent<br />
<strong>of</strong> veterans reside in Douglas (6,526; 2.7%), Lyon<br />
(6,203; 2.5%) and Nye (5,319; 2.2%). Of those 65-<br />
85, the highest percentages are found in Nye (2,414;<br />
3.1%), Lyon (2,238; 2.9%), Douglas (1,547; 2.9%) and<br />
Elko (1,547; 2.0%) counties. Of those 86 and older,<br />
the highest percentages are in Douglas (271; 2.8%)<br />
and Lyon (256; 2.6%) counties (see Table P18).<br />
18
Table P1<br />
<strong>Nevada</strong> Population Growth by Cohort and Year<br />
Cohort 2010 2020 2030<br />
Pop % Pop % Pop %<br />
65 to 74 Years <strong>of</strong> Age 192,789 7.1% 261,055 8.6% 311,523 9.3%<br />
75 to 84 Years <strong>of</strong> Age 99,895 3.7% 129,900 4.3% 174,630 5.2%<br />
85 Years <strong>of</strong> Age and Over 31,316 1.2% 40,080 1.3% 52,535 1.6%<br />
Total <strong>Nevada</strong> 2,706,401 3,043,639 3,338,310<br />
Population<br />
(Hardcastle, 2012)<br />
19
Population<br />
20<br />
Table P2<br />
County and State Population<br />
County Pop 2010 Pop 2011 Pop 65+ % 65+ Pers/ Office <strong>of</strong> Census National 2103 Elders<br />
2011 2011 sq. Management Bureau Frontier Count: Urban<br />
mile & Budget 2010 Comm. and<br />
2010 Center Rural/Frontier<br />
Carson City 55,274 55,439 9,425 17.0% 382.1 Metropolitan Urban Urban N. Urban/Metro<br />
Churchill 24,877 24,637 3,868 15.7% 5.0 Micropolitan Rural Frontier Rural/Frontier<br />
Clark 1,951,269 1,969,975 230,487 11.7% 247.3 Metropolitan Urban Urban S. Urban/Metro<br />
Douglas 46,997 46,886 9,893 21.1% 66.2 Micropolitan Rural Rural Rural/Frontier<br />
Elko 48,818 49,491 4,306 8.7% 2.8 Micropolitan Rural Frontier Rural/Frontier<br />
Esmeralda 783 775 203 26.2% 0.2 Non-Metro Rural Frontier Rural/Frontier<br />
Eureka 1,987 1,979 265 13.4% 0.5 Micropolitan Rural Frontier Rural/Frontier<br />
Humboldt 16,528 16,735 1,724 10.3% 1.7 Non-Metro Rural Frontier Rural/Frontier<br />
Lander 5,775 5,841 701 12.0% 1.1 Non-Metro Rural Frontier Rural/Frontier<br />
Lincoln 5,345 5,311 993 18.7% 0.5 Non-Metro Rural Frontier Rural/Frontier<br />
Lyon 51,980 51,871 8,870 17.1% 26.0 Non-Metro Urban Frontier Rural/Frontier<br />
Mineral 4,772 4,593 1043 22.7% 1.3 Non-Metro Rural Frontier Rural/Frontier<br />
Nye 43,946 43,351 10,664 24.6% 2.4 Micropolitan Rural Frontier Rural/Frontier<br />
Pershing 6,753 6,734 956 14.2% 1.1 Non-Metro Rural Frontier Rural/Frontier<br />
Storey 4,010 3,896 771 19.8% 15.3 Metropolitan Rural Rural Rural/Frontier<br />
Washoe 421,407 425,710 53,639 12.6% 66.9 Metropolitan Urban Urban N. Urban/Metro<br />
White Pine 10,030 10,098 1,535 15.2% 1.1 Non-Metro Rural Frontier Rural/Frontier<br />
<strong>Nevada</strong> 2,700,552 2,720,028 340,003 12.5%<br />
U.S. 308,747,508 311,587,816 41,441,180 13.3%<br />
(Modified from Griswold & Packham, 2011, p. xii; State & County Quickfacts, 2012)
Table P3<br />
Percent Change <strong>of</strong> <strong>Nevada</strong> Population 65 and Older<br />
County 2007 Census Estimates % Age 65 Years and Older<br />
(2009 Elders Count) 2011 Census Estimates<br />
Carson City 15.8% 17.0%<br />
Churchill 13.6% 15.7%<br />
Clark 10.4% 11.7%<br />
Douglas 18.0% 21.1%<br />
Elko 7.4% 8.7%<br />
Esmeralda 24.7% 26.2%<br />
Eureka 14.9% 13.4%<br />
Humboldt 9.5% 10.3%<br />
Lander 9.1% 12.0%<br />
Lincoln 23.3% 18.7%<br />
Lyon 13.2% 17.1%<br />
Mineral 21.4% 22.7%<br />
Nye 20.9% 24.6%<br />
Pershing 9.2% 14.2%<br />
Storey 10.7% 19.8%<br />
Washoe 11.4% 12.6%<br />
White Pine 15.2% 15.2%<br />
NEVADA 11.1% 12.5%<br />
UNITED STATES 12.6% 13.0%<br />
Population<br />
(State & County Quickfacts, 2012; Note: Bolded counties have higher percentage <strong>of</strong> older adults than found in U.S.)<br />
Table P4<br />
Population Migration to <strong>Nevada</strong>, 2006-2010: Age by Area<br />
N. Urban S. Urban Rural/Frontier<br />
Moved from different state<br />
50-64 years 2,788 13,414 1,382<br />
65-74 years 732 3,952 346<br />
75+ years 605 2,355 547<br />
Sub-Total 4,125 19,721 2,275<br />
Moved from abroad<br />
50-64 years 320 1,894 56<br />
65-74 years 24 521 0<br />
75+ years 79 140 11<br />
Sub-Total: 423 2,555 67<br />
Total migration by region 4,548 22,276 2,342<br />
(American Community Survey, 5-year Estimates-B07401, 2006-2010)<br />
21
Population<br />
Table P5<br />
Percentage Senior Migration to <strong>Nevada</strong>, 2006-2010: Age within Counties<br />
Total by Age<br />
50-64 65-74 75 and Older Total<br />
% w/in % w/in % w/in % w/in<br />
Freq. County Freq. County Freq. County Freq. County<br />
<strong>Nevada</strong><br />
Total 19,854 68.1% 5,575 19.1% 3,737 12.8% 29,166 100.0%<br />
Churchill 185 62.3% 0 112 37.7% 297 1.0%<br />
Clark 15,308 68.7% 4,473 20.1% 2,495 11.2% 22,276 76.4%<br />
Douglas 309 67.5% 91 19.9% 58 12.7% 458 1.6%<br />
Elko 192 77.7% 30 12.1% 25 10.1% 247 0.8%<br />
Esmeralda 0 15 100.0% 0 15 0.1%<br />
Eureka 0 0 0 0 0.0%<br />
Humboldt 117 84.8% 21 15.2% 0 138 0.5%<br />
Lander 25 75.8% 0 8 24.2% 33 0.1%<br />
Lincoln 8 100.0% 0 0 8 0.0%<br />
Lyon 151 44.2% 16 4.7% 175 51.2% 342 1.2%<br />
Mineral 29 100.0% 0 0 29 0.1%<br />
Nye 312 47.2% 169 25.6% 180 27.2% 661 2.3%<br />
Pershing 10 100.0% 0 0 10 0.0%<br />
Storey 0 0 0 0 0.0%<br />
Washoe 2,857 69.3% 650 15.8% 618 15.0% 4,125 14.1%<br />
White Pine 100 96.2% 4 3.8% 0 104 0.4%<br />
Carson City 251 59.3% 106 25.1% 66 15.6% 423 1.5%<br />
(American Community Survey, 5-year Estimates-B07001, 2006-2010)<br />
22
Table P6<br />
Senior Migration to <strong>Nevada</strong>, 2006-2010 within Counties by Age, Domestic and Abroad<br />
Total Moved from Different State Total Moved from Abroad<br />
50-64 65-74 75+ Total 50-64 65-74 75+ Total<br />
17,584 5,030 3,507 26,121 2,270 545 230 3,045<br />
67.3% 19.3% 13.4% 100.0% 74.5% 17.9% 7.6% 100.0%<br />
<strong>Nevada</strong> % Migration Age w/in County % within <strong>Nevada</strong> % Migration Age w/in County % within <strong>Nevada</strong><br />
Churchill 56.9% 43.1% 1.0% 100.0% 1.2%<br />
Clark 68.0% 20.0% 11.9% 75.5% 74.1% 20.4% 5.5% 83.9%<br />
Douglas 68.4% 20.8% 10.8% 1.7% 47.6% 52.4% 0.7%<br />
Elko 77.7% 12.1% 10.1% 0.9% 0.0%<br />
Esmeralda 100.0% 0.1% 0.0%<br />
Eureka 0.0% 0.0%<br />
Humboldt 83.7% 16.3% 0.5% 100.0% 0.3%<br />
Lander 75.8% 24.2% 0.1% 0.0%<br />
Lincoln 100.0% 0.03% 0.0%<br />
Lyon 44.2% 4.7% 51.2% 1.3% 0.0%<br />
Mineral 100.0% 0.1% 0.0%<br />
Nye 47.2% 25.6% 27.2% 2.5% 0.0%<br />
Pershing 100.0% 0.0% 0.0%<br />
Storey 0.0% 0.0%<br />
Washoe 68.1% 16.7% 15.2% 14.3% 80.6% 6.4% 13.0% 12.4%<br />
White Pine 96.2% 3.8% 0.4% 0.0%<br />
Carson City 62.3% 28.1% 9.5% 1.4% 34.8% 65.2% 1.5%<br />
(American Community Survey, 5-year Estimates-B07001, 2006-2010)<br />
Population<br />
23
Population<br />
Table P7<br />
<strong>Nevada</strong> Population: Age 50 and Older<br />
Males<br />
Females<br />
Age Groups Population % Total Population % Total<br />
50 to 64 years 247,374 61.8% 252,862 59.4%<br />
65 to 74 years 97,108 24.3% 100,673 23.8%<br />
75 to 84 years 44,862 11.2% 51,529 12.2%<br />
85 years and over 11,017 2.8% 19,170 4.5%<br />
Total 400,361 422,234<br />
(Hardcastle, 2012)<br />
Table P8<br />
Population Percentages: Sex, Age, and Area<br />
Male<br />
Female<br />
50-64 65-74 75-84 85+ 50-64 65-74 75-84 85+<br />
Southern 62.1% 24.0% 11.3% 2.3% 59.6% 24.0% 12.1% 4.3%<br />
Urban/Metro<br />
Northern 63.3% 23.1% 10.5% 3.2% 59.7% 22.3% 12.5% 5.6%<br />
Urban/Metro<br />
Rural/Frontier 58.3% 27.1% 11.9% 2.7% 57.8% 25.6% 12.3% 4.3%<br />
(U.S. Census: PCT 12 Sex by Age, 2010)<br />
24
Table P9<br />
U.S. versus <strong>Nevada</strong>: Race and Ethnicity<br />
United States <strong>Nevada</strong><br />
Total Population: 308,745,538 2,700,551<br />
Not Hispanic or Latino:<br />
White alone 63.7% 54.1%<br />
Black or African American alone 12.2% 7.7%<br />
American Indian and Alaska Native alone 0.7% 0.9%<br />
Asian alone 4.7% 7.1%<br />
Native Hawaiian and Other Pacific Islander alone 0.2% 0.6%<br />
Some Other Race alone 0.2% 0.2%<br />
Two or More Races 1.9% 2.9%<br />
Hispanic or Latino: Of Any Race 16.3% 26.5%<br />
100.0% 100.0%<br />
Population<br />
(Hardcastle, 2012)<br />
Table P10<br />
U.S. versus <strong>Nevada</strong>, Adults Age 65 and Older: Race and Ethnicity<br />
United States <strong>Nevada</strong><br />
Total: 40,267,984 324,359<br />
Not Hispanic or Latino:<br />
White alone 80.0% 76.6%<br />
Black or African American alone 8.4% 5.8%<br />
American Indian and Alaska Native alone 0.4% 0.7%<br />
Asian alone 3.4% 6.6%<br />
Native Hawaiian and Other Pacific Islander alone 0.1% 0.3%<br />
Some Other Race alone 0.1% 0.1%<br />
Two or More Races 0.7% 1.1%<br />
Hispanic or Latino: Of Any Race 6.9% 8.8%<br />
100.0% 100.0%<br />
(Hardcastle, 2012)<br />
25
Population<br />
<strong>Nevada</strong> Race/Ethnicity: Age 65 and Older<br />
Table P11<br />
S. Urban N. Urban Rural % % %<br />
Metro Metro Frontier S. Urban N. Urban Rural<br />
Metro Metro Frontier<br />
White 164,726 51,038 38,486 80.1% 90.7% 93.6%<br />
Black or African American 16,452 761 363 8.0% 1.4% 0.9%<br />
American Indian and Alaska Native 823 711 891 0.4% 1.3% 2.2%<br />
Asian 16,452 2,315 628 8.0% 4.1% 1.5%<br />
Native Hawaiian and Other 823 190 0 0.4% 0.3% 0.0%<br />
Pacific Islander<br />
Some other race 4,113 634 404 2.0% 1.1% 1.0%<br />
Two or more races 2,262 596 476 1.1% 1.1% 1.2%<br />
Hispanic or Latino origin (<strong>of</strong> any race) 19,948 3,482 1,723 9.7% 6.2% 4.2%<br />
Total population 205,650 56,292 41,097 100.0% 100.0% 100.0%<br />
(American Community Survey, 5-Year Estimates-S0103, 2006-2010)<br />
Table P12<br />
Education Attainment: 65 and older<br />
% %<br />
Southern Northern<br />
Urban Urban % Rural<br />
Educational Attainment U.S. % U.S. % NV Metro Metro Frontier<br />
High <strong>School</strong> or less 9,434,470 24.3% 18.7% 20% 14% 18%<br />
High school graduate, GED, 13,337,303 34.4% 33.2% 33% 31% 38%<br />
or alternative<br />
Some college, no degree 6,676,635 17.2% 23.3% 22% 26% 25%<br />
Associate’s degree 1,530,368 3.9% 5.1% 5% 5% 5%<br />
Bachelor’s degree 4,370,999 11.3% 11.7% 12% 14% 8%<br />
Graduate or pr<strong>of</strong>essional degree 3,399,638 8.8% 8.1% 8% 10% 6%<br />
Totals 38,749,413 100% 100% 100% 100% 100%<br />
(American Community Survey, 5-Year Estimates-B15001, 2006-2010)<br />
26
Table P13<br />
Marital Status in Adults 60 and Older: U.S. and <strong>Nevada</strong> Population<br />
Never Married % Married % Divorced % Widowed %<br />
Males<br />
U.S. 1,248,602 5.2 17,681,616 73.8 2,594,177 10.8 2,450,219 10.2<br />
<strong>Nevada</strong> 11,273 5.3 148,021 69.2 34,239 16.0 20,238 9.5<br />
Females<br />
U.S. 1,510,859 5.0 14,449,316 47.8 4,007,867 13.3 10,266,424 34.0<br />
<strong>Nevada</strong> 7,243 3.1 114,563 49.4 43,324 18.7 66,609 28.7<br />
Population<br />
(American Community Surey, 5-Year Estimates-B12002, 2006-2010)<br />
Table P14<br />
<strong>Nevada</strong> Secretary <strong>of</strong> State’s Voter Registration Statistics<br />
Age Group Democrat Green Indep. Libertarian Non- Other Republican Total<br />
American<br />
Partisan<br />
18-24 35,506 454 5,345 966 22,155 392 22,865 87,683<br />
25-34 59,196 832 8,575 1,504 33,300 835 43,349 147,591<br />
35-44 64,969 494 8,106 1,224 30,519 698 56,981 162,991<br />
45-54 79,625 370 8,481 1,122 28,961 648 80,775 199,982<br />
55-64 86,335 330 8,166 963 28,457 550 80,967 205,768<br />
65 and over 107,451 122 9,347 604 27,372 509 109,361 254,766<br />
Not Specified 14 0 2 0 5 0 6 27<br />
Statewide 433,096 2,602 48,022 6,383 170,769 3,632 394,304 1,058,808<br />
(Miller, 2012, Chart Directly from Website)<br />
27
Population<br />
Table P15<br />
U.S. Department <strong>of</strong> Veterans Affairs: <strong>Nevada</strong> Veterans<br />
Conflict or Arena Population Percent <strong>of</strong> Total<br />
Peace-time 64,300 26.4%<br />
War-time 179,600 73.6%<br />
• World War II (1939-1945) 17,700 7.3%<br />
• Korean Conflict (1950-1953) 25,100 10.3%<br />
• Vietnam War (1955-1975) 86,000 35.3%<br />
• Gulf-War (August 1990-February 1991) 62,200 25.5%<br />
Total 243,900*<br />
*Totals do not match, because veterans may have been in more than one conflict.<br />
(U.S. Department <strong>of</strong> Veterans Affairs, 2012)<br />
Table P16<br />
Population: Older Adult Veterans in the U.S. and <strong>Nevada</strong><br />
Southern Northern<br />
Urban Urban Rural<br />
U.S. <strong>Nevada</strong> Metro Metro Frontier<br />
Male Veterans 25,397,315 143,769 93,095 28,541 22,133<br />
55 to 64 years: 16,518,862 59,055 37,994 12,149 8,912<br />
65 to 74 years: 4,202,152 46,935 30,119 8,970 7,846<br />
75 years and over: 4,676,301 37,779 24,982 7,422 5,375<br />
Female Veterans 485,712 5,301 3,453 1139 709<br />
55 to 64 years: 209,022 2,364 1,618 433 313<br />
65 to 74 years: 102,871 1,751 1,060 441 250<br />
75 years and over: 173,819 1,186 775 265 146<br />
Total Veterans Age 55+ 25,883,027 149,070 96548 29,680 22,842<br />
(U.S. Census Bureau: ACS 5-Year Estimates-B21001, 2006-2010)<br />
28
Table P17<br />
<strong>Nevada</strong> Veterans: Numbers and Percentage within Counties<br />
18-35 Years 35-54 Years 55-64 Years 65-74 Years 75 Years and Older<br />
Total Pop. <strong>of</strong> % w/in Pop. <strong>of</strong> % w/in Pop. <strong>of</strong> % w/in Pop. <strong>of</strong> % w/in Pop. <strong>of</strong> % w/in<br />
vets Vets County Vets County Vets County Vets County Vets County<br />
1,575 23.8% 1,931 29.2% 1,158 17.5% 1,424 21.5%<br />
Carson 6,609 521 7.9%<br />
341 10.1% 1,075 31.8% 966 28.5% 572 16.9% 430 12.7%<br />
Churchill 3,384<br />
13,980 8.9% 46,036 29.4% 39,612 25.3% 31,179 19.9% 25,757 16.5%<br />
Clark 156,564<br />
1,137 19.4% 1,615 27.5% 1,535 26.1% 1,407 24.0%<br />
Douglas 5,870 176 3.0%<br />
Elko 3,965 212 5.3% 1,301 32.8% 1,249 31.5% 849 21.4% 354 8.9%<br />
0.0% 30 13.8% 90 41.5% 68 31.3% 29 13.4%<br />
Esmeralda 217 0<br />
5.9% 39 19.3% 46 22.8% 76 37.6% 29 14.4%<br />
Eureka 202 12<br />
28 2.0% 511 37.4% 358 26.2% 253 18.5% 216 15.8%<br />
Humboldt 1,366<br />
8.1% 102 20.7% 224 45.5% 63 12.8% 63 12.8%<br />
Lander 492 40<br />
80 13.8% 175 30.3% 229 39.6% 88 15.2%<br />
Lincoln 578 6 1.0%<br />
10.4% 1,794 27.0% 1,666 25.1% 1,389 20.9% 1,097 16.5%<br />
Lyon 6,637 691<br />
4.7% 231 32.1% 197 27.4% 109 15.1% 149 20.7%<br />
Mineral 720 34<br />
1,421 20.1% 1,917 27.1% 2,203 31.1% 1,269 17.9%<br />
Nye 7,083 273 3.9%<br />
7.0% 369 40.8% 201 22.2% 197 21.8% 74 8.2%<br />
Pershing 904 63<br />
2.0% 155 24.0% 160 24.8% 242 37.5% 76 11.8%<br />
Storey 646 13<br />
2,870 7.6% 9,573 25.5% 10,651 28.3% 8,253 21.9% 6,263 16.7%<br />
Washoe 37,610<br />
11 0.9% 311 25.2% 361 29.3% 311 25.2% 340 27.6%<br />
White Pine 1,234<br />
19,271 8.2% 65,740 28.1% 61,419 26.2% 48,686 20.8% 39,065 16.7%<br />
Total 234,081<br />
(U.S. Census Bureau: ACS 5-Year Estimates-B21001, 2006-2010)<br />
Population<br />
29
Population<br />
30<br />
Table P18<br />
<strong>Nevada</strong> Veterans: Numbers and Percentage within Counties<br />
Across Across<br />
% Across 45 and % w/in % w/in 65 to % w/in the Over % w/in the<br />
Total Counties under county 45 to 64 County 85 County Counties 85 County Counties<br />
Carson 6,572 1,096 16.7% 2,759 42.0% 2,374 36.1% 3.0% 343 5.2% 3.5%<br />
Churchill 3,661 1.5% 689 18.8% 1,633 44.6% 1,199 32.8% 1.5% 140 3.8% 1.4%<br />
69.0% 36,846 21.9% 71,156 42.3% 53,106 31.6% 67.8% 7,056 4.2% 72.2%<br />
Clark 168,164<br />
Douglas 6,526 2.7% 1,148 17.6% 2,798 42.9% 2,309 35.4% 2.9% 271 4.2% 2.8%<br />
Elko 3,990 1.6% 664 16.6% 1,636 41.0% 1,547 38.8% 2.0% 143 3.6% 1.5%<br />
0.1% 18 13.2% 52 38.2% 60 44.1% 0.1% 6 4.4% 0.1%<br />
Esmeralda 136<br />
0.1% 30 17.0% 81 46.0% 62 35.2% 0.1% 3 1.7% 0.0%<br />
Eureka 176<br />
0.6% 230 16.9% 621 45.6% 467 34.3% 0.6% 44 3.2% 0.5%<br />
Humboldt 1,362<br />
0.2% 100 18.4% 250 46.0% 183 33.7% 0.2% 10 1.8% 0.1%<br />
Lander 543<br />
Lincoln 662 0.3% 126 19.0% 303 45.8% 225 34.0% 0.3% 8 1.2% 0.1%<br />
Lyon 6,203 2.5% 1,021 16.5% 2,688 43.3% 2,238 36.1% 2.9% 256 4.1% 2.6%<br />
0.2% 72 12.1% 232 38.9% 263 44.1% 0.3% 30 5.0% 0.3%<br />
Mineral 597<br />
Nye 5,319 2.2% 718 13.5% 2,068 38.9% 2,414 45.4% 3.1% 119 2.2% 1.2%<br />
0.3% 127 18.1% 313 44.7% 239 34.1% 0.3% 21 3.0% 0.2%<br />
Pershing 700<br />
0.3% 141 19.8% 331 46.6% 227 31.9% 0.3% 12 1.7% 0.1%<br />
Storey 711<br />
15.3% 7,210 19.3% 17,999 48.1% 10,982 29.4% 14.0% 1,218 3.3% 12.5%<br />
Washoe 37,409<br />
0.5% 149 13.2% 420 37.2% 469 41.5% 0.6% 92 8.1% 0.9%<br />
White Pine 1,130<br />
Total 243,861 100.0% 50,385 20.7% 105,340 43.2% 78,364 32.1% 100.0% 9,772 4.0% 100.0%<br />
69.0% 36,846 21.9% 71,156 42.3% 53,106 31.6% 67.8% 7,056 4.2% 72.2%<br />
Southern 168,164<br />
Urban/Metropolitan<br />
18.0% 8,306 18.9% 20,758 47.2% 13,356 30.4% 17.0% 1,561 3.5% 16.0%<br />
Northern 43,981<br />
Urban/Metropolitan<br />
Rural/Frontier 30,561 18.2% 5,233 17.1% 13,426 43.9% 11,902 38.9% 15.2% 1,551 5.1% 15.9%<br />
(Griswold & Packham, 2011)
In future years, <strong>Nevada</strong> will be billions<br />
<strong>of</strong> dollars short in road funding due in<br />
part to increases in inflation, increased<br />
use <strong>of</strong> alternative fuel vehicles, and new<br />
fuel efficiency standards expected to cut fuel<br />
consumption nearly in half after 2016.<br />
(Performance Analysis Division: State <strong>of</strong> <strong>Nevada</strong> 2011<br />
Facts and Figures, 2011, p. 15)<br />
Transportation<br />
& Infrastructure<br />
Transportation Access for Older Adults<br />
Older Adult Ridership<br />
<strong>Nevada</strong>’s Transportation Infrastructure<br />
Author: Angela D. Broadus<br />
Content Reviewer: Tim Mueller
TRANSPORTATION & infrastructure<br />
Highlights<br />
Mobility and transportation safety are crucial to<br />
the health and welfare <strong>of</strong> <strong>Nevada</strong>’s residents and<br />
are <strong>of</strong> utmost concern to the <strong>Nevada</strong> Department<br />
<strong>of</strong> Transportation (NDOT) and the Department<br />
<strong>of</strong> Public Safety (DPS). NDOT addresses mobility<br />
needs through various forms <strong>of</strong> public transportation,<br />
administration <strong>of</strong> the government’s Federal Transit<br />
Administration grants, and monitoring rural<br />
transit providers to ensure <strong>com</strong>pliance with federal<br />
guidelines. In <strong>Nevada</strong>’s Strategic Highway Safety<br />
Plan for fiscal year 2012, the DPS also addressed<br />
transportation safety through the identification <strong>of</strong><br />
five areas the DPS deemed crucial to the reduction <strong>of</strong><br />
traffic accidents and fatalities: seat belt use, impaired<br />
driving, lane departures, intersection crashes and<br />
pedestrian safety (<strong>Nevada</strong> Department <strong>of</strong> Public<br />
Safety, 2011, p. 5).<br />
The following sections highlight transportation<br />
and infrastructure issues and resources particularly<br />
relevant to <strong>Nevada</strong>’s older adults.<br />
Transportation Safety<br />
• Age-related changes in vision, hearing,<br />
cognition and response time can <strong>com</strong>promise an<br />
individual’s ability to drive safely, resulting in the<br />
potential for decreased mobility and increased<br />
concerns about transportation safety.<br />
Older Adult Ridership<br />
• From 2009 to 2001, total public-transportation<br />
ridership, including seniors, increased by almost<br />
14%.<br />
• In 2009 and 2011, Douglas County reported the<br />
highest level <strong>of</strong> ridership, while Storey County<br />
reported no use <strong>of</strong> public transportation. (Note:<br />
Ridership data did not provide a rationale for<br />
zero reported use <strong>of</strong> transportation within Storey<br />
County.)<br />
• From 2009 to 2011, ridership increased<br />
significantly in Washoe, Douglas and Lander<br />
counties and Carson City.<br />
<strong>Nevada</strong>’s Transportation Infrastructure<br />
• In 2011, NDOT began the second phase <strong>of</strong> the<br />
multi-agency study Connecting <strong>Nevada</strong>. Goals<br />
<strong>of</strong> this study included redefining <strong>Nevada</strong>’s<br />
transportation planning process through<br />
collaboration with federal, state, regional and<br />
local agencies and stakeholders, and improving<br />
<strong>Nevada</strong>’s transportation network for future<br />
generations. The study was expected to be<br />
<strong>com</strong>pleted in the first quarter <strong>of</strong> 2013 followed by<br />
data analysis and planning. To date, the project<br />
has connected with more than 150 stakeholders<br />
across the state.<br />
Transportation Access for Older Adults<br />
• <strong>Nevada</strong> has four transportation agencies that<br />
work to increase mobility for seniors:<br />
— Regional Transportation Commission <strong>of</strong><br />
Washoe County<br />
— Regional Transportation Commission for<br />
Southern <strong>Nevada</strong><br />
— Carson Area Metropolitan Planning<br />
Organization<br />
— Tahoe Metropolitan Planning Organization<br />
• Annual federal funding <strong>of</strong> approximately $8<br />
million allows <strong>Nevada</strong>’s public-transportation<br />
system to provide more than 1 million rides per<br />
year to seniors, people with disabilities, and the<br />
public.<br />
32
Transportation Safety<br />
As people age, many experience changes in<br />
vision, hearing, cognition and response time that<br />
<strong>com</strong>promise an individual’s ability to drive safely,<br />
resulting in the potential for decreased mobility<br />
and increased concerns about transportation safety<br />
(Staplin, Lococo, Stewart, & Decina, 1999). For<br />
example, in one Texas study, adults older than 65 who<br />
had been in an automobile accident were 1.8 times<br />
more likely than all adults 55-64 to have had a health<br />
condition or physical limitation prior to the accident<br />
(Griffin, 2004, p. 41). This association increased to 2.4<br />
times in adults 75 and older and to 3.1 times in adults<br />
85 and older (ibid, p. 42). In addition, after controlling<br />
for other factors, increases in age were associated with<br />
significant increases in the probability <strong>of</strong> dying from<br />
an automobile accident (see Figure T1).<br />
Transportation Access for Older Adults<br />
4<br />
3.5<br />
3<br />
2.5<br />
2<br />
1.5<br />
1<br />
0.5<br />
0<br />
Fig. T1: Relative Likelihood <strong>of</strong> Death in<br />
Automobile Accident by Age<br />
1.78<br />
2.59<br />
Death<br />
(Griffin, 2004, p. 35-36)<br />
To minimize the risk <strong>of</strong> unsafe drivers while meeting<br />
the mobility needs <strong>of</strong> older adults, it is essential<br />
that <strong>Nevada</strong> <strong>of</strong>fers safe and reliable transportation<br />
alternatives. In the sections below, we first highlight<br />
<strong>Nevada</strong>’s general transportation infrastructure issues<br />
and the efforts to resolve the issues. Next, we discuss<br />
the availability and use <strong>of</strong> alternative modes <strong>of</strong><br />
transportation for seniors.<br />
3.72<br />
65 Years and Older<br />
75 Years and Older<br />
85 Years and Older<br />
transportation & infrastructure<br />
<strong>Nevada</strong> has four transportation agencies that<br />
increase mobility for seniors (see Table T1). In<br />
addition, the <strong>Nevada</strong> Department <strong>of</strong> Transportation<br />
(NDOT) has three regional centers, in Las Vegas,<br />
Reno and Elko, and six sub-district <strong>of</strong>fices, in<br />
Las Vegas, Carson City, Elko, Ely, Tonopah and<br />
Winnemucca.<br />
Public transportation improves the quality <strong>of</strong><br />
life for many <strong>Nevada</strong> seniors and individuals<br />
with disabilities by providing access to needed<br />
services, food, medical assistance, social activities<br />
and employment. Annual federal funding <strong>of</strong><br />
approximately $8 million allows <strong>Nevada</strong>’s public<br />
transportation system to provide more than 1 million<br />
rides per year to seniors, those with disabilities,<br />
and the general public (see, Table T3; Performance<br />
Analysis Division: State <strong>of</strong> <strong>Nevada</strong> 2011 Facts and<br />
Figures, 2011). Between 2010 and 2011, Federal<br />
Transit Administration funds allowed NDOT to<br />
purchase 400 buses and transit vehicles, and to hire<br />
additional rural drivers (p. 4). This funding was<br />
essential to meet growing public-transportation<br />
needs in 60 <strong>Nevada</strong> <strong>com</strong>munities and the state’s 25<br />
federally recognized Indian colonies.<br />
The Grants Management Advisory Committee for<br />
the <strong>Nevada</strong> Department <strong>of</strong> Health and Human<br />
Services conducted a statewide needs survey in May<br />
2012 that included items about barriers to obtaining<br />
public transportation. Of the 3,059 participants<br />
who <strong>com</strong>pleted the online version <strong>of</strong> the survey,<br />
the highest percentage <strong>of</strong> respondents (~80%)<br />
identified the cost <strong>of</strong> gasoline as a barrier to travel<br />
(Grants Management Unit, 2012, p. 20). Other<br />
barriers included vehicle maintenance costs, lack<br />
<strong>of</strong> public transportation, lack <strong>of</strong> knowledge about<br />
how to use public transportation, lack <strong>of</strong> funds to<br />
use public transportation, and not driving. Survey<br />
participants believed that rural <strong>com</strong>munities have<br />
greater problems accessing transportation than do<br />
urban <strong>com</strong>munities. For example, respondents noted<br />
that Ely is more than a two-hour drive from Elko or<br />
a four-hour drive from Reno, but Ely has no public<br />
transit system and only one <strong>com</strong>mercial airline<br />
flight per week. Over 50% <strong>of</strong> residents in Humboldt<br />
County live in outlying areas with no access to<br />
public transportation. However, Elko County has<br />
a good public-transportation system. Finally, the<br />
public transportation system in Las Vegas, although<br />
sophisticated, is not adequate to meet the needs <strong>of</strong><br />
all its residents (Grants Management Unit, 2012).<br />
33
TRANSPORTATION & infrastructure<br />
Older Adult Ridership<br />
Although public transportation is essential to<br />
meeting the growing mobility needs <strong>of</strong> <strong>Nevada</strong>’s<br />
seniors, obtaining accurate data on senior ridership is<br />
problematic. Total ridership data do not exist specific<br />
to the older adult population. Where data have been<br />
collected, the data on riders 65 and older have been<br />
confounded with the inclusion <strong>of</strong> individuals with<br />
disabilities <strong>of</strong> all ages and the general public. Other<br />
transportation services that receive NDOT funds (i.e.,<br />
sub-recipients), such as senior centers and regional<br />
services, do not collect age-specific data, although<br />
their pass<strong>eng</strong>ers are primarily from local senior<br />
centers. For example, Churchill County and other<br />
sub-recipients in Douglas, Esmeralda, Humboldt,<br />
Lander, Lincoln, Lyon, Mineral and Pershing counties<br />
might not report ridership by age alone, even though<br />
they regularly pick up pass<strong>eng</strong>ers from the county<br />
senior centers. Also, Douglas County operates the<br />
BlueGo transit with Lake Tahoe tourists, and the<br />
senior centers in Minden and Gardnerville operate<br />
the DART public transit system. Rural transit in White<br />
Pine operates through the White Pine County Senior<br />
Services (M. Gardner, Personal Communication,<br />
August 30, 2012).<br />
From the available data, it appears that total ridership,<br />
including seniors, increased by almost 14% between<br />
2009 and 2011 (see Table T2). By region, ridership<br />
increased in the Northern Urban/Metropolitan (0.2%<br />
to 3.9%) and Rural/Frontier (69.2% to 74.2%) regions<br />
and decreased in the Southern Urban/Metropolitan<br />
region (30.5% to 21.9%; see Figure T2). Douglas<br />
County had the highest level <strong>of</strong> ridership in both<br />
years. Interestingly, Storey County reported no use<br />
(or failed to report use) <strong>of</strong> the public transportation<br />
system. From 2009 to 2011, ridership increased<br />
significantly in Washoe, Douglas and Lander, counties<br />
and Carson City 1 .<br />
Fig. T2: Transit Ridership: Year by Region<br />
0.2%<br />
30.5%<br />
69.2%<br />
3.9%<br />
21.9%<br />
2009 2011<br />
74.2%<br />
Northern Urban/Metro Southern Urban/Metro Rural/Frontier<br />
(M. Gardner, Personal Communication, August 30, 2012; Performance<br />
Analysis Division: State <strong>of</strong> <strong>Nevada</strong> 2011 Facts and Figures, 2011)<br />
<strong>Nevada</strong>’s Transportation Infrastructure<br />
Building our state’s transportation infrastructure<br />
is essential to meet the growing mobility needs <strong>of</strong><br />
<strong>Nevada</strong>’s growing senior population. According<br />
to Senator Harry Reid, “<strong>Nevada</strong>’s transportation<br />
infrastructure is stretched to the limit...44% <strong>of</strong> the<br />
state’s roads are congested, and many state roads<br />
are in need <strong>of</strong> repair” (Reid-Issues, n.d., para. 1 and<br />
7). In 2008, the American Society <strong>of</strong> Civil Engineers<br />
(ASCE, 2009-2012) identified three top infrastructure<br />
concerns for <strong>Nevada</strong>: bridges, roads, and drinking<br />
water/hazardous waste (see Table T3). In this<br />
next section, we review current bridge and road<br />
infrastructure issues that highlight the barriers to<br />
mobility faced by <strong>Nevada</strong> seniors.<br />
Bridges are categorized as deficient if they have<br />
structural issues (poor load-carrying conditions),<br />
functional issues (below current design standards) or<br />
seismic issues [below current earthquake-resistant<br />
standards (Performance Analysis Division: State <strong>of</strong><br />
<strong>Nevada</strong>, 2011 Facts and Figures, 2011)]. <strong>Nevada</strong> has<br />
1,922 public bridges. Of these, NDOT maintains<br />
1,092; various governmental agencies maintain 792;<br />
and private citizens maintain 38. In 2011, NDOT<br />
designated almost 15% (or 285) <strong>of</strong> the bridges as<br />
deficient due to structural (18), functional (139),<br />
and seismic (128) problems (<strong>Nevada</strong> State Highway<br />
Preservation Report, 2011, page 39).<br />
34<br />
1<br />
Ridership data does not include the metropolitan transit services operating in Las Vegas, Reno and Carson City.
NDOT also is responsible for 20% <strong>of</strong> <strong>Nevada</strong>’s<br />
roads with over half <strong>of</strong> all vehicle miles traveled on<br />
NDOT-maintained roads. In 2007 and 2009, ASCE<br />
graded the U.S. road infrastructure with a “D” and a<br />
“D-” for poor-to-mediocre road conditions that cost<br />
Americans time and fuel and increase stress due to<br />
congestion. The conditions also cost motorists money<br />
in terms <strong>of</strong> road-induced need for auto repairs (see<br />
Table T3).<br />
In 2009, the American Recovery and Reinvestment<br />
Act allocated approximately $201 million to the<br />
<strong>Nevada</strong> Department <strong>of</strong> Transportation to improve<br />
the state’s transportation infrastructure and put<br />
<strong>Nevada</strong> residents back to work (NDOT: Projects and<br />
Programs, American Recovery and Reinvestment Act<br />
Overview, 2012). Approximately 30% <strong>of</strong> the money<br />
was allocated for transportation projects in the urban<br />
areas <strong>of</strong> the state (e.g., Clark and Washoe counties);<br />
3.5% was allocated to rural areas; and the remaining<br />
money was earmarked for other statewide projects.<br />
The 2011 Urban Mobility Report suggested that<br />
demand for new road construction and infrastructure<br />
repair in Las Vegas outstripped supplies by 30%<br />
(Schrank, Lomax, & Eisele, p. 50). In addition, in a<br />
review <strong>of</strong> 101 U.S. cities, Las Vegas ranked 36th in<br />
terms <strong>of</strong> traffic congestion. This resulted in 28 hours<br />
<strong>of</strong> delay per <strong>com</strong>muter annually, seven gallons <strong>of</strong><br />
excess fuel per auto per year, and an estimated $532<br />
total annual cost per auto (Schrank, et al., 2011).<br />
These congestion figures translate into a total annual<br />
congestion cost <strong>of</strong> $530 million in <strong>Nevada</strong> when the<br />
excess fuel costs are taken into account and delays<br />
are valued at $16 per hour for individuals and $88 per<br />
hour for large <strong>com</strong>mercial trucks.<br />
In 2011, NDOT embarked on the second phase <strong>of</strong><br />
the two-part, multi-agency study called Connecting<br />
<strong>Nevada</strong>. A goal <strong>of</strong> this study was to redefine<br />
<strong>Nevada</strong>’s transportation-planning process through<br />
collaboration with federal, state, regional and local<br />
agencies and stakeholders. Another goal was to<br />
improve <strong>Nevada</strong>’s transportation network for seniors<br />
and future generations.<br />
Tasks <strong>of</strong> the study included increasing public and<br />
stakeholder involvement in planning for <strong>Nevada</strong>’s<br />
future transportation needs through formal needs<br />
analysis and group discussion, and development <strong>of</strong><br />
a statewide travel-demand model, population and<br />
employment forecasts, and web map. The study<br />
was expected to be <strong>com</strong>pleted in the first quarter<br />
<strong>of</strong> 2013 followed by data analysis and planning. At<br />
the time <strong>of</strong> the publication <strong>of</strong> Elders Count <strong>Nevada</strong><br />
(2013), the project had connected with more than 150<br />
stakeholders across the state. For more information,<br />
please see www.connectingnevada.org.<br />
transportation & infrastructure<br />
35
TRANSPORTATION & infrastructure<br />
Table T1<br />
<strong>Nevada</strong> Transportation Agencies<br />
• Regional Transportation Commission Washoe County (RTC Washoe)<br />
• Regional Transportation Commission for Southern <strong>Nevada</strong> (RTC)<br />
• Carson Area Metropolitan Planning Organization (CAMPO)<br />
• Tahoe Metropolitan Planning Organization (TMPO)<br />
(NDOT-Personal Communication, 2012)<br />
Table T2<br />
Transit Ridership by County: Statewide Small Urban and Rural Transportation 2009 & 2011<br />
County Total Rides** Percent <strong>of</strong> Total<br />
2009 2011 2009 2011<br />
Carson City 1,257 4,094 0.1% 0.3%<br />
Churchill 44,795 36,970 3.6% 2.6%<br />
Clark 378,829 309,357 30.5% 21.9%<br />
Douglas 604,363 869,241 48.7% 61.6%<br />
Elko 96,726 50,412 7.8% 3.6%<br />
Esmeralda 7,742 6,957 0.6% 0.5%<br />
Eureka 2,991 0 0.2% 0.0%<br />
Humboldt 12,582 12,641 1.0% 0.9%<br />
Lander 1,490 2,962 0.1% 0.2%<br />
Lincoln 2,164 2,523 0.2% 0.2%<br />
Lyon 33,614 25,566 2.7% 1.8%<br />
Mineral 6,476 7,283 0.5% 0.5%<br />
Nye 21,685 18,512 1.7% 1.3%<br />
Pershing 11,254 6,638 0.9% 0.5%<br />
Storey 0 0 0.0% 0.0%<br />
Washoe 1,750 51,289 0.1% 3.6%<br />
White Pine 13,394 7,493 1.1% 0.5%<br />
Total 1,241,112 1,411,938 100.0% 100.0%<br />
Northern Urban/Metro 3,007 55,383 0.2% 3.9%<br />
Southern Urban/Metro 378,829 309,357 30.5% 21.9%<br />
Rural/Frontier 859,276 1,047,198 69.2% 74.2%<br />
**Includes adults over age 65, disabled adults, and the general public<br />
(http://www.nevadadot.<strong>com</strong>/uploadedFiles/NDOT/About_NDOT/NDOT_Divisions/Planning/Performance_Analysis/Fact%20Book%202011%20<br />
Final(1).pdf, p. 48; M. Gardner, Personal Communication, August 30, 2012)<br />
36
Table T3<br />
ASCE: Key Infrastructure Facts<br />
Bridges:<br />
• Sixteen percent <strong>of</strong> <strong>Nevada</strong>’s bridges are structurally deficient or functionally obsolete.<br />
• There are 165 high hazard dams in <strong>Nevada</strong>...whose failure would cause a loss <strong>of</strong> life and significant<br />
property damage.<br />
• Twenty-seven <strong>of</strong> <strong>Nevada</strong>’s 744 dams are in need <strong>of</strong> rehabilitation to meet applicable state dam safety<br />
standards.<br />
• Thirty-five percent <strong>of</strong> high hazard dams in <strong>Nevada</strong> have no emergency action plan (EAP). An EAP<br />
is a predetermined plan <strong>of</strong> action to be taken including roles, responsibilities and procedures for<br />
surveillance, notification and evacuation to reduce the potential for loss <strong>of</strong> life and property damage in<br />
an area affected by a failure or mis-operation <strong>of</strong> a dam.<br />
Roads:<br />
• Vehicle travel on <strong>Nevada</strong>’s highways increased 117% from 1990 to 2007.<br />
• Thirteen percent <strong>of</strong> <strong>Nevada</strong>’s roads are in poor or mediocre condition.<br />
• Fifty-nine percent <strong>of</strong> <strong>Nevada</strong>’s major urban highways are congested.<br />
• <strong>Nevada</strong>’s transportation department has identified 10 mega projects costing an estimated $4.8 billion<br />
that need to be <strong>com</strong>pleted by 2015 to avoid gridlock in urban areas.<br />
(ASCE, 2009-2012, para. #1, http://www.infrastructurereportcard.org/state-page/nevada)<br />
transportation & infrastructure<br />
37
The following section contains<br />
an overview <strong>of</strong> economic<br />
conditions affecting older adults<br />
in <strong>Nevada</strong>. Within each area and<br />
where possible, data is provided by<br />
age cohort and region. If relevant, the<br />
age group <strong>of</strong> 55-64 is also included as<br />
it shows the “future impact” <strong>of</strong> baby<br />
boomers as they age.<br />
The report relies mainly on data from<br />
the American Community Survey<br />
(ACS). The ACS is available for a<br />
one-year period (2010), three-year<br />
period (2008-2010), and a five-year<br />
period (2006-2010). The 2010 report<br />
provides the most recent data. The<br />
three- and five-year data are provided<br />
on a rolling-average basis and are<br />
less accurate because the information<br />
covers both recessionary and postrecessionary<br />
periods.<br />
As <strong>of</strong>ten as possible, the report relies<br />
on one-year 2010 ACS data. However,<br />
the data are available only for U.S.,<br />
state and large-county areas. For<br />
<strong>Nevada</strong>, one-year 2010 ACS data are<br />
available only for Washoe and Clark<br />
counties. ACS five-year data are used<br />
to describe the situation facing all<br />
counties in <strong>Nevada</strong>. The ACS 5-Year<br />
Public Use Microdata Sample (PUMS):<br />
<strong>Nevada</strong> 2006-2010 was used to create<br />
special crosstabs not available through<br />
the Census Bureau FactFinder website.<br />
Economics<br />
Labor Force Participation<br />
Median Household In<strong>com</strong>e<br />
Household In<strong>com</strong>e by In<strong>com</strong>e Quintile<br />
Assets<br />
Social Security Benefits<br />
Poverty<br />
Consumer Expenditure Shares<br />
Veterans<br />
Wherever possible, and beneficial to<br />
the report, the analysis <strong>com</strong>pares data<br />
between 2006 (“pre-recession”) and<br />
2010 (“post-recession”).<br />
Authors: Elizabeth Fadali, Jeffery Stroup, Eugenia Larmore, Robert Dick<br />
Content Reviewers: Thomas Harris, Caleb Cage
Economics<br />
Highlights<br />
The effects <strong>of</strong> the recession <strong>of</strong> 2007 to 2009 were<br />
not yet evident in the economic data series used<br />
in the 2009 edition <strong>of</strong> Elders Count <strong>Nevada</strong>. Elders<br />
Count <strong>Nevada</strong> (2013) provides a first look at the<br />
impact <strong>of</strong> the recession on <strong>Nevada</strong> seniors. On<br />
average, <strong>Nevada</strong> seniors weathered these difficult<br />
economic times better than their younger age<br />
cohorts. However, averages and even medians may<br />
not provide a <strong>com</strong>plete picture for the state’s most<br />
vulnerable, low in<strong>com</strong>e seniors. Listed below are<br />
highlights from the latest economic data on <strong>Nevada</strong><br />
seniors.<br />
Labor Force Participation<br />
• <strong>Nevada</strong> seniors increased labor force<br />
participation rates from 2007 to 2010, continuing<br />
a national trend over the last two decades.<br />
• Labor force participation decreased with age<br />
from about 25% for <strong>Nevada</strong>ns age 65-74 to only<br />
7% for seniors 75 and older.<br />
Median Household In<strong>com</strong>e<br />
• Seniors’ median household in<strong>com</strong>es were much<br />
lower than for all other age groups, except for<br />
households with a householder younger than 25.<br />
• Seniors were the only age cohort whose in<strong>com</strong>es<br />
increased from 2006 to 2010.<br />
• There was wide variation in senior median<br />
household in<strong>com</strong>e across rural counties, ranging<br />
from $22,000 in Mineral County to $65,000 in<br />
Storey County.<br />
• Senior veteran households were found to be<br />
better <strong>of</strong>f financially.<br />
Assets<br />
• U.S. data from the recently released Federal<br />
Reserve Survey <strong>of</strong> Consumer Finances indicated<br />
that families with a head <strong>of</strong> household age 65-74<br />
lost about 6% <strong>of</strong> their median net worth from<br />
2004 to 2010.<br />
Social Security Benefits<br />
• Fewer <strong>Nevada</strong> adults 65 or older (88.6%) than<br />
U.S. adults <strong>of</strong> the same age group (92.5%)<br />
received Social Security benefits.<br />
• In the United States, the average monthly Social<br />
Security benefit payment for those 65 and older<br />
was $1,150. <strong>Nevada</strong> residents had a slightly<br />
higher average monthly payment, $1,169.<br />
Poverty<br />
• The 2010 area poverty rates for <strong>Nevada</strong> senior<br />
households decreased from 2006, except in<br />
Washoe County. Rates were unavailable for<br />
rural/frontier counties.<br />
• Despite the recession, <strong>Nevada</strong> seniors managed<br />
to maintain a lower poverty rate than U.S.<br />
seniors.<br />
<strong>Nevada</strong>’s seniors have been able to maintain in<strong>com</strong>e<br />
and assets surprisingly well through a very difficult<br />
economic time. This does not mean that all seniors<br />
can <strong>com</strong>fortably provide for their shelter, food and<br />
health care. Seniors who lost substantial assets<br />
during the recession are much less likely to be able to<br />
recover than are their younger counterparts.<br />
Household In<strong>com</strong>e, by In<strong>com</strong>e Quintile<br />
• Average in<strong>com</strong>e for senior households in the<br />
bottom 20% <strong>of</strong> in<strong>com</strong>es was only $9,900, 88% <strong>of</strong><br />
which came from Social Security payments.<br />
• Sixty percent <strong>of</strong> <strong>Nevada</strong> older adult households<br />
had an average in<strong>com</strong>e <strong>of</strong> $32,000 or less.<br />
• Social Security accounts for 55% or more <strong>of</strong><br />
in<strong>com</strong>e for seniors with the lowest household<br />
in<strong>com</strong>es.<br />
40
Labor Force Participation<br />
A person is considered part <strong>of</strong> the labor force if<br />
he or she is either working (employed) or actively<br />
looking for work (unemployed). The <strong>Nevada</strong> civilian<br />
labor force in 2010 totaled approximately 1.4 million<br />
workers. Of this number, 81.2% were from the<br />
younger age cohorts (16 to 54 years <strong>of</strong> age), 14.5%<br />
were between 55 and 64 (“future impact”), 3.7%<br />
were 65 to 74 (“young old”), and 0.7% were 75 and<br />
older (“old” and “oldest old”; see Figure E1). Of<br />
<strong>Nevada</strong>ns in the workforce who were 65 and older,<br />
57% were males and 43% were females.<br />
In 2010, people 65 and older made up a slightly<br />
higher percentage <strong>of</strong> the <strong>Nevada</strong> workforce (4.4%)<br />
than seniors nationwide (4.1%). In other words,<br />
<strong>of</strong> the 1.4 million workers in <strong>Nevada</strong> about 61,000<br />
were seniors. The <strong>Nevada</strong> rate also was higher than<br />
in neighboring western states <strong>of</strong> California (3.8%),<br />
Arizona (4.0%), Utah (3.1%) and Oregon (4.1%).<br />
Fig. E1: Percentage <strong>of</strong> <strong>Nevada</strong> Labor<br />
Force by Age Group<br />
14.5%<br />
3.7%<br />
0.7%<br />
Age 16 to 54<br />
Age 55 to 64<br />
Age 65 to 74<br />
Age 75 and older<br />
Labor force participation rates for older adults<br />
are projected to continue to increase over the<br />
<strong>com</strong>ing decades (Bureau <strong>of</strong> Labor Statistics,<br />
“Employment Projections. Table 3.3. Civilian labor<br />
force participation rates by age, sex, race, and<br />
ethnicity”). Reasons for this may include “pulls”<br />
such as increased life span, improved health, and<br />
increased economic opportunities with higher<br />
salaries. Likely “pushes” include lack <strong>of</strong> retirement<br />
savings, concern about pensions, Social Security<br />
and Medicare sustainability, and, more recently, the<br />
Great Recession’s effects on housing and other asset<br />
holdings.<br />
In 2010, <strong>Nevada</strong>’s work-force-participation rates for<br />
residents were <strong>com</strong>parable to the national average,<br />
except for those 75 and older.<br />
When <strong>com</strong>pared with seniors nationally, <strong>Nevada</strong> has<br />
a larger percentage <strong>of</strong> seniors in the workforce. By<br />
age cohort, these include<br />
• 55-64 years; 64% (<strong>Nevada</strong>), 64.3% (U.S.)<br />
• 65-74 years; 26% (<strong>Nevada</strong>), 24.8% (U.S.)<br />
• 75 and older; 7.3% (<strong>Nevada</strong>), 5.7% (U.S.)<br />
Economics<br />
81.2%<br />
(American Community Survey, 1-Year Estimate-B23001, 2010)<br />
The labor force participation rate gives the<br />
percentage <strong>of</strong> people in a given age group that are<br />
either working or are looking for work. The labor<br />
force participation rate for adults 65 and older in the<br />
United States fell steadily from 1948 to the late 1980s.<br />
Since then, participation has increased from 11.8%<br />
in 1990 to 17.4% in 2010. In other words, in 1990<br />
about 12 seniors out <strong>of</strong> a hundred were employed<br />
or looking for work. In 2010, about 17 seniors out<br />
<strong>of</strong> a hundred were employed or looking for work.<br />
The percentage <strong>of</strong> adults 55-64 in the labor force<br />
increased from 55.9% to 64.9% over the same period.<br />
Between 2006, near the height <strong>of</strong> the housing bubble,<br />
and 2010, post-recession, labor participation rates for<br />
<strong>Nevada</strong> residents 55-64 and 65-74 increased from<br />
62.4% to 64% and from 25.2% to 26%, respectively<br />
(see Figure E2). Increased participation rates may<br />
be in part a response to recessionary pressures<br />
on retirement assets and safety net and in part a<br />
continuation <strong>of</strong> the long-term U.S. trend. Labor<br />
participation rates for those 75 and older stayed<br />
about the same at 7.5% <strong>of</strong> total residents in the age<br />
group in 2006, <strong>com</strong>pared with 7.3% in 2010.<br />
41
Economics<br />
Fig. E2: <strong>Nevada</strong> Labor Force Participation Rates by Age<br />
Cohort, 2006 vs. 2010<br />
62.4%<br />
64.0%<br />
25.2%<br />
26.0%<br />
7.5%<br />
7.3%<br />
<strong>Nevada</strong> 2006<br />
<strong>Nevada</strong> 2010<br />
64.2%<br />
Fig. E3: Labor Force Participation <strong>of</strong> Older Age Groups, by<br />
Region<br />
65.9% 64.8%<br />
59.0%<br />
26.3%<br />
29.6%<br />
26.6%<br />
20.7%<br />
<strong>Nevada</strong><br />
Northern Urban<br />
Southern Urban<br />
Rural Frontier<br />
Age 55 to 64 Age 65 to 74 Age 75 and older<br />
(American Community Survey, 1-Year Estimates-B23001,<br />
2006 and 2010)<br />
7.5% 6.8% 8.1%<br />
Age 55 to 64 Age 65 to 74 Age 75 and older<br />
5.7%<br />
Labor participation rates vary by region (see Figure<br />
E3). The Northern Urban region had the highest<br />
percentage <strong>of</strong> residents 55-64 remaining in the<br />
workforce <strong>of</strong> any region (65.9%); its percentage<br />
<strong>of</strong> residents between 65 and 74 remaining in<br />
the workforce was also the highest (29.6%). The<br />
Southern Urban region had the highest share <strong>of</strong><br />
residents 75 and older remaining in the workforce<br />
(8.1%).<br />
(American Community Survey, 5-Year Estimates- B23001, 2006-2010)<br />
Nationally in 2010, 92.2% <strong>of</strong> all <strong>of</strong> adults 65 and older<br />
who considered themselves in the labor force were<br />
employed. This is higher than the <strong>Nevada</strong> average <strong>of</strong><br />
84.3%, the Clark County average <strong>of</strong> 83.9%, and the<br />
Washoe County average <strong>of</strong> 83.3%. In other words,<br />
unemployment rates were higher for <strong>Nevada</strong> seniors<br />
than seniors nationally or the rest <strong>of</strong> the population.<br />
42<br />
Median Household In<strong>com</strong>e<br />
In<strong>com</strong>e in the American Community Survey data<br />
is reported from the perspectives <strong>of</strong> either personal<br />
(individual) in<strong>com</strong>e, family in<strong>com</strong>e or household<br />
in<strong>com</strong>e. Depending on the purpose <strong>of</strong> the data, all<br />
perspectives may be <strong>of</strong> interest. However, household<br />
in<strong>com</strong>e tends to more accurately reflect the resources<br />
individuals have access to within a household. For<br />
example, an older adult may be part <strong>of</strong> a married<br />
couple and have no individual in<strong>com</strong>e, yet have<br />
partial or full access to the in<strong>com</strong>e <strong>of</strong> the spouse.<br />
There are policy issues for which personal in<strong>com</strong>e is<br />
the appropriate measure, yet in the interest <strong>of</strong> space<br />
not all perspectives can be presented here.<br />
Median household in<strong>com</strong>e represents the in<strong>com</strong>e<br />
that “divides the in<strong>com</strong>e distribution into two equal<br />
groups, one having in<strong>com</strong>es above the median, and<br />
the other having in<strong>com</strong>es below the median” (U.S.<br />
Census Bureau, American FactFinder Glossary, n.d.).<br />
The median in<strong>com</strong>e is the midpoint <strong>of</strong> all available<br />
in<strong>com</strong>e values for the households within a certain<br />
location. Household in<strong>com</strong>e includes in<strong>com</strong>e from<br />
all sources from all <strong>of</strong> a household’s members 15 or<br />
older, whether related or not.<br />
State <strong>of</strong> <strong>Nevada</strong> median in<strong>com</strong>e for households<br />
with a householder 65 or older was $38,951 in 2010<br />
(see Figure E4). This represented an increase <strong>of</strong><br />
12.6% over the 2006 median in<strong>com</strong>e <strong>of</strong> $34,601.<br />
Households with a householder 65 or older were the<br />
only households whose median in<strong>com</strong>e increased<br />
during this period. Median in<strong>com</strong>e for all other age<br />
groups decreased during this period: by 18.7% for<br />
households with a householder less than 25 years;<br />
by 6.3% for 25-44 years; and by 4.4% for 45-64<br />
years. A <strong>com</strong>parison <strong>of</strong> <strong>com</strong>ponents <strong>of</strong> in<strong>com</strong>e using<br />
2007 and 2010 PUMS data indicated that earnings<br />
from employment helped insulate senior in<strong>com</strong>es.<br />
Median earnings from employment for the senior<br />
population increased over this period while dropping<br />
considerably for the rest <strong>of</strong> households.<br />
Despite the increase, median in<strong>com</strong>e for households<br />
with a householder 65 or older was higher only<br />
than the median in<strong>com</strong>e for households with a<br />
householder under age 25. It was still considerably<br />
lower than the median in<strong>com</strong>e for the other age<br />
groups.
$70,000<br />
$65,000<br />
$60,000<br />
$55,000<br />
$50,000<br />
$45,000<br />
$40,000<br />
$35,000<br />
$30,000<br />
$25,000<br />
Fig. E4: Median Household In<strong>com</strong>e by<br />
Age <strong>of</strong> Householder, <strong>Nevada</strong>, 2006-2010<br />
2006 2007 2008 2009 2010<br />
Householder under 25 years Householder 25 to 44 years<br />
Householder 45 to 64 years Householder 65 years and over<br />
(American Community Survey, 1-Year Averages-B19049,<br />
2006, 2007, 2008, 2009, 2010)<br />
The 2010 median in<strong>com</strong>e for <strong>Nevada</strong> seniors<br />
($38,951) was higher than the median in<strong>com</strong>e<br />
for U.S. seniors, $34,381 (see Figure E5). Median<br />
household in<strong>com</strong>es in <strong>Nevada</strong> have been higher<br />
than the U.S. average in the past, and older adults<br />
were able to maintain higher in<strong>com</strong>es despite the<br />
recession. Clark County had the highest median<br />
household in<strong>com</strong>e for this age group at $39,172 with<br />
Washoe County at $38,992.<br />
<strong>Nevada</strong> seniors had a higher median in<strong>com</strong>e<br />
<strong>com</strong>pared with Arizona ($37,134) and Oregon<br />
($34,901). Median household in<strong>com</strong>e for <strong>Nevada</strong><br />
seniors was lower <strong>com</strong>pared with California<br />
($40,255) and Utah [$40,784 (ACS, 1-year average,<br />
“Median Household In<strong>com</strong>e in the Past 12 Months<br />
(In 2010 Inflation-Adjusted Dollars) by Age <strong>of</strong><br />
Householder”)].<br />
On average, between 2006 and 2010, Storey County<br />
had the highest median in<strong>com</strong>e for households with<br />
a householder 65 or older at $65,446. Next came<br />
Douglas County, $45,915; Pershing County, $44,643;<br />
Carson City, $42,716; and Washoe County, $42,404.<br />
Mineral County had the lowest median household<br />
in<strong>com</strong>e, $22,058, followed by White Pine County,<br />
$24,507; Lincoln County, $25,538; Esmeralda<br />
County, $28,646; and Lander County, $31,250 (ACS,<br />
5-year average 2006-2010).<br />
Fig. E5: Median Household In<strong>com</strong>e by<br />
Age <strong>of</strong> Householder<br />
Householder 65<br />
years and over<br />
Householder 45 to<br />
64 years<br />
Householder 25 to<br />
44 years<br />
Householder under<br />
25 years<br />
Washoe County, <strong>Nevada</strong><br />
<strong>Nevada</strong><br />
$29,408<br />
$29,598<br />
$29,942<br />
$24,143<br />
$38,992<br />
$39,172<br />
$38,951<br />
$34,381<br />
Clark County, <strong>Nevada</strong><br />
United States<br />
$61,563<br />
$58,480<br />
$58,557<br />
$60,683<br />
$46,969<br />
$54,310<br />
$54,189<br />
$54,024<br />
(American Community Survey, 1-Year Average-B19049, 2010)<br />
Economics<br />
43
Economics<br />
Household In<strong>com</strong>e by In<strong>com</strong>e Quintile<br />
In<strong>com</strong>e quintiles in the figure below give average<br />
in<strong>com</strong>e and sources <strong>of</strong> gross in<strong>com</strong>e across sections<br />
<strong>of</strong> the population. In<strong>com</strong>es are averages for the 2006<br />
to 2010 period. Each quintile represents 20%, or<br />
one-fifth, <strong>of</strong> households with a householder 65 or<br />
older. Sources <strong>of</strong> household in<strong>com</strong>e vary widely over<br />
the in<strong>com</strong>e distribution <strong>of</strong> the senior population.<br />
Older adults within the lower-in<strong>com</strong>e quintiles are<br />
much more likely to depend on Social Security as<br />
their main source <strong>of</strong> in<strong>com</strong>e (see Figure E6). Social<br />
Security made up the largest proportion <strong>of</strong> any<br />
source <strong>of</strong> in<strong>com</strong>e for older adults in all four <strong>of</strong> the<br />
lower-in<strong>com</strong>e quintiles. The proportions ranged<br />
from 88% <strong>of</strong> in<strong>com</strong>e for the lowest quintile to 36% <strong>of</strong><br />
in<strong>com</strong>e for the fourth-highest quintile.<br />
$140,000<br />
$120,000<br />
$100,000<br />
$80,000<br />
$60,000<br />
$40,000<br />
$20,000<br />
$-<br />
Fig. E6: Sources <strong>of</strong> In<strong>com</strong>e for <strong>Nevada</strong> Households with<br />
Householders Age 65 and Older by In<strong>com</strong>e Quintile<br />
$9,900<br />
$19,620<br />
$31,725<br />
$50,251<br />
$123,224<br />
Lowest 5th Second 5th Third 5th Fourth 5th Highest 5th<br />
Other<br />
Earnings<br />
Social Security<br />
Pensions<br />
Assets<br />
(American Community Survey, 5-Year PUMS: <strong>Nevada</strong>, 2006-2010)<br />
The majority (80%) <strong>of</strong> <strong>Nevada</strong>’s households with<br />
a householder 65 or older reported in<strong>com</strong>e <strong>of</strong> less<br />
than $51,000. Sixty percent reported in<strong>com</strong>e less<br />
than $32,000. Many <strong>of</strong> the older adult households<br />
with higher in<strong>com</strong>es may have a householder who<br />
is still employed. The largest spread in in<strong>com</strong>e by<br />
source was between work earnings. The average<br />
amount <strong>of</strong> earnings in<strong>com</strong>e for those in the highest<br />
fifth <strong>of</strong> households ($30,072) was 261 times greater<br />
than the earnings in<strong>com</strong>e for the lowest fifth ($115).<br />
The wealthiest fifth reported estimated average<br />
household in<strong>com</strong>e 12 times greater than the<br />
lowest fifth <strong>of</strong> <strong>Nevada</strong>ns ($123,000 vs. $9,900). The<br />
wealthiest quintile received the largest proportion<br />
<strong>of</strong> their in<strong>com</strong>e from assets (32% <strong>of</strong> total in<strong>com</strong>e)<br />
followed by work earnings (24% <strong>of</strong> total in<strong>com</strong>e).<br />
The older the householder, the more likely the<br />
household was to be in the lower quintiles. Average<br />
age for older adults in the bottom quintile was 75.7<br />
years. Average age for older adults in the top quintile<br />
was 71.7 years (<strong>University</strong> Center for Economic<br />
Development analysis <strong>of</strong> <strong>Nevada</strong> 2006-2010 PUMS<br />
data from ACS).<br />
44
Assets<br />
In<strong>com</strong>e does not fully account for differences in<br />
assets or liabilities. Assets and liabilities, such<br />
as owning a home or owing debt to credit card<br />
<strong>com</strong>panies or health care providers, may greatly<br />
affect quality <strong>of</strong> life. Net worth is defined as value <strong>of</strong><br />
gross assets minus liabilities. The Great Recession<br />
decreased net worth across all age groups including<br />
older adults, although older adults suffered the<br />
smallest decreases on average. Decreases in net<br />
worth are especially difficult for older adults because,<br />
for many, re-entering the workforce to <strong>com</strong>pensate<br />
for such losses may no longer be possible, and there<br />
is relatively less time to <strong>com</strong>pensate for lost savings<br />
even if re-entry is possible.<br />
From 2004 to 2010, median net worth for families<br />
headed by a person 45-54 years <strong>of</strong> age dropped from<br />
$167,000 to $118,000 (adjusted for inflation to 2010<br />
dollars), a decrease <strong>of</strong> 29% (see Figure E7). Families<br />
with a head <strong>of</strong> household in the pre-retirement age<br />
group, 55-64, lost 38% <strong>of</strong> their net worth over the<br />
same period, dropping from a median <strong>of</strong> $290,000<br />
to $179,000. Whether because <strong>of</strong> more conservative<br />
investments, greater ability to shield assets by staying<br />
in the workforce, less exposure to the housing<br />
bubble, or some other reason, families with a head <strong>of</strong><br />
household from 65-74 experienced less <strong>of</strong> a decrease.<br />
In these households, median asset levels fell from<br />
$219,000 to $207,000 or 6%. Families with a head<br />
<strong>of</strong> household 75 or older saw median net worth<br />
increase from $188,000 to $217,000.<br />
Economics<br />
350<br />
Fig. E7: Median Net Worth <strong>of</strong> Families with<br />
Holdings by Age<br />
Thousands <strong>of</strong> 2010 Dollars<br />
300<br />
250<br />
200<br />
150<br />
100<br />
50<br />
Less than 35<br />
35-44<br />
45-54<br />
55-64<br />
65-74<br />
75 and Older<br />
0<br />
1989 1992 1995 1998 2001 2004 2007 2010<br />
(Bricker, Kennickell, Moore, & Sabelhaus, 2012, Table 4)<br />
Social Security Benefits<br />
U.S. Social Security is a social insurance program<br />
funded through payroll taxes (Federal Insurance<br />
Contributions Act or FICA). Social Security provides<br />
benefits for retirement, disability, survivorship and<br />
death. It is the largest government program in<br />
the world with outlays <strong>of</strong> about 5% <strong>of</strong> U.S. gross<br />
domestic product (Budget <strong>of</strong> the U.S. Government,<br />
FY 2013 Summary Tables). The Social Security<br />
system is widely credited with substantially reducing<br />
poverty rates for older adults. The U.S. poverty rate<br />
for older adults in 1959 was 35.2%. The rate in 2010<br />
was 11.2%. The drop coincided with the expansion <strong>of</strong><br />
the Social Security system (Wentworth and Pattison,<br />
2002, ACS 2010 1-year estimates).<br />
In <strong>Nevada</strong>, 424,836 people received Social Security<br />
benefits (including disability benefits) in December<br />
2010. Of this total, 287,524 were 65 or older.<br />
December 2010 benefits paid to <strong>Nevada</strong>ns totaled<br />
$489.4 million with $336.2 million paid to seniors<br />
(U.S. Social Security Administration, OASDI<br />
Beneficiaries by State and County, 2011).<br />
45
Economics<br />
In the United States in 2010, 92.6% <strong>of</strong> the population<br />
65 and older received Social Security benefits (see<br />
Figure E8). In <strong>Nevada</strong> in 2010, 88.6% <strong>of</strong> the older<br />
adult population received benefits. This proportion<br />
is higher for the Northern Urban/Metropolitan<br />
and Rural/Frontier regions—93.8% and 94.5%,<br />
respectively—and lower for the Southern Urban/<br />
Metropolitan region, 86.1%. The ratio <strong>of</strong> beneficiaries<br />
to total residents 65 years is lower in the Southern<br />
Urban/Metropolitan region than for the state or nation<br />
as a whole.<br />
Fig. E8: Percentage <strong>of</strong> Social Security Recipients, Age 65<br />
and Older by Region<br />
92.6%<br />
88.6%<br />
93.8%<br />
86.1%<br />
(U.S. Social Security Administration, OASDI Beneficiaries<br />
by State and County, 2010)<br />
94.5%<br />
United States <strong>Nevada</strong> Northern Urban Southern Urban Rural Frontier<br />
In the United States, monthly Social Security benefit<br />
payments for adults age 65 averaged $1,150 (see<br />
Figure E9). <strong>Nevada</strong> residents averaged slightly more,<br />
$1,169. Southern Urban/Metropolitan region residents<br />
had the highest average benefit, $1,177, followed by<br />
those in the Northern Urban/Metropolitan region,<br />
$1,168, and Rural/Frontier region, $1,135.<br />
$1,150<br />
Fig. E9: Average Social Security Payment for Recipients<br />
Age 65 and Older by Region, 2011<br />
$1,169 $1,168<br />
$1,177<br />
(U.S. Social Security Administration, OASDI Beneficiaries by<br />
State and County, 2010)<br />
$1,135<br />
United States <strong>Nevada</strong> Northern Urban Southern Urban Rural Frontier<br />
Of the neighboring states, Idaho had the highest<br />
proportion <strong>of</strong> Social Security benefits recipients 65<br />
and older (95.1%), followed by Oregon (94.4%),<br />
Utah (90.7%), <strong>Nevada</strong> (88.6%) Arizona (85%) and<br />
California (83.9%). Possible reasons for the differences<br />
include the number <strong>of</strong> military personnel and state<br />
employees who are not eligible, older adults who have<br />
chosen to delay starting benefits, and undocumented<br />
immigrants who pay into the Social Security system<br />
but are not able to collect benefits.<br />
Idaho had the lowest average Social Security<br />
payment for recipients 65 and older ($1,184) followed<br />
by California ($1,193), <strong>Nevada</strong> ($1,221), Oregon<br />
($1,223) and Utah ($1,224). Arizona had the highest<br />
[$1,238 (U.S. Social Security Administration, OASDI<br />
Beneficiaries by State and County, 2010)].<br />
Poverty<br />
46<br />
The poverty threshold is determined each year by<br />
the U.S. Census Bureau. This is the level <strong>of</strong> in<strong>com</strong>e<br />
below which families or individuals are considered to<br />
be lacking the resources to provide the food, shelter<br />
and clothing necessary to preserve health. Poverty<br />
thresholds vary by age, family size, and the number<br />
<strong>of</strong> related children under age 18.<br />
A two-person family with a householder 65 or older<br />
would need an in<strong>com</strong>e <strong>of</strong> $13,194 or greater to be<br />
above the poverty threshold in 2010. A single older<br />
adult would need $10,458 (U.S. Census Bureau,<br />
Poverty Thresholds, 2011).<br />
The share <strong>of</strong> households with a householder 65<br />
or older living below the poverty line decreased<br />
nationally from 11.7% in 2006 to 10.5% in 2010. In<br />
<strong>Nevada</strong>, the share dropped from 9.2% to 9.0%. Of<br />
the two most populous counties in the state, Clark<br />
County fell from 9.9% in 2006 to 9.4% in 2010. A<br />
higher percentage <strong>of</strong> senior households in Clark<br />
County were below the poverty level than in Washoe<br />
County or the state as a whole. Washoe County had<br />
the lowest percentage <strong>of</strong> senior households living<br />
below the poverty line, but the percentage increased<br />
from 7.0% in 2006 to 8.2% in 2010.
Using average five-year data between 2006 and<br />
2010, Southern Urban/Metropolitan was the region<br />
with the highest share (9.2%) <strong>of</strong> households with<br />
a householder 65 or older living under the poverty<br />
level (see Figure E10). This was higher than the state<br />
share, 8.8%. The Northern Urban/Metropolitan<br />
region had the lowest share, 7.2%, followed by the<br />
Rural/Frontier region at 9%.<br />
Fig. E10: Percentage <strong>of</strong> Households with Householder<br />
Age 65 or Older Living in Poverty, by Region<br />
Poverty rates increased with the age <strong>of</strong> householders.<br />
In <strong>Nevada</strong>, 8.1% <strong>of</strong> households with a householder<br />
65-74 lived below the poverty level (see Figure E11).<br />
The corresponding rates were 9.7% for households<br />
with a householder 75-84 and 11.9% for those with a<br />
householder 85 or older.<br />
Fig. E11: Percentage <strong>of</strong> <strong>Nevada</strong> Households Living in<br />
Poverty by Age Group <strong>of</strong> Householder<br />
8.9%<br />
8.1%<br />
9.7%<br />
11.9%<br />
Economics<br />
8.8%<br />
9.2% 9.0%<br />
7.2%<br />
All 65 and Older 65 to 74 Years Old 75 to 84 Years Old 85 and Older<br />
(American Community Survey, 5-Year PUMS: <strong>Nevada</strong>, 2006-2010)<br />
<strong>Nevada</strong> Northern Urban Southern Urban Rural Frontier<br />
(American Community Survey, 5-Year Estimates-B17017, 2006-2010)<br />
Consumer Expenditure Shares<br />
Older adults contribute significantly to the economy<br />
by patronizing businesses and organizations. Net<br />
assets are highest for households with adults 65 and<br />
older and households with a householder in the<br />
55-64 age cohort. Older adults also typically own<br />
more financial assets. These provide a diversified<br />
source <strong>of</strong> in<strong>com</strong>e outside <strong>of</strong> wage earning, which<br />
can help stabilize finances when in<strong>com</strong>e from wages<br />
decreases.<br />
Considerable differences exist in expenditure<br />
patterns among age groups. With the exception<br />
<strong>of</strong> health care, older adults have lower average<br />
expenditure levels. Older adults spent more on<br />
health care. In households with heads ages 55-64,<br />
8% <strong>of</strong> expenditures were for health care, for those<br />
ages 65-74 health care expenditures were11%), and<br />
for those ages 75 and older,14%; see Figure E12). The<br />
share <strong>of</strong> total household budgets allocated to food<br />
is consistent across age groups, ranging from 12.2%<br />
for those with household heads 55-64 to 13.5% for<br />
those 75 and older. The share <strong>of</strong> household budgets<br />
spent on housing increases by age: 32% is spent by<br />
households headed by a person 55-64; 34% (same as<br />
national average) is spent by those 65-74; and 37% is<br />
spent by those 75 and older. Transportation costs, as<br />
a percentage <strong>of</strong> total household expenditures, show<br />
a decline with age, starting at 16.8% for household<br />
heads 55-64 (same as national average) and<br />
decreasing to 15.6% for those 65-74 and to 13.2% for<br />
those 75 and older.<br />
47
Economics<br />
60,000<br />
50,000<br />
40,000<br />
30,000<br />
20,000<br />
10,000<br />
-<br />
Fig. E12: U.S. Average Annual Household<br />
Expenditures by Age <strong>of</strong> Householder<br />
All consumer units 55 to 64 65 to 74 75 and older<br />
Other<br />
Housing<br />
Health Care<br />
Transportation<br />
(Bureau <strong>of</strong> Labor Statistics, Consumer Expenditure Survey, 2011)<br />
Food<br />
45,000<br />
40,000<br />
35,000<br />
30,000<br />
25,000<br />
20,000<br />
15,000<br />
10,000<br />
5,000<br />
-<br />
Fig. E13: Average Annual Household Expenditures<br />
for Households with Householder Age 65 and Older<br />
by Region<br />
Other<br />
Total 65 and over Northeast Midwest South West<br />
Housing<br />
Health Care<br />
Transportation<br />
(Bureau <strong>of</strong> Labor Statistics, Consumer Expenditure Survey, 2011)<br />
Food<br />
Nationally, the average annual expenditure for<br />
households headed by an individual 65 or older was<br />
$38,027 in 2011. Western-states households headed<br />
by individuals 65 or older spent, on average, $42,626,<br />
which is more than households in the Northeast<br />
($41,756), the Midwest ($35,666), or the South<br />
[$34,710; see Figure E13].<br />
Veterans<br />
Older adult veterans in <strong>Nevada</strong> appear to be better<br />
<strong>of</strong>f financially than other <strong>Nevada</strong>ns 65 or older (see<br />
Figure E14). In<strong>com</strong>e levels appear to be higher, and<br />
fewer veterans live below the poverty level (see<br />
Figure E15).<br />
Below is summary <strong>of</strong> points concerning older<br />
veterans 1 :<br />
• The second lowest 20% <strong>of</strong> households with an<br />
older veteran householder make $16,266 or less<br />
while the lowest 20% make $10,857 or less.<br />
• The highest 20% <strong>of</strong> households with an older<br />
veteran householder make over $135,477.<br />
The highest 20% <strong>of</strong> all households with a<br />
householder 65 and older make $110,250.<br />
• Approximately 9% <strong>of</strong> older adult households are<br />
below the poverty threshold. Less than 5% <strong>of</strong><br />
households with older veterans are below that<br />
threshold.<br />
• At lower in<strong>com</strong>e levels, veterans tend to rely<br />
more on pensions as a percentage <strong>of</strong> their total<br />
in<strong>com</strong>e than do older adults in general. The<br />
differences tend to disappear at higher in<strong>com</strong>e<br />
levels (see Figure E16).<br />
• Veterans tend to rely less on Social Security as<br />
a percentage <strong>of</strong> their total in<strong>com</strong>e at all levels <strong>of</strong><br />
in<strong>com</strong>e (see Figure E17).<br />
• A higher percentage <strong>of</strong> veterans’ in<strong>com</strong>e <strong>com</strong>es<br />
from earned in<strong>com</strong>e than does that <strong>of</strong> older<br />
adults in general (see Table E1).<br />
The reason older veterans appear to be better<br />
<strong>of</strong>f than the general population <strong>of</strong> older adults<br />
is probably an expanded social safety net. In<br />
addition, older veterans are predominately male,<br />
and households with older adult males had higher<br />
median in<strong>com</strong>es than households with only older<br />
females (see Figure E17).<br />
Information pertaining to expanded benefits for<br />
veterans can be accessed at the U. S. Department<br />
<strong>of</strong> Veterans Affairs website, http://www.va.gov/<br />
healthbenefits/online/.<br />
48<br />
1<br />
The source <strong>of</strong> all economic data in tables and charts below is <strong>University</strong> Center for Economic Development (UCED) analysis <strong>of</strong> <strong>Nevada</strong> PUMS five-year<br />
American Community Survey data. Data <strong>com</strong>parisons are made on a statewide basis because reliable lower-level geographic data is not available.<br />
Data are also not available to allow a breakdown <strong>of</strong> veterans into the young-old, old and oldest-old categories for multiple economic categories with<br />
adequate reliability.
$160,000<br />
$140,000<br />
$120,000<br />
$100,000<br />
$80,000<br />
$60,000<br />
$40,000<br />
Fig. E14: Average In<strong>com</strong>e by Quintile for Households with<br />
Veterans Age 65 or Older vs. Households with Age 65 or<br />
Older Householder<br />
Veterans<br />
General Population<br />
Older Adults<br />
Economics<br />
$20,000<br />
$0<br />
Bottom Fifth Second Fifth Third Fifth Fourth Fifth Top Fifth<br />
(American Community Survey, 5-Year PUMS: <strong>Nevada</strong> 2006-2010)<br />
Fig. E15: Poverty Rates for <strong>Nevada</strong> Households with<br />
Heads Age 65 and older by Veteran Status<br />
8.9%<br />
Veterans<br />
4.9%<br />
General Population Older<br />
Adults<br />
Veterans<br />
General Population Older Adults<br />
(American Community Survey, 5-Year PUMS: <strong>Nevada</strong> 2006-2010)<br />
Fig. E16: Pension In<strong>com</strong>e for <strong>Nevada</strong> Households with<br />
Heads Age 65 and Older by Quintile and Veteran Status<br />
22.41%<br />
29.32%<br />
23.41%<br />
27.22% 27.66%<br />
Veterans<br />
General Population<br />
Older Adults<br />
16.15%<br />
18.28%<br />
16.92%<br />
10.41%<br />
7.74%<br />
Bottom Fifth Second Fifth Third Fifth Fourth Fifth Top Fifth<br />
(American Community Survey, 5-Year PUMS: <strong>Nevada</strong> 2006-2010)<br />
160000<br />
140000<br />
120000<br />
100000<br />
Fig. E17: Older Veterans Average In<strong>com</strong>e Sources by<br />
Quintile for Households with Older Veterans<br />
Other<br />
Earnings<br />
Social Security<br />
Pensions<br />
80000<br />
60000<br />
40000<br />
20000<br />
0<br />
Bottom Fifth Second Fifth Third Fifth Fourth Fifth Top Fifth<br />
(American Community Survey, 5-Year PUMS: <strong>Nevada</strong> 2006-2010)<br />
49
Economics<br />
Table E1<br />
In<strong>com</strong>e Comparisons by Percentage <strong>of</strong> Total In<strong>com</strong>e (Older Veterans vs. All Older)<br />
Pension In<strong>com</strong>e<br />
Social Security In<strong>com</strong>e<br />
Veteran’s Older Adult Veteran’s Older Adult<br />
In<strong>com</strong>e In<strong>com</strong>e In<strong>com</strong>e In<strong>com</strong>e<br />
Bottom Fifth 10.41% 7.74% 76.10% 83.27%<br />
Second Fifth 22.41% 16.15% 52.16% 63.43%<br />
Third Fifth 29.32% 23.41% 34.69% 43.54%<br />
Fourth Fifth 27.22% 27.66% 23.06% 29.26%<br />
Top Fifth 16.92% 18.28% 10.80% 13.11%<br />
Earned In<strong>com</strong>e<br />
Other In<strong>com</strong>e<br />
Veteran’s Older Adult Veteran’s Older Adult<br />
In<strong>com</strong>e In<strong>com</strong>e In<strong>com</strong>e In<strong>com</strong>e<br />
Bottom Fifth 4.99% 4.19% 4.53% 2.49%<br />
Second Fifth 15.15% 11.13% 4.08% 3.91%<br />
Third Fifth 23.68% 20.68% 5.29% 4.32%<br />
Fourth Fifth 34.73% 28.87% 6.68% 4.77%<br />
Top Fifth 46.09% 39.82% 3.76% 4.18%<br />
(American Community Survey, 5-Year PUMS: <strong>Nevada</strong> 2006-2010)<br />
50
Health, morbidity, and access<br />
to health care influences<br />
individual life expectancy.<br />
The average life expectancy within a<br />
nation or state provides an indicator<br />
<strong>of</strong> the general health status <strong>of</strong> the<br />
population. Per the 2008-2009 CDC<br />
report, The State <strong>of</strong> Aging and Health<br />
in America, <strong>Nevada</strong> is better <strong>of</strong>f than<br />
nationally in the share <strong>of</strong> population<br />
that have suffered <strong>com</strong>plete tooth<br />
loss (17.7% versus 18.0%). However,<br />
<strong>Nevada</strong> is worse <strong>of</strong>f than nationally in<br />
terms <strong>of</strong>:<br />
• The share <strong>of</strong> its population that is<br />
disabled (37.1% versus 35.3%)<br />
• The frequency <strong>of</strong> mental distress,<br />
defined as 14 or more poor mental<br />
health days in 30 (8.2% versus<br />
6.7%)<br />
• The mean number <strong>of</strong> physically<br />
unhealthy days people experience<br />
(5.6% versus 5.3%).<br />
Finally, <strong>Nevada</strong> ranks 22nd in<br />
the nation in oral health based on<br />
<strong>com</strong>plete tooth loss, 34th in terms <strong>of</strong><br />
disability, 36th for mean number <strong>of</strong><br />
physically unhealthy days, and 47th in<br />
frequency <strong>of</strong> mental distress.<br />
In this chapter, we examine health<br />
status in the nation and within <strong>Nevada</strong><br />
among adults 65 and older. Sections<br />
address life expectancy, mortality and<br />
causes <strong>of</strong> death, self-reported health<br />
status, disability, oral health, mental<br />
health, and suicide. Specific changes<br />
from the Elders Count <strong>Nevada</strong> (2009)<br />
report include a brief section on visual<br />
and hearing health in older adults and<br />
a special section devoted to <strong>Nevada</strong>’s<br />
older veterans.<br />
Health Status<br />
Life Expectancy<br />
Mortality (Cause <strong>of</strong> Death)<br />
Self-Reported Health Status<br />
Disability<br />
Visual & Hearing Health<br />
Oral Health<br />
Mental Health<br />
Suicide<br />
Veterans<br />
Authors: Angela D. Broadus, Julie Kilgore<br />
Content Reviewers: Julia Peek, Brad Towle, Kyra Morgan, Luana Ritch, Wei Yang, Caleb Cage
Health Status<br />
Highlights 1<br />
Life Expectancy<br />
• <strong>Nevada</strong> residents’ life expectancy <strong>of</strong> 77.6 years is<br />
slightly shorter than for the U.S. as a whole and<br />
ranks 37th among the states.<br />
• In <strong>Nevada</strong>, the average life span for males is 75.2<br />
years and the average for females is 80.2 years.<br />
Mortality (Cause <strong>of</strong> Death)<br />
• Since 2009, heart disease has been the most<br />
<strong>com</strong>mon cause <strong>of</strong> death in <strong>Nevada</strong>. <strong>Nevada</strong><br />
ranks 13th for deaths related to cardiovascular<br />
disease.<br />
• In 2009, cancer was the second-most-<strong>com</strong>mon<br />
cause <strong>of</strong> death in <strong>Nevada</strong>. Of <strong>Nevada</strong>ns 65 and<br />
older, 6,614 were newly diagnosed with the<br />
disease in 2009; 58% were males and 42% were<br />
females.<br />
• Compared to the U.S. as a whole, <strong>Nevada</strong><br />
residents were more likely to smoke (21.3%<br />
versus 17.3%) in 2009, somewhat more likely to<br />
have recently <strong>eng</strong>aged in physical activity (77%<br />
versus 76%), and were less likely to be obese<br />
(60.2% versus 63.8%).<br />
• From 2000 to 2010, Alzheimer’s disease increased<br />
in <strong>Nevada</strong> by 38% among adults 65 and older.<br />
Self-Reported Health Status<br />
• Fewer older <strong>Nevada</strong>ns rated their health as<br />
“good” or “excellent” (69.9%) than did older<br />
adults nationally (72.1%).<br />
Disability<br />
• From 2009-2011, a higher percentage <strong>of</strong> older<br />
U.S. adults (36.8%) reported having a disability<br />
than older <strong>Nevada</strong>ns (33.9%).<br />
• Of <strong>Nevada</strong>ns 65 and older, the largest highest<br />
percentage claiming a disability (56.2% were<br />
males 75 and older living in the Rural/Frontier<br />
region).<br />
• Over a third (37.4%) <strong>of</strong> <strong>Nevada</strong>’s older adults<br />
reported their activities were limited because <strong>of</strong><br />
physical, mental or emotional disability.<br />
• A greater percentage <strong>of</strong> older adults in the<br />
Northern Urban/Metropolitan region (41.3%)<br />
reported limitations due to disability than did<br />
older adults in the other regions.<br />
Visual and Hearing Health<br />
• The prevalence <strong>of</strong> vision impairment in<br />
<strong>Nevada</strong>ns age 65 to 79 is <strong>com</strong>parable to that<br />
found nationally. For adults age 80 and older,<br />
the prevalence rate <strong>of</strong> vision impairment for<br />
<strong>Nevada</strong>ns (15.8%) is lower than found nationally<br />
(17.3%)<br />
• A slightly larger share <strong>of</strong> <strong>Nevada</strong> adults (5.5%)<br />
suffer from eye blood vessel damage due to<br />
diabetes (i.e., diabetic retinopathy) than do<br />
adults nationally (5.4%).<br />
Oral Health<br />
• The majority (62.1%) <strong>of</strong> older <strong>Nevada</strong>ns reported<br />
that they had visited a dentist, dental hygienist or<br />
dental clinic in the past year.<br />
• Over half <strong>of</strong> respondents with in<strong>com</strong>es less than<br />
$25,000 indicated that they did not access dental<br />
care in the year prior to the survey. The figures<br />
were 57.7% for in<strong>com</strong>es less than $15,000 and<br />
52.4% for in<strong>com</strong>es <strong>of</strong> $15,000-$24,000.<br />
• Older adults <strong>of</strong> higher socioeconomic status were<br />
less likely to report loss <strong>of</strong> all permanent teeth.<br />
Mental Health<br />
• A higher percentage <strong>of</strong> older adult females<br />
(29.5%) than males (17.1%) reported having had<br />
at least one bad mental health day in the past<br />
month.<br />
• Fewer than 1 in 10 (7.6%) <strong>of</strong> <strong>Nevada</strong> adults<br />
65 and older indicated that they had been<br />
prescribed medication or treatment for a mental<br />
health or emotional condition.<br />
• A higher percentage <strong>of</strong> older adults in the 65-<br />
74 age group (10.8%) reported being prescribed<br />
medication and/or treatment than did adults 75-<br />
84 (3.1%) or 85 and older (4.9%).<br />
• In 2009, suicide was the fifth-leading cause <strong>of</strong><br />
death among older <strong>Nevada</strong>ns age 55-64 and<br />
the 10th-leading cause <strong>of</strong> death in adults 65-74.<br />
Suicide was not among the 10 leading causes <strong>of</strong><br />
death for <strong>Nevada</strong> adults 75 and older.<br />
• In 2009, the primary method for suicide in<br />
<strong>Nevada</strong> and U.S. adults, age 65-85 was by<br />
firearms (71.6% and 63.1%, respectively). The<br />
second primary method for suicide differed with<br />
<strong>Nevada</strong> adults dying by suffocation (10.3%) and<br />
U.S. adults dying by poisoning (10%).<br />
52<br />
1<br />
Percentages for Behavioral Risk Factor Surveillance System (BRFSS) data are based on older adults who responded to the survey and may not be<br />
representative <strong>of</strong> the state as a whole.
Veterans<br />
• Over half (51%) <strong>of</strong> the 394 <strong>Nevada</strong> veterans who<br />
<strong>com</strong>pleted the BRFSS question about military<br />
service indicated that they had served in a<br />
<strong>com</strong>bat or war zone.<br />
• Approximately 9.3% <strong>of</strong> older <strong>Nevada</strong> veterans<br />
had been diagnosed with depression, anxiety or<br />
Post Traumatic Stress Disorder (PTSD).<br />
• In 2011, the rate <strong>of</strong> suicide per 100,000 among<br />
<strong>Nevada</strong> female veterans (26.7) was three times<br />
the rate <strong>of</strong> suicide among <strong>Nevada</strong> non-veteran<br />
females (8.4). The rate was more than five<br />
times higher than the national rate for females<br />
(4.9). Similarly, the suicide rate per 100,000<br />
for <strong>Nevada</strong>’s male veterans (48.3) was higher<br />
(61.5%) than the rate <strong>of</strong> suicide among <strong>Nevada</strong>’s<br />
non-veteran males (29.9%) and 151% higher<br />
than the national rate <strong>of</strong> male suicide (19.2).<br />
• Only 2% <strong>of</strong> older <strong>Nevada</strong> veterans received<br />
psychological or psychiatric counseling or<br />
treatment in the 12 months prior to the survey.<br />
Health Status<br />
53
Health Status<br />
Life Expectancy<br />
Life expectancy is the average years <strong>of</strong> life for an<br />
individual or class <strong>of</strong> persons if death rates remain<br />
constant. Of the 221 nations that <strong>com</strong>pleted<br />
the World Health Organization Survey on life<br />
expectancy, the United States ranked 50th (World<br />
Health Organization, 2011). U.S. life expectancy<br />
has increased by almost 50 years since the turn<br />
<strong>of</strong> the 20th century (Whitley, 2008). <strong>Nevada</strong>’s life<br />
expectancy <strong>of</strong> 77.6 years is slightly shorter than for<br />
the United States as a whole and ranks 37th among<br />
the states (worldlifeexpectancy.<strong>com</strong>, 2011).<br />
Influences on life expectancy include health<br />
status, health risks and behaviors, and health care<br />
utilization, and these may differ by sex, race and<br />
ethnicity, education, and in<strong>com</strong>e. Life expectancy at<br />
birth in the United States is 78.5 years with about<br />
a five-year difference by sex (women live longer).<br />
In 2010 males had a life expectancy <strong>of</strong> 76 years at<br />
birth and females, 80.9 years (Crescioni, Gorina,<br />
Bilheimer & Gillum, 2010, see Figure HS1). By age<br />
65, life expectancy for males decreases by 2.7 years<br />
less than that <strong>of</strong> females. By the time males are 85<br />
years <strong>of</strong> age, life expectancy differences decrease<br />
to 1.1 years (Crescioni et al., 2010, p. 2). Possible<br />
reasons include the fact that older males have a<br />
higher percentage <strong>of</strong> diagnosed and undiagnosed<br />
heart disease (39%) than females (27%; ibid, p. 4),<br />
and a higher percentage have cancer (24.5% versus<br />
~20.5%, Crescioni et al., 2010, p. 5).<br />
75.2<br />
Fig. HS1: Years <strong>of</strong> Life Expectancy, 2010<br />
80.2<br />
<strong>Nevada</strong><br />
77.6<br />
76.0<br />
80.9<br />
United States<br />
78.5<br />
(National Center for Health Statistics, 2012)<br />
Male<br />
Female<br />
In <strong>Nevada</strong>, the average lifespan for males is 75.2<br />
years and the average for females is 80.2 years.<br />
Douglas County had the highest life expectancy <strong>of</strong><br />
all <strong>Nevada</strong> counties (see Table HS1). However, life<br />
expectancy is consistent across all regions <strong>of</strong> the<br />
state with females expected to live approximately six<br />
years longer than males. Race, ethnicity and other<br />
characteristics such as education level also may<br />
affect life expectancy.<br />
Total<br />
54<br />
Mortality (Cause <strong>of</strong> Death)<br />
The national age-adjusted death rate per 100,000<br />
increased marginally from 741.1 in 2009 (Kochanek,<br />
Xu, Murphy, Minino, & Kung, 2011) to 746.2 in<br />
2010 (Minino & Murphy, 2012). However, between<br />
2000 and 2010 national age-specific death rates<br />
for U.S. adults ages 45-64 decreased from 647.6 to<br />
605.7 (Minino & Murphy, 2012). Death rates for<br />
adults 65 and older also showed a decrease, from<br />
5,143.6 to 4,461.1. Between 2010 and 2011, rates<br />
<strong>of</strong> death decreased 1.6% for adults 65-74, 0.8%<br />
for adults 75-84, and 1.2% for adults 85 and older<br />
(Hoyert & Jiaquan, 2012).<br />
Unlike the generally decreasing mortality trend in<br />
the United States, <strong>Nevada</strong>’s age-adjusted death rate<br />
per 100,000 increased from 784.8 in 2009 (Kochanek<br />
et al., 2011) to 795.4 in 2010 (Minino & Murphy,<br />
2012). In addition, <strong>Nevada</strong> and Wyoming had the<br />
highest age-adjusted death rates in the western<br />
United States in 2010 with rates <strong>com</strong>mensurate to<br />
some <strong>of</strong> the southern states in the United States<br />
(see Figure HS2).
Fig. HS2: Age-adjusted Death Rates per State and the District <strong>of</strong><br />
Columbia: United States Preliminary 2010<br />
AK<br />
771.3<br />
OR<br />
723.2<br />
723.0<br />
CA<br />
646.8<br />
WA<br />
692.3<br />
NV<br />
795.4<br />
ID<br />
731.6<br />
HI<br />
589.6<br />
AZ<br />
693.1<br />
723.0<br />
UT<br />
703.2<br />
MT<br />
754.7<br />
WY<br />
778.8<br />
NM<br />
749.0<br />
CO<br />
682.7<br />
723.0<br />
ND<br />
704.6<br />
SD<br />
715.1<br />
NE<br />
717.8<br />
KS<br />
762.2<br />
TX<br />
772.3<br />
(Minino & Murphy, 2012, p. 3)<br />
The 10 most <strong>com</strong>mon causes <strong>of</strong> death across the<br />
nation vary by age group, but all include such<br />
chronic diseases as heart disease, cancer, diabetes<br />
and stroke. The most <strong>com</strong>mon cause nationally<br />
for adults 45-64 was cancer, and heart disease was<br />
the leading cause in adults 65 and older (see Table<br />
HS2).<br />
In 2007, cancer was the most <strong>com</strong>mon cause <strong>of</strong><br />
death among <strong>Nevada</strong>ns 55-64 and the secondleading<br />
cause among <strong>Nevada</strong>ns 65 and older [Webbased<br />
Injury Statistics Query and Reporting System<br />
(WISQARS), 2012]. Cancer accounted for 23.2% <strong>of</strong><br />
deaths overall, 32.3% for adults 55-64, and 23.6% for<br />
adults 65 and older.<br />
By 2009, heart disease had be<strong>com</strong>e the most<br />
<strong>com</strong>mon cause <strong>of</strong> death in <strong>Nevada</strong> with cancer<br />
second. <strong>Nevada</strong> ranks 13th for deaths related to<br />
cardiovascular disease (see Table HS3; American<br />
Heart Association, 2009). Factors associated with<br />
heart disease include smoking tobacco, lack <strong>of</strong><br />
exercise, and obesity. Compared to the nation as<br />
a whole in 2009, <strong>Nevada</strong> residents 18 and older<br />
were more likely to smoke (21.3% versus 17.3%),<br />
somewhat more likely to <strong>eng</strong>age in physical activity<br />
(77% versus 76%), and were less likely to be<br />
obese (60.2% versus 63.8%). Alzheimer’s disease<br />
(AD), the most <strong>com</strong>mon type <strong>of</strong> dementia, is the<br />
14th most <strong>com</strong>mon cause <strong>of</strong> death in the United<br />
States (Kochanek, Xu, Murphy, Minino, & Kung,<br />
2011). <strong>Nevada</strong> experienced a 38% increase in AD<br />
among adults 65 and older between 2000 and 2010.<br />
This <strong>com</strong>pares with an estimated 12% increase<br />
nationwide (Smith, 2011; Hebert et al., as cited in<br />
Alzheimer’s Association, 2012).<br />
OK<br />
914.6<br />
589.9-692.6<br />
692.7-722.8<br />
722.9-766.8<br />
MN<br />
661.4<br />
IA<br />
721.7<br />
MO<br />
819.5<br />
AR<br />
892.6<br />
LA<br />
903.8<br />
WI<br />
719.0<br />
IL<br />
736.3<br />
MS<br />
961.9<br />
NY<br />
MI<br />
665.4<br />
764.2<br />
PA<br />
OH 766.0<br />
IN 815.7<br />
820.6<br />
WV VA<br />
KY 933.5<br />
741.5<br />
914.9<br />
NC<br />
TN<br />
804.7<br />
890.8 SC<br />
854.6<br />
AL GA<br />
939.4 846.1<br />
766.9-835.9<br />
840.0-961.9<br />
FL<br />
701.0<br />
VT<br />
718.7<br />
ME<br />
749.8<br />
NH, 690.4<br />
MA, 675.0<br />
RI, 722.0<br />
CT<br />
653.5<br />
NJ, 691.2<br />
DE, 769.9<br />
DC, 792.4<br />
Overall rate in<br />
the United States<br />
is 746.2 deaths<br />
per 100,000.<br />
An annual survey from 2005 to 2010 indicated that<br />
between 4.2% and 5% <strong>of</strong> <strong>Nevada</strong> residents had<br />
been told by a health care pr<strong>of</strong>essional that they had<br />
suffered a heart attack, angina or coronary artery<br />
disease (see Table HS4; Center for Disease Control,<br />
2012).<br />
Cancer is the second-leading cause <strong>of</strong> death in<br />
<strong>Nevada</strong> (Kochanek, Xu, Murphy, Minino, & Kung,<br />
2011). Information about the percentage <strong>of</strong> adults<br />
with cancer is relevant as it affects the overall<br />
quality <strong>of</strong> life in older adults coping with emotional,<br />
financial and functional limitations affecting their<br />
independence.<br />
In 2009, 6,614 older <strong>Nevada</strong> residents were newly<br />
diagnosed with cancer (see Table HS5). Rates <strong>of</strong><br />
these cases varied by region, age and gender (<strong>Nevada</strong><br />
State Health Division: Central Cancer Registry,<br />
2012). Regionally in 2009, a higher proportion <strong>of</strong><br />
newly diagnosed cases <strong>of</strong> cancer occurred in males<br />
than in females. In addition, among all newly<br />
diagnosed cases <strong>of</strong> cancer in 2009, 58% were older<br />
males and 42% older females.<br />
Also in 2009, 2,985 older <strong>Nevada</strong>ns died <strong>of</strong> cancer<br />
(see Table HS6). The distribution <strong>of</strong> cancer-related<br />
mortality follows the same regional/sex pattern as<br />
was found with newly diagnosed cancer cases. A<br />
higher proportion <strong>of</strong> the cancer-related deaths in<br />
2009 were male; 54.7% were older males and 45.3%<br />
were older females.<br />
Health Status<br />
55
Health Status<br />
Self-Reported Health Status<br />
Health is a biopsychosocial construct that includes<br />
the individual’s biological/physical state and<br />
emotional state, self-perception <strong>of</strong> health, and<br />
perception <strong>of</strong> self-efficacy or ability to control<br />
one’s life (Pulkkinen, Kokkonen, & Makiaho,<br />
1998). Individual perceptions are important as they<br />
have been found to predict out<strong>com</strong>es for “stroke<br />
(Emmelin et al., 2003), disability (Månsson &<br />
Råstam, 2001; Wilcox, Kasl, & Idler, 1996), healthcare<br />
utilization (Roos, Roos, Mossey, & Havens,<br />
1988 as cited in Sargent-Cox, Anstey, & Luszcz,<br />
2010, p. 143) and mortality (Benyamini & Idler,<br />
1999).<br />
As part <strong>of</strong> the <strong>University</strong> <strong>of</strong> <strong>Nevada</strong>, Las Vegas<br />
Cannon Survey Center’s Portrait <strong>of</strong> <strong>Nevada</strong>’s Seniors,<br />
2010, adults 50-99 were asked to rate their health<br />
(see Figure HS3). Just under half (49%) <strong>of</strong> the<br />
participants rated their health as very good (29%)<br />
to excellent (20%); 29% rated their health as good,<br />
14% as fair and 8% as poor (Gallion & LaHaie,<br />
2010, p. 19).<br />
Fig. HS3: Cannon Survey Center: Self-<br />
Reported Health<br />
Per the 2011 BRFSS report 2 , 14% <strong>of</strong> <strong>Nevada</strong> adults<br />
65 and older rated their own health as excellent,<br />
24% as very good, 31.9% as good, 21.8% as fair,<br />
and 8.4% as poor (see Table HS7). Fewer <strong>Nevada</strong>ns<br />
65 and older rated their health as good to excellent<br />
(69.9%) than older adults nationally (72.1%;<br />
CDC: BRFSS, 2011). Likewise, slightly more older<br />
<strong>Nevada</strong>ns rated their health as fair to poor (30.2%)<br />
than older adults nationally (26.5%; see Figure<br />
HS4).<br />
14.0%<br />
11.3%<br />
Fig. HS4: U.S. and <strong>Nevada</strong> Adults, Age 65<br />
and Older - Self-Reported Health Status<br />
26.9%<br />
24.0%<br />
33.9%<br />
31.9%<br />
(CDC: BRFSS, 2011)<br />
21.8%<br />
18.5%<br />
Across all <strong>Nevada</strong> regions, the majority <strong>of</strong><br />
participants rated their health as good to excellent<br />
with less than a third in any region rating their health<br />
as fair to poor (see Figure HS5).<br />
8.4%<br />
Excellent Very Good Good Fair Poor<br />
<strong>Nevada</strong> U.S. (Median %)<br />
8.0%<br />
Overall<br />
75 or<br />
Older<br />
65-74<br />
50-64<br />
0%<br />
20.0%<br />
17.0%<br />
20.0%<br />
20.0%<br />
20%<br />
29.0%<br />
25.0%<br />
28.0%<br />
30.0%<br />
40%<br />
29.0%<br />
32.0%<br />
30.0%<br />
27.0%<br />
60%<br />
14.0% 8.0%<br />
18.0% 8.0%<br />
18.0% 4.0%<br />
13.0% 10.0%<br />
80%<br />
100%<br />
69.1%<br />
Fig. HS5: <strong>Nevada</strong> Adults, Age 65 and Older:<br />
Self-Reported Health Status by Region<br />
73.9%<br />
68.2%<br />
31.0%<br />
Southern Urban/Metro<br />
Northern Urban/Metro<br />
Rural/Frontier<br />
26.2%<br />
31.9%<br />
Excellent Very Good Good Fair Poor<br />
(Gallion & LaHaie, 2010)<br />
More than three-fourths <strong>of</strong> the Canon Survey<br />
Center’s participants 50-74 rated their health as<br />
good to excellent. Of those 75 or older, 74% rated<br />
their health as good to excellent. Within this older<br />
group, nearly a third (32%) rated their health as<br />
good and 17% rated it as excellent. Those rating<br />
their health as poor included 10% <strong>of</strong> participants<br />
50-64, 4% <strong>of</strong> those 65-74, and 8% those 75 or older.<br />
Good to Excellent<br />
(CDC: BRFSS, 2011)<br />
Fair to Poor<br />
56<br />
2<br />
Note: Comparisons between the Cannon Survey Center and the BRFSS data cannot be made due to age differences in the surveyed population.
The proportion <strong>of</strong> adults 75-84 who rated their<br />
health as good to excellent (72.3%) was higher than<br />
for those ages 65-74 (70.9%) or 85 and older (53.8%;<br />
see Figure HS6). The proportion who rated their<br />
health as fair to poor was higher among adults 85<br />
and older (46.2%) than among those 65-74 (29.1%)<br />
or 75-84 (27.8%; see Figure HS6). Ratings <strong>of</strong> health<br />
as fair increased from 21.8% in adults 65-74 to 39.2%<br />
in adults 85 and older. Ratings <strong>of</strong> health as poor<br />
remained consistent at approximately 7% for adults<br />
65-74, and 85 and older (see Table HS7).<br />
Fig. HS6: <strong>Nevada</strong> Adults, Age 65 and Older:<br />
Self-Reported Health Status by Age<br />
70.9%<br />
72.3%<br />
53.8%<br />
29.1%<br />
27.8%<br />
46.2%<br />
65-74 Years<br />
75-84 Years<br />
85 and Older<br />
58.3%<br />
41.7%<br />
66.1%<br />
33.9%<br />
70.9%<br />
29.0%<br />
(CDC: BRFSS, 2011)<br />
85.4%<br />
14.5%<br />
Less than H.S. H.S. or G.E.D. Some Post H.S. College Graduate<br />
51.9%<br />
48.1%<br />
Fig. HS7: <strong>Nevada</strong> Adults, Age 65 and Older:<br />
Education by Self-Reported Health Status<br />
Fig. HS8: <strong>Nevada</strong> Adults, Age 65 and Older:<br />
In<strong>com</strong>e by Self-Reported Health Status<br />
61.9%<br />
38.2%<br />
72.4% 74.1%<br />
27.5% 26.0%<br />
80.1%<br />
19.9%<br />
Good to Excellent<br />
Fair to Poor<br />
89.3%<br />
10.7%<br />
Health Status<br />
< $15,000 $15,000 to<br />
$24,999<br />
$25,000 to<br />
$34,999<br />
$35,000 to<br />
$49,999<br />
$50,000 to<br />
$74,999<br />
$75,000+<br />
Good to Excellent<br />
Fair to Poor<br />
Good to Excellent<br />
Fair to Poor<br />
(CDC: BRFSS, 2011)<br />
(CDC: BRFSS, 2011)<br />
Among adults 65 and older, a higher percentage <strong>of</strong><br />
males rated their health as good to excellent (71.5%)<br />
than did females (68.4%). Socioeconomic factors<br />
impact health. The percentage <strong>of</strong> older adults who<br />
rated their health as good to excellent increased with<br />
higher educational attainment (see Figure HS7) and<br />
in<strong>com</strong>e (see Figure HS8).<br />
Disability<br />
The Americans with Disabilities Act (ADA) defines<br />
disability as a physical or mental impairment that<br />
substantially limits one or more major life activities <strong>of</strong><br />
such individual (U.S. Department <strong>of</strong> Justice, 2009,<br />
Section 12102). Due to the physical and cognitive<br />
changes <strong>com</strong>mensurate with aging, older adults<br />
may be particularly vulnerable to developing a<br />
disability that interferes with self-care and their<br />
ability to live independently. From 2009-2011,<br />
36.8% <strong>of</strong> older adults in the United States had a<br />
disability (American Community Survey, 3-Year<br />
Estimates-B18101, 2012). The rate for adults 65<br />
or older in <strong>Nevada</strong> was lower: 33.9% (109,839<br />
individuals; American Community Survey, 3-Year<br />
Estimates-B18101, 2012).<br />
Fewer <strong>Nevada</strong> females 65-75 (13.7%) than males<br />
<strong>of</strong> the same age cohort (16.4%) had a disability.<br />
For adults 75 and older, more females (20.4%) than<br />
males (17.4%) reported a disability (see Figure<br />
HS9).<br />
57
Health Status<br />
Fig. HS9: <strong>Nevada</strong> Adults, Age 65 and Older with<br />
Disability: Sex by Age<br />
Male<br />
20.4%<br />
16.4% 17.4%<br />
13.7%<br />
33.8%<br />
34.0%<br />
65-74 75 and older Total 65+<br />
(American Community Survey, 3-Year Estimates,<br />
2009-2011-B18101; 2012)<br />
Female<br />
Fig. HS12: <strong>Nevada</strong> Adults, Age 65 and Older with a<br />
Disability: Region, Sex, and Age<br />
32.5%<br />
24.3% 26.4%<br />
56.2%<br />
45.6% 47.6%<br />
23.4% 26.0%<br />
19.7%<br />
(American Community Survey, 3-Year Estimates,<br />
2009-2011-B18101; 2012)<br />
51.0%<br />
47.3% 47.6%<br />
65 to 74 years 75 years and Older 65 to 74 years 75 years and Older<br />
Male<br />
Female<br />
Southern Urban/Metro<br />
Northern Urban/Metro<br />
Rural/Frontier<br />
A slightly smaller share <strong>of</strong> <strong>Nevada</strong> males 65 and<br />
older (33.8%) had a disability than U.S. males<br />
(35.3%; see Figure HS10). Thirty-four percent <strong>of</strong><br />
older <strong>Nevada</strong> females had a disability, <strong>com</strong>pared<br />
with 37.9% <strong>of</strong> older U.S. females (see Figure HS11).<br />
Fig. HS10: <strong>Nevada</strong> Adults, Age 65 and Older<br />
with Disabilities: U.S. and <strong>Nevada</strong> Males<br />
Male <strong>Nevada</strong><br />
Male U.S.<br />
Physical, mental or emotional disabilities can<br />
limit daily activity, self-care, and the ability to<br />
live independently. More than one-third (37.4%)<br />
<strong>of</strong> <strong>Nevada</strong> adults 65 and older reported their<br />
activities were limited because <strong>of</strong> physical, mental<br />
or emotional disability, and this percentage has<br />
increased since 2003 (See Figure HS13; CDC:<br />
BRFSS, 2009, 2011).<br />
16.4% 15.5%<br />
17.4%<br />
19.9%<br />
33.8%<br />
35.3%<br />
Fig. HS13: <strong>Nevada</strong> Adults, Age 65 and Older:<br />
Limited in Activities due to Disability<br />
37.4%<br />
32.0%<br />
27.0%<br />
65-74 75 and older Total 65+<br />
(American Community Survey, 3-Year Estimates,<br />
2009-2011-B18101; 2012)<br />
Fig. HS11: <strong>Nevada</strong> Adults, Age 65 and Older<br />
with Disabilities: U.S. and <strong>Nevada</strong> Females<br />
13.7%<br />
13.1%<br />
20.4%<br />
24.8%<br />
34.0%<br />
65-74 75 and older Total 65+<br />
37.9%<br />
(American Community Survey, 3-Year Estimates,<br />
2009-2011-B18101; 2012)<br />
Female <strong>Nevada</strong><br />
Female U.S.<br />
Of <strong>Nevada</strong>ns 65 and older, males 75 and older<br />
living in the Rural/Frontier region were the most<br />
likely to report having a disability (56.2%, see Table<br />
HS8). Least likely to report a disability were females<br />
65-74 living in the Northern Urban/Metropolitan<br />
region <strong>of</strong> the state (19.7%; see Figure HS12).<br />
2003 2007 2011<br />
(Center for Disease Control (CDC): Behavioral Risk Factor Surveillance<br />
System (BRFSS), 2007 in Elders Count <strong>Nevada</strong>, 2009, p. 29;<br />
CDC: BRFSS, 2011)<br />
Fewer older males (35.3%) than females (39.3%)<br />
reported limitations in activities due to disability<br />
(see Table HS9; CDC: BRFSS, 2011). In addition,<br />
the proportion <strong>of</strong> those who described being limited<br />
because <strong>of</strong> physical, mental, or emotional problems<br />
increased within age cohort: 65-74 (34.9%), 75-84<br />
(39.2%), 85 and older (53.1%).<br />
Fig. HS14: <strong>Nevada</strong> Adults Age 65 and Older:<br />
Region by Limitations in Activities<br />
37.4%<br />
36.0%<br />
41.3%<br />
38.9%<br />
<strong>Nevada</strong><br />
Southern<br />
Urban/Metro<br />
Northern<br />
Urban/Metro<br />
Rural/Frontier<br />
(CDC: BRFSS, 2011)<br />
58
Activity limitations due to disability also differed by<br />
race and ethnicity. A lower percentage <strong>of</strong> Hispanics<br />
(23.2%) reported limitations than did Whites (39.5%)<br />
or those <strong>of</strong> an “Other Race” (44.1%; see Figure<br />
HS15). (Note: Data for Black participants was not<br />
included due to small sample size.)<br />
Fig. HS15: <strong>Nevada</strong> Adults, Age 65 and Older:<br />
Race/Ethnicity by Activity Limitations<br />
39.5%<br />
44.1%<br />
(CDC: BRFSS, 2011)<br />
23.2%<br />
White Other Race Hispanic<br />
Living with a disability may require special<br />
equipment such as a cane, wheelchair, special bed<br />
or telephone. According to the Elders Count <strong>Nevada</strong><br />
(2009) report, the need for special equipment due<br />
to disability among <strong>Nevada</strong>’s adults 65 and older<br />
increased from 15% in 2001 to 18% in 2007. This<br />
trend continued in 2011, with 19.7% <strong>of</strong> <strong>Nevada</strong>’s<br />
older adults reporting the need for special equipment<br />
(see Table HS10; CDC: BRFSS, 2011).<br />
Among those who responded to the survey, only<br />
minimal differences were noted by age. A greater<br />
percentage <strong>of</strong> respondents 85 and older (27.6%)<br />
indicated that they required special equipment for a<br />
disability. Only 16% <strong>of</strong> those 65-74 required assistive<br />
devices (see Figure HS17).<br />
Health Status<br />
Reported activity limitations by age, education<br />
and in<strong>com</strong>e revealed only minimal differences 3 .<br />
The percentage <strong>of</strong> individuals reporting limitations<br />
increased somewhat from age 65-74 (34.9%) to 75-<br />
84 (39.2%), and to 85 and older (53.1%). Although<br />
limitations did not differ a great deal by education, a<br />
larger percentage <strong>of</strong> older adults with a high school<br />
diploma or GED (41.1%) reported limitations due to<br />
disability than did those with less than a high school<br />
education (33.2%), some college (39.4%), or a college<br />
degree (34.1%). A lower percentage <strong>of</strong> older adults<br />
with annual in<strong>com</strong>es between $25,000 and $34,999<br />
(28.0%) reported limitations due to disability than<br />
did older adults in other in<strong>com</strong>e ranges (see Figure<br />
HS16).<br />
41.3%<br />
Fig. HS16: <strong>Nevada</strong> Adults, Age 65 and Older:<br />
In<strong>com</strong>e by Limitations<br />
47.0%<br />
28.0%<br />
40.2% 39.3%<br />
30.3%<br />
Fig. HS17: <strong>Nevada</strong> Adults, Age 65 and Older:<br />
Age by Requires Special Equipment<br />
16.0%<br />
25.5%<br />
(CDC: BRFSS, 2011)<br />
27.6%<br />
65-74 Years 75-84 Years 85 and Older<br />
Few regional or race/ethnicity differences were noted.<br />
However, differences were noted by sex, education<br />
and in<strong>com</strong>e. The percentage <strong>of</strong> older males requiring<br />
special equipment (13.2%) was significant lower than<br />
the percentage <strong>of</strong> older females (25.3%; see Figure<br />
HS18).<br />
Fig. HS18: <strong>Nevada</strong> Adults, Age 65 and Older:<br />
Sex by Requires Special Equipment<br />
25.3%<br />
13.2%<br />
< $15,000 $15,000 to<br />
$24,999<br />
$25,000 to<br />
$34,999<br />
$35,000 to<br />
$49,999<br />
$50,000 to<br />
$74,999<br />
$75,000 and<br />
Higher<br />
Male<br />
Female<br />
(CDC: BRFSS, 2011)<br />
(CDC: BRFSS, 2011)<br />
3<br />
Note: Confidence intervals (C.I.) that do not overlap conclusively support that the variables are significantly different. However, confidence intervals<br />
that do overlap only “suggest” no significant differences between the variables. In cases where C.I. overlapped, we used phrases such as “no<br />
differences” or “minimal differences.”<br />
59
Health Status<br />
In addition, the share <strong>of</strong> older adults with college<br />
degrees who required special equipment (10.3%) was<br />
lower than for older adults with only some posthigh-school<br />
education (23.1%) or for adults with<br />
only a high school diploma/GED (21.1%; see Fig.<br />
HS19). Due to the small sample size <strong>of</strong> older adults<br />
with the lowest level <strong>of</strong> education, <strong>com</strong>parisons were<br />
not made (see Table HS9).<br />
Fig. HS19: <strong>Nevada</strong> Adults, Age 65 and Older:<br />
Education by Requires Special Equipment<br />
21.5% 21.1%<br />
23.1%<br />
(CDC: BRFSS, 2011)<br />
10.3%<br />
Less than H.S. H.S. or G.E.D. Some Post H.S. College Graduate<br />
Of the older adults who responded to the BRFSS and<br />
earned less than $15,000 per year, 31.2% indicated<br />
that they required special equipment. Of those<br />
earning $15,000 to $24,999, 35.8% indicated they<br />
required special equipment. Percentages for survey<br />
participants in these two categories were higher than<br />
for older adults with higher in<strong>com</strong>es (see Figure<br />
HS20).<br />
When asked, How many days in the 30 days prior<br />
to the survey did poor physical or mental health limit<br />
you from doing your usual activities such as self-care,<br />
work or recreation? (BRFSS, 2011), the majority <strong>of</strong> all<br />
respondents (80%) reported no restrictions (see Table<br />
HS11). The percentages did not differ significantly by<br />
region, age, sex, race/ethnicity, education or in<strong>com</strong>e.<br />
Of those who reported restrictions in activities,<br />
10.1% <strong>of</strong> 65- to 74-year-olds indicated that activities<br />
were restricted from 1-10 days. For 11-20 days the<br />
figure was 3.4%, and for 21-30 days the figure was<br />
6.9%. Of the adults 75-84, 7% reported limitations<br />
from 1-10 days; 4% for 11-20 days, and 10.1% for<br />
21-30 days in the month prior to the survey. Just<br />
over 1% <strong>of</strong> adults 85 and older who responded to<br />
the survey reported restrictions from 1-10 days.<br />
No adults reported restrictions lasting from 11-20<br />
days, and 10.3% reported restrictions from 21-30<br />
days. Over one-third <strong>of</strong> respondents earning less<br />
than $15,000 per year (31.4%) reported restrictions,<br />
<strong>com</strong>pared with less than one-fifth (11.5%) <strong>of</strong> older<br />
adults earning $75,000 a year.<br />
Fig. HS20: <strong>Nevada</strong> Adults, Age 65 and Older:<br />
In<strong>com</strong>e by Requires Special Equipment<br />
31.2%<br />
35.8%<br />
9.7%<br />
14.3% 12.4%<br />
9.1%<br />
< $15,000 $15,000 to<br />
$24,999<br />
$25,000 to<br />
$34,999<br />
$35,000 to<br />
$49,999<br />
$50,000 to<br />
$74,999<br />
$75,000 and<br />
Higher<br />
(CDC: BRFSS, 2011)<br />
60
Visual & Hearing Health<br />
Age-associated declines in vision and hearing can<br />
negatively influence health literacy and health<br />
management in older adults (Echt, 2009, p. 11, in<br />
Improving Health Literacy, 2009). Statistics from<br />
the National Institutes <strong>of</strong> Health: National Eye<br />
Institute (2012), based on the 2010 U.S. Census,<br />
show that 2.9% <strong>of</strong> the U.S. population 40 and older<br />
suffered from vision impairment. By <strong>com</strong>parison,<br />
fewer <strong>Nevada</strong> adults 40 and older (2.3%) suffered<br />
from vision impairment. However, <strong>Nevada</strong> (5.5%)<br />
was higher than the U.S. (5.4%) in prevalence <strong>of</strong><br />
diabetic retinopathy (i.e., diabetes precipitated<br />
damage to the eye blood vessels). Females reported<br />
more vision problems than males, with the<br />
exception <strong>of</strong> diabetic retinopathy. For this disorder,<br />
prevalence among females was 48.4% versus 51.6%<br />
among males (NIH: National Eye Institute, 2012).<br />
For adults age 65 and older, the prevalence <strong>of</strong> vision<br />
impairment increases with age. <strong>Nevada</strong> seniors<br />
have lower prevalence than found nationally in all<br />
vision indicators (e.g., vision impairment, macular<br />
degeneration, blindness, cataracts, glau<strong>com</strong>a,<br />
hyperopia, and myopia). As with the younger<br />
population above, the exception to this is the<br />
prevalence <strong>of</strong> diabetic retinopathy. U.S. prevalence<br />
rates for diabetic retinopathy in adults 65-74 (8.8%)<br />
and adults age 75 and older (8.1%) are slightly<br />
lower than in <strong>Nevada</strong> adults <strong>of</strong> the same age (9%<br />
and 8.6%, respectively; NIH: National Eye Institute,<br />
2012).<br />
The National Institutes <strong>of</strong> Health (NIH) noted,<br />
“hearing loss is one <strong>of</strong> the most <strong>com</strong>mon conditions<br />
affecting older adults.” One-third <strong>of</strong> all adults 60<br />
and older and 50% <strong>of</strong> those 85 and older suffer<br />
from at least some level <strong>of</strong> hearing loss [National<br />
Institute on Deafness and Other Communication<br />
Disorders (NIDCD), 2012, para. 1] 4 . The NIDCD<br />
also reported that 12.3% <strong>of</strong> males and almost 14%<br />
<strong>of</strong> females 65 and older have tinnitus, a hearing<br />
problem distinguished by the perception <strong>of</strong> sound<br />
occurring from within the ear, and that only 20%<br />
<strong>of</strong> those with hearing loss acquire assistive devices<br />
like hearing aids (NIDCD: Quick Statistics, 2012).<br />
An AARP article suggested that the primary barrier<br />
to acquiring hearing aids for older adults is cost<br />
(Cropp, 2011). <strong>Nevada</strong> Medicaid covers the cost <strong>of</strong><br />
hearing aids and hearing tests for adults at or below<br />
133% <strong>of</strong> poverty (Hearing Loss <strong>of</strong> Association,<br />
2012).<br />
Health Status<br />
4<br />
State-level data on hearing loss in older adults was not available.<br />
61
Health Status<br />
Oral Health<br />
As indicated in the Elders Count <strong>Nevada</strong> (2009)<br />
report, oral health is an important element <strong>of</strong><br />
overall health and well-being. Lack <strong>of</strong> proper dental<br />
care can lead to oral pain, dental decay or cavities,<br />
gingivitis, and loss <strong>of</strong> teeth, all <strong>of</strong> which can lead<br />
to poor nutrition and diabetes (The Effects <strong>of</strong> Oral<br />
Health on Overall Health, 2009). Poor dental health<br />
is correlated positively with respiratory and heart<br />
diseases when oral bacteria enter the bloodstream<br />
through mouth lesions (Mayo Clinic, 2012). In older<br />
adults, poor oral hygiene may result in problems<br />
such as dry mouth, reduced sense <strong>of</strong> taste, tissue<br />
inflammation from poor-fitting dentures, thrush,<br />
and oral cancer (Mayo Clinic, 2012). Barriers to<br />
treatment for older adults include the financial<br />
cost <strong>of</strong> dental care when on a fixed in<strong>com</strong>e, lack <strong>of</strong><br />
dental care as a provision <strong>of</strong> health insurance (i.e.,<br />
Medicare does not include dental care), difficulties<br />
accessing the dental <strong>of</strong>fice due to transportation<br />
issues, and language barriers in older adult<br />
immigrants (Mayo Clinic, 2012).<br />
<strong>Nevada</strong> Adults, Age 65 and Older: Education by Visited a Dentist, Dental Hygienist or Dental Clinic in Past Year<br />
Of <strong>Nevada</strong> adults 65 and older who <strong>com</strong>pleted the<br />
BRFSS in 2010, 62.1% reported that they had visited<br />
a dentist, dental hygienist or dental clinic in the past<br />
year (see Table HS12, CDC: BRFSS, 2010). A review<br />
<strong>of</strong> the responses across a variety <strong>of</strong> demographic<br />
variables revealed differences across region and<br />
education. For example, approximately half <strong>of</strong> the<br />
Rural/Frontier area respondents (50.1%) indicated<br />
that they had visited a dentist, dental hygienist or<br />
dental clinic in the past year. A larger percentage<br />
<strong>of</strong> older adult respondents in the Southern Urban/<br />
Metropolitan area (62.3%) and in the Northern<br />
Urban/Metropolitan area (69.5%) had sought dental<br />
care in the past year (see Figure HS21).<br />
Fig. HS21: <strong>Nevada</strong> Adults, Age 65 and Older:<br />
Region by Visited a Dentist, Dental Hygienist or<br />
Dental Clinic in Past Year<br />
Of older adults having less than a high school<br />
education, 37.7% reported visiting a dentist, dental<br />
hygienist or dental clinic in the year prior to the<br />
survey (see Figure HS22). This percentage was<br />
lower than that reported by older adults with higher<br />
education. It was especially low <strong>com</strong>pared with<br />
respondents with a college education (76.5%). Lack<br />
<strong>of</strong> easy access to care or awareness <strong>of</strong> the need<br />
for dental care may have played a role in these<br />
out<strong>com</strong>es.<br />
Fig. HS22: <strong>Nevada</strong> Adults, Age 65 and Older:<br />
Education by Visited a Dentist, Dental<br />
Hygienist or Dental Clinic in Past Year<br />
37.7%<br />
56.7%<br />
63.0%<br />
(CDC: BRFSS, 2010)<br />
76.5%<br />
Less than H.S. H.S. or G.E.D. Some Post H.S. College Graduate<br />
Minimal differences were noted across age, sex, race<br />
and in<strong>com</strong>e. However, more than half <strong>of</strong> the older<br />
adult respondents with in<strong>com</strong>es less than $25,000<br />
indicated that they did not access dental care in<br />
the past year (
Fig. HS23: National - Prevalence <strong>of</strong> Edentulism Among<br />
Older Adults by Age, Race and Ethnicity, and Poverty<br />
Level<br />
Hispanic<br />
Non-Hispanic Black<br />
Non-Hispanic White<br />
Above 100% <strong>of</strong> federal<br />
poverty level<br />
Below 100% <strong>of</strong> federal<br />
poverty level<br />
10.7%<br />
13.1%<br />
15.2%<br />
28.0%<br />
21.6%<br />
24.6%<br />
20.7%<br />
20.9%<br />
23.5%<br />
34.3%<br />
35.5%<br />
Fig. HS24: <strong>Nevada</strong>, Adults Age 65 and Older:<br />
Education by Permanent Teeth Removed<br />
64.5%<br />
21.8%<br />
78.2%<br />
15.1%<br />
(BRFSS, 2010)<br />
84.9%<br />
7.4%<br />
92.6%<br />
Less than H.S. H.S. or G.E.D. Some Post H.S. College Graduate<br />
Yes<br />
No<br />
Health Status<br />
Total<br />
15.0%<br />
21.9%<br />
65-74 Years 75 Years and Older<br />
(Dye et al, 2012 – CDC/NCHS, National Health and Nutrition<br />
Examination Survey, 2009-2010, p. 4)<br />
This same pattern was noted with in<strong>com</strong>e. As<br />
in<strong>com</strong>e increased, the reported cases <strong>of</strong> loss <strong>of</strong> all<br />
permanent teeth in older <strong>Nevada</strong>ns decreased (see<br />
Figure HS25).<br />
In <strong>Nevada</strong>, approximately 17% <strong>of</strong> the older adults<br />
who responded to the BRFSS had all <strong>of</strong> their<br />
permanent teeth removed (see Table HS13). Just<br />
over 15% <strong>of</strong> respondents 65-74 reported removal<br />
<strong>of</strong> all permanent teeth. The figures were 20.8% for<br />
those 75-84 and 18.7% for people 85 and older.<br />
Fewer older males reported having had their teeth<br />
removed (14.7%) than older females (19.4%).<br />
33.4%<br />
Fig. HS25: <strong>Nevada</strong>, Adults Age 65 and Older:<br />
In<strong>com</strong>e by Permanent Teeth Removed<br />
66.6%<br />
22.8%<br />
77.2%<br />
< $15,000 $15,000 to<br />
$24,999<br />
85.1% 85.6% 87.7%<br />
14.9% 14.4% 12.3%<br />
$25,000 to<br />
$34,999<br />
Yes<br />
$35,000 to<br />
$49,999<br />
No<br />
$50,000 to<br />
$74,999<br />
7.7%<br />
92.3%<br />
$75,000 and<br />
Higher<br />
Increases in education were associated with<br />
decreases in the percentage <strong>of</strong> respondents<br />
reporting edentulism (see Figure HS24).<br />
(CDC: BRFSS, 2010)<br />
As <strong>of</strong> August 2012, there were 4,406 Dental Health<br />
Pr<strong>of</strong>essional Shortage Areas (HPSAs) within the<br />
United States, leaving 43.8 million people without<br />
adequate access to dental care [U.S. Department <strong>of</strong><br />
Health and Human Services (DHHS), 2012]. Within<br />
<strong>Nevada</strong>, 15 <strong>of</strong> the 17 counties are designated as<br />
Dental HPSAs. Only Douglas and Lyon counties<br />
are not dental-shortage areas (DHHS, Find<br />
Shortage Areas, 2012).<br />
63
Health Status<br />
Mental Health<br />
According to the Institute <strong>of</strong> Medicine (IOM) <strong>of</strong><br />
the National Academies, “one in five older adults<br />
in America have one or more [mental health and<br />
substance use] conditions” (2012, p. 1). Yet between<br />
FY 2009 and FY 2012, many U.S. states cut funding<br />
for mental health services. The cuts ranged from<br />
10.4% to 39.3% <strong>of</strong> each state’s general fund (NAMI,<br />
2011). <strong>Nevada</strong> cut 28.1% <strong>of</strong> its general budget for<br />
mental health services. From FY 2011 to FY 2012,<br />
<strong>Nevada</strong> cut 8.8% ($12.2 million) <strong>of</strong> its mental health<br />
budget, the third-steepest percentage reduction<br />
among the states. (NAMI, 2011, p. Appendix IV).<br />
The state also lost an estimated $10 million in<br />
enhanced federal Medicaid match (p. Appendix VI).<br />
Among those who responded to the 2011 BRFSS<br />
<strong>Nevada</strong> survey item regarding the frequency <strong>of</strong> poor<br />
mental health days, a higher percentage <strong>of</strong> older<br />
adult females (29.4) than males (17.1%) reported<br />
at least one bad mental health day in the past 30<br />
days. Only minimal percentage differences were<br />
noted in the number <strong>of</strong> bad health days by region,<br />
age cohort, race/ethnicity or in<strong>com</strong>e (see Table<br />
HS15). However, fewer older adults with a college<br />
education (14.2%) reported bad mental health days<br />
than those with less education (see Figure HS26).<br />
Fig. HS26: <strong>Nevada</strong> Adults Age 65 and Older: At<br />
Least One Mental Health Day per Month<br />
64<br />
Between 2005 and 2007, 21% <strong>of</strong> <strong>Nevada</strong> adults 65 and<br />
older reported at least one day <strong>of</strong> poor mental health<br />
in the past 30 days (Sanford Center for Aging, Elders<br />
Count <strong>Nevada</strong>, 2009, p. 31). By 2011, the percentage<br />
<strong>of</strong> older adults with at least one bad mental health day<br />
in the previous 30 had increased to 23.7% (see Table<br />
HS14, CDC: BRFSS, 2011). In addition, 19.2% <strong>of</strong> the<br />
older <strong>Nevada</strong>ns who responded to the survey item<br />
about frequency <strong>of</strong> depressive symptoms indicated<br />
that they had felt “down, depressed or hopeless” at<br />
least one day in the previous two weeks (see Table<br />
HS15, CDC: BRFSS, 2011).<br />
Mental health disorders are not a normal part <strong>of</strong><br />
aging. When not treated, such disorders may have<br />
serious negative effects on the health and wellbeing<br />
<strong>of</strong> seniors (Sanford Center for Aging, Elders<br />
Count <strong>Nevada</strong>, 2009, p. 31). Symptoms such as<br />
depression, anxiety, a sense <strong>of</strong> hopelessness, and<br />
even suicidal ideations may ac<strong>com</strong>pany loss <strong>of</strong><br />
loved ones and friends, social isolation, and agingrelated<br />
declines in physical and mental function.<br />
In addition, mental health issues may co-occur<br />
with age-related chronic health conditions such<br />
as heart disease, cancer and diabetes. Mental<br />
health issues may be mistakenly viewed as a<br />
“normal consequence <strong>of</strong> these problems” (National<br />
Institute on Mental Health, n.d. Para. 1). In spite<br />
<strong>of</strong> the devastating consequences <strong>of</strong> mental health<br />
disorders in older adults and the prevalence <strong>of</strong><br />
depression and anxiety, these conditions are<br />
underdiagnosed, underreported, and, consequently,<br />
under-treated.<br />
29.2%<br />
23.2%<br />
26.7%<br />
(CDC: BRFSS, 2011)<br />
Of those who responded to the survey item<br />
regarding the frequency <strong>of</strong> depressive symptoms<br />
in the past two weeks (see Table HS15), the largest<br />
percentage <strong>of</strong> older adults in all regions experienced<br />
symptoms for 1-5 days (see Figure HS27).<br />
(CDC: BRFSS, 2011)<br />
14.2%<br />
Less than H.S. H.S. or G.E.D. Some Post H.S. College Graduate<br />
13.6%<br />
Fig. HS27: <strong>Nevada</strong> Adults, Age 65 and Older:<br />
Region by Number <strong>of</strong> Days with Depressive<br />
Symptoms<br />
18.9%<br />
10.4%<br />
Southern Urban/Metro<br />
Northern Urban/Metro<br />
Rural/Frontier<br />
4.3%<br />
2.4% 3.1% 2.7%<br />
1.4%<br />
1.2%<br />
1 to 5 Days 6 to 10 Days 11 to 14 Days<br />
Only minimal differences existed by sex, age, race/<br />
ethnicity or in<strong>com</strong>e. However, the proportion <strong>of</strong><br />
older adults experiencing depressive symptoms<br />
within the week prior to the survey decreased with<br />
increases in education (see Figure HS28).
Fig. HS28: <strong>Nevada</strong> Adults, Age 65 and Older:<br />
Education by Depressive Symptoms at Least<br />
Once in Past Two Weeks<br />
27.3%<br />
19.1% 18.7%<br />
(CDC: BRFSS, 2011)<br />
12.0%<br />
Less than H.S. H.S. or G.E.D. Some Post H.S. College Graduate<br />
Fewer than 1 in 10 (7.6%) <strong>of</strong> <strong>Nevada</strong> respondents<br />
65 and older indicated that they had been<br />
prescribed medication or treatment for a mental<br />
health or emotional condition (see Table HS16,<br />
CDC: BRFSS, 2011).<br />
Only minimal differences were noted by sex,<br />
education or in<strong>com</strong>e. However, a much higher<br />
percentage <strong>of</strong> older adults in the 65-74 age<br />
group (10.8%) reported having been prescribed<br />
medication and/or treatment than adults in the<br />
75-84 age cohort (3.1%) or the 85 and older cohort<br />
(4.9%; see Figure HS29).<br />
Fig. HS29: <strong>Nevada</strong> Adults, Age 65 and Older: Age by<br />
Receiving MH Medication or Treatment<br />
10.8%<br />
3.1%<br />
4.9%<br />
65-74 Years 75-84 Years 85 and Older<br />
Health Status<br />
(CDC: BRFSS, 2011)<br />
Suicide<br />
Between 2008 and 2009, suicide was the only<br />
leading cause <strong>of</strong> death in the nation to increase<br />
(e.g., increase <strong>of</strong> 1.7%; Kochanek, Xu, Murphy,<br />
Minino, & Kung, 2011). From 2009 to 2010, suicide<br />
increased by an age-adjusted 0.8% and ranked<br />
as the 10th-most-<strong>com</strong>mon cause <strong>of</strong> death (CDC:<br />
Injury Center, 2012; Murphy, Xu, and Kochanek,<br />
2012). In 2009, almost 37,000 individuals <strong>com</strong>mitted<br />
suicide (McIntosh, 2012). This translated to one<br />
suicide death every 14.2 minutes, or just over 100<br />
deaths per day. In addition, <strong>of</strong> those who died by<br />
suicide, almost 6,000 were 65 or older. An older<br />
adult <strong>com</strong>pleted a suicide every 1.5 hours, or 16<br />
people per day (McIntosh, 2012, p. 1). McIntosh<br />
noted that although adults 65 and older made<br />
up only 12.9% <strong>of</strong> the population in 2009, they<br />
represented 15.9% <strong>of</strong> the suicides (2012, p. 1).<br />
National suicide numbers increased again in<br />
2010 to 38,364, or 12.4 per 100,000 (McIntosh &<br />
Drapeau, 2012). This translated to an average <strong>of</strong> 1<br />
suicide every 13.7 minutes, or 105.1 deaths per day.<br />
In 2010, 5,994 U.S. adults 65 or older <strong>com</strong>mitted<br />
suicide, a rate <strong>of</strong> 14.9 per 100,000, or 16.4 per day.<br />
Sociological researchers at the <strong>University</strong> <strong>of</strong><br />
Cambridge noted a correlation between the recent<br />
economic recession and increases in the U.S. rate<br />
<strong>of</strong> suicide (Reeves, Stuckler, McKee, Gunnell,<br />
Chang, and Basu, 2012). From 1999 to 2007, prior<br />
to the recession, annual U.S. suicide mortality rates<br />
increased by an average rate <strong>of</strong> 0.12 per 100,000<br />
per year (Reeves et al., 2012, p. 1). After the onset<br />
<strong>of</strong> the recent recession (2008-2010), the mortality<br />
rate climbed to 0.51 per 100,000 per year, which<br />
translated to approximately 4,750 additional deaths<br />
by suicide (see Figure HS30).<br />
Fig. HS30. Time Trend Analysis <strong>of</strong> U.S. Suicide Rates<br />
from 1999 to 2020<br />
(Reeves, Stuckler, McKee, Gunnell, Chang, and Basu, 2012, p. 1)<br />
65
Health Status<br />
Researchers for the American Association <strong>of</strong><br />
Suicidology (McIntosh & Drapeau, 2012) examined<br />
U.S. suicide rates in older adults by age cohort over<br />
time (see HS31). Results supported the importance<br />
<strong>of</strong> analysis by age cohorts 55-64, 65-74, and 85 and<br />
older. Suicide rates in adults 65-74 dropped between<br />
2003 and 2007 but increased from 2007 to 2010.<br />
Suicide rates decreased for adults 75-84 with only<br />
minor increases in 2005. Rates <strong>of</strong> suicide increased<br />
for the youngest baby boomers (age 55-64) from 12.3<br />
per 100,000 in 2000 to 17.5 per 100,000 in 2010. The<br />
trend <strong>of</strong> decreasing suicides among the oldest old (85<br />
and older) from 2000 to 2009 reversed in 2010.<br />
20<br />
19<br />
18<br />
17<br />
16<br />
15<br />
14<br />
13<br />
12<br />
11<br />
10<br />
Fig. HS31: U.S. Suicide Rates (Per 100,000 Population), 2000-<br />
2010<br />
2000 2001 2002 2003 2004 2005 2006 2007 2008 2009<br />
55-64 Years 65-74 Years 75-84 Years 85 and older<br />
(McIntosh & Drapeau, 2012)<br />
Since 2008, <strong>Nevada</strong> has ranked either fourth or<br />
fifth in the nation for the number <strong>of</strong> suicide deaths.<br />
<strong>Nevada</strong>’s rate has consistently remained above the<br />
national rate. The only states with a higher suicide<br />
rate in 2010 were Wyoming, Alaska and Montana.<br />
Fig. HS33: <strong>Nevada</strong>, 2010: 10 Leading Causes<br />
<strong>of</strong> Death in Adults 65-74*<br />
Malignant Neoplasms<br />
Heart Disease<br />
Chronic Low. Respiratory Disease<br />
Cerebrovascular<br />
Nephritis<br />
Influenza & Pneumonia<br />
Diabetes Mellitus<br />
Septicemia<br />
Unintentional Injury<br />
Suicide<br />
All Others<br />
8.1%<br />
4.4%<br />
2.5%<br />
2.2%<br />
2.1%<br />
2.0%<br />
1.9%<br />
1.5%<br />
16.9%<br />
24.2%<br />
*Note: Percentages are <strong>of</strong> the 3098 Total Deaths<br />
(CDC: WISQARS, 2010)<br />
34.3%<br />
<strong>Nevada</strong> adults 65-85 used two primary methods for<br />
suicide, firearms (71.6%) and suffocation (10.3%;<br />
CDC: WISQARS, 2010). This differed from U.S.<br />
suicide methods for the same age group. Nationally,<br />
the most <strong>com</strong>mon suicide methods were firearms<br />
(63.1%), poisoning (10%), suffocation (8.7%), cut/<br />
pierce (1.3%), fall (1.2%) and drowning (1%).<br />
In 2011, suicide accounted for an estimated 0.7%<br />
<strong>of</strong> the 13,519 <strong>Nevada</strong> deaths (see Table HS17;<br />
CDC: BRFSS, 2011). The greatest number <strong>of</strong><br />
<strong>Nevada</strong> suicides occurred in the Southern Urban/<br />
Metropolitan area <strong>of</strong> the state and among adults 65-<br />
75 years <strong>of</strong> age (55%). Eighteen suicides occurred in<br />
the Northern Urban/Metropolitan region, with 72%<br />
<strong>of</strong> those (n = 13) in adults 65-74. Fifty-seven suicides<br />
occurred in the Southern Urban/Metropolitan region<br />
with 56% (n = 32) occurring among adults 65-74.<br />
Sixteen suicides occurred in the Rural/Frontier region<br />
with 56.3% (n = 9) in adults 75-84.<br />
Suicide ranked as the sixth-leading cause <strong>of</strong> death<br />
for all ages in <strong>Nevada</strong> in 2008 (Elders Count <strong>Nevada</strong>,<br />
2009) and the eighth-leading cause <strong>of</strong> death in 2009.<br />
It was the seventh-leading cause <strong>of</strong> death among<br />
adults 55-64 that year (CDC: WISQARS, 2010).<br />
Interestingly, suicide was not one <strong>of</strong> the 10 leading<br />
causes <strong>of</strong> death for <strong>Nevada</strong> adults 75 and older in<br />
2010 (CDC: WISQARS, 2010).<br />
Fig. HS32: <strong>Nevada</strong>, 2010: 10 Leading Causes<br />
<strong>of</strong> Death in Adults 55-64*<br />
Malignant Neoplasms<br />
Heart Disease<br />
Unintentional Injury<br />
Chronic Low. Respiratory Disease<br />
Suicide<br />
Cerebrovascular<br />
Liver Disease<br />
Nephritis<br />
Diabetes Mellitus<br />
Influenza & Pneumonia<br />
All Others<br />
4.8%<br />
4.3%<br />
3.8%<br />
3.3%<br />
3.0%<br />
2.5%<br />
2.1%<br />
2.0%<br />
18.7%<br />
29.6%<br />
26.0%<br />
66<br />
*Note: Percentages are <strong>of</strong> the 2012 Total Deaths<br />
(CDC: WISQARS, 2010)
Veterans<br />
Veterans make up approximately 7% <strong>of</strong> the U.S.<br />
population. One out <strong>of</strong> four seniors is either a<br />
veteran or a surviving spouse <strong>of</strong> a veteran (Health<br />
Policy Explained, n.d.). As <strong>of</strong> 2010, slightly fewer<br />
than 26 million veterans were 55 or older (American<br />
Community Survey, 5-Year Estimates-B21001,<br />
2006-2010). The oldest group <strong>of</strong> veterans served<br />
during World War II (U.S. Department <strong>of</strong> Veterans<br />
Affairs, 2012).<br />
The following veteran data was collected as part <strong>of</strong><br />
the 2011 Behavioral Risk Factor Surveillance System<br />
survey (BRFSS) with analysis from the Office <strong>of</strong><br />
Public Health Informatics and Epidemiology.<br />
Approximately 394 <strong>Nevada</strong> veterans 65 and older<br />
<strong>com</strong>pleted the survey. This represents an estimated<br />
0.5% <strong>of</strong> the total veteran population in this age<br />
range. Due to the small sample size, data was not<br />
included for any variable for which 50 or fewer<br />
individuals responded. In addition, caution should<br />
be taken when interpreting the data as it may<br />
not be representative <strong>of</strong> the entire older-<strong>Nevada</strong>veteran<br />
population.<br />
Trauma<br />
Veterans 65 and older may have been exposed to<br />
numerous military-related sources <strong>of</strong> trauma. For<br />
example, <strong>of</strong> the 394 <strong>Nevada</strong> veterans who <strong>com</strong>pleted<br />
the BRFSS question about military service, 51%<br />
indicated they had served in a <strong>com</strong>bat or war zone,<br />
including World War II, the Korean War, Vietnam<br />
and the Gulf-War (see Table HS18). Peacetime<br />
veterans, particularly women, also may have been<br />
exposed to the trauma <strong>of</strong> sexual assault or rape. Recent<br />
research suggests that the post-trauma symptoms<br />
[e.g., Post Traumatic Stress Disorder (PTSD)] may<br />
continue in these veterans as long as 65 years after<br />
the exposure (Rintamaki, Weaver, Elbaum, Klama,<br />
and Miskevics, 2009, p. 2,257). Another recent study<br />
<strong>of</strong> 17,250 veterans 65 and older in six Department <strong>of</strong><br />
Veterans Affairs primary care clinics noted a decrease<br />
in self-reported health ratings and an increase in<br />
reported PTSD symptoms (Durai et al., 2011). Finally,<br />
in a national sample <strong>of</strong> veterans 65 and older, over<br />
50% rated their health as fair to poor (Villa, Harada,<br />
Washington, & Damron-Rodriguez, 2003). The study<br />
reported that ratings differed by race/ethnicity. Older<br />
Hispanic and Black veterans rated their health worse<br />
than older White veterans did.<br />
Traumatic brain injury (TBI) has been called a<br />
“signature injury” <strong>of</strong> younger veterans returning from<br />
the Iraq and Afghanistan wars (Sayer, Scholten, Scott,<br />
and Carmen, 2012, para. 2). TBIs are blast injuries<br />
received during <strong>com</strong>bat or while in <strong>com</strong>bat zones.<br />
These types <strong>of</strong> brain injuries can result in long-term<br />
symptoms, including depression, hearing and vision<br />
difficulties, pain, and other mental health problems.<br />
Of the <strong>Nevada</strong> veterans 65 and older who responded<br />
to the BRFSS item regarding TBI (see Table HS19),<br />
1.5% indicated that they had been diagnosed<br />
with TBI (CDC: BRFSS, 2011). Almost 35% <strong>of</strong> the<br />
total respondents resided in the Southern Urban/<br />
Metropolitan and Northern Urban/Metropolitan area<br />
<strong>of</strong> the state, and 30.6% resided in the Rural/Frontier<br />
region. Regionally, a higher percentage (4.4%) <strong>of</strong> older<br />
veterans living in the Rural/Frontier region <strong>of</strong> the state<br />
had been diagnosed with TBI (see Figure HS34). This<br />
should be <strong>of</strong> concern when considering rural barriers<br />
to resources and access to treatment.<br />
1.5%<br />
Fig. HS34: <strong>Nevada</strong> Veterans, Age 65 and Older:<br />
Diagnosed with TBI<br />
0.3%<br />
(CDC: BRFSS, 2011)<br />
In addition, more <strong>Nevada</strong> veterans ages 65-74 (2%)<br />
reported suffering from TBI than those ages 75-84<br />
(1.2%). Only minimal differences in TBI diagnosis<br />
were noted across education or in<strong>com</strong>e.<br />
Consequences <strong>of</strong> trauma may include PTSD, a mental<br />
health disorder associated with symptoms including<br />
persistent re-experiencing <strong>of</strong> the event, continued<br />
efforts to avoid stimuli associated with the event, and<br />
symptoms <strong>of</strong> increased arousal such as irritability,<br />
hypervigilance, insomnia, exaggerated-startle<br />
response and difficulty concentrating (Diagnostic<br />
and Statistical Manual, IV-TM, 1994, p. 428). Other<br />
consequences <strong>of</strong> trauma may include depression and<br />
anxiety.<br />
2.4%<br />
4.4%<br />
Statewide Southern Urban/Metro Northern Urban/Metro Rural/Frontier<br />
Health Status<br />
67
Health Status<br />
Of the <strong>Nevada</strong> veterans who responded to the BRFSS,<br />
almost 1 in 10 (9.3%) indicated that a doctor or<br />
other health pr<strong>of</strong>essional had diagnosed them with<br />
depression, anxiety or PTSD (see Table HS20, BRFSS,<br />
2011). Veteran responses differed only minimally by<br />
region, age, education or in<strong>com</strong>e. Samples sizes were<br />
too small for veterans 85 and older, female veterans,<br />
minority respondents, and those with less than a<br />
high school education. Data for these participants<br />
were not included in the analysis. The majority <strong>of</strong><br />
veterans responding to the survey were White (n =<br />
344), male (n = 378) and college graduates (n = 165).<br />
It is estimated that, <strong>of</strong> those living in the Southern<br />
Urban/Metropolitan region <strong>of</strong> the state, 10.1% had<br />
been diagnosed with depression, anxiety or PTSD.<br />
Similar percentages were noted for older veterans in<br />
the Northern Urban/Metropolitan (9%) region and<br />
the Rural/Frontier region (6.6%). The percentage<br />
<strong>of</strong> veterans ages 65-74 reporting a diagnosis <strong>of</strong><br />
depression, anxiety or PTSD (12.5%) was higher than<br />
reported by veterans 75-84 (7.3%).<br />
Mental Health & Suicide<br />
In addition to issues such as TBI, PTSD, depression<br />
and anxiety, the most <strong>com</strong>mon mental health issues<br />
facing <strong>Nevada</strong> veterans include bipolar disorder,<br />
schizoaffective disorder, and dementia (<strong>Nevada</strong><br />
Veterans Services Commission Quarterly, 2012).<br />
Untreated mental health problems and poor social<br />
support sometimes lead to suicide (Sundararaman,<br />
Panangala, & Lister, 2008).<br />
Sundararaman et al. (2008) estimated that veterans<br />
account for approximately 20% <strong>of</strong> all U.S. suicides.<br />
However, Bagalman (2012) writes, “no nationwide<br />
surveillance system exists for suicide among all<br />
veterans; therefore, the actual prevalence <strong>of</strong> suicide<br />
among veterans is not known” (para. 2). What is<br />
known is that, in 2011, the rate <strong>of</strong> suicide per 100,000<br />
among <strong>Nevada</strong> female veterans (26.7) was three<br />
times the rate among <strong>Nevada</strong> non-veteran females<br />
(8.4), and more than five times higher than the overall<br />
national rate for females (4.9; Ritch & Thompson,<br />
2012, p. 2) 5 . Similarly, the suicide rate for <strong>Nevada</strong> male<br />
veterans (48.3 per 100,000) is 61.5% higher than the<br />
rate in <strong>Nevada</strong> for non-veteran males (29.9%) and<br />
151% higher than the national rate <strong>of</strong> male suicide<br />
(19.2; Ritch & Thompson, 2012, p. 3).<br />
A preliminary 2011 report indicated that suicide<br />
accounted for the deaths <strong>of</strong> 43 <strong>Nevada</strong> veterans 65<br />
and older [see Table HS21, Office <strong>of</strong> Public Health<br />
Informatics: Electronic Death Registry (OPHIE),<br />
2011]. These deaths accounted for 0.9% <strong>of</strong> all veteran<br />
deaths during the same period. Of the suicides,<br />
51.1% occurred in the Southern Urban/Metropolitan<br />
area <strong>of</strong> the state, 25.6% in the Northern Urban/<br />
Metropolitan area, and 23.3% in the Rural/Frontier.<br />
Finally, the highest number <strong>of</strong> deaths occurred<br />
among veterans ages 75-84 (44.2%) followed by<br />
veterans 65-74 (39.5%) and those 85 and older<br />
(16.3%).<br />
The recent CDC: BRFSS survey asked <strong>Nevada</strong><br />
veterans if in the past 12 months they had thought<br />
<strong>of</strong> taking their own life (CDC: BRFSS, 2011). Of the<br />
veterans 65 and older who responded (n = 395),<br />
4.1% indicated that they had (see Table HS22).<br />
The majority <strong>of</strong> respondents were White (n = 343)<br />
and male (n = 378). Sample sizes were too small to<br />
measure participants 85 and older, females, or those<br />
with less than a high school education. Only minimal<br />
differences were found across education or in<strong>com</strong>e.<br />
Of the veterans who responded, more <strong>of</strong> those living<br />
in the Northern Urban/Metropolitan area <strong>of</strong> the state<br />
(5.7%) indicated that they had thought <strong>of</strong> suicide<br />
at least once in the past year than did those in the<br />
Southern Urban/Metropolitan area (4.4%) or the<br />
Rural/Frontier (1.3%; see Figure HS35).<br />
Fig. HS35: <strong>Nevada</strong> Veterans, Age 65+:<br />
Thought <strong>of</strong> Suicide in Past Year<br />
4.4%<br />
Southern Urban/Meto<br />
5.7%<br />
Northern<br />
Urban/Metropolitan<br />
(CDC: BRFSS, 2011)<br />
1.3%<br />
Rural/Frontier<br />
68<br />
5<br />
Source <strong>of</strong> data for Ritch & Thompson (2012): Office <strong>of</strong> Vital Records, aggregate 2008-2010
Even though 9.3% <strong>of</strong> the older <strong>Nevada</strong> veterans who<br />
responded to the BRFSS reported previous diagnosis<br />
<strong>of</strong> depression, anxiety or PTSD, only 1.5% reported<br />
a diagnosis <strong>of</strong> TBI. Slightly more than 4% reported<br />
thinking <strong>of</strong> suicide at least once in the year prior<br />
to the survey. Only 2% <strong>of</strong> older veterans received<br />
psychological or psychiatric counseling or treatment<br />
in the 12 months prior to the survey (see Table<br />
HS23). By region, 4.1% <strong>of</strong> veterans in the Northern<br />
Urban/Metropolitan region, 1.3% in the Southern<br />
Urban/Metropolitan region, and 2.2% in the Rural/<br />
Frontier region reported receiving counseling.<br />
Differences were minimal across age, education or<br />
in<strong>com</strong>e.<br />
Health Status<br />
69
Health Status<br />
Table HS1<br />
<strong>Nevada</strong> Counties, 2009: Life Expectancy by Gender<br />
Region (Averages) County Male Female<br />
Southern Urban/Metro 74.1 79.7<br />
Clark County 74.1 79.7<br />
Northern Urban/Metro 74.6 80.0<br />
Washoe County 75.2 80.3<br />
Carson City 74.0 79.6<br />
Rural/Frontier 74.5 80.0<br />
Douglas County 79.1 82.7<br />
Churchill County 75.1 80.1<br />
Elko County 75.0 79.7<br />
Lander County 74.9 80.3<br />
Eureka County 74.9 80.3<br />
White Pine County 74.9 80.3<br />
Pershing County 74.7 80.1<br />
Humboldt County 74.7 80.1<br />
Lyon County 74.5 79.9<br />
Storey County 74.5 79.9<br />
Lincoln County 74.1 79.7<br />
Esmeralda County 72.2 78.8<br />
Nye County 72.2 78.8<br />
Mineral County 72.2 78.8<br />
(<strong>Nevada</strong>LifeExpectancy.<strong>com</strong>, 2011)<br />
Table HS2<br />
United States: Leading Causes <strong>of</strong> Death by Age Group, 2010*<br />
Rank 45-64 Years <strong>of</strong> Age 65 Years and Older<br />
1 Cancer Heart Disease<br />
2 Heart Disease Cancer<br />
3 Accidents (Unintentional Injuries) Chronic Lower Respiratory Diseases<br />
4 Chronic Lower Respiratory Disease Cerebrovascular Diseases (Stroke)<br />
5 Chronic Liver Disease and Cirrhosis Alzheimer’s Disease<br />
6 Diabetes Mellitus Diabetes Mellitus<br />
7 Cerebrovascular Disease (Stroke) Influenza and Pneumonia<br />
8 Intentional Self-Harm (Suicide) Nephritis, Nephrotic Syndrome, Nephrosis<br />
9 Nephritis, Nephrotic Syndrome, Nephrosis Accidents (Unintentional Injuries)<br />
10 Septicemia Septicemia<br />
*Note: Data for 2010 is preliminary. (Murphy, Xu, & Kochanek, 2012)<br />
70
<strong>Nevada</strong>: Leading Causes <strong>of</strong> Death, 2009<br />
Table HS3<br />
Rank Cause <strong>of</strong> Death Number Percent<br />
1 Heart Disease 4,687 24.4%<br />
2 Cancer 4,461 23.2%<br />
3 Chronic Lower Respiratory Disease 1,244 6.5%<br />
4 Accidents (Unintentional Injury) 1,025 5.3%<br />
5 Cerebrovascular Diseases 859 4.5%<br />
6 Drug-Induced Causes 555 2.9%<br />
7 Influenza and Pneumonia 542 2.8%<br />
8 Intentional Self-Harm (Suicide) 505 2.6%<br />
9 Nephritis, Nephrotic Syndrome, and Nephrosis 446 2.3%<br />
10 Injury by Firearms 406 2.1%<br />
11 Diabetes Mellitus 377 2.0%<br />
12 Chronic Liver Disease and Cirrhosis 325 1.7%<br />
13 Alcohol-Induced Causes 319 1.7%<br />
14 Alzheimer’s Disease 312 1.6%<br />
15 Motor Vehicle Accidents 254 1.3%<br />
16 Assault (Homicide) 153 0.8%<br />
17 Essential Hypertension and Hypertensive Renal Disease 132 0.7%<br />
18 Parkinson’s Disease 115 0.6%<br />
19 HIV 63 0.3%<br />
Total Deaths in 2009 19,224 100.0%<br />
Health Status<br />
(Kochanek, Xu, Murphy, Minino, & Kung, 2011)<br />
Table HS4<br />
<strong>Nevada</strong> Behavioral Risk Factor Surveillance System: Survey Responses Regarding Heart Disease<br />
Has Been Told They Had a Heart Has Been Told They Had Angina<br />
Attack (Myocardial Infarction)<br />
or Coronary Heart Disease<br />
Year: % CI n % CI n<br />
2005 4.7% (3.7-5.7) 183 4.1% (3.2-5.0) 172<br />
2006 5.0% (4.1-5.9) 225 5.1% (4.2-6.0) 231<br />
2007 4.2% (3.2-5.2) 203 4.4% (3.6-5.2) 213<br />
2008 4.5% (3.7-5.3) 288 4.3% (3.5-5.1) 272<br />
2009 4.9% (4.1-5.8) 272 3.9% (3.1-4.6) 227<br />
2010 5.0% (4.0-5.9) 281 4.0% (3.2-4.7) 230<br />
% = Weighted Percentage, CI = Confidence Interval, n = Cell Size (Numerator), Use caution in interpreting cell sizes less than 50.<br />
(CDC: BRFSS, 2012)<br />
71
Health Status<br />
Table HS5<br />
<strong>Nevada</strong> Residents, Age 65 and Older, 2009: Newly Diagnosed Cancer Cases by Region, Gender, and Age**<br />
65-74 Years % 75-84 Years % 85+ Years % Total >65 yrs %<br />
Northern Urban/Metropolitan<br />
Female 274 44.1% 186 44.5% 73 57.0% 533 45.7%<br />
Male 347 55.9% 232 55.5% 55 43.0% 634 54.3%<br />
Total 621 418 128 1167<br />
Southern Urban/Metropolitan<br />
Female 986 39.4% 696 42.6% 222 49.0% 1904 41.5%<br />
Male 1,514 60.6% 939 57.4% 231 51.0% 2,684 58.5%<br />
Total 2,500 1,635 453 4,588<br />
Rural/Frontier<br />
Female 174 37.3% 120 39.3% 44 50.0% 338 39.3%<br />
Male 292 62.7% 185 60.7% 44 50.0% 521 60.7%<br />
Total 466 13.0% 305 12.9% 88 13.2% 859 13.0%<br />
<strong>Nevada</strong> Total<br />
Female 1,434 40.0% 1,002 42.5% 339 50.7% 2,775 42.0%<br />
Male 2,153 60.0% 1,356 57.5% 330 49.3% 3,839 58.0%<br />
Total 3,587 2,358 669 6,614<br />
** Note: Data are from the <strong>Nevada</strong> Central Cancer Registry. Invasive cases only.<br />
(<strong>Nevada</strong> State Health Division: Central Cancer Registry, 2012)<br />
72
Table HS6<br />
<strong>Nevada</strong> Residents, Age 65 and Older, 2009: Cancer-Related Deaths by Region, Gender, and Age**<br />
65-74 % 75-84 % 85+ % Total >65 yrs %<br />
Northern Urban/Metropolitan Area<br />
Female 97 44.7% 106 46.1% 65 53.7% 268 47.2%<br />
Male 120 55.3% 124 53.9% 56 46.3% 300 52.8%<br />
Total 217 230 121 568<br />
Southern Urban/Metropolitan Area<br />
Female 391 45.0% 359 45.8% 156 46.7% 906 45.6%<br />
Male 477 55.0% 424 54.2% 178 53.3% 1,079 54.4%<br />
Total 868 783 334 1,985<br />
Rural/Frontier<br />
Female 66 39.8% 78 41.9% 35 43.8% 179 41.4%<br />
Male 100 60.2% 108 58.1% 45 56.3% 253 58.6%<br />
Total 166 186 80 432<br />
<strong>Nevada</strong> Total<br />
Female 554 44.3% 543 45.3% 256 47.9% 1,353 45.3%<br />
Male 697 55.7% 656 54.7% 279 52.1% 1,632 54.7%<br />
Total 1,251 1,199 535 2,985<br />
Health Status<br />
**Note: <strong>Nevada</strong> Vital Statistics Records - Mortality<br />
(<strong>Nevada</strong> State Health Division: <strong>Nevada</strong> Vital Statistics Records, 2012)<br />
73
Table HS7<br />
Health Status<br />
<strong>Nevada</strong> Adults Age 65+: Self-Reported Health Status<br />
Demo- Grouping N* Excellent Very Good Good Fair Poor<br />
graphic % C.I. % C.I. % C.I. % C.I. % C.I.<br />
Region Statewide 1,662 14.0% (10.9- 24.0% (20.7- 31.9% (28.1- 21.8% (17.9- 8.4% (6.1-<br />
17.0) 27.4) 35.7) 25.6) 10.6)<br />
Southern Urban/Metro 592 14.2% (9.8- 23.5% (18.7- 31.4% (26.0- 22.4% (17.0- 8.6% (5.4-<br />
18.5) 28.3) 36.7) 27.8) 11.8)<br />
Northern Urban/Metro 605 13.5% (10.2- 26.4% (21.9- 34.0% (28.5- 18.6% (13.5- 7.6% (4.8-<br />
16.8) 30.9) 39.4) 23.7) 10.4)<br />
Rural/Frontier 465 13.7% (9.6- 23.1% (17.9- 31.4% (24.9- 23.5% (15.6- 8.4% (5.1-<br />
17.8) 28.3) 37.9) 31.3) 11.6)<br />
Age 65-74 1,024 12.8% (9.8- 24.6% (20.2- 33.5% (28.3- 21.8% (16.7- 7.3% (4.5-<br />
15.8) 28.9) 38.7) 27.0) 10.1)<br />
75-84 451 17.6% (9.7- 24.9% (18.0- 29.8% (23.3- 16.5% (11.4- 11.3% (6.4-<br />
25.4) 31.7) 36.3) 21.6) 16.2)<br />
85 and Older 129 10.4% (3.2- 15.9% (7.7- 27.5% (16.4- 39.2% (21.8- 7.0% (1.0-<br />
17.6) 24.1) 38.6) 56.6) 13.0)<br />
Sex Male 665 11.8% (8.4- 25.3% (20.0- 34.4% (28.5- 20.9% (15.9- 7.7% (4.3-<br />
15.2) 30.5) 40.4) 25.8) 11.0)<br />
Female 997 15.9% (11.1- 22.9% (18.6- 29.6% (24.8- 22.6% (16.8- 9.0% (6.0-<br />
20.7) 27.2) 34.4) 28.4) 12.0)<br />
Race White 1,436 16.2% (12.5- 25.4% (21.7- 31.2% (27.1- 18.5% (14.9- 8.8% (6.3-<br />
19.8) 29.1) 35.3) 22.2) 11.3)<br />
Black 47 ~ ~ ~ ~ ~ ~ ~ ~ ~ ~<br />
Other Race 94 5.0% (0.3- 13.4% (4.2- 35.9% (20.4- 40.0% (21.8- 5.7% (0.0-<br />
9.7) 22.5) 51.5) 58.2) 12.7)<br />
Hispanic 58 8.2% (0.0- 22.9% (6.4- 39.1% (20.5- 24.4% (4.7- 5.4% (0.0-<br />
17.5) 39.4) 57.7) 44.0) 13.6)<br />
Education Less than H.S. 120 3.6% (0.0- 14.9% (7.6- 39.8% (27.0- 34.5% (21.6- 7.2% (2.1-<br />
10.5) 22.1) 52.7) 47.5) 12.4)<br />
H.S. or G.E.D. 509 11.2% (7.5- 23.4% (17.0- 31.5% (25.0- 24.0% (17.2- 9.9% (6.0-<br />
14.9) 29.8) 37.9) 30.8) 13.8)<br />
Some Post H.S. 523 19.2% (12.0- 22.2% (17.0- 29.5% (23.6- 18.4% (12.8- 10.6% (5.5-<br />
26.4) 27.4) 35.5) 24.1) 15.7)<br />
College Graduate 506 21.3% (16.2- 34.1% (27.7- 30.0% (24.1- 11.3% (7.0- 3.2% (1.1-<br />
26.5) 40.5) 35.9) 15.7) 5.4)<br />
In<strong>com</strong>e < $15,000 164 6.4% (2.4- 15.7% (8.3- 29.8% (18.8- 35.2% (22.9- 12.9% (6.2-<br />
10.4) 23.3) 40.9) 47.5 19.5)<br />
$15,000 to $24,999 303 15.1% (6.9- 12.8% (8.3- 34.0% (24.8- 24.8% (14.8- 13.4% (6.6-<br />
23.2) 17.2) 43.2) 34.7) 20.1)<br />
$25,000 to $34,999 208 3.7% (1.4- 24.8% (14.4- 43.9% (31.5- 22.2% (9.6- 5.3% (1.8-<br />
6.0) 35.3) 56.3) 34.8) 8.9)<br />
$35,000 to $49,999 234 17.3% (9.7- 29.5% (20.4- 27.3% (16.2- 19.7% (9.5- 6.3% (2.0-<br />
24.8) 38.5) 38.4) 29.9) 10.7)<br />
$50,000 to $74,999 227 15.7% (9.8- 29.1% (20.9- 35.3% (25.8- 16.0% (7.7- 3.9% (0.2-<br />
21.6) 37.3) 44.8) 24.3) 7.6)<br />
$75,000+ 209 29.7% (20.2- 27.5% (18.5- 32.1% (21.7- 9.1% (3.9- 1.6% (0.2<br />
39.1) 36.6) 42.5) 14.4) 3.0)<br />
74<br />
*Sample sizes less than 50 are marked with ‘~’. Due to the small samples sizes, responses may not reliably represent the population; therefore,<br />
are not included.<br />
(CDC: BRFSS, 2011)
Table HS8<br />
<strong>Nevada</strong> Adults, Age 65 and Older: Disability Frequency by Region and Sex<br />
<strong>Nevada</strong> Southern Northern Rural,<br />
Urban/Metro Urban/Metro Frontier<br />
Total: 2,667,849 1,929,325 472,192 266,332<br />
Male:<br />
65 to 74 Years Total 97,265 65,440 17,469 14,356<br />
Percent with Disability 25.9% 24.3% 26.4% 32.5%<br />
75 Years & Older Total 56,065 37,655 10,271 8,139<br />
Percent with Disability 47.5% 45.6% 47.6% 56.2%<br />
Female Total:<br />
65 to 74 years Total 100,869 69,875 17,901 13,093<br />
Percent with Disability 23.1% 23.4% 19.7% 26.0%<br />
75 years & Older Total 69,736 47,223 13,960 8,553<br />
Percent with Disability 49.8% 51.0% 47.3% 47.6%<br />
Health Status<br />
(American Community Survey, 3-Year Estimates-B18101, 2012)<br />
75
Health Status<br />
Table HS9<br />
<strong>Nevada</strong> Adults, Age 65 and Older: Reported Limitations in Any Activities<br />
Demographic Grouping N* Yes No<br />
% C.I. % C.I.<br />
Region Statewide 1,519 37.4% (33.1-41.7) 62.6% (58.3-66.9)<br />
Southern Urban/Metro 531 36.0% (29.9-42.0) 64.0% (58.0-70.1)<br />
Northern Urban/Metro 560 41.3% (35.4-47.1) 58.7% (52.9-64.6)<br />
Rural/Frontier 428 38.9% (31.5-46.3) 61.1% (53.7-68.5)<br />
Age 65-74 947 34.9% (29.4-40.4) 65.1% (59.6-70.6)<br />
47-84 413 39.2% (31.7-46.8) 60.8% (53.2-68.3)<br />
85 and Older 106 53.1% (36.0-70.3) 46.9% (29.7-64.0)<br />
Sex Male 610 35.3% (29.2-41.4) 64.7% (58.6-70.8)<br />
Female 909 39.3% (33.2-45.4) 60.7% (54.6-66.8)<br />
Race White 1,313 39.5% (34.9-44.0) 60.5% (56.0-65.1)<br />
Black 42 ~ ~ ~ ~<br />
Other Race 85 44.1% (25.6-62.7) 55.9% (37.3-74.4)<br />
Hispanic 52 23.2% (8.0-38.5) 76.8% (61.5-92.0)<br />
Education Less than H.S. 109 33.2% (20.1-46.4) 66.8% (53.6-79.9)<br />
H.S. or G.E.D. 461 41.1% (33.6-48.5) 58.9% (51.5-66.4)<br />
Some Post H.S. 479 39.4% (32.0-46.7) 60.6% (53.3-68.0)<br />
College Graduate 466 34.1% (27.6-40.6) 65.9% (59.4-72.4)<br />
In<strong>com</strong>e < $15,000 153 41.3% (29.4-53.2) 58.7% (46.8-70.6)<br />
$15,000 to $24,999 284 47.0% (36.3-57.6) 53.0% (42.4-63.7)<br />
$25,000 to $34,999 193 28.0% (17.5-38.6) 72.0% (61.4-82.5)<br />
$35,000 to $49,999 211 40.2% (27.3-53.0) 59.8% (47.0-72.7)<br />
$50,000 to $74,999 204 39.3% (28.8-49.8) 60.7% (50.2-71.2)<br />
$75,000+ 200 30.3% (20.0-40.7) 69.7% (59.3-80.0)<br />
*Sample sizes less than 50 are marked with ‘~’. Due to the small samples sizes, responses may not reliably represent the population;<br />
therefore, are not included.<br />
(CDC: BRFSS, 2011)<br />
76
Table HS10<br />
<strong>Nevada</strong> Adults, Age 65 and Older Requiring Special Equipment<br />
Demographic Grouping N* Yes No<br />
% C.I. % C.I.<br />
Region Statewide 1,532 19.7% (16.1-23.2) 80.3% (76.8-83.9)<br />
Southern Urban Metro 539 19.3% (14.3-24.4) 80.7% (75.6-85.7)<br />
Northern Urban Metro 561 17.7% (13.5-21.9) 82.3% (78.1-86.5)<br />
Rural/Frontier 432 23.9% (17.9-29.9) 76.1% (70.1-82.1)<br />
Age 65-74 953 16.0% (11.6-20.4) 84.0% (79.6-88.4)<br />
75-84 417 25.5% (19.0-32.0) 74.5% (68.0-81.0)<br />
85 and Older 110 27.6% (9.7-45.4) 72.4% (54.6-90.3)<br />
Sex Male 612 13.2% (9.1-17.3) 86.8% (82.7-90.9)<br />
Female 920 25.3% (19.8-30.8) 74.7% (69.2-80.2)<br />
Race White 1,324 19.9% (16.1-23.6) 80.1% (76.4-83.9)<br />
Black 42 ~ ~ ~ ~<br />
Other Race 85 24.6% (6.5-42.8) 75.4% (57.2-93.5)<br />
Hispanic 54 9.1% (0.3-17.9) 90.9% (82.1-99.7)<br />
Education Less than H.S. 112 21.5% (10.5-32.5) 78.5% (67.5-89.5)<br />
H.S. or G.E.D. 463 21.1% (14.9-27.2) 78.9% (72.8-85.1)<br />
Some Post H.S. 484 23.1% (16.6-29.7) 76.9% (70.3-83.4)<br />
College Graduate 469 10.3% (6.4-14.2) 89.7% (85.8-93.6)<br />
In<strong>com</strong>e < $15,000 153 31.2% (19.9-42.6) 68.8% (57.4-80.1)<br />
$15,000 to $24,999 286 35.8% (25.0-46.7) 64.2% (53.3-75.0)<br />
$25,000 to $34,999 193 9.7% (4.8-14.6) 90.3% (85.4-95.2)<br />
$35,000 to $49,999 215 14.3% (7.2-21.3) 85.7% (78.7-92.8)<br />
$50,000 to $74,999 205 12.4% (4.6-20.3) 87.6% (79.7-95.4)<br />
$75,000+ 202 9.1% (2.4-15.8) 90.9% (84.2-97.6)<br />
Health Status<br />
*Sample sizes less than 50 are marked with ‘~’. Due to the small samples sizes, responses may not reliably represent the population;<br />
therefore, are not included.<br />
(CDC: BRFSS, 2011)<br />
77
Health Status<br />
78<br />
Table HS11<br />
How Many Days in the Past Month Did Poor Physical or Mental Health, Keep You From Doing Your Usual Activities?<br />
Demographic Grouping N* 1 to 10 Days 11 to 20 Days 21 to 30 Days None<br />
% C.I. % C.I. % C.I. % C.I.<br />
Region Statewide 1,642 8.4% (6.3-10.5) 3.3% (2.0-4.7) 8.2% (5.6-10.8) 80.0% (76.7-83.4)<br />
Southern Urban/Metro 585 8.5% (5.6-11.4) 3.0% (1.3-4.7) 8.6% (4.9-12.3) 79.9% (75.2-84.6)<br />
Northern Urban/Metro 594 8.2% (4.7-11.7) 5.3% (2.2-8.5) 8.7% (5.3-12.2) 77.7% (72.5-82.9)<br />
Rural/Frontier 463 8.2% (4.6-11.8) 2.3% (0.2-4.3) 5.9% (3.3-8.5) 83.6% (78.9-88.3)<br />
Age 65-74 1,015 10.1% (7.1-13.2) 3.4% (1.7-5.1) 6.9% (3.8-10.0) 79.6% (75.2-83.9)<br />
75-84 504 7.0% (3.7-10.2) 4.0% (1.3-6.7) 10.1% (5.5-14.7) 78.9% (73.1-84.7)<br />
85 and Older 123 1.5% (0.0-3.8) 0.0% .-. 10.3% (0.0-23.0) 88.1% (75.3-100)<br />
Sex Male 654 7.1% (4.0-10.3) 2.0% (0.7-3.3) 7.8% (3.8-11.8) 83.1% (78.1-88.0)<br />
Female 988 9.5% (6.7-12.4) 4.5% (2.2-6.7) 8.6% (5.3-11.9) 77.4% (72.8-82.0)<br />
Race White 1,421 8.5% (6.3-10.7) 3.5% (1.9-5.0) 8.2% (5.3-11.0) 79.9% (76.3-83.5)<br />
Black 46 ~ ~ ~ ~ ~ ~ ~ ~<br />
Other Race 91 5.6% (0.0-11.6) 1.0% (0.0-2.5) 19.4% (2.6-36.3) 74.0% (57.0-90.9)<br />
Hispanic 58 7.1% (0.0-16.3) 5.8% (0.0-12.1) 3.5% (0.0-10.6) 83.5% (70.5-96.6)<br />
Education Less than H.S. 119 5.8% (0.7-10.9) 2.4% (0.0-5.1) 5.3% (1.2-9.3) 86.5% (79.5-93.5)<br />
H.S. or G.E.D. 504 12.4% (7.5-17.3) 3.5% (1.5-5.5) 9.6% (4.5-14.7) 74.5% (67.8-81.1)<br />
Some Post H.S. 515 6.2% (3.8-8.6) 5.1% (1.7-8.6) 11.4% (5.7-17.1) 77.3% (70.8-83.8)<br />
College Graduate 500 8.1% (4.6-11.7) 1.3% (0.4-2.2) 3.9% (1.1-6.8) 86.6% (82.1-91.1)<br />
In<strong>com</strong>e < $15,000 157 8.7% (2.7-14.7) 9.8% (4.0-15.6) 12.9% (3.0-22.8) 68.6% (57.2-80.0)<br />
$15,000 to $24,999 303 9.3% (3.4-15.1) 1.6% (0.4-2.8) 13.3% (6.7-20.0) 75.8% (67.5-84.2)<br />
$25,000 to $34,999 211 8.9% (3.6-14.2) 5.0% (0.0-10.3) 2.7% (0.6-4.8) 83.4% (75.5-91.3)<br />
$35,000 to $49,999 229 5.1% (0.0-10.7) 0.3% (0.0-0.6) 8.9% (0.0-18.2) 85.7% (75.4-96.0)<br />
$50,000 to $74,999 224 11.1% (4.9-17.3) 3.7% (0.0-9.3) 3.7% (0.0-8.0) 81.5% (72.9-90.1)<br />
$75,000+ 209 8.5% (0.7-16.3) 1.5% (0.0-3.1) 1.5% (0.2-2.9) 88.5% (80.6-96.3)<br />
*Sample sizes less than 50 are marked with ‘~’. Due to the small samples sizes, responses may not reliably represent the population; therefore, are not included.<br />
(CDC: BRFSS, 2011)
Table HS12<br />
<strong>Nevada</strong> Adults, Age 65 and Older: Visited a Dentist, Dental Hygienist or Dental Clinic within the Past Year<br />
Demographic Grouping N* Yes No<br />
% C.I. % C.I.<br />
Region Statewide 1,272 62.1% (58.3-65.9) 37.9% (34.1-41.7)<br />
Southern Urban/Metro 417 62.3% (56.9-67.7) 37.7% (32.3-43.1)<br />
Northern Urban/Metro 491 69.5% (64.9-74.2) 30.5% (25.8-35.1)<br />
Rural/Frontier 364 50.1% (44.5-55.7) 49.9% (44.3-55.5)<br />
Age 65-74 767 62.7% (57.8-67.6) 37.3% (32.4-42.2)<br />
75-84 362 60.3% (53.4-67.3) 39.7% (32.7-46.6)<br />
85 and Older 100 65.3% (53.4-77.1) 34.7% (22.9-46.6)<br />
Sex Male 536 63.2% (57.8-68.6) 36.8% (31.4-42.2)<br />
Female 736 61.1% (55.8-66.4) 38.9% (33.6-44.2)<br />
Race White 1,090 63.5% (59.4-67.6) 36.5% (32.4-40.6)<br />
Black 32 ~ ~ ~ ~<br />
Other Race 81 46.1% (32.6-59.5) 53.9% (40.5-67.4)<br />
Hispanic 45 ~ ~ ~ ~<br />
Education Less than H.S. 109 37.7% (24.3-51.0) 62.3% (49.0-75.7)<br />
H.S. or G.E.D. 428 56.7% (50.2-63.3) 43.3% (36.7-49.8)<br />
Some Post H.S. 404 63.0% (56.0-70.0) 37.0% (30.0-44.0)<br />
College Graduate 327 76.5% (70.0-82.9) 23.5% (17.1-30.0)<br />
In<strong>com</strong>e < $15,000 119 42.3% (30.6-53.9) 57.7% (46.1-69.4)<br />
$15,000 to $24,999 246 47.6% (38.3-56.8) 52.4% (43.2-61.7)<br />
$25,000 to $34,999 152 59.0% (47.8-70.2) 41.0% (29.8-52.2)<br />
$35,000 to $49,999 206 68.6% (59.7-77.4) 31.4% (22.6-40.3)<br />
$50,000 to $74,999 136 67.8% (56.0-79.5) 32.2% (20.5-44.0)<br />
$75,000+ 147 82.7% (73.9-91.6) 17.3% (8.4-26.1)<br />
Health Status<br />
*Sample sizes less than 50 are marked with ‘~’. Due to the small samples sizes, responses may not reliably represent the population;<br />
therefore, are not included.<br />
(CDC: BRFSS, 2010)<br />
79
Health Status<br />
Table HS13<br />
<strong>Nevada</strong> Adults, Age 65 and Older: Had all Permanent Teeth Removed<br />
Demographic Grouping N* Yes No<br />
% C.I. % C.I.<br />
Region Statewide 1,234 17.2% (14.4-20.1) 82.8% (79.9-85.6)<br />
Southern Urban/Metro 410 16.3% (12.4-20.3) 83.7% (79.7-87.6)<br />
Northern Urban/Metro 471 18.0% (13.8-22.3) 82.0% (77.7-86.2)<br />
Rural/Frontier 353 20.3% (15.5-25.2) 79.7% (74.8-84.5)<br />
Age 65-74 753 15.4% (11.7-19.0) 84.6% (81.0-88.3)<br />
75-84 346 20.8% (15.3-26.3) 79.2% (73.7-84.7)<br />
85 and Older 91 18.7% (8.3-29.0) 81.3% (71.0-91.7)<br />
Sex Male 524 14.7% (11.0-18.5) 85.3% (81.5-89.0)<br />
Female 710 19.4% (15.2-23.6) 80.6% (76.4-84.8)<br />
Race White 1,063 16.8% (13.7-19.8) 83.2% (80.2-86.3)<br />
Black 31 ~ ~ ~ ~<br />
Other Race 72 19.3% (4.9-33.7) 80.7% (66.3-95.1)<br />
Hispanic 45 17.0% (3.3-30.7) 83.0% (69.3-96.7)<br />
Education Less than H.S. 104 35.5% (22.9-48.0) 64.5% (52.0-77.1)<br />
H.S. or G.E.D. 415 21.8% (16.2-27.4) 78.2% (72.6-83.8)<br />
Some Post H.S. 392 15.1% (10.6-19.6) 84.9% (80.4-89.4)<br />
College Graduate 319 7.4% (3.2-11.6) 92.6% (88.4-96.8)<br />
In<strong>com</strong>e < $15,000 116 33.4% (22.5-44.3) 66.6% (55.7-77.5)<br />
$15,000 to $24,999 241 22.8% (15.1-30.5) 77.2% (69.5-84.9)<br />
$25,000 to $34,999 148 14.9% (7.2-22.5) 85.1% (77.5-92.8)<br />
$35,000 to $49,999 201 14.4% (8.3-20.5) 85.6% (79.5-91.7)<br />
$50,000 to $74,999 130 12.3% (4.0-20.6) 87.7% (79.4-96.0)<br />
$75,000+ 145 7.7% (1.5-13.9) 92.3% (86.1-98.5)<br />
*Sample sizes less than 50 are marked with ‘~’. Due to the small samples sizes, responses may not reliably represent the population;<br />
therefore, are not included.<br />
(BRFSS, 2010)<br />
80
Table HS14<br />
<strong>Nevada</strong> Adults Age 65 and Older: Number <strong>of</strong> Poor Mental Health Days in 30 Days<br />
Demographic Grouping N* 1 to 10 Days 11 to 20 Days 21 to 30 Days None<br />
% C.I. % C.I. % C.I. % C.I.<br />
Region Statewide 1,632 14.2% (10.7-17.7) 3.3% (1.9-4.8) 6.1% (4.0-8.3) 76.3% (72.3-80.3)<br />
Southern Urban/Metro 582 14.8% (9.8-19.7) 3.7% (1.6-5.8) 6.6% (3.5-9.7) 74.9% (69.3-80.6)<br />
Northern Urban/Metro 591 13.6% (9.9-17.2) 3.8% (2.0-5.6) 5.6% (3.0-8.2) 77.0% (72.5-81.6)<br />
Rural/Frontier 459 12.7% (5.8-19.7) 1.2% (0.2-2.2) 4.4% (1.6-7.2) 81.7% (74.5-88.9)<br />
Age 65-74 1,008 16.4% (11.3-21.5) 2.5% (1.3-3.6) 6.2% (3.1-9.3) 74.9% (69.4-80.5)<br />
75-84 444 9.7% (5.4-14.0) 3.9% (0.8-7.0) 7.5% (3.8-11.2) 78.9% (73.0-84.9)<br />
85 and Older 125 14.4% (1.9-26.8) 8.3% (0.0-18.8) 0.6% (0.0-1.7) 76.8% (61.8-91.9)<br />
Sex Male 652 7.6% (4.4-10.8) 3.5% (1.0-6.0) 6.0% (2.3-9.7) 82.9% (77.8-88.0)<br />
Female 980 20.1% (14.4-25.8) 3.2% (1.6-4.8) 6.2% (3.7-8.6) 70.6% (64.7-76.4)<br />
Race White 1,414 10.6% (8.1-13.0) 3.2% (1.8-4.7) 7.3% (4.6-10.0) 78.9% (75.2-82.5)<br />
Black 47 ~ ~ ~ ~ ~ ~ ~ ~<br />
Other Race 89 18.9% (1.7-36.1) 1.9% (0.0-4.4) 1.3% (0.0-2.8) 77.9% (60.7-95.2)<br />
Hispanic 57 33.6% (10.9-56.3) 4.6% (0.0-12.2) 0.3% (0.0-0.7) 61.4% (38.9-84.0)<br />
Education Less than H.S. 113 18.3% (4.7-31.9) 4.8% (0.0-9.7) 6.1% (1.5-10.7) 70.8% (56.8-84.8)<br />
H.S. or G.E.D. 504 13.4% (8.8-18.1) 2.6% (0.8-4.5) 7.1% (2.0-12.2) 76.8% (70.3-83.3)<br />
Some Post H.S. 517 15.9% (10.2-21.7) 4.3% (1.3-7.2) 6.5% (3.1-9.8) 73.3% (66.8-79.9)<br />
College Graduate 495 8.8% (5.6-12.0) 1.6% (0.3-2.8) 3.8% (2.1-5.6) 85.8% (82.0-89.6)<br />
In<strong>com</strong>e < $15,000 161 22.3% (10.2-34.4) 5.7% (1.0-10.4) 6.8% (2.0-11.5) 65.2% (53.0-77.4)<br />
$15,000 to $24,999 298 13.8% (7.7-19.9) 5.3% (0.1-10.4) 7.7% (2.7-12.7) 73.2% (64.9-81.4)<br />
$25,000 to $34,999 208 18.8% (4.6-33.1) 2.7% (0.7-4.7) 1.2% (0.0-2.4) 77.3% (63.1-91.4)<br />
$35,000 to $49,999 230 10.3% (1.4-19.2) 1.8% (0.0-4.0) 5.7% (1.5-10.0) 82.2% (72.7-91.7)<br />
$50,000 to $74,999 223 14.4% (6.7-22.2) 2.1% (0.0-4.5) 1.0% (0.0-2.0) 82.5% (74.5-90.5)<br />
$75,000+ 205 6.4% (2.4-10.5) 1.2% (0.0-2.4) 2.5% (0.4-4.7) 89.8% (85.0-94.6)<br />
*Sample sizes less than 50 are marked with ‘~’. Due to the small samples sizes, responses may not reliably represent the population; therefore, are not included.<br />
(CDC: BRFSS, 2011)<br />
Health Status<br />
81
Health Status<br />
82<br />
Table HS15<br />
<strong>Nevada</strong> Adults Age 65 and Older: Number <strong>of</strong> Days in Past Two Weeks that Felt Down, Depressed, or Hopeless<br />
Demographic Grouping N* 1 to 10 Days 11 to 20 Days 21 to 30 Days None<br />
% C.I. % C.I. % C.I. % C.I.<br />
Region Statewide 1,386 13.9% (10.38-17.44) 3.5% (1.79- 5.24) 1.8% (0.93- 2.62) 80.8% (76.95-84.65)<br />
Southern Urban/Metro 470 13.6% ( 8.58-18.55) 4.3% (1.79- 6.90) 1.2% (0.19- 2.22) 80.9% (75.43-86.35)<br />
Northern Urban/Metro 430 18.9% (12.87-24.94) 2.4% (0.60- 4.15) 3.1% (0.70- 5.51) 75.6% (69.37-81.85)<br />
Rural/Frontier 486 10.4% (6.23-14.54) 1.4% (0.45- 2.32) 2.7% (0.86- 4.60) 85.5% (80.97-90.04)<br />
Age 65-74 852 14.1% (9.88-18.31) 4.5% (1.89- 7.02) 1.4% (0.67- 2.17) 80.0% (75.25-84.82)<br />
75-84 434 9.5% (5.10-13.85) 2.6% (0.11- 5.17) 2.8% (0.61- 4.95) 85.1% (79.86-90.35)<br />
85 and Older 100 31.4% (10.68-52.05) 0.2% (0.00- 0.49) 0.2% (0.00- 0.57) 68.3% (47.65-88.92)<br />
Sex Male 548 10.8% (6.17-15.46) 2.1% (0.15- 4.03) 1.9% (0.37- 3.43) 85.2% (80.11-90.27)<br />
Female 838 16.7% (11.41-21.89) 4.8% (2.02- 7.53) 1.7% (0.81- 2.52) 76.9% (71.21-82.60)<br />
Race White 1,214 14.5% (10.5-18.5) 2.8% (1.3-4.3) 2.2% (1.1-3.2) 80.5% (76.3-84.7)<br />
Black 34 ~ ~ ~ ~ ~ ~ ~ ~<br />
Other Race 75 12.4% (2.1-22.7) 0.8% (0.0-2.0) 0.7% (0.0-1.8) 86.1% (75.5-96.7)<br />
Hispanic 41 ~ ~ ~ ~ ~ ~ ~ ~<br />
Education Less than H.S. 95 22.4% (8.87-35.92) 3.9% (0.00- 9.07) 1.0% (0.00- 2.57) 72.7% (58.63-86.78)<br />
H.S. or G.E.D. 418 13.9% (8.06-19.81) 3.8% (0.55- 6.98) 1.4% (0.00- 2.74) 81.0% (74.43-87.47)<br />
Some Post H.S. 445 11.6% (6.57-16.62) 4.5% (1.30- 7.63) 2.6% (0.71- 4.56) 81.3% (75.39-87.21)<br />
College Graduate 427 9.1% (5.80-12.38) 1.1% (0.07- 2.11) 1.9% (0.20- 3.50) 88.0% (84.20-91.73)<br />
In<strong>com</strong>e < $15,000 139 16.7% (7.41-26.08) 10.1% (1.06-19.11) 2.9% (0.00- 6.79) 70.3% (58.07-82.48)<br />
$15,000 to $24,999 261 14.9% (5.21-24.48) 5.0% (0.00-10.10) 3.3% (1.26- 5.34) 76.8% (66.57-87.06)<br />
$25,000 to $34,999 172 11.8% (5.02-18.51) 1.7% (0.06- 3.31) 0.5% (0.00- 1.11) 86.1% (79.02-93.14)<br />
$35,000 to $49,999 195 17.7% (4.98-30.32) 1.0% (0.00- 2.51) 0.5% (0.00- 1.39) 80.9% (68.25-93.48)<br />
$50,000 to $74,999 190 9.6% (2.60-16.57) 2.1% (0.00- 4.75) 0.2% (0.00- 0.49) 88.1% (80.79-95.48)<br />
$75,000+ 184 11.5% (2.56-20.51) 1.2% (0.00- 3.11) 1.4% (0.00- 4.16) 85.8% (76.41-95.24)<br />
*Sample sizes less than 50 are marked with ‘~’. Due to the small samples sizes, responses may not reliably represent the population; therefore, are not included.<br />
(CDC: BRFSS, 2011)
Table HS16<br />
<strong>Nevada</strong> Adults Age 65 and Older: Currently Receiving Medication or Treatment for Mental Health or<br />
Emotional Problem<br />
Demographic Grouping N* Yes No<br />
% C.I. % C.I.<br />
Region Statewide 1,395 7.6% (5.2-10.1) 92.4% (89.9-94.8)<br />
Southern Urban/Metro 474 7.3% (3.8-10.8) 92.7% (89.2-96.2)<br />
Northern Urban/Metro 527 8.9% (6.0-11.7) 91.1% (88.3-94.0)<br />
Rural/Frontier 394 7.4% (3.4-11.4) 92.6% (88.6-96.6)<br />
Age 65-74 854 10.8% (6.8-14.7) 89.2% (85.3-93.2)<br />
75-84 391 3.1% (1.2-5.0) 96.9% (95.0-98.8)<br />
85 and Older 100 4.9% (0.0-10.0) 95.1% (90.0-100.0)<br />
Sex Male 553 5.8% (1.8-9.8) 94.2% (90.2-98.2)<br />
Female 842 9.2% (6.1-12.3) 90.8% (87.7-93.9)<br />
Race White 1,223 9.2% (6.1-12.2) 90.8% (87.8-93.9)<br />
Black 33 ~ ~ ~ ~<br />
Other Race 75 3.7% (0.0-8.1) 96.3% (91.9-100.0)<br />
Hispanic 41 ~ ~ ~ ~<br />
Education Less than H.S. 96 6.4% (0.1-12.7) 93.6% (87.3-99.9)<br />
H.S. or G.E.D. 418 9.8% (4.2-15.4) 90.2% (84.6-95.8)<br />
Some Post H.S. 447 7.3% (3.7-10.9) 92.7% (89.1-96.3)<br />
College Graduate 432 5.7% (3.6-7.8) 94.3% (92.2-96.4)<br />
In<strong>com</strong>e < $15,000 140 7.1% (3.0-11.3) 92.9% (88.7-97.0)<br />
$15,000 to $24,999 262 13.3% (6.1-20.5) 86.7% (79.5-93.9)<br />
$25,000 to $34,999 174 6.1% (2.0-10.2) 93.9% (89.8-98.0)<br />
$35,000 to $49,999 198 5.7% (1.4-10.0) 94.3% (90.0-98.6)<br />
$50,000 to $74,999 191 5.9% (1.8-10.1) 94.1% (89.9-98.2)<br />
$75,000+ 182 2.7% (0.9-4.4) 97.3% (95.6-99.1)<br />
Health Status<br />
(CDC: BRFSS, 2011)<br />
83
Health Status<br />
Table HS17<br />
Preliminary Report: Death County by Region <strong>of</strong> Residence, Cause <strong>of</strong> Death, and Age Group, <strong>Nevada</strong><br />
Residents, 2011*<br />
Region <strong>of</strong> Residence Cause <strong>of</strong> Death Age Group<br />
65-74 75-84 85+ Total<br />
Northern Urban/Metropolitan Falls^ 4 12 30 46<br />
Motor Vehicle Accidents 4 4 0 8<br />
Suicides 13 4 1 18<br />
Total Deaths 728 877 1,103 2,708<br />
Southern Urban/Metropolitan Falls^ 16 46 46 108<br />
Motor Vehicle Accidents 12 9 8 29<br />
Suicides 32 18 7 57<br />
Total Deaths 2,692 3,414 2,884 8,990<br />
Rural & Frontier Falls^ 4 5 9 18<br />
Motor Vehicle Accidents 2 2 0 4<br />
Suicides 5 9 2 16<br />
Total Deaths 567 657 595 1,819<br />
Total Falls^ 24 63 85 172<br />
Motor Vehicle Accidents 18 15 8 41<br />
Suicides 50 31 10 91<br />
Total Deaths 3,988 4,949 4,582 13,519<br />
*Data is not final and is subject to changes.<br />
^Falls includes underlying cause <strong>of</strong> death as well and included the following ICD-10 codes: W00-W19.<br />
(CDC: BRFSS, 2011)<br />
84
Table HS18<br />
<strong>Nevada</strong> Veterans, Age 65 and Older: Served in a Combat or War Zone<br />
Demographic Grouping N* Yes No<br />
% C.I. % C.I.<br />
Region Statewide 394 51.0% (42.9-59.0) 49.0% (41.0-57.1)<br />
Southern Urban/Metro 136 49.9% (38.0-61.8) 50.1% (38.2-62.0)<br />
Northern Urban/Metro 137 48.9% (36.9-60.9) 51.1% (39.1-63.1)<br />
Rural/Frontier 121 56.9% (44.9-69.0) 43.1% (31.0-55.1)<br />
Age 65-74 208 52.3% (40.6-63.9) 47.7% (36.1-59.4)<br />
75-84 154 41.2% (29.8-52.6) 58.8% (47.4-70.2)<br />
85 and Older 32 ~ ~ ~ ~<br />
Sex Male 377 51.3% (43.1-59.4) 48.7% (40.6-56.9)<br />
Female 17 ~ ~ ~ ~<br />
Race White 343 48.7% (39.9-57.5) 51.3% (42.5-60.1)<br />
Black 11 ~ ~ ~ ~<br />
Other Race 16 ~ ~ ~ ~<br />
Hispanic 14 ~ ~ ~ ~<br />
Education Less than H.S. 21 ~ ~ ~ ~<br />
H.S. or G.E.D. 96 62.7% (49.3-76.1) 37.3% (23.9-50.7)<br />
Some Post H.S. 111 47.6% (33.8-61.4) 52.4% (38.6-66.2)<br />
College Graduate 165 43.6% (32.8-54.4) 56.4% (45.6-67.2)<br />
In<strong>com</strong>e < $25,000 74 57.9% (41.7-74.2) 42.1% (25.8-58.3)<br />
$25,000 to $34,999 50 58.0% (35.1-81.0) 42.0% (19.0-64.9)<br />
$35,000 to $49,999 65 65.5% (47.9-83.2) 34.5% (16.8-52.1)<br />
$50,000 to $74,999 75 48.6% (31.9-65.3) 51.4% (34.7-68.1)<br />
$75,000+ 70 35.5% (19.3-51.8) 64.5% (48.2-80.7)<br />
Health Status<br />
*Sample sizes less than 50 are marked with ‘~’.<br />
**Percentages are weighted, and may not be a direct reflection <strong>of</strong> the sample sizes.<br />
(CDC: BRFSS, 2011)<br />
85
Health Status<br />
Table HS19<br />
<strong>Nevada</strong> Veterans, Age 65 and Older: Diagnosed with TBI<br />
Demographic Grouping N* Yes No<br />
% C.I. % C.I.<br />
Region Statewide 395 1.5% (0.5-2.4) 98.5% (97.6-99.5)<br />
Southern Urban/Metro 137 0.3% (0.0-1.0) 99.7% (99.0-100.0)<br />
Northern Urban/Metro 137 2.4% (0.0-5.2) 97.6% (94.8-100.0)<br />
Rural/Frontier 121 4.4% (0.6-8.2) 95.6% (91.8-99.4)<br />
Age 65-74 208 2.0% (0.4-3.5) 98.0% (96.5-99.6)<br />
75-84 155 1.2% (0.0-2.7) 98.8% (97.3-100.0)<br />
85 and Older 32 ~ ~ ~ ~<br />
Sex Male 378 1.5% (0.5-2.5) 98.5% (97.5-99.5)<br />
Female 17 ~ ~ ~ ~<br />
Race White 344 1.2% (0.2-2.1) 98.8% (97.9-99.8)<br />
Black 12 ~ ~ ~ ~<br />
Other Race 15 ~ ~ ~ ~<br />
Hispanic 14 ~ ~ ~ ~<br />
Education Less than H.S. 21 ~ ~ ~ ~<br />
H.S. or G.E.D. 98 1.1% (0.0-2.4) 98.9% (97.6-100.0)<br />
Some Post H.S. 110 1.3% (0.0-2.8) 98.7% (97.2-100.0)<br />
College Graduate 165 2.2% (0.0-4.7) 97.8% (95.3-100.0)<br />
In<strong>com</strong>e < $25,000 75 1.5% (0.0-3.4) 98.5% (96.6-100.0)<br />
$25,000 to $34,999 50 2.8% (0.0-6.9) 97.2% (93.1-100.0)<br />
$35,000 to $49,999 65 0.3% (0.0-0.8) 99.7% (99.2-100.0)<br />
$50,000 to $74,999 75 2.3% (0.0-5.7) 97.7% (94.3-100.0)<br />
$75,000+ 70 2.1% (0.0-4.7) 97.9% (95.3-100.0)<br />
*Sample sizes less than 50 are marked with ‘~’.<br />
**Percentages are weighted, and may not be a direct reflection <strong>of</strong> the sample size.<br />
(CDC: BRFSS, 2011)<br />
86
Table HS20<br />
<strong>Nevada</strong> Veterans, Age 65 and Older: Diagnosed with Depression, Anxiety, or PTSD<br />
Demographic Grouping N* Yes No<br />
% C.I. % C.I.<br />
Region <strong>Nevada</strong> 395 9.3% (4.1-14.4) 90.7% (85.6-95.9)<br />
Southern Urban/Metro 136 10.1% (2.5-17.7) 89.9% (82.3-97.5)<br />
Northern Urban/Metro 137 9.0% (0.0-19.0) 91.0% (81.0-100.0)<br />
Rural/Frontier 122 6.6% (2.3-10.8) 93.4% (89.2-97.7)<br />
Age 65-74 209 12.5% (3.6-21.4) 87.5% (78.6-96.4)<br />
75-84 155 7.3% (0.8-13.7) 92.7% (86.3-99.2)<br />
85 and Older 31 ~ ~ ~ ~<br />
Sex Male 378 8.6% (3.4-13.8) 91.4% (86.2-96.6)<br />
Female 17 ~ ~ ~ ~<br />
Race White 344 8.9% (3.3-14.5) 91.1% (85.5-96.7)<br />
Black 12 ~ ~ ~ ~<br />
Other Race 15 ~ ~ ~ ~<br />
Hispanic 14 ~ ~ ~ ~<br />
Education Less than H.S. 20 ~ ~ ~ ~<br />
H.S. or G.E.D. 98 8.8% (0.0-17.8) 91.2% (82.2-100.0)<br />
Some Post H.S. 111 16.8% (4.0-29.6) 83.2% (70.4-96.0)<br />
College Graduate 165 4.3% (1.3-7.3) 95.7% (92.7-98.7)<br />
In<strong>com</strong>e < $25,000 74 0.6% (0.0-1.4) 99.4% (98.6-100.0)<br />
$25,000 to $34,999 50 17.6% (0.0-36.3) 82.4% (63.7-100.0)<br />
$35,000 to $49,999 65 9.5% (0.0-19.5) 90.5% (80.5-100.0)<br />
$50,000 to $74,999 75 5.9% (1.0-10.8) 94.1% (89.2-99.0)<br />
$75,000+ 70 3.8% (0.4-7.3) 96.2% (92.7-99.6)<br />
Health Status<br />
*Sample sizes less than 50 are marked with ‘~’. Due to the small samples sizes, responses may not reliably represent the population;<br />
therefore, are not included.<br />
(CDC: BRFSS, 2011).<br />
87
Health Status<br />
Table HS21<br />
<strong>Nevada</strong> Veterans, Age 65 and Older, 2011: Death by Suicide*<br />
Region <strong>of</strong> Residence Cause <strong>of</strong> Death Age Group<br />
65-74 75-84 85+ Total<br />
Northern Urban/Metropolitan Suicides 6 4 1 11<br />
Total Deaths 223 340 347 910<br />
Southern Urban/Metropolitan Suicides 9 8 5 22<br />
Total Deaths 815 1,242 893 2,950<br />
Rural/Frontier Suicides 2 7 1 10<br />
Total Deaths 210 259 206 675<br />
Total Suicides 17 19 7 43<br />
Total Deaths 1,249 1,841 1,446 4,536<br />
*Data is not final and is subject to changes.<br />
(OPHIE, 2011)<br />
88
Table HS22<br />
<strong>Nevada</strong> Veterans, Age 65 and Older: Thought <strong>of</strong> Suicide in the Past 12 Months<br />
Demographic Grouping N* Yes No<br />
% C.I. % C.I.<br />
Region Statewide 395 4.1% (0.5-7.7) 95.9% (92.3-99.5)<br />
Southern Urban/Metro 136 4.4% (0.0-9.1) 95.6% (90.9-100.0)<br />
Northern Urban/Metro 137 5.7% (0.0-15.6) 94.3% (84.4-100.0)<br />
Rural/Frontier 122 1.3% (0.0-3.1) 98.7% (96.9-100.0)<br />
Age 65-74 209 5.3% (0.0-11.8) 94.7% (88.2-100.0)<br />
75-84 154 2.7% (0.0-6.2) 97.3% (93.8-100.0)<br />
85+ 32 ~ ~ ~ ~<br />
Sex Male 378 3.5% (0.1-7.0) 96.5% (93.0-99.9)<br />
Female 17 ~ ~ ~ ~<br />
Race White 343 4.3% (0.1-8.5) 95.7% (91.5-99.9)<br />
Black 12 ~ ~ ~ ~<br />
Other Race 16 ~ ~ ~ ~<br />
Hispanic 14 ~ ~ ~ ~<br />
Education Less than H.S. 21 ~ ~ ~ ~<br />
H.S. or G.E.D. 98 3.2% (0.0-9.3) 96.8% (90.7-100.0)<br />
Some Post H.S. 111 3.5% (0.0-8.0) 96.5% (92.0-100.0)<br />
College Graduate 164 1.2% (0.0-2.8) 98.8% (97.2-100.0)<br />
In<strong>com</strong>e < $25,000 75 3.0% (0.0-7.1) 97.0% (92.9-100.0)<br />
$25,000 to $34,999 50 7.1% (0.0-20.8) 92.9% (79.2-100.0)<br />
$35,000 to $49,999 65 4.1% (0.0-12.3) 95.9% (87.7-100.0)<br />
$50,000 to $74,999 74 0.8% (0.0-2.6) 99.2% (97.4-100.0)<br />
$75,000+ 70 9.4% (0.0-27.3) 90.6% (72.7-100.0)<br />
Health Status<br />
*Sample sizes less than 50 are marked with ‘~’. Due to the small samples sizes, responses may not reliably represent the population;<br />
therefore, are not included.<br />
89
Health Status<br />
Table HS23<br />
<strong>Nevada</strong> Veterans Age 65 and Older: Received Psychological or Psychiatric Counseling, or Treatment in<br />
Past 12 Months<br />
Demographic Grouping N* Yes No<br />
% C.I. % C.I.<br />
Region Statewide 396 2.0% (0.8-3.2) 98.0% (96.8-99.2)<br />
Southern Urban/Metro 137 1.3% (0.0-2.7) 98.7% (97.3-100.0)<br />
Northern Urban/Metro 137 4.1% (0.6-7.6) 95.9% (92.4-99.4)<br />
Rural/Frontier 122 2.2% (0.0-4.6) 97.8% (95.4-100.0)<br />
Age 65-74 209 3.4% (1.1-5.7) 96.6% (94.3-98.9)<br />
75-84 155 0.4% (0.0-0.9) 99.6% (99.1-100.0)<br />
85 and Older 32 ~ ~ ~ ~<br />
Sex Male 379 1.9% (0.7-3.1) 98.1% (96.9-99.3)<br />
Female 17 ~ ~ ~ ~<br />
Race White 344 1.5% (0.5-2.6) 98.5% (97.4-99.5)<br />
Black 12 ~ ~ ~ ~<br />
Other Race 16 ~ ~ ~ ~<br />
Hispanic 14 ~ ~ ~ ~<br />
Education Less than H.S. 21 ~ ~ ~ ~<br />
H.S. or G.E.D. 98 1.0% (0.0-3.1) 99.0% (96.9-100.0)<br />
Some Post H.S. 111 0.9% (0.0-2.2) 99.1% (97.8-100.0)<br />
College Graduate 165 4.9% (1.6-8.2) 95.1% (91.8-98.4)<br />
In<strong>com</strong>e < $25,000 75 1.2% (0.0-2.9) 98.8% (97.1-100.0)<br />
$25,000 to $34,999 50 0.0% 0 100.0% (100.0-100.0)<br />
$35,000 to $49,999 65 1.1% (0.0-3.0) 98.9% (97.0-100.0)<br />
$50,000 to $74,999 75 4.9% (0.3-9.5) 95.1% (90.5-99.7)<br />
$75,000+ 70 2.3% (0.0-4.6) 97.7% (95.4-100.0)<br />
*Sample sizes less than 50 are marked with ‘~’. Due to the small samples sizes, responses may not reliably represent the population; therefore,<br />
are not included.<br />
90
Risk and protective factors<br />
influence health status and<br />
choices <strong>of</strong> behavior. In older<br />
adults, possible risk factors include<br />
the experience <strong>of</strong> loss and isolation,<br />
changes in self- and social-identity<br />
due to retirement, declines in physical<br />
health, changes in self-efficacy, and<br />
dwindling financial resources.<br />
Older adults faced with these risks are<br />
more likely to participate in unhealthy<br />
behaviors such as substance use or<br />
abuse, excessive gambling, or other<br />
risky behaviors. Declines in physical<br />
health may result in decreased<br />
physical activity, which reduces<br />
fitness and raises the risk <strong>of</strong> falls<br />
and fall-related injuries. Vision and<br />
hearing loss may increase the risk <strong>of</strong><br />
motor vehicle accidents. Retirement<br />
with in<strong>com</strong>e reduction may result<br />
in changes to dietary quality, which<br />
can lead to unhealthy increases in<br />
weight. With less disposable in<strong>com</strong>e,<br />
an older adult may opt to skip annual<br />
medical examinations, vaccinations or<br />
screening for early detection <strong>of</strong> cancer.<br />
Alternatively, protective factors can<br />
reduce the risk <strong>of</strong> negative behaviors<br />
and help older adults age successfully.<br />
Potential protective factors include<br />
social and family support, religious or<br />
spiritual beliefs, and access to health<br />
care pr<strong>of</strong>essionals and caregivers<br />
trained in geriatrics and gerontology.<br />
Protective factors may also include<br />
access to transportation and other<br />
supportive services such as meals-onwheels<br />
programs, case management,<br />
personal care, homemaker services<br />
and adult day care.<br />
Authors: Angela D. Broadus, Shawna Dale Koehler Larsen, Julie Kilgore<br />
Content Reviewers: Jay Kvam, Jill Berntson, Betty Dodson, Caleb Cage<br />
Health Risks &<br />
Behaviors<br />
Tobacco Use<br />
Alcohol Use<br />
Illicit Drug Use<br />
Gambling & Other Process Addictions<br />
Dietary Quality<br />
Physical Activity<br />
Overweight & Obesity<br />
Cholesterol & Blood Pressure<br />
Influenza & Pneumonia Vaccinations<br />
Cancer Screenings<br />
HIV/AIDS & Other Sexually Transmitted Diseases<br />
Falls & Fall-Related Injuries<br />
Elder Abuse, Neglect & Exploitation<br />
Motor Vehicle Accidents<br />
Veterans
Health Risks & Behaviors<br />
This section addresses the following health risks<br />
and behaviors for older adults:<br />
• tobacco and alcohol use<br />
• dietary quality<br />
• physical activity<br />
• overweight and obesity<br />
• cholesterol and blood pressure<br />
• influenza and pneumonia vaccinations<br />
• cancer screenings<br />
• HIV/AIDS<br />
• falls and fall-related injuries<br />
• elder abuse, neglect and exploitation<br />
• motor vehicle accidents<br />
New to the report since the Elders Count <strong>Nevada</strong><br />
(2009) is information about illicit drug use, gambling<br />
and other process addictions in older adults plus<br />
a section on health risks and behaviors in older<br />
<strong>Nevada</strong> veterans.<br />
Highlights 1<br />
Tobacco Use<br />
• <strong>Nevada</strong> tobacco use declined from 28.2% in<br />
1996 to 21.3% in 2010.<br />
• <strong>Nevada</strong> continues to rank in the top third <strong>of</strong><br />
states for tobacco use and is the western state<br />
with the most prevalent use <strong>of</strong> tobacco.<br />
Alcohol Use<br />
• The rate <strong>of</strong> binge drinking among <strong>Nevada</strong> older<br />
adults (6.1%) is lower than the national rate<br />
(7.6%).<br />
• The rate <strong>of</strong> heavy alcohol use among <strong>Nevada</strong><br />
older adults (4.8%) is higher than the national<br />
rate (1.7%).<br />
Illicit Drug Use<br />
• In 2009, drug-induced death ranked as the<br />
sixth-leading cause <strong>of</strong> death in <strong>Nevada</strong>.<br />
• In 2010, <strong>Nevada</strong> ranked fourth from the bottom<br />
for drug-poisoning deaths. The state’s ageadjusted<br />
death rate: 20.7 per 100,000.<br />
• <strong>Nevada</strong> ranked in the top fifth <strong>of</strong> states for<br />
percentage <strong>of</strong> adults 26 and older who needed<br />
but did not receive treatment for illicit drug use<br />
in the past year.<br />
• The percentage <strong>of</strong> <strong>Nevada</strong>ns in adults age 26<br />
and older who reported using marijuana in<br />
the past year (8.2%) is slightly higher than the<br />
national average (7.9%). <strong>Nevada</strong> ranks in the<br />
top fifth for states with highest use.<br />
Gambling & Other Process Addictions<br />
• <strong>Nevada</strong> has the highest number <strong>of</strong> adults (an<br />
estimated 68,000) meeting diagnostic criteria for<br />
pathological gambling.<br />
Dietary Quality<br />
• An estimated 47.2% <strong>of</strong> <strong>Nevada</strong>ns <strong>com</strong>pleting<br />
the Grants Management Advisory Committee<br />
(GMAC) survey in early 2012 indicated that they<br />
had needed assistance in locating or accessing<br />
food in the 12 months prior to the survey.<br />
• Service providers reported that 68.1% <strong>of</strong> their<br />
clients had needed assistance in locating or<br />
accessing food during the same time.<br />
• Fifty-nine percent <strong>of</strong> service providers cited<br />
inadequate in<strong>com</strong>e as the primary factor<br />
stopping clients from obtaining adequate food.<br />
Other factors included cost <strong>of</strong> food (21.6%) and<br />
inadequate in<strong>com</strong>e (15.2%).<br />
Physical Activity<br />
• Statewide, an estimated 17.8% <strong>of</strong> older <strong>Nevada</strong><br />
adults met second-level federal guidelines <strong>of</strong><br />
doing either 300 minutes a week <strong>of</strong> moderateintensity<br />
exercise or 150 minutes a week <strong>of</strong><br />
vigorous-intensity aerobic exercise and str<strong>eng</strong>th<br />
training two or more days per week.<br />
• The lowest percentage <strong>of</strong> survey respondents<br />
meeting these guidelines for physical activity<br />
were found in the Rural/Frontier region (10.7%)<br />
while the largest percentage (21.2%) resided in<br />
the Northern Urban/Metropolitan area.<br />
• An estimated 24.8% <strong>of</strong> older <strong>Nevada</strong> males met<br />
the federal guidelines for physical activity, while<br />
11.6% <strong>of</strong> older <strong>Nevada</strong> females met the criteria.<br />
92<br />
1<br />
Percentages for Behavioral Risk Factor Surveillance System (BRFSS) data are based on older adults who responded to the survey and may not be<br />
representative <strong>of</strong> the state as a whole.
Overweight & Obesity<br />
• In 2011, an estimated 18.1% <strong>of</strong> <strong>Nevada</strong> adults<br />
65 and older met the criteria for obesity;<br />
41.7% were merely overweight; 2.7% were<br />
underweight.<br />
• The Rural/Frontier region had the highest<br />
percentage <strong>of</strong> older adults categorized as<br />
underweight (5.7%) or obese (24.2%).<br />
• The highest percentage <strong>of</strong> older adults<br />
categorized as having a healthy weight (41.3%)<br />
lived in the Northern Urban/Metropolitan<br />
region.<br />
• The highest percentage <strong>of</strong> merely overweight<br />
older adults (43.5%) lived in the Southern<br />
Urban/Metropolitan region.<br />
Cholesterol & Blood Pressure<br />
• A higher percentage <strong>of</strong> adults 65 to 74 (61%)<br />
were told they had high cholesterol than adults<br />
75 to 84 (45.4%) or those 85 and older (31.7%).<br />
• Approximately 61% <strong>of</strong> <strong>Nevada</strong> adults 65 and<br />
older have been told they have hypertension.<br />
• A higher percentage <strong>of</strong> older adults with less<br />
than a high school education (76.3%) reported<br />
having hypertension than did those with a<br />
college education (54.6%).<br />
Influenza & Pneumonia Vaccinations<br />
• The immunizations rates for <strong>Nevada</strong>’s older<br />
adults are lower than national rates.<br />
• Nationally and in <strong>Nevada</strong>, about 70 percent <strong>of</strong><br />
older adults have had a pneumonia vaccination<br />
at some time in their lives.<br />
Cancer Screenings<br />
• An estimated 65% <strong>of</strong> U.S. and 62% <strong>of</strong> <strong>Nevada</strong><br />
adults age 50 and older indicated that they<br />
had a sigmoidoscopy or colonoscopy. Among<br />
<strong>Nevada</strong>ns 65 and older the figure was 67.6%.<br />
• In 2010, an estimated 53% <strong>of</strong> U.S. and 52% <strong>of</strong><br />
<strong>Nevada</strong> males 40 and older reported having had<br />
a prostate cancer (Prostate Specific Antigen)<br />
test. Among <strong>Nevada</strong> adults 65 and older, the<br />
figure was 75.5%.<br />
• An estimated 81% <strong>of</strong> U.S. females and 78% <strong>of</strong><br />
<strong>Nevada</strong> females 18 and older reported having<br />
had a Pap test to screen for uterine cancer<br />
between 2007 and 2010.<br />
• The percentage <strong>of</strong> <strong>Nevada</strong> females having had a<br />
mammogram differed by education and in<strong>com</strong>e.<br />
Fewer older females with less than a high<br />
school education (50%) reported having had a<br />
mammography than did those with a college<br />
education (80%).<br />
HIV/AIDS & Other Sexually Transmitted<br />
Diseases<br />
• Among adults 55 and older, the rate <strong>of</strong> AIDS<br />
diagnoses (6.3 per 100,000) was higher than<br />
nationally (5.4 per 100,000).<br />
• The rate <strong>of</strong> new HIV diagnoses in 2011 was 1.8<br />
per 100,000 while the rate <strong>of</strong> those living with<br />
HIV/AIDS was 98.2 per 100,000.<br />
• Rates per 100,000 <strong>of</strong> the following sexually<br />
transmitted diseases for <strong>Nevada</strong> adults 65 and<br />
older in 2011 were chlamydia (3.9), gonorrhea<br />
(1.8), primary/secondary syphilis (1.2) and early<br />
latent syphilis (0.3).<br />
Falls & Fall-Related Injuries<br />
• In 2006, the fall-related fatality rate among U.S.<br />
adults 65 and older was 38 per 100,000 while<br />
for <strong>Nevada</strong> adults 65 and older the rate for the<br />
Northern and Southern Urban/Metropolitan<br />
regions <strong>of</strong> the state was 27.2. The rate for the<br />
Rural/Frontier region was not available.<br />
• From 2006 to 2007, the <strong>Nevada</strong> death rate in<br />
older adults due to fall-related injuries increased<br />
from 27.2 to 36.8 per 100,000. In the same<br />
period, the national fall-related death rate<br />
among older adults increased from 38 to 48.5<br />
per 100,000.<br />
Elder Abuse, Neglect & Exploitation<br />
• In FY 2012 (7/1/11 to 6/30/12), Elder Protective<br />
Services and <strong>Nevada</strong> law enforcement received<br />
5,374 allegations <strong>of</strong> elder abuse statewide. Of<br />
these: 21.9% (n = 1,176) were for abuse; 21.8%<br />
(n = 1,173) were for neglect; 31.8% (n = 1,711)<br />
were for self-neglect; 21.8% (n = 1,171) were<br />
for exploitation; and 2.7% (n = 143) were for<br />
isolation.<br />
• Suspects in the cases closed in FY 2012 included<br />
the clients themselves (33.2%), the client’s child<br />
(23.1%), the service provider (13.2%), a relative<br />
(10.5%), the client’s spouse (9.1%), a friend<br />
or neighbor <strong>of</strong> the client (4.9%), and other<br />
individuals with unknown relationship to the<br />
client (6%).<br />
Health Risks & Behaviors<br />
93
Health Risks & Behaviors<br />
• Of all substantiated cases in FY 2012: 38.5%<br />
were for self-neglect; 22.5% were for abuse;<br />
20.4% were for neglect; 17.2% were for<br />
exploitation; and 1.4% were for isolation.<br />
Motor Vehicle Accidents<br />
• For U.S. adults 65 and older: a lower share<br />
(89.8%) reported that they always use a seatbelt<br />
when in a motor vehicle; 4.3% reported that<br />
they nearly always wear one; 2.4% stated that<br />
they sometimes wear a seatbelt; 0.6% seldom<br />
wear a seatbelt; 1.6% indicated that they do not<br />
drive or ride in motor vehicles.<br />
Veterans<br />
• In 2008, only 30%-40% <strong>of</strong> eligible veterans<br />
actually sought Veterans Administration<br />
services to address mental health (and possibly<br />
substance use) issues.<br />
• 2009-2012 demographics for the Washoe<br />
County Veteran’s Court indicate that 31% <strong>of</strong><br />
veteran clients were charged with drug and<br />
alcohol crimes, 24% with crimes against a<br />
person, 24% with property crimes, and 21%<br />
with nuisance crimes.<br />
• Between 2009 and 2012, Washoe County’s<br />
Veteran’s Court served 99 participants ranging<br />
in age from 20 to 78 years (M = 45.5 years).<br />
The majority <strong>of</strong> clients were White (80%) and<br />
male (91%). In addition, 12% were Black,<br />
7% were Hispanic, and 1% were Asian. The<br />
most <strong>com</strong>mon substances at issue in those<br />
with drug- or alcohol-related crimes included<br />
poly-substance abuse, alcohol, marijuana,<br />
methamphetamines, heroin/opiates and cocaine.<br />
• The age-adjusted rate <strong>of</strong> motor vehicle fatalities<br />
among <strong>Nevada</strong> veterans (27.8 per 100,000) is<br />
higher than for <strong>Nevada</strong>’s general population (7.8<br />
per 100,000).<br />
94
Tobacco Use<br />
Tobacco use is associated with “increased<br />
likelihood <strong>of</strong> cancer, cardiovascular disease, chronic<br />
obstructive lung diseases, and other debilitating<br />
health conditions” (Federal Interagency Forum,<br />
2012, p. 43). Three <strong>of</strong> the top 10 leading causes <strong>of</strong><br />
death in the United States (heart disease, cancer<br />
and chronic lower-respiratory diseases) may be<br />
directly associated with smoking. In particular,<br />
the 57% increase from 1981 to 2009 in chronic<br />
lower-respiratory disease in older adults (Federal<br />
Interagency Forum, 2012, p. 26) may result from the<br />
long-term effects <strong>of</strong> tobacco use.<br />
Between 1965 and 2010, the percentage <strong>of</strong> older<br />
adults nationally who smoked tobacco declined<br />
(see Figure HR1), and male use declined from 29%<br />
to 10%. Female use declined only 1% over the<br />
same period (Federal Interagency Forum, 2012).<br />
Current tobacco use declined among <strong>Nevada</strong><br />
adults from 28.2% in 1996 to 21.3% in 2010 (see<br />
Figure HR2, CDC: Smoking & Tobacco Use, n.d.).<br />
However, <strong>Nevada</strong> continues to rank in the top third<br />
nationwide; and is the top state in the western<br />
region for tobacco use.<br />
Fig. HR1: Cigarette Use in U.S. Adults 65 and Older: Year and Sex<br />
34%<br />
32%<br />
30%<br />
28%<br />
26%<br />
24%<br />
22%<br />
20%<br />
Fig. HR2: <strong>Nevada</strong>: Cigarette Use, 1996-2010<br />
1996 1997 1998 1999 2000 2001 2002 2003 2004 2005 2006 2007 2008 2009 2010<br />
(CDC: BRFSS: Tobacco Use, 1996-2010)<br />
Nationally, the rate <strong>of</strong> cigarette smoking in adults 65<br />
and older is lower than for younger adults (see Table<br />
HR1). Among these older adults, 52.5% <strong>of</strong> the males<br />
and 29.3% <strong>of</strong> the females were former smokers,<br />
while 37.8% <strong>of</strong> males and 61.4% <strong>of</strong> females were<br />
non-smokers. Less than 10% percent were current<br />
smokers or smoked every day.<br />
The rate <strong>of</strong> daily smoking in <strong>Nevada</strong> (10.7%;<br />
see Table HR2) is lower than nationally (15.1%).<br />
However, the percentage <strong>of</strong> former smokers in<br />
<strong>Nevada</strong> (51.8%) is more than twice as high (21.7%)<br />
as nationally. Not surprisingly, the percentage <strong>of</strong><br />
<strong>Nevada</strong> seniors who have never smoked is lower<br />
(34.7%) than the percentage nationally (59%, see<br />
Figure HR3).<br />
Health Risks & Behaviors<br />
Fig. HR3: Rate <strong>of</strong> Cigarette Smoking, Adults<br />
Age 65 and Older: <strong>Nevada</strong> versus U.S.<br />
51.8%<br />
59.0%<br />
34.7%<br />
10.7%<br />
15.1%<br />
2.8%<br />
4.2%<br />
21.7%<br />
Every Day Some Days Former Smoker Never Smoked<br />
<strong>Nevada</strong> U.S.<br />
(CDC: BRFSS, 2011; CDC: National Health Interview Survey, 2010, in<br />
Federal Interagency Forum, 2012, p. 128)<br />
(CDC: National Health Interview Survey, 2010, in Federal Interagency<br />
Forum, 2012, p. 43)<br />
95
Health Risks & Behaviors<br />
In 2011, a higher percentage <strong>of</strong> <strong>Nevada</strong> adults 65-<br />
74 reported smoking on a daily basis (14%) than<br />
adults 75-84 (6.3%) or those 85 and older (4%; CDC:<br />
BRFSS, 2011). In addition, a much lower percentage<br />
<strong>of</strong> Hispanics (2.9%) reported smoking daily than did<br />
Whites (10.9%) or older adults <strong>of</strong> other races (13.8%;<br />
see Figure HR4). Minimal differences were found by<br />
education or in<strong>com</strong>e in the percentage <strong>of</strong> older adults<br />
who smoked daily.<br />
Alcohol Use<br />
Socially accepted, easy to access, and cheap to<br />
purchase, alcohol has been the drug <strong>of</strong> choice for<br />
many older adults. Even for older adults in nursing<br />
facilities, alcohol is used to facilitate social contact.<br />
One study reported that 49.5% <strong>of</strong> nursing facilities<br />
surveyed in a northeastern state (N = 111) deemed<br />
it appropriate to allow residents access to alcohol,<br />
and 6.9% indicated it was “very appropriate” (Klein<br />
& Jess, 2002, p. 197). Staff from these facilities<br />
allowed use upon doctor’s order (26.1%), during<br />
cocktail hours (18.0%), on special occasions<br />
(14.4%), at the residents’ discretion (13.5%), outside<br />
<strong>of</strong> the facility only (13.5%), when dispensed by staff<br />
(12.6%), at facility-sponsored outings (10.8%), and<br />
for sacramental use (0.9%, p. 198).<br />
Aging is associated with reductions in liver and<br />
kidney function, muscle mass, and body water and<br />
with an increase in body fat. These physiological<br />
changes reduce the older adult’s ability to<br />
metabolize alcohol, so alcohol remains active longer<br />
in the body and brain. Alcohol may negatively<br />
interact with medications, creating a dangerous<br />
<strong>com</strong>bination. For example, prescription medications<br />
for insomnia can be<strong>com</strong>e lethal if <strong>com</strong>bined with<br />
alcohol.<br />
Fig. HR4: <strong>Nevada</strong> Adults, Age 65 and Older:<br />
Race/Ethnicity by Smoking Every Day<br />
10.9%<br />
13.8%<br />
(CDC: BRFSS, 2011)<br />
2.9%<br />
White Other Race Hispanic<br />
Long-term alcohol use or abuse is associated<br />
with deterioration in overall health and with liver<br />
disease, stroke, brain damage and dementia,<br />
internal bleeding, poor nutrition, immune<br />
dysfunction, falls and injuries, depression, and<br />
suicide. In <strong>Nevada</strong>, 1.7% <strong>of</strong> all deaths in 2009 were<br />
alcohol induced (Kochanek, Xu, Murphy, Minino,<br />
& Kung, 2011). That same year, alcohol-induced<br />
deaths in <strong>Nevada</strong> ranked 13th in a list <strong>of</strong> 19 causes<br />
<strong>of</strong> death.<br />
Generally, people drink less alcohol as they grow<br />
older (SAMHSA, 2011). In the 2010 National Survey<br />
on Drug Use and Health, the percentage <strong>of</strong> adults<br />
who had used alcohol in the month prior to the<br />
survey decreased from 65.3% among adults 26-29<br />
to 51.6% in adults 60-64, and to 38.2% in adults 65<br />
and older. Of those 65 and older who drank alcohol,<br />
30.7% described themselves as current, non-binge<br />
and non-heavy drinkers. Another 5.9% described<br />
themselves as binge drinkers, and 1.6% <strong>of</strong> drinkers<br />
were heavy alcohol users 2 .<br />
Fig. HR5: Of Adults Who Drink: Levels<br />
<strong>of</strong> Use<br />
37.8%<br />
30.7%<br />
10.5%<br />
5.9%<br />
3.3%<br />
1.6%<br />
Current Use (Not Binge Binge Use<br />
or Heavy Use)<br />
60-64 Years 65 and Older<br />
Heavy Use<br />
(SAMHSA, 2010, Section 3.1)<br />
96<br />
2<br />
“Binge use = five or more drinks on the same occasion (i.e., at the same time or within a couple <strong>of</strong> hours <strong>of</strong> each other) on at least one day in the<br />
past 30 days. Heavy use = five or more drinks on the same occasion on each <strong>of</strong> five or more days in the past 30 days” (SAMHSA, 2011, Section 3).
National rates <strong>of</strong> binge drinking in adults 65 and<br />
older decreased from 9.8% in 2009 to 7.6% in 2010.<br />
The rate <strong>of</strong> heavy alcohol use decreased from 2.2%<br />
in 2009 to 1.7% in 2010 (SAMHSA, 2010, 2011). The<br />
rate <strong>of</strong> reported binge drinking among <strong>Nevada</strong> older<br />
adults (6.1%, see Table HR3) was lower than the<br />
national percentage (7.6%). The rate <strong>of</strong> heavy alcohol<br />
use (4.8%, see Table HR4) in <strong>Nevada</strong> was higher<br />
than national percentage (1.7%; CDC: BRFSS, 2011).<br />
Among the older adults, a smaller percentage <strong>of</strong><br />
adults 85 and older (2.1%) met the criteria for binge<br />
drinking than did adults 65-74 (8.5%; see Figure<br />
HR6).<br />
Fig. HR6: <strong>Nevada</strong> Adults, Age 65 and Older:<br />
Age by Binge Drinking<br />
8.5%<br />
A higher percentage <strong>of</strong> adults earning $75,000 or<br />
more per year (69.8%) reported having had at least<br />
one drink, <strong>com</strong>pared with 33.9% for those making<br />
less than $15,000 per year and 35.7% for those<br />
making $15,000 to $24,999 (see Figure HR7). In<br />
addition, more adults 65 and older with a college<br />
education (56.2%) reported having a drink than<br />
those with some college education but no degree<br />
(41.2%, see HR8).<br />
Fig. HR7: <strong>Nevada</strong> Adults, Age 65 and Older:<br />
In<strong>com</strong>e by Heavy Drinkers Reporting at Least<br />
One Drink in Past 30 Days<br />
33.9% 35.7%<br />
69.8%<br />
Health Risks & Behaviors<br />
< $15,000 $15,000-$24,999 $75,000 or More<br />
2.9%<br />
2.1%<br />
(CDC: BRFSS, 2011)<br />
65-74 Years 75-84 Years 85 and Older<br />
(CDC: BRFSS, 2011)<br />
The percentage <strong>of</strong> <strong>Nevada</strong> adults 65 and older who<br />
described themselves as heavy drinkers (4.8%) did<br />
not differ significantly by region, age, sex, education<br />
or in<strong>com</strong>e (see Table HR4).<br />
Fig. HR8: <strong>Nevada</strong> Adults, Age 65 and Older:<br />
Education by Heavy Drinkers, One Drink in<br />
Past 30 Days<br />
39.3%<br />
47.2%<br />
41.2%<br />
(CDC: BRFSS, 2011)<br />
56.2%<br />
Less than H.S. H.S. or G.E.D. Some Post H.S. College Graduate<br />
Of the <strong>Nevada</strong> adults 65 and older who described<br />
themselves as heavy drinkers, 45.4% reported having<br />
at least one drink in the 30 days prior to the survey<br />
(see Table HR5). The percentage <strong>of</strong> these heavy<br />
drinkers differed minimally by region, age, sex or<br />
race/ethnicity.<br />
97
Health Risks & Behaviors<br />
Illicit Drug Use<br />
In 2011, the oldest <strong>of</strong> the baby boomer population<br />
(born between 1946 and 1964) reached their<br />
milestone 65th birthday. Boomers are the first<br />
population to have grown to adulthood with<br />
greater lifetime exposure to drug use, greater<br />
tolerance <strong>of</strong> substance use, and increasing media<br />
representation <strong>of</strong> use as <strong>com</strong>monplace (Coliver,<br />
Compton, Gfroerer, and Condon, 2006; Volkow,<br />
2011). Substance use researchers thus predict an<br />
increase in illicit drug use, abuse, and dependence<br />
<strong>com</strong>mensurate with the aging <strong>of</strong> this population 3 .<br />
For example, in a trend analysis <strong>of</strong> National Survey<br />
<strong>of</strong> Drug Use and Health (NSDUH), Duncan,<br />
Nicholson, White, Bradley and Bonaguro (2010)<br />
noted that the percentage <strong>of</strong> adults 50 and older<br />
using illicit drugs increased from 1985 to 2006.<br />
Specifically, use <strong>of</strong> marijuana increased from 0.3%<br />
<strong>of</strong> the population to 1.6% or 1.27 million older<br />
adults. Use <strong>of</strong> cocaine increased from 0.1% to 0.3%<br />
(140,422 older adults currently using), and use <strong>of</strong><br />
inhalants increased from 0% to 0.1% (56,547 older<br />
adults; Duncan et al., 2010, p. 239-240).<br />
National use in 50-59 year old adults from 2002 to<br />
2010 supports the predicted trends. Past-month<br />
illicit drug use among adults 50-59 increased from<br />
2002 to 2010 (SAMHSA, 2011). Past-month use <strong>of</strong><br />
illicit drugs in adults 60-64 decreased from 3.1% in<br />
2009 to 2.7% in 2010. However, for adults 65 and<br />
older, past-month use increased from 0.9% in 2009<br />
to 1.1% in 2010. An estimated 5.2% <strong>of</strong> adults 50 and<br />
older (4.8 million) used an illicit drug in the past<br />
year (see Figure HR9).<br />
Fig. HR9: NSDUH: Use <strong>of</strong> Illicit Substances in Adults 50-59<br />
Unfortunately, we are not prepared nationally or at<br />
the state level to respond to this emerging public<br />
health problem. Research into the intersection <strong>of</strong><br />
aging and substance abuse is lacking (Volkow,<br />
2011). Also lacking is adequate training for<br />
clinicians, care providers, and primary care<br />
physicians in screening/assessment and treatment<br />
<strong>of</strong> substance abuse in geriatric populations (Klein<br />
& Jess, 2002; Menninger, 2002). Diagnostic criteria<br />
found in the current Diagnostic and Statistical<br />
Manual <strong>of</strong> Mental Disorders, Fourth Edition (DSM-<br />
IV, 1994), is inadequate for detecting substance use<br />
disorders in this age group (Menninger, 2002).<br />
+ Difference between this estimate and the 2010 estimate is statistically significant at the .05 level.<br />
+ Difference between this estimate and the 2010 estimate is<br />
statistically significant at the .05 level.<br />
(SAMHSA: NSDUH, 2011, Figure 2.8)<br />
Data from the Drug Abuse Warning Network<br />
(DAWN) estimated that 118,495 adults 50 and<br />
older visited hospital emergency departments for<br />
problems associated with the use <strong>of</strong> illicit drugs in<br />
2008 (SAMHSA: Office <strong>of</strong> Applied Studies, 2010).<br />
Of these, over half (58.2%) were 50-54 years <strong>of</strong> age,<br />
just over a fourth were 55-59, 11.1% were 60-64,<br />
3.4% were 65-69, and 1.5% were 70 or older. During<br />
these ER visits, patients 65 and older reported use <strong>of</strong><br />
cocaine (48.3%), heroin (23.3%), marijuana (28.6%),<br />
and illicit stimulants (5.5%; see Figure HR10). In<br />
addition, <strong>of</strong> all visits that included illicit drugs, 31.1%<br />
also included use <strong>of</strong> alcohol (SAMHSA: Office <strong>of</strong><br />
Applied Studies, 2010).<br />
98<br />
3<br />
The Substance Abuse and Mental Health Services Administration (SAMHSA) includes the following substances under the category <strong>of</strong> illicit drugs<br />
[SAMHSA: National Survey on Drug Use and Health (NSDUH), 2011, Section 2, para. 1]: marijuana (hashish), cocaine (crack), heroin, hallucinogens<br />
(LSD, PCP, peyote, mescaline, psilocybin mushrooms, and ecstasy/MDMA), inhalants (nitrous oxide, amyl nitrate, cleaning fluids, gasoline, spray<br />
paint, aerosol sprays, and glue), non-medical use <strong>of</strong> prescription drugs including pain relievers, tranquilizers, stimulants (methamphetamines) and<br />
sedatives.
63.8%<br />
Fig. HR10: DAWN, 2008 : ER Visits and<br />
Illicit Drug Use in Adults, Age 50 and<br />
48.3%<br />
26.6%<br />
23.3%<br />
Older<br />
Aged 50 to 64<br />
Aged 65 and Older<br />
28.6%<br />
18.0%<br />
5.3% 5.5%<br />
Cocaine Heroin Marijuana Illicit Stimulants<br />
(SAMHSA: Office <strong>of</strong> Applied Studies, 2010)<br />
Drug-related adverse reactions also are issues <strong>of</strong><br />
importance for older adults. As indicated previously,<br />
aging is associated with physical changes in<br />
the ability to distribute, metabolize and excrete<br />
substances. As such, substances remain in the body<br />
longer, increasing the chance for an interaction with<br />
medications, alcohol or illicit substances. Per the<br />
2010 DAWN report, drug-related adverse reactions<br />
were highest in ER visits for adults 65 and older<br />
(SAMHSA: Center for Behavioral Health Statistics<br />
and Quality, 2012). Of the 1,678.9 ER visits per<br />
100,000 in 2010, adverse reactions were noted for<br />
cardiovascular medications, anticoagulants, pain<br />
relievers, antibiotics, and drugs to treat cancer and<br />
diabetes.<br />
State-level data on substance use in older adults is<br />
minimal. DAWN data is not collected from <strong>Nevada</strong>,<br />
and NSDUH and Treatment Episode Data Sets<br />
(TEDs) state-level data is aggregated for adults<br />
either age 26 and older (NSDUH) or age 12 and<br />
older (TEDs) 4 . However, we do know that in 2009,<br />
drug-induced deaths ranked as the sixth-leading<br />
cause <strong>of</strong> death in <strong>Nevada</strong> (Kochanek, Xu, Murphy,<br />
Minino, & Kung, 2011). In 2010, <strong>Nevada</strong> ranked<br />
fourth in the nation in drug-poisoning deaths with<br />
an age-adjusted rate <strong>of</strong> 20.7 per 100,000 (CDC:<br />
Morbidity and Mortality, Drug Poisonings, 2012).<br />
We also know that 12,549 <strong>Nevada</strong> individuals 12<br />
and older were discharged in 2009 from a hospital<br />
following substance-related treatment (SAMHSA:<br />
TEDS, 2012, Chart 1.1a). Treatment services provided<br />
to the 11,689 admissions included outpatient<br />
(5,122), detoxification (3,493), intensive outpatient<br />
(1,114), short-term residential (1,799), long-term<br />
residential (5), and medically assisted opioid or other<br />
detoxification (156; SAMHSA: TEDS, 2012, Chart<br />
1.2a).<br />
Based on NSDUH 2009-2010 data, the percentage<br />
<strong>of</strong> illicit drug dependence in the past year among<br />
<strong>Nevada</strong>ns 26 and older (1.34%) is higher than the<br />
U.S. rate (1.25%) for the same age range (SAMHSA:<br />
NSDUH, 2012). <strong>Nevada</strong> ranked in the top fifth <strong>of</strong> all<br />
states for having the highest percentage <strong>of</strong> illicit drug<br />
dependence or abuse in the past year among adults<br />
26 and older. In addition, <strong>Nevada</strong> ranked in the top<br />
fifth for highest percentage <strong>of</strong> adults 26 and older<br />
needing, but not receiving, treatment for illicit drug<br />
use in the past year (SAMHSA: NSDUH, 2012).<br />
Other state-level data indicate that the percentage<br />
<strong>of</strong> <strong>Nevada</strong>ns 26 and older reporting marijuana use<br />
in the past year (8.19%) is much higher than the<br />
national average (7.88%). <strong>Nevada</strong> ranks in the top<br />
fifth for states with highest use. <strong>Nevada</strong> also ranks<br />
higher than the United States in the percentage <strong>of</strong><br />
adults 26 and older reporting cocaine use in the past<br />
year (1.93% versus 1.41%, respectively), and for the<br />
nonmedical use <strong>of</strong> pain relievers in the past year<br />
(4.62% versus 3.53%, respectively; see Figure HR11).<br />
1.3%<br />
1.3%<br />
Illicit Drug<br />
Dependence in the<br />
Past Year<br />
Fig. HR11: NSDUH, 2009-2010:<br />
Use in Adults Age 26 and Older<br />
7.9%<br />
8.2%<br />
Marijuana Use in<br />
Past Year<br />
1.4%<br />
(SAMHSA, 2012)<br />
1.9%<br />
Cocaine Use in Past<br />
Year<br />
3.5%<br />
U.S.<br />
<strong>Nevada</strong><br />
4.6%<br />
Nonmedical Use <strong>of</strong><br />
Pain Relievers<br />
Health Risks & Behaviors<br />
4<br />
<strong>Nevada</strong> facilities providing TEDS data included all facilities that received state/public funding.<br />
99
Health Risks & Behaviors<br />
Gambling & Other Process Addictions<br />
Process addictions such as pathological gambling,<br />
Internet addiction, food addiction, etc., show<br />
neurobiological, stimulus-reward patterns similar<br />
to substance addictions. In addition, process<br />
addictions show similarities in the progression<br />
from social use to abuse and dependency. And<br />
just like substance dependence, process addictions<br />
may result in <strong>com</strong>pulsive behaviors and craving,<br />
continuing the behavior in spite <strong>of</strong> adverse<br />
consequences, and loss <strong>of</strong> control over the behavior.<br />
Scientists now acknowledge the similarities<br />
between substance dependence and pathological<br />
gambling.<br />
The National Council on Problem Gambling<br />
(NCPG, 2012) estimated that 85% <strong>of</strong> all U.S.<br />
adults have gambled at least once in their lives<br />
and 60% have gambled in the past year. Of these,<br />
approximately 1%, or 2 million adults, met the<br />
diagnostic criteria for pathological gambling, and<br />
2-3%, or 4-6 million, were problem gamblers<br />
(NCPG, 2012). In a nationally representative study<br />
<strong>of</strong> U.S. households between 2001 and 2003, 78.4%<br />
<strong>of</strong> participants reported gambling at least once in<br />
their lifetime; the prevalence estimate for lifetime<br />
problem gambling was 2.3%; and the estimate<br />
for lifetime pathological gambling was 0.6%<br />
(Kessler et al, 2008). Age <strong>of</strong> onset for those who<br />
eventually became problem gamblers (median age<br />
= 21) was later than for non-problem gamblers<br />
(median age = 18; p. 1354). Rank-order popularity<br />
<strong>of</strong> different types <strong>of</strong> gambling did not differ across<br />
pathological and non-problem gamblers. However,<br />
the percentage <strong>of</strong> pathological gamblers who chose<br />
specific types <strong>of</strong> gambling was higher than for all<br />
gamblers (see Figure HR12).<br />
Fig. HR12: Popularity <strong>of</strong> Gaming by<br />
Gambler Type<br />
Speculating on High Risk Investments<br />
Internet Gambling<br />
Sports Betting: Bookie/Parlay Card<br />
Office Sports Pools<br />
Gambling at a Casino<br />
Slot Machines or Bingo<br />
Numbers/Lotto<br />
All Gamblers<br />
8.4%<br />
26.9%<br />
1.0%<br />
7.5%<br />
5.8%<br />
45.3%<br />
44.3%<br />
85.1%<br />
44.7%<br />
78.5%<br />
48.9%<br />
77.3%<br />
62.2%<br />
86.5%<br />
Pathological Gamblers<br />
In addition, the odds <strong>of</strong> developing a pathological<br />
gambling disorder increased by type <strong>of</strong> gaming.<br />
Games requiring mental skill (card games such<br />
as poker, bridge, etc.) posed the highest risk <strong>of</strong><br />
association with pathological gambling. Further,<br />
Kessler et al.’s (2008) study supported previous<br />
research showing <strong>com</strong>orbidity between pathological<br />
gambling and bipolar disorder, substance use<br />
disorders, and panic disorder. These mental health<br />
disorders preceded the onset <strong>of</strong> pathological<br />
gambling.<br />
Gambling studies <strong>of</strong> adults 50 and older also<br />
indicated an increase in prevalence <strong>of</strong> lifetime<br />
gambling, from 35% in 1975 to 80% in 1998<br />
(National Opinion Research Center, 1999, in Tse,<br />
Hong, Wang & Cunningham-Williams, 2012,<br />
p. 639). Prevalence rates <strong>of</strong> lifetime pathological<br />
gambling varied widely based on the populations<br />
selected (e.g., older adults in nursing facilities<br />
versus those in casinos or bingo establishments),<br />
the gambling-assessment instruments used, and<br />
the types <strong>of</strong> gambling assessed (Tse et al, 2012).<br />
However, all studies consistently reported lower<br />
prevalence <strong>of</strong> problem/pathological gambling<br />
in older adults than in younger adults, and that<br />
gambling disorders were more prevalent among<br />
older males than older females (Tse et al, 2012, p.<br />
645).<br />
Stitt, Giacopassi and Nichols’ (2003) study <strong>of</strong> older<br />
adults and gambling in casinos suggests that casino<br />
gambling might not be a major threat to older adults.<br />
In a survey <strong>of</strong> 2,768 individuals, these researchers<br />
found that adults 63 and older were more likely<br />
to visit casinos than were adults 62 and younger;<br />
however, there were no age differences in the time<br />
spent in the casinos. A greater percentage <strong>of</strong> older<br />
females (43.7%) indicated they gambled than older<br />
males (33.3%). Older adults tended to spend less<br />
money gambling than younger adults, and fewer<br />
older adults reported losing more money than they<br />
could afford.<br />
100<br />
(Kessler, Hwang, LaBrie, Petukhova, Sampson, Winters, &<br />
Shaffer, 2008)
In spite <strong>of</strong> Stitt et al.’s (2003) findings, problem<br />
or pathological gambling by older adults may be<br />
particularly problematic. The older adult has fewer<br />
economic resources and less time than younger<br />
adults to recoup financial loss (Stitt, Giacopassi,<br />
& Nichols, 2003). Older adults are more prone to<br />
suffer health-related consequences from long hours<br />
spent in casinos and may be less likely to eat well<br />
or to take their medications while gambling. Older<br />
adults also may be less likely to understand addiction<br />
or recognize they have a gambling problem. They<br />
may hide gambling issues due to stigma and shame<br />
(<strong>Nevada</strong> Council on Problem Gambling, 2007).<br />
The <strong>Nevada</strong> Department <strong>of</strong> Health and Human<br />
Services (DHHS, 2011) indicated that <strong>Nevada</strong> has<br />
the highest number <strong>of</strong> adults (an estimated 68,000)<br />
meeting diagnostic criteria for pathological gambling<br />
(p. 2). Volberg (2002) also estimated that in 2000,<br />
3.5% <strong>of</strong> <strong>Nevada</strong>ns met the criteria for pathological<br />
gambling in the past year, and 2.9% met the criteria<br />
for problem gambling. Bernhard and St. John (2012)<br />
later suggested that these rates were underestimated<br />
and that a definitive study <strong>of</strong> gambling disorders in<br />
<strong>Nevada</strong> is warranted.<br />
In 2010, the <strong>Nevada</strong> DHHS funded six programs<br />
with specialized treatment for problem gambling<br />
(see HR16). The sites were the Las Vegas Problem<br />
Gambling Center, the Reno Problem Gambling<br />
Center, Bristlecone, Pathways, New Frontier, and the<br />
Salvation Army (see Table HR6).<br />
Between 2006 and 2010, the average annual intake<br />
for these treatment centers was 429 individuals<br />
(NVDHHS, 2011, p. 3). However, the <strong>Nevada</strong> DHHS<br />
Five-Year Strategic Plan for Problem Gambling<br />
(2011) suggested that client treatment had declined,<br />
possibly due to “lack <strong>of</strong> conformity with key aspects<br />
<strong>of</strong> treatment delivery, such as client eligibility, services<br />
<strong>of</strong>fered, and documentation standards” (p. 8).<br />
Health Risks & Behaviors<br />
Dietary Quality<br />
Diet and nutrition are associated with physical<br />
and cognitive health. Poor diet can result in<br />
adverse health out<strong>com</strong>es, including anemia,<br />
diabetes, cancer, osteopenia and osteoporosis,<br />
vision impairment, impaired cognitive function,<br />
depression, cardiovascular disease, and stroke<br />
(CDC: Second National Report on Biochemical<br />
Indicators <strong>of</strong> Diet, 2012). In 2010, 14.5% <strong>of</strong> U.S.<br />
households (17.2 million) were unable to access<br />
adequate food because <strong>of</strong> limited funds or resources<br />
(Coleman-Jensen, Nord, Andrews, & Carlson,<br />
2011). Limited resources resulted in reduced<br />
consumption and disrupted eating patterns for 5.4%<br />
<strong>of</strong> households (6.4 million; Coleman-Jensen et al.,<br />
2011).<br />
Even with adequate food availability, some<br />
individuals suffer from poor nutrition because <strong>of</strong> the<br />
types <strong>of</strong> food selected [e.g., high fat, salt and sugar<br />
levels; United States Department <strong>of</strong> Agriculture<br />
(USDA) Dietary Guidelines, 2010]. The National<br />
Health and Nutrition Examination Survey (NHNES)<br />
noted that 23.5% <strong>of</strong> males and 23.1% <strong>of</strong> females 60<br />
and older consumed non-nutritional diet drinks “on<br />
a given day” from 2009-2010 (Fakhouri, Kit, and<br />
Ogden, 2012).<br />
101
Health Risks & Behaviors<br />
The NHNES (2003-2006) assessed biochemical<br />
indicators <strong>of</strong> diet and nutrition in a nationally<br />
representative sample and noted that 10% or less <strong>of</strong><br />
the United States had nutritional deficiencies (CDC:<br />
Second National Report, Executive Summary,<br />
2012, p. 4). Specific types <strong>of</strong> deficiencies found, and<br />
those more likely to be found deficient, included:<br />
Vitamin B12 (older adults, 4%); Vitamin C (men,<br />
7%); and Vitamin D (Non-Hispanic Blacks, 31%<br />
and Mexican-Americans, 12%). Alternatively, when<br />
<strong>com</strong>pared with young adults, older adults had the<br />
highest blood levels <strong>of</strong> folic acid and higher levels <strong>of</strong><br />
fatty acids.<br />
With easy access to processed and “fast” foods and<br />
the myriad <strong>of</strong> diets promoted through media and<br />
word <strong>of</strong> mouth, many Americans today likely have<br />
no idea what is considered a healthy diet, nor do<br />
they know the nutritional value <strong>of</strong> the foods they<br />
eat (USDA Dietary Guidelines, 2010). However,<br />
most do know that they should increase their intake<br />
<strong>of</strong> fruits and vegetables.<br />
A meta-analysis <strong>of</strong> surveys relating to Alzheimer’s<br />
disease and cognitive health noted that 25.6%<br />
<strong>of</strong> adults surveyed agreed that a healthy diet<br />
was a protective factor against development<br />
<strong>of</strong> Alzheimer’s disease (Connell, Roberts, &<br />
McLaughlin, 2007, in Anderson, Day, Beard, Reed,<br />
and Wu, 2009, p. S7). However, participants did not<br />
know what, specifically, constituted a healthy diet.<br />
The 2010 Health Styles survey <strong>of</strong> U.S. adults found<br />
that 75% <strong>of</strong> participants believed healthy diets were<br />
essential to maintaining cognitive health (CDC:<br />
Healthy Brain Initiative, 2011).<br />
In a statewide survey <strong>of</strong> <strong>Nevada</strong>ns, 47.2% indicated<br />
that they needed assistance in locating or accessing<br />
food in the past year (GMAC Statewide Needs<br />
Survey, 2012). Social workers and case managers,<br />
however, indicated that 68.1% <strong>of</strong> their clients<br />
needed assistance in locating or accessing food<br />
during the same time. While 58.8% <strong>of</strong> service<br />
providers cited inadequate in<strong>com</strong>e as the factor<br />
stopping clients from obtaining adequate food,<br />
21.6% <strong>of</strong> clients stated that it was the cost <strong>of</strong> food,<br />
and only 15.2% cited inadequate in<strong>com</strong>e as a factor<br />
(see Figure HR13).<br />
Fig. HR13: Issues Stopping Clients from<br />
Obtaining Food<br />
No school nutrition program<br />
2.0%<br />
6.9%<br />
No <strong>com</strong>munity food bank or pantry<br />
2.4%<br />
7.7%<br />
No public assistance<br />
5.2%<br />
20.6%<br />
No access to affordable food<br />
5.5%<br />
25.8%<br />
Did not meet the criteria for public…<br />
8.7%<br />
37.7%<br />
Cost <strong>of</strong> food<br />
21.6%<br />
47.9%<br />
Inadequate in<strong>com</strong>e<br />
15.2%<br />
58.8%<br />
Community Service Provider<br />
(GMAC Statewide Needs Survey, 2012)<br />
In the 2011 BRFSS survey, an estimated 14%<br />
<strong>of</strong> <strong>Nevada</strong> adults 65 and older ate five or more<br />
servings <strong>of</strong> fruits and vegetables per day (see Table<br />
HR7). Only minimal differences were noted by<br />
region <strong>of</strong> the state, sex, race/ethnicity or education.<br />
Fewer respondents 85 and older (6.4%) reported<br />
eating the re<strong>com</strong>mended daily intake (RDI) <strong>of</strong> fruit<br />
and vegetables than did adults 75-84 (18.8%; see<br />
Figure HR14). Fewer adults with less than a high<br />
school education (6.6%) reported following the<br />
dietary re<strong>com</strong>mendations than did those with a<br />
college education (18.5%; see Figure HR15).<br />
Fig. HR14: <strong>Nevada</strong> Adults, Age 65 and Older:<br />
Age by Five or More Fruits and Vegetables per<br />
Day<br />
18.8%<br />
(CDC: BRFSS, 2011)<br />
(CDC: BRFSS, 2011)<br />
6.4%<br />
75-84 Years 85 or Older<br />
Fig. HR15: <strong>Nevada</strong> Adults, Age 65 and Older:<br />
Education by Five or More Fruits and<br />
Vegetables per Day<br />
6.6%<br />
Less than H.S.<br />
18.5%<br />
College Graduate<br />
102
Physical Activity<br />
In addition to proper nutrition, physical activity<br />
is essential for maintaining proper weight and<br />
str<strong>eng</strong>th as one ages (DHHS: National Health<br />
Information Center, 2012). According to the CDC’s<br />
2008 Physical Activity Guidelines (2012), adults<br />
65 and older should <strong>eng</strong>age in a <strong>com</strong>bination <strong>of</strong><br />
aerobic and str<strong>eng</strong>thening exercises every week.<br />
Adults should spend at least 2.5 hours per week<br />
<strong>of</strong> moderate-intense aerobic activity, and they<br />
should spend at least two days a week doing<br />
muscle-str<strong>eng</strong>thening activity that works all the<br />
major muscle groups. The National Institute <strong>of</strong><br />
Health/National Institute on Aging (NIH/NIA) also<br />
re<strong>com</strong>mends a <strong>com</strong>bination <strong>of</strong> aerobic and musclestr<strong>eng</strong>thening<br />
activities to improve breathing<br />
and heart rate, maintain the ability to function<br />
independently, prevent falls, and help the body to<br />
stay limber (Go4Life, n.d.).<br />
The CDC reported that 52.6% <strong>of</strong> older <strong>Nevada</strong>ns<br />
participated in aerobic activity at least 2.5 hours per<br />
week, 30.1% participated in muscle-str<strong>eng</strong>thening<br />
activities at least twice a week, and 21.3% met the<br />
2008 U.S. Physical Activity Guidelines (see Figure<br />
HR16).<br />
Fig. HR16: Adults, Age 18 and Older: Physical<br />
Activity, U.S. and <strong>Nevada</strong><br />
51.7%<br />
52.6%<br />
U.S.<br />
NV<br />
Fig. HR17: <strong>Nevada</strong> Adults, Age 65 and Older:<br />
Sex by Participated in Physical Activity in Past<br />
30 Days<br />
75.3%<br />
Male<br />
(CDC: BRFSS, 2011)<br />
62.9%<br />
Female<br />
A larger percentage <strong>of</strong> older adults with a college<br />
education reported recent physical activity than did<br />
those with a high school diploma or less (see Figure<br />
HR18). A larger percentage <strong>of</strong> older adults with<br />
an in<strong>com</strong>e <strong>of</strong> $75,000 or greater reported recent<br />
physical activity than did those with in<strong>com</strong>es <strong>of</strong> less<br />
than $25,000 (see Figure HR19).<br />
Fig. HR18: <strong>Nevada</strong> Adults, Age 65 and Older:<br />
Education by Participated in Physical Activity in<br />
Past 30 Days<br />
56.0%<br />
64.3%<br />
74.3%<br />
(CDC: BRFSS, 2011)<br />
81.1%<br />
Less than H.S. H.S. or G.E.D. Some Post H.S. College Graduate<br />
Health Risks & Behaviors<br />
Aerobic Activity, 2.5 hrs/week<br />
minimum<br />
29.6%<br />
30.1%<br />
Muscle Str<strong>eng</strong>thening, twice a<br />
week minimum<br />
(CDC: BRFSS, 2011)<br />
21.0%<br />
21.3%<br />
Met 2008 Physical Activity<br />
Guidelines<br />
Fig. HR19: <strong>Nevada</strong> Adults, Age 65 and Older:<br />
In<strong>com</strong>e by Participated in Physical Activity in<br />
Past 30 Days<br />
58.6% 60.2%<br />
69.8% 70.6%<br />
77.3%<br />
88.3%<br />
Of the older <strong>Nevada</strong> adults surveyed in 2011, 68.7%<br />
reported participating in physical activities in the<br />
past 30 days (see Table HR8; CDC: BRFSS, 2011).<br />
Only minimal differences were noted by region, age<br />
or race/ethnicity.<br />
Differences were noted by sex, education, and<br />
in<strong>com</strong>e. Fewer older adult females in <strong>Nevada</strong><br />
(62.9%) reported physical activity in the past 30<br />
days than did older adult males (75.3%; see Figure<br />
HR17).<br />
< $15,000 $15,000 to<br />
$24,999<br />
$25,000 to<br />
$34,999<br />
$35,000 to<br />
$49,999<br />
(CDC: BRFSS, 2011)<br />
$50,000 to<br />
$74,999<br />
$75,000+<br />
An estimated 17.8% <strong>of</strong> older <strong>Nevada</strong> adults<br />
participated in enough str<strong>eng</strong>th training and aerobic<br />
exercise to meet the second-level federal guidelines<br />
for physical activity (see Table HR9; CDC: BRFSS,<br />
2011). The lowest percentage <strong>of</strong> survey respondents<br />
meeting these guidelines for physical activity resided<br />
in the Rural/Frontier region (10.7%), while the largest<br />
percentage (21.2%) resided in the Northern Urban/<br />
Metropolitan area (see Figure HR20).<br />
103
Health Risks & Behaviors<br />
Fig. HR20: <strong>Nevada</strong> Adults, Age 65 and Older:<br />
Region by Met Federal Guidelines for Physical<br />
Activity<br />
17.8% 18.4%<br />
Statewide<br />
Southern Urban<br />
Metropolitan<br />
21.2%<br />
Northern Urban<br />
Metropolitan<br />
(CDC: BRFSS, 2011)<br />
10.7%<br />
Rural/Frontier<br />
An estimated 24.8% <strong>of</strong> older <strong>Nevada</strong> males met the<br />
federal guidelines for physical activity, <strong>com</strong>pared<br />
with 11.6% <strong>of</strong> older <strong>Nevada</strong> females (see Figure<br />
HR21).<br />
Fig. HR21: <strong>Nevada</strong> Adults, Age 65 and Older:<br />
Sex by Met Federal Guidelines for Physical<br />
Activity<br />
24.8%<br />
Fig. HR22: <strong>Nevada</strong> Adults, Age 65 and Older:<br />
Education by Met Federal Guidelines for<br />
Physical Activity<br />
3.8%<br />
16.1%<br />
21.7%<br />
(CDC: BRFSS, 2011)<br />
(CDC: BRFSS, 2011)<br />
31.2%<br />
Less than H.S. H.S. or G.E.D. Some Post H.S. College Graduate<br />
Fig. HR23: <strong>Nevada</strong> Adults, Age 65 and Older:<br />
In<strong>com</strong>e by Met Federal Guidelines for Physical<br />
Activity<br />
11.3% 10.7%<br />
< $15,000 $15,000 to<br />
$24,999<br />
14.7%<br />
$25,000 to<br />
$34,999<br />
24.9%<br />
$35,000 to<br />
$49,999<br />
27.3%<br />
$50,000 to<br />
$74,999<br />
34.5%<br />
$75,000+<br />
11.6%<br />
Male<br />
Female<br />
(CDC: BRFSS, 2011)<br />
The number <strong>of</strong> older adults meeting the federal<br />
physical activity guidelines increased with education<br />
(see Figure HR22) and in<strong>com</strong>e (see Figure HR23).<br />
Less than 5% <strong>of</strong> older adults with less than a<br />
high school education met the federal guidelines,<br />
<strong>com</strong>pared with 31.2% <strong>of</strong> those with a college<br />
education. A smaller share adults making $35,000 or<br />
less (10.7%-14.7%) met the federal guidelines than<br />
those making $75,000 or more (34.5%).<br />
104
Overweight & Obesity<br />
Body weight, including being overweight or obese,<br />
is the result <strong>of</strong> lifestyle choices, genetics, and<br />
the environment. Health issues associated with<br />
excessive weight include Type 2 diabetes, cancer,<br />
hypertension, cardiovascular disease, dyslipidemia,<br />
stroke, liver or gallbladder disease, osteoarthritis,<br />
sleep apnea and respiratory problems, and<br />
gynecological problems (CDC: Overweight and<br />
Obesity, 2012). Weight-related health problems, in<br />
addition to those associated with aging, <strong>com</strong>pound<br />
the cost <strong>of</strong> health care. This is concerning given the<br />
projected increase in the older adult population<br />
(Fakhouri, Ogden, Carroll, Kit and Flegal, 2012).<br />
The Body Mass Index (BMI), an estimation <strong>of</strong><br />
total body fat calculated by the ratio <strong>of</strong> height to<br />
weight, determines weight status (see Table HR10).<br />
Overweight and obese are “ranges <strong>of</strong> weight that<br />
are greater than what is generally considered<br />
healthy for a given height” (CDC: Overweight and<br />
Obesity, 2012).<br />
Between 2007 and 2010, 34.6% <strong>of</strong> U.S. adults 65<br />
and older (over 8 million) were obese (Fakhouri,<br />
Ogden, et al, 2012). Of adults 65-74, 40.8% were<br />
obese; however, a much smaller percentage <strong>of</strong><br />
adults 75 and older (27.8%) were obese. No<br />
prevalence differences were noted by sex; however,<br />
differences were noted across sex by race/ethnicity.<br />
For example, significantly more non-Hispanic<br />
Black females 65 to 74 (53.9%) were obese than<br />
non-Hispanic White females (38.9%). Of females<br />
75 and older, significantly more non-Hispanic<br />
Black females (49.4%) were obese than either<br />
non-Hispanic White females (27.5%) or Hispanic<br />
females (30.2%; Fakhouri, Ogden, et al, 2012).<br />
In addition, the prevalence <strong>of</strong> obesity in females<br />
decreased with increases in education but only for<br />
females 65 to 74.<br />
Odgen, Carroll, Kit and Flegal’s (2012) study noted<br />
that over a third (35.7%) <strong>of</strong> U.S. adults and 17% <strong>of</strong><br />
youth in 2010 met the criteria for obesity. Although<br />
rates <strong>of</strong> obesity across sex did not differ, adults<br />
over 60 were more likely to be obese (39.7%) than<br />
adults 20-39 (32.6%) or 40-59 (36.6%). In addition,<br />
more women 60 and older (42.3%) were obese than<br />
women 20-39 (31.9%; Ogden et al., 2012, p. 2). The<br />
percentage <strong>of</strong> obesity in men did not differ across<br />
age; however, rates <strong>of</strong> obesity did differ across<br />
race/ethnicity (e.g., Non-Hispanic Blacks, Mexican<br />
American), in<strong>com</strong>e and education (Ogden, Lamb,<br />
Carroll, and Flegal, 2010) 5 .<br />
The prevalence <strong>of</strong> obesity among <strong>Nevada</strong> adults<br />
18 and older (24.5%) is less than in the nation as<br />
a whole (35.7%) but has increased from 22.4%<br />
in 2010 (CDC: Overweight and Obesity, 2012).<br />
In 2011, an estimated 18.1% <strong>of</strong> <strong>Nevada</strong> adults 65<br />
and older met the criteria for obesity, 41.7% were<br />
overweight, and 2.7% were underweight (see Table<br />
HR11). These percentages differ only minimally<br />
from 2007 BRFSS data, which showed 18% <strong>of</strong> older<br />
<strong>Nevada</strong>ns were obese and 43% were overweight<br />
(Elders Count <strong>Nevada</strong>, 2007).<br />
Although there were minimal differences noted<br />
among regions, 6% <strong>of</strong> older adults across all regions<br />
met the criteria for being underweight and less<br />
than 25% <strong>of</strong> older adults across all regions met the<br />
criteria for being obese. The highest percentages <strong>of</strong><br />
older adults categorized as underweight (5.7%) and<br />
as obese (24.2%) were found in the Rural/Frontier<br />
region. The highest percentage <strong>of</strong> older adults at a<br />
healthy weight (41.3%) was found in the Northern<br />
Urban/Metropolitan region (see Figure HR24).<br />
The highest percentage <strong>of</strong> overweight older adults<br />
(43.5%) was found in Southern Urban/Metropolitan<br />
region (CDC: BRFSS, 2011).<br />
Health Risks & Behaviors<br />
The prevalence <strong>of</strong> obesity increased among<br />
males from 1999 to 2010. Among males 65 to 74,<br />
prevalence increased from 31.6% in the 1999-2002<br />
study to 41.5% in the 2007-2010 study. In males 75<br />
and older, prevalence increased from 17.7% in the<br />
1999-2002 study to 26.5% in the 2007-2010 study.<br />
5<br />
Note that prevalence varied by sex for all three variables.<br />
105
Health Risks & Behaviors<br />
50%<br />
40%<br />
30%<br />
20%<br />
10%<br />
0%<br />
Fig. HR24: <strong>Nevada</strong> Adults, Age 65 and<br />
Older: Region by Weight Category<br />
Underweight Healthy Weight Overweight Obese<br />
Southern Urban/Metro<br />
Northern Urban/Metro<br />
Rural/Frontier<br />
(CDC: BRFSS, 2011)<br />
Interestingly, only minimal differences in weight<br />
category were associated with education or in<strong>com</strong>e.<br />
However, the percentage <strong>of</strong> older <strong>Nevada</strong>ns<br />
categorized as underweight and healthy weight<br />
did increase with age; the share <strong>of</strong> those who<br />
were overweight or obese decreased (see Figure<br />
HR25). An estimated 2.1% <strong>of</strong> adults 65-74 were<br />
underweight, 31.2% were a healthy weight,<br />
46.5% were overweight, and 20.3% were obese.<br />
An estimated 3.7% <strong>of</strong> older adults 75-84 were<br />
underweight, while 45.9% were a healthy weight,<br />
32.7% were overweight, and 17.7% were obese.<br />
Among the oldest <strong>Nevada</strong>ns (85+), a higher<br />
percentage were categorized as underweight<br />
(4.6%), while 55.9% were at a healthy weight,<br />
35.1% were overweight, and 4.4% were obese.<br />
Weight category differed by sex. An estimated<br />
49.6% <strong>of</strong> older males in <strong>Nevada</strong> were overweight,<br />
and 16.8% were obese. An estimated 34.5% <strong>of</strong><br />
female respondents were overweight and 19.3%<br />
were obese (see Figure HR26). A greater percentage<br />
<strong>of</strong> older females than males met the criteria for<br />
being underweight (4.6%) or a healthy weight<br />
(41.6%).<br />
Fig. HR26: <strong>Nevada</strong> Adults, Age 65 and<br />
Older: Sex by Weight Category<br />
4.6%<br />
0.6%<br />
41.6%<br />
33.0%<br />
49.6%<br />
34.5%<br />
(CDC: BRFSS, 2011)<br />
19.3%<br />
16.8%<br />
Underweight Healthy Weight Overweight Obese<br />
Male<br />
Female<br />
60%<br />
50%<br />
40%<br />
30%<br />
20%<br />
10%<br />
0%<br />
Fig. HR25: <strong>Nevada</strong> Adults, Age 65 and<br />
Older: Age by Weight Category<br />
65-74 75-84 85 and Older<br />
Underweight Healthy Weight Overweight Obese<br />
(CDC: BRFSS, 2011)<br />
106
Cholesterol & Blood Pressure<br />
Hyperlipidemia (high blood cholesterol) and<br />
hypertension (high blood pressure) are associated<br />
with heart attack, stroke and cardiovascular disease.<br />
In 2010, heart disease was the leading cause <strong>of</strong><br />
death, and stroke was the fourth-leading cause<br />
among U.S. adults 65 and older (Murphy, Xu, &<br />
Kochanek, 2012). Among <strong>Nevada</strong> adults in 2009,<br />
heart disease was the leading cause <strong>of</strong> death,<br />
stroke was the fifth-leading cause, and essential<br />
hypertension or hypertension-related renal disease<br />
was 17th (Kochanek, Xu, Murphy, Minino, & Kung,<br />
2011). In 2010, an estimated 5% <strong>of</strong> <strong>Nevada</strong>ns 18<br />
and older had been told they had suffered a heart<br />
attack, 4% had been advised they had angina or<br />
coronary-artery disease, and 3.1% had suffered<br />
a stroke (CDC: BRFSS, Prevalence and Trends,<br />
Cardiovascular, n.d.).<br />
Among <strong>Nevada</strong> adults 65 and older, an estimated<br />
94.7% have had their cholesterol checked at least<br />
once in their lifetime (see Table HR12), 92.7% have<br />
had it checked in the past five years (see Table<br />
HR13), and 54% have been told their cholesterol<br />
levels are high (see Table HR14). Younger members<br />
<strong>of</strong> this population were more likely to have had<br />
their cholesterol checked than older members. The<br />
wealthier were also more likely (see Figure HR27<br />
and HR28).<br />
Fig. HR27: <strong>Nevada</strong> Adults, Age 65 and<br />
Older: Have had Cholesterol Checked in<br />
96.5%<br />
Lifetime<br />
92.0%<br />
90.4%<br />
Health Risks & Behaviors<br />
While genetics may predispose individuals to high<br />
cholesterol and high blood pressure, lifestyle habits<br />
such as exercise and a healthy diet, coupled with<br />
medication, may improve health out<strong>com</strong>es. The<br />
American Heart Association (AHA) re<strong>com</strong>mends<br />
that adults have their cholesterol checked at least<br />
every five years and more <strong>of</strong>ten if<br />
• Total cholesterol is 200 mg/dL or more<br />
• Males older than 45 or females older than 50<br />
• HDL (good) cholesterol is less than 40 mg/dL<br />
• Other risk factors are present for heart disease<br />
and stroke (AHA, 2012, para. #7)<br />
In the United States, 79.2% <strong>of</strong> adults 18 and older<br />
said they’d had their cholesterol checked at least<br />
once, 75.5% said they’d had it checked in the past<br />
five years. Nearly 40% had been advised that their<br />
cholesterol was high (CDC BRFSS: Cholesterol<br />
Awareness, 2011). Fewer <strong>Nevada</strong> adults 18 and<br />
older had ever had their cholesterol checked<br />
(76.5%) or had had it checked in the past five years<br />
(71.5%). About the same percentage had been told<br />
that their cholesterol was high.<br />
93.6%<br />
65-74 75-84 85 and Older<br />
(CDC: BRFSS, 2011)<br />
Fig. HR28: <strong>Nevada</strong> Adults 65 and<br />
Older: In<strong>com</strong>e by Had Cholesterol<br />
Checked in Lifetime<br />
92.7%<br />
< $15K $15K -<br />
$24,999<br />
94.2%<br />
$25K -<br />
$34,999<br />
96.2% 96.4%<br />
$35K -<br />
$49,999<br />
(CDC: BRFSS, 2011)<br />
$50K -<br />
$74,999<br />
99.3%<br />
$75K and<br />
Higher<br />
The percentage <strong>of</strong> older adults who had a check for<br />
cholesterol in the past five years also increased along<br />
with in<strong>com</strong>e (see Table HR14 and Figure HR29).<br />
Fewer older adults earning $15,000 to $24,999<br />
(89.7%) reported having had a check in the past five<br />
years than those earning $75,000 or more (98.5%).<br />
Several factors could explain these differences: 1)<br />
lack <strong>of</strong> information and awareness among people<br />
with lower in<strong>com</strong>es; 2) lack <strong>of</strong> access to health<br />
care; and 3) fewer resources to pay for cholesterol<br />
screenings. Only minimal differences occurred<br />
across region, sex, race/ethnicity, or education<br />
(CDC: BRFSS, 2011).<br />
107
Health Risks & Behaviors<br />
Fig. HR29: <strong>Nevada</strong> Adults Age 65 and<br />
Older: In<strong>com</strong>e by Cholesterol Check in<br />
Past Five Years<br />
90.2% 89.7%<br />
< $15K $15K -<br />
$24,999<br />
94.1%<br />
$25K -<br />
$34,999<br />
95.8% 96.1%<br />
$35K -<br />
$49,999<br />
(CDC: BRFSS, 2011)<br />
As indicated previously, health pr<strong>of</strong>essionals<br />
advised an estimated 54% <strong>of</strong> <strong>Nevada</strong> adults 65<br />
and older that they had high cholesterol (see Table<br />
HR14). Among older adults having high cholesterol,<br />
minimal percentage differences existed by region,<br />
sex, race/ethnicity, education or in<strong>com</strong>e. However,<br />
a higher percentage <strong>of</strong> adults 65-74 (61.0%) were<br />
told they had high cholesterol than adults age 75-84<br />
(45.4%) or those 85 and older (31.7%, see Figure<br />
HR30).<br />
(CDC: BRFSS, 2011)<br />
$50K -<br />
$74,999<br />
Fig. HR30: <strong>Nevada</strong> Adults, Age 65 and<br />
Older: Age by Told They Have High<br />
61.0% Cholesterol<br />
45.4%<br />
31.7%<br />
65-74 75-84 85 and Older<br />
98.5%<br />
$75K and<br />
Higher<br />
Between 2005 and 2008, more than a third <strong>of</strong><br />
U.S. adults 20 and older (33.5% or approximately<br />
76 million) had hypertension (National Health<br />
and Nutrition Examination Survey, 2005-2008, in<br />
Roger et al, 2012). Of these, approximately 80%<br />
were aware <strong>of</strong> their condition, 71% were under<br />
medication-therapy management, and 48% had<br />
controlled hypertension (Roger et al, 2012, p. e3).<br />
By 2011, 30.8% <strong>of</strong> U.S. and <strong>Nevada</strong> adults 18 and<br />
older had learned they had hypertension (CDC<br />
BRFSS: Hypertension Awareness, 2011).<br />
An estimated 61.2% <strong>of</strong> <strong>Nevada</strong> adults 65 and older<br />
had been told they had hypertension (see Table<br />
HR15, CDC: BRFSS, 2011). The percentage <strong>of</strong><br />
respondents reporting hypertension varied only<br />
minimally by region, age, sex, or race/ethnicity.<br />
However, a higher percentage <strong>of</strong> older adults with<br />
less than a high school education (76.3%) reported<br />
having hypertension than those with a college<br />
education (54.6%; see Figure HR31).<br />
Fig. HR31: <strong>Nevada</strong> Adults, Age 65 and<br />
Older: Education by Hypertension<br />
76.3%<br />
61.5%<br />
(CDC: BRFSS, 2011)<br />
The prevalence <strong>of</strong> reported hypertension decreased<br />
with in<strong>com</strong>e (see Figure HR32). For example, the<br />
lowest percentage <strong>of</strong> respondents reporting a<br />
diagnosis <strong>of</strong> hypertension (43.1%) earned $75,000<br />
or more per year. Among those earning less than<br />
$35,000 per year, the rates ranged from 66.5% to<br />
75.2%.<br />
(CDC: BRFSS, 2011)<br />
56.4% 54.6%<br />
Less than H.S. H.S. or G.E.D. Some Post H.S. College Graduate<br />
75.2%<br />
Fig. HR32: <strong>Nevada</strong> Adults, Age 65 and<br />
Older: In<strong>com</strong>e by Hypertension<br />
66.5%<br />
< $15K $15K -<br />
$24,999<br />
71.7%<br />
$25K -<br />
$34,999<br />
58.7% 58.9%<br />
$35K -<br />
$49,999<br />
$50K -<br />
$74,999<br />
43.1%<br />
$75K to<br />
Higher<br />
108
Influenza & Pneumonia Vaccinations<br />
The flu and secondary <strong>com</strong>plications such as<br />
bacterial pneumonia are more likely to occur in<br />
adults 65 and older due to typically weaker immune<br />
systems (CDC: Seasonal Influenza, 2012). At<br />
particular risk are older adults with other medical<br />
conditions such as diabetes, cancer, kidney, lung,<br />
or heart problems (IFPMA, 2012). An estimated<br />
90% <strong>of</strong> flu-related deaths and 60% <strong>of</strong> flu-related<br />
hospitalizations occur in older adults (CDC:<br />
Seasonal Influenza, 2012). In 2010, influenza and<br />
pneumonia ranked as the seventh-most-<strong>com</strong>mon<br />
cause <strong>of</strong> death among U.S. adults 65 and older<br />
(Murphy, Xu, & Kochanek, 2012). The same was<br />
true in <strong>Nevada</strong> a year earlier (Kochanek, Xu,<br />
Murphy, Minino, & Kung, 2011).<br />
Fortunately, the probability <strong>of</strong> incurring these<br />
illnesses can be reduced with annual vaccinations.<br />
The CDC re<strong>com</strong>mends routine annual flu<br />
vaccinations prior to flu season for all persons<br />
at least six months <strong>of</strong> age. In addition, the CDC<br />
re<strong>com</strong>mends that adults 65 and older receive the<br />
pneumococcal polysaccharide vaccine (PPSV23)<br />
for prevention <strong>of</strong> pneumococcal pneumonia (CDC:<br />
Vaccines & Immunizations, 2012). In time for<br />
the 2012-2013 influenza season, San<strong>of</strong>i Pasteur,<br />
Inc. released Fluzone, a higher-dose flu vaccine<br />
<strong>com</strong>posed <strong>of</strong> three flu strains specially formulated<br />
for older adults’ reduced immune response (CDC:<br />
Seasonal Flu, 2012).<br />
Of those who reported having had a flu shot<br />
in the past year, only minimal differences were<br />
noted by region, age, sex, race/ethnicity, education<br />
or in<strong>com</strong>e. For example, a slight increase in the<br />
percentage <strong>of</strong> adults having had the flu shot<br />
occurred with increases in age (see HR33).<br />
Fig. HR33: <strong>Nevada</strong> Adults, Age 65 and<br />
Older: Age by Had Flu Shot in Past Year<br />
52.4% 53.6%<br />
(CDC: BRFSS, 2011)<br />
63.2%<br />
65-74 Years 75-84 Years 85 and older<br />
As with flu shots, the percentage <strong>of</strong> older adults<br />
who’d had a pneumonia vaccine differed only<br />
modestly across age, sex, race/ethnicity, education<br />
or in<strong>com</strong>e. The percentage <strong>of</strong> older adults having<br />
had the vaccine increased slightly with increases<br />
in age (see Figure HR34). This is good because<br />
increased age is associated with increased<br />
vulnerability to serious pneumonia-related health<br />
<strong>com</strong>plications. In addition, less than half (49.8%) <strong>of</strong><br />
Hispanic and 70.8% <strong>of</strong> White respondents reported<br />
having had the pneumonia vaccine. Nearly 64% <strong>of</strong><br />
older adults with less than a high school education<br />
reported getting the vaccine.<br />
Health Risks & Behaviors<br />
In 2011, 61.3%<strong>of</strong> U.S. adults 65 and older had<br />
received a flu shot within the past year, and<br />
70% (median percentage) had had at least one<br />
pneumonia vaccination (CDC: BRFSS, Prevalence<br />
and Trends: Immunization, 2011). The percentage<br />
<strong>of</strong> immunizations among <strong>Nevada</strong>’s older adults<br />
was lower. According to BRFSS 2011 results, an<br />
estimated 53.7% <strong>of</strong> adults 65 and older had received<br />
a flu shot in the year prior to the survey (see Table<br />
HR16), and an estimated 68.8% had received a<br />
pneumonia vaccination at some time in their lives<br />
(see Table HR18, CDC: BRFSS, 2011).<br />
Fig. HR34: <strong>Nevada</strong> Adults, Age 65 and<br />
Older: Had the Pneumonia Vaccine<br />
74.8%<br />
64.0%<br />
(CDC: BRFSS, 2011)<br />
83.0%<br />
65-74 Years 75-84 Years 85 and Older<br />
109
Health Risks & Behaviors<br />
Cancer Screenings<br />
In 2010 cancer was the second-leading cause <strong>of</strong><br />
death in the United States among adults 65 and<br />
older (Murphy, Xu, & Kochanek, 2012). The same<br />
was true among <strong>Nevada</strong>ns 18 and older in 2009<br />
(Kochanek, Xu, Murphy, Minino, & Kung, 2011).<br />
In the general population, the following estimates<br />
exist about the <strong>of</strong> risk diagnosis with various cancers<br />
(American Cancer Society, 2012):<br />
• 1 in 8 women will be diagnosed with invasive<br />
breast cancer at some point in their lives, and 1<br />
in 36 will die <strong>of</strong> the disease (American Cancer<br />
Society, Breast Cancer, 2012).<br />
• 1 in 71 women will be diagnosed with invasive<br />
ovarian cancer in their lifetime, and 1 in 95 will<br />
die from the disease (American Cancer Society,<br />
Ovarian Cancer, 2012).<br />
• 1 in 20 will develop colorectal cancer during<br />
their lifetime (American Cancer Society,<br />
Colorectal Cancer, 2012).<br />
• 1 in 6 men will be diagnosed with prostate<br />
cancer in their lifetime, and 1 in 36 will die from<br />
the disease (American Cancer Society, Prostate<br />
Cancer, 2012).<br />
An estimated 65.2% <strong>of</strong> U.S. adults 50 and older<br />
and 61.5% <strong>of</strong> <strong>Nevada</strong> adults in the same age<br />
range indicated that they had undergone another<br />
type <strong>of</strong> colorectal-cancer screening called a<br />
sigmoidoscopy or colonoscopy (CDC: BRFSS,<br />
Prevalence and Trends – Colorectal Cancer, 2011).<br />
Among <strong>Nevada</strong> adults 65 and older, an estimated<br />
67.6% had a sigmoidoscopy or colonoscopy (see<br />
Table HR20, CDC: BRFSS, 2011). Only minor<br />
differences in percentages were noted across region,<br />
age, sex, race/ethnicity and education. However,<br />
the percentage <strong>of</strong> those having had this type <strong>of</strong><br />
colorectal cancer screening was lower among those<br />
older adults earning less than $15,000 per year<br />
(55.2%) than among those earning $75,000 or more<br />
(77.2%; see Figure HR35).<br />
Fig. HR35: <strong>Nevada</strong> Adults, Age 65 and<br />
Older: Had Sigmoidoscopy or Colonoscopy<br />
55.2% 56.0%<br />
< $15,000 $15,000 to<br />
$24,999<br />
76.5% 74.4% 74.6% 77.2%<br />
$25,000 to<br />
$34,999<br />
$35,000 to<br />
$49,999<br />
(CDC: BRFSS, 2010)<br />
$50,000 to<br />
$74,999<br />
$75,000+<br />
110<br />
Early detection and treatment <strong>of</strong> precancerous and<br />
cancerous cells can help in the prevention and<br />
treatment <strong>of</strong> cancer. For example, the 2.3% per<br />
year decrease in breast-cancer mortality since 1990<br />
has been partially attributed to mammographic<br />
screening, particularly among women 60-69<br />
[U.S. Preventive Services Task Force (USPSTF):<br />
Breast Cancer Screening, 2012)]. Based on metaanalysis<br />
<strong>of</strong> current research the USPSTF provided<br />
to Congress, the following cancer-screening<br />
re<strong>com</strong>mendations exist for adults with no current<br />
signs or symptoms.<br />
In the 2010 BRFSS survey, an estimated 17.2%<br />
<strong>of</strong> U.S. and <strong>Nevada</strong> adults 50 and older reported<br />
having had a blood-stool screening for colorectal<br />
cancer within the past two years (CDC: BRFSS,<br />
Prevalence and Trends – Colorectal Cancer, 2011).<br />
Among <strong>Nevada</strong> adults 65 and older, 21.2% reported<br />
having had the colorectal screening (see Table<br />
HR19, CDC: BRFSS, 2010). Only minor differences<br />
in percentages were noted across region, age, sex,<br />
race/ethnicity, education or in<strong>com</strong>e.<br />
In 2010, an estimated 53.2% (median percent)<br />
<strong>of</strong> U.S. and 51.8% <strong>of</strong> <strong>Nevada</strong> males 40 and older<br />
reported having had a prostate cancer (PSA) test<br />
(CDC: BRFSS, Prevalence and Trends – Prostate<br />
Cancer, 2011). Among <strong>Nevada</strong> adults 65 and<br />
older, a much higher percentage (75.5%) reported<br />
having had a PSA test (see Table HR21, CDC:<br />
BRFSS, 2011). Only minor percentage differences<br />
were noted across region, age, sex, education or<br />
in<strong>com</strong>e. One issue is that rates <strong>of</strong> prostate cancer<br />
vary based on race/ethnicity. For example, in 2008,<br />
Black men in the United States had the highest<br />
rates <strong>of</strong> prostate cancer followed by Whites and<br />
then Hispanics (CDC: Prostate Cancer, 2012).<br />
Unfortunately, minority-population samples for this<br />
item in the 2011 BRFSS for <strong>Nevada</strong> were insufficient<br />
to maintain reliability; therefore, no data analysis<br />
was <strong>com</strong>pleted. Given the importance <strong>of</strong> this<br />
information and the rising numbers <strong>of</strong> minorities<br />
in <strong>Nevada</strong>, future survey methods should strive<br />
to increase the response rates among <strong>Nevada</strong>’s<br />
minority populations.
An estimated 81.3% (median percent) <strong>of</strong> U.S.<br />
females and 78.4% <strong>of</strong> <strong>Nevada</strong> females 18 and<br />
older reported having had a Pap test between<br />
2007 and 2010 to screen for uterine cancer (CDC:<br />
BRFSS, Prevalence and Trends – Women’s Health,<br />
2011). Unfortunately, the 2010 BRFSS did not ask<br />
a question about Pap tests, specifically, to women<br />
50 or older, and no data were available regarding<br />
Pap screening from the 2011 survey. In a recent<br />
qualitative and quantitative study, Leach and<br />
Schoenberg (2007) noted that 84.7% <strong>of</strong> women<br />
55 and older reporting having had a Pap cervical<br />
screening test within the past three years. This<br />
percentage, while high, is lower than the Healthy<br />
People 2020 goal <strong>of</strong> 93% for women 21-65. Barriers<br />
to obtaining Pap examinations included living<br />
alone, living in a rural area, or being older. These<br />
considerations may be important for older <strong>Nevada</strong><br />
females residing in the Rural/Frontier regions <strong>of</strong> the<br />
state.<br />
In addition, in 2010 an estimated 77.9% (median<br />
percent) <strong>of</strong> U.S. females 50 and older and 69.9%<br />
<strong>of</strong> <strong>Nevada</strong> females in the same age group reported<br />
having had a mammogram in the past two years.<br />
Among <strong>Nevada</strong> females 65 and older, an estimated<br />
70.4% reported having had a mammogram in the<br />
two years prior to the 2010 survey (see Table HR22;<br />
CDC: BRFSS, 2010).<br />
Fig. HR36: <strong>Nevada</strong> Females, Age 65 and<br />
Older: Education by Mammography in<br />
Past Two Years<br />
49.7%<br />
69.3% 72.3%<br />
(CDC: BRFSS, 2010)<br />
In addition to differences associated with education,<br />
fewer females earning less than $24,999 reported<br />
having had a mammogram in the past two years<br />
than those earning $75,000 or more (see Figure<br />
HR37). These differences (lower percentages<br />
associated with less education and lower in<strong>com</strong>e)<br />
might be a consequence <strong>of</strong> differences in access to<br />
health care, ability to pay for the cancer screening,<br />
or medical insurance that would cover the cost.<br />
(CDC: BRFSS, 2010)<br />
79.8%<br />
Less than H.S. H.S. or G.E.D. Some Post H.S. College Graduate<br />
Fig. HR37: <strong>Nevada</strong> Females, Age 65 and<br />
Older: In<strong>com</strong>e by Mammography in<br />
Past Two Years<br />
66.6%<br />
61.5%<br />
< $15,000 $15,000 to<br />
$24,999<br />
56.2%<br />
$25,000 to<br />
$34,999<br />
74.5%<br />
$35,000 to<br />
$49,999<br />
83.1%<br />
$50,000 to<br />
$74,999<br />
87.9%<br />
$75,000+<br />
Health Risks & Behaviors<br />
The percentage <strong>of</strong> females who’d had a<br />
mammogram differed by education (see Figure<br />
HR36) and in<strong>com</strong>e (see Figure HR37). Far fewer<br />
older females with less than a high school education<br />
reported having had mammography (49.7%) than<br />
those with a college education (79.8%).<br />
Again, the minority sample sizes for this BRFSS<br />
item were too small for reliable analysis. Given<br />
that breast cancer rates in Black and Hispanic<br />
women are almost as high as those found in White<br />
women (CDC: Breast Cancer, 2012), it is imperative<br />
that future surveys capture data among <strong>Nevada</strong>’s<br />
minority female populations.<br />
111
Health Risks & Behaviors<br />
HIV/AIDS & Other Sexually Transmitted Diseases<br />
Human Immunodeficiency Virus (HIV), a sexually<br />
transmitted virus that attacks the immune<br />
system, was first diagnosed in the United States<br />
approximately 31 years ago. Initially, progression<br />
from HIV to Acquired Immunodeficiency Syndrome<br />
(AIDS) with full immune collapse and death took<br />
approximately 10 years. However, the recent<br />
development <strong>of</strong> HIV medication regimens (e.g.,<br />
Highly Active Antiretroviral Therapy) has mitigated<br />
the progression, increasing life expectancy to more<br />
than 30 years [see Figure HR38, Administration on<br />
Aging (AOA) Positive Aging: HIV Webinar, 2011;<br />
Karpiak, 2011).<br />
Fig. HR38: Median Life Years at Age 20 with<br />
HIV and in Care<br />
2<br />
4<br />
24.3<br />
27.1<br />
33.2<br />
Explanations for the increase in HIV among older<br />
adults include older adults’ lack <strong>of</strong> information and<br />
awareness about HIV risk factors; this may lead to<br />
unprotected sexual activity (Karpiak, 2011). The<br />
increase in illicit substance use among adults 50 and<br />
older also may put them at risk for HIV. The stigma<br />
associated with HIV infection may result in delayed<br />
testing in older adults. This might also cause medical<br />
personal to misinterpret HIV symptoms (e.g., fatigue,<br />
frequent illnesses, weight loss) as issues related to<br />
age (CDC: HIV/AIDS among Persons, 2008).<br />
HIV/AIDS prevention and treatment interventions<br />
generally are not targeted toward older adults<br />
because <strong>of</strong> the biased belief that this population is<br />
not sexually active and therefore not at risk. Yet HIV<br />
would leave seniors more susceptible to diseases<br />
normally associated with aging, such as cancer,<br />
cardiovascular disease, osteoporosis, liver disease,<br />
kidney disease and diabetes (Karpiak, 2011).<br />
112<br />
1985-87 1990-92 1995-97 2000-2002 2003-2005<br />
(AOA Webinar, Karpiak, 2011)<br />
By 2010, more than 1.1 million U.S. individuals<br />
13 and older had acquired HIV (CDC: HIV/AIDS,<br />
Statistics, 2012); and by 2015, half <strong>of</strong> all U.S. adults<br />
infected with HIV will be 50 or older (Effros,<br />
Fletcher, Gebo, et al., 2008). In 2010 an estimated<br />
7,797 new cases <strong>of</strong> HIV were diagnosed among<br />
adults 50 and older with 7,908 new diagnoses <strong>of</strong><br />
AIDS (see Figure HR39 and Table HR23; CDC:<br />
HIV/AIDS, Statistics, 2012). Translated, this means<br />
that roughly 1 in 6 new diagnoses for HIV annually<br />
occur in adults 50 and older (Karpiak, 2011).<br />
Under 13<br />
13-14 Years<br />
15-19 Years<br />
20-24 Years<br />
25-29 Years<br />
30-34 Years<br />
35-39 Years<br />
40-44 Years<br />
45-49 Years<br />
50-54 Years<br />
55-59 Years<br />
60-64 Years<br />
65 or Older<br />
Fig. HR39: U.S., 2010: Estimated Number <strong>of</strong> HIV/AIDS<br />
Diagnoses<br />
0 1,000 2,000 3,000 4,000 5,000 6,000 7,000 8,000<br />
(CDC: HIV Statistics, 2012)<br />
AIDS<br />
HIV<br />
Another important consequence <strong>of</strong> HIV/AIDS<br />
in older adults is the increased risk <strong>of</strong> isolation<br />
and loneliness. Karpiak (2011) noted that 70% <strong>of</strong><br />
older adults with HIV live alone and that the most<br />
frequent co-occurring condition is depression. This<br />
is significant, considering that depression impacts<br />
health out<strong>com</strong>es and is negatively correlated with<br />
adherence to medication regimens, including a<br />
regimen for HIV.<br />
The rate <strong>of</strong> AIDS diagnoses among all <strong>Nevada</strong>ns in<br />
2010 (12.6 per 100,000) was lower than the national<br />
rate [13 per 100,000; CDC: National Center for HIV/<br />
AIDS, Viral Hepatitis, STD, and TB Prevention<br />
(NCHHSTP) Atlas, 2012). However, among adults 55<br />
and older, the rate <strong>of</strong> AIDS diagnoses for <strong>Nevada</strong>ns<br />
(6.3 per 100,000) was higher than the national rate<br />
(5.4 per 100,000).<br />
Among <strong>Nevada</strong> adults 65 and older, 325 were<br />
living with HIV/AIDS in 2011 and six were newly<br />
diagnosed with HIV infection [<strong>Nevada</strong> State Health<br />
Division HIV/AIDS Reporting System (eHars), 2012).<br />
The rate <strong>of</strong> new HIV diagnoses in 2011 was 1.8 per<br />
100,000. The rate for those living with HIV/AIDS was<br />
98.2 per 100,000 (see Table HR25).
Of older <strong>Nevada</strong> adults living with HIV/AIDS, the<br />
vast majority (an estimated 80.3%) reside in the<br />
Southern Urban/Metropolitan region <strong>of</strong> the state;<br />
12.3% live in the Northern Urban/Metropolitan<br />
region; 7.4% live in Rural/Frontier regions (see Table<br />
HR26, eHars, 2012). In addition, the majority are<br />
males (85.5%) age 65-74 (86.8%) and White (68.9%).<br />
The primary method <strong>of</strong> HIV transmission among<br />
older males was male-to-male sexual (MSM) contact<br />
(73.0%), followed by cases with no identifiable or<br />
reported risk factor (11.2%). An estimated 8.3%<br />
<strong>of</strong> transmissions occurred by drug injection and<br />
4% through heterosexual contact. Alternatively,<br />
the primary method <strong>of</strong> transmission among older<br />
females was heterosexual contact (78.7%) with<br />
12.8% by drug injection and 8.5% having no<br />
identifiable or reported risk factor (see Figure HR40).<br />
Fig. HR40: <strong>Nevada</strong> Adults, Age 65 and Older:<br />
Primary Method <strong>of</strong> HIV Transmission<br />
No Identified/Reported Risk 8.5%<br />
11.2%<br />
Transfusion/Hemophilia<br />
0.4%<br />
Heterosexual contact<br />
4.0%<br />
78.7%<br />
MSM+IDU<br />
3.2%<br />
Injection Drug use (IDU)<br />
12.8%<br />
8.3%<br />
Male-to-Male Sexual Contact (MSM)<br />
73.0%<br />
0% 20% 40% 60% 80%<br />
Females Males<br />
(eHars, 2012)<br />
In addition to HIV/AIDS, sexually transmitted<br />
diseases (STDs) are a major public health concern<br />
for adolescents and young adults (CDC: Fact Sheet,<br />
2011). Diseases such as chlamydia, gonorrhea<br />
and syphilis may be under-reported and underdiagnosed<br />
(CDC: Fact Sheet, 2011, para 1). When<br />
untreated, STDs such as the Human papillomavirus<br />
(HPV) may be associated with cervical cancer, while<br />
others (e.g., chlamydia and gonorrhea) may lead<br />
to infertility or even, in the case <strong>of</strong> syphilis, death.<br />
Unfortunately, the same biases surrounding older<br />
adults and HIV/AIDS also exist with older adults and<br />
STDs. For example, a meta-analysis <strong>of</strong> STD-riskreduction<br />
clinical trials between 1994 and 2005 noted<br />
the exclusion <strong>of</strong> older adults (65 and older) from 89%<br />
<strong>of</strong> the clinical trials (Levy, Ding, Lakra, Kosteas, &<br />
Niccolai, 2007).<br />
Listed below are rates 6 <strong>of</strong> sexually transmitted<br />
disease cases among <strong>Nevada</strong> adults 65 and older<br />
in 2011 [see Table HR27) <strong>Nevada</strong> State Health<br />
Division, Sexually Transmitted Disease Management<br />
Information Systems (STD*MIS), 2012].<br />
• Chlamydia 3.9<br />
• Gonorrhea 1.8<br />
• Primary/Secondary Syphilis 1.2<br />
• Early Latent Syphilis 0.3<br />
Of the 22 <strong>Nevada</strong> cases <strong>of</strong> STDs in adults 65 and<br />
older diagnosed in 2011, the percentages for all<br />
were higher for males than for females (see Figure<br />
HR41). While 22 cases may seem inconsequential,<br />
this should still be <strong>of</strong> concern for this particular<br />
population. In addition, rates <strong>of</strong> chlamydia,<br />
gonorrhea and primary and secondary syphilis were<br />
higher among older <strong>Nevada</strong> males <strong>com</strong>pared with<br />
U.S. males (CDC: Division <strong>of</strong> STD Prevention, 2012).<br />
The rate <strong>of</strong> people <strong>of</strong> gonorrhea in older <strong>Nevada</strong><br />
females (0.6 per 100,000) also was slightly higher<br />
than found nationally (0.4 per 100,000), but the rate<br />
<strong>of</strong> chlamydia nationally (2.1 per 100,000) was higher<br />
than in older <strong>Nevada</strong> females (1.7 per 100,000; see<br />
Figure HR 42).<br />
76.9%<br />
23.1%<br />
Chlamydia<br />
(n=13)<br />
Fig. HR41: <strong>Nevada</strong> Adults, Age 65 and Older:<br />
STD Cases, 2011<br />
83.3%<br />
16.7%<br />
Gonorrhea<br />
(n=6)<br />
100.0% 100.0%<br />
P&S Syphilis<br />
(n=2)<br />
(STD*MIS, 2012)<br />
0.0% 0.0%<br />
EL Syphilis<br />
(n=1)<br />
Fig. HR42: U.S. and <strong>Nevada</strong> Adults, Age 65<br />
and Older: Rates <strong>of</strong> STD Cases per 100,000,<br />
2011<br />
3.3<br />
2.1<br />
6.7<br />
1.7<br />
2.8<br />
3.3<br />
0.4 0.6<br />
0.8<br />
(CDC: Division <strong>of</strong> STD Prevention, 2012)<br />
Male<br />
Female<br />
1.3<br />
0 0<br />
U.S <strong>Nevada</strong> U.S <strong>Nevada</strong> U.S <strong>Nevada</strong><br />
Chlamydia Gonorrhea P&S Syphilis<br />
Male<br />
Female<br />
Health Risks & Behaviors<br />
6<br />
Rates are per 100,000.<br />
113
Health Risks & Behaviors<br />
Falls & Fall-Related Injuries<br />
Aging is associated with physical changes that<br />
decrease motor stability and increase the chance for<br />
falls and fall-related injuries. Decreases in muscle<br />
mass and degeneration in load-bearing joints<br />
are associated with reductions in overall str<strong>eng</strong>th<br />
and decreased ability to move without assistance.<br />
Impairments in sensory abilities such as vision and<br />
hearing decrease an adult’s ability to recognize<br />
navigation cues. Vision deficits such as cataracts,<br />
presbyopia, and loss <strong>of</strong> night vision make it more<br />
difficult for older adults to recognize and avoid<br />
objects in their path. Hearing loss can directly affect<br />
postural balance and awareness <strong>of</strong> the environment<br />
or indirectly affect an elder’s ability to attend to<br />
environmental cues (Lin & Ferrucci, 2012). A recent<br />
study <strong>of</strong> adults 40-69 noted an association between<br />
even mild hearing loss and an increase in reported<br />
falls (Lin & Ferrucci, 2012).<br />
Twenty to 30% <strong>of</strong> falls by older adults are associated<br />
with moderate-to-severe injuries (CDC: Home<br />
and Recreational Safety-Falls, 2012). Falls can lead<br />
to injuries such as head trauma (TBI), lacerations,<br />
contusions, hip and other fractures, strains/sprains,<br />
hematomas and early death. In 2006 the annual<br />
fall-related fatality rate among U.S. adults 65 and<br />
older was 38.02 per 100,000. For <strong>Nevada</strong> seniors the<br />
rate was 27.22 (see Figure HR44 and Figure HR45,<br />
CDC: WISQARS, Fatal Injury Mapping, 2000-2006).<br />
As indicated in HR45, fall-related death rates were<br />
available only for the Northern and Southern Urban<br />
Metropolitan areas <strong>of</strong> the state.<br />
Fig. HR44: 2000-2006, United States, Death Rates per 100,000:<br />
Falls, Unintentional, Ages 65 and Older, Annualized Crude Rate,<br />
38.02 per 100,000<br />
In 2011, unintentional falls were the leading<br />
cause <strong>of</strong> nonfatal injury among U.S. adults 65 and<br />
older. Falls accounted for 62.9% <strong>of</strong> all nonfatal<br />
injuries (see Figure HR43 and Table HR28; CDC:<br />
WISQARS, 10 Leading Causes, 2012). More than<br />
2 million fall-related injuries led to emergency<br />
department visits (CDC: WISQARS, Unintentional<br />
falls, 2012). However, the number <strong>of</strong> falls among<br />
older adults may actually be underestimated. Even<br />
though 1 in 3 older adults fall each year, very few<br />
incidences are reported to medical providers (CDC:<br />
Home and Recreational Safety-Falls, 2012).<br />
Fig. HR43: U.S. Adults, Age 65 and Older: Ten<br />
Leading Causes <strong>of</strong> Nonfatal Injury<br />
(CDC: WISQARS, Fatal Injury Report, 2000-2006)<br />
Fig. HR45: 2000-2006, <strong>Nevada</strong>, Death Rates per 100,000:<br />
Falls, Unintentional, 65 and Older, Annualized Crude Rate,<br />
27.22 per 100,000<br />
All Others<br />
Unintentional Unk/Unspecified<br />
Unintentional Other Transport<br />
Unintentional Other Specified<br />
Unintentional Other Bite/Sting<br />
Unintentional Poisoning<br />
Unintentional Cut/Pierce<br />
Unintentional MV-Occupant<br />
Unintentional Overexertion<br />
Unintentional Struck By/Against<br />
Unintentional Fall<br />
Overall Injuries<br />
5.6<br />
1.5<br />
1.7<br />
2.0<br />
2.5<br />
2.5<br />
3.9<br />
5.1<br />
5.3<br />
7.1<br />
62.9<br />
100.0<br />
(CDC: WISQARS, 10 Leading Causes, 2011)<br />
(CDC: WISQARS, Fatal Injury Report, 2000-2006)<br />
114
In 2007, 107 <strong>Nevada</strong> adults 65 and older died from<br />
injuries related to a fall. Of these, 48 were White<br />
males and 50 were White females. Also in 2007, the<br />
<strong>Nevada</strong> annualized death rate due to fall-related<br />
injuries was 36.8 per 100,000 older adults (CDC:<br />
WISQARS, Fatal Injury Mortality Report, 2007). That<br />
same year, the national fall-related death rate among<br />
older adults was 48.5 per 100,000 (see Table HR<br />
29, CDC: WISQARS, Fatal Injury Mortality Report,<br />
2007).<br />
Elder Abuse, Neglect & Exploitation<br />
According to the U.S. Administration on Aging<br />
(AoA) National Center on Elder Abuse (NCEA),<br />
no nationally accepted definition exists for elder<br />
abuse/mistreatment. All state-law definitions cover<br />
three basic categories <strong>of</strong> abuse: “domestic elder<br />
abuse, institutional elder abuse, self-neglect or<br />
self-abuse” (AOA: NCEA, 2012, para. #2). Domestic<br />
elder abuse includes abuse instigated by a person<br />
in a relationship with the elder and in the elder’s<br />
home (or the caregiver’s home). Perpetrators <strong>of</strong><br />
domestic elder abuse include family members,<br />
friends and caregivers. Institutional abuse occurs in<br />
institutional-care settings such as nursing homes<br />
or group homes. Instigators <strong>of</strong> this abuse include<br />
institutional staff or providers. Self-abuse or neglect<br />
may occur anywhere and occurs when older adults<br />
intentionally or unintentionally harm themselves.<br />
Examples include failure to take medications as<br />
prescribed, failure to take in adequate nutrition<br />
or maintain hydration, and failure to maintain<br />
adequate hygiene. In addition to the three<br />
categories <strong>of</strong> elder abuse, there are six types <strong>of</strong><br />
abuse: physical abuse, sexual abuse, emotional/<br />
psychological abuse, neglect, financial abuse/<br />
exploitation and abandonment.<br />
An estimated $30 billion in direct and indirect<br />
health-care costs resulted from fall-related injuries<br />
among older adults in 2010 (CDC: Home and<br />
Recreational Safety-Cost, 2012). By 2020, this cost is<br />
predicted to increase to almost $55 billion annually.<br />
National statistics on elder abuse/neglect are<br />
difficult to find because the situation is underidentified<br />
and under-reported. The 2010 National<br />
Elder Abuse Mistreatment Study assessed a oneyear<br />
prevalence <strong>of</strong> abuse (Acierno, et al., 2010). Of<br />
adults 60 and older who responded to the survey,<br />
11.4% described at least one instance <strong>of</strong> abuse<br />
in the previous year. Specifically, 4.6% reported<br />
past-year emotional mistreatment, 1.6% reported<br />
physical abuse, 0.6% reported sexual mistreatment,<br />
5.9% reported potential neglect, and 5.2% reported<br />
financial mistreatment. Low social support was the<br />
greatest predictor <strong>of</strong> mistreatment (Acierno, et al.,<br />
2010).<br />
Of those who described mistreatment in the<br />
Acierno et al. (2010) study, few reported the<br />
incidences to authorities. The 1998 National Elder<br />
Abuse Incidence Study (NCEA, 1998) also noted<br />
that in 1996 more than 80% <strong>of</strong> elder-abuse cases<br />
were not reported. Victims may elect not to report<br />
abuse because they:<br />
• Feel ashamed and embarrassed, particularly if a<br />
family member is the abuser;<br />
• Are afraid that the abuser will get “in trouble;”<br />
• Worry that they will be forced to live in a<br />
nursing home, and this sometimes happens;<br />
• Feel guilty or somehow to blame;<br />
• Are in denial that the abuse is occurring, or<br />
unaware that what they are experiencing is<br />
abuse or neglect;<br />
• Are afraid that if they report, the abuse will get<br />
worse (AOA: NCEA, How to answer the tough<br />
questions, 2012, p. 2).<br />
Health Risks & Behaviors<br />
115
Health Risks & Behaviors<br />
Penalties for conviction <strong>of</strong> elder abuse in <strong>Nevada</strong><br />
include up to a 20-year prison term with additional<br />
penalties possible under <strong>Nevada</strong>’s elder-abuse<br />
statutes, NRS 200.5092-50995.<br />
The <strong>Nevada</strong> Aging and Disability Services Division’s<br />
(ADSD) Elder Protective Services (EPS) and local<br />
law enforcement investigate allegations <strong>of</strong> abuse,<br />
exploitation, isolation, neglect and self-neglect for<br />
persons 60 and older. ADSD has four <strong>of</strong>fices, in<br />
Carson City, Elko, Las Vegas and Reno. EPS social<br />
workers, with an average caseload in FY 2012 <strong>of</strong> 43<br />
cases, examine allegations <strong>of</strong> abuse, exploitation,<br />
isolation, neglect and self-neglect across all <strong>Nevada</strong><br />
counties (ADSD: EPS Caseload Statistics, 2012). In<br />
FY 2012 (i.e., between 7/1/11 and 6/30/12), EPS and<br />
<strong>Nevada</strong> law enforcement received 5,374 allegations<br />
<strong>of</strong> elder abuse. Of these allegations, 21.9% (n =<br />
1,176) were for abuse, 21.8% (n = 1,173) were for<br />
neglect, 31.8% (n = 1,711) were for self-neglect,<br />
21.8% (n = 1,171) were for exploitation, and 2.7% (n<br />
=143) were for isolation (see Table HR30).<br />
Fig. HR47: <strong>Nevada</strong>, Elder Abuse, Age 60 and<br />
Older, FY2012: Victim Age<br />
11.6% 12.5%<br />
14.8%<br />
17.0%<br />
(ADSD: EPS, 2012)<br />
19.0%<br />
25.2%<br />
60-65 66-70 71-75 76-80 81-85 86- Plus<br />
Suspects in the cases closed in FY 2012 included<br />
the client’s themselves (33.2%, i.e., in self-neglect<br />
cases), the client’s child (23.1%), the service<br />
provider (13.2%), a relative (10.5%), the client’s<br />
spouse (9.1%), a friend or neighbor <strong>of</strong> the client<br />
(4.9%), and other individuals with unknown<br />
relationship to the client [6% (see Figure HR48).<br />
Fig. HR48: <strong>Nevada</strong>, Elder Abuse, Age 60 and<br />
Older, FY2012: Suspect<br />
Friend-Neighbor<br />
Other<br />
4.9%<br />
6.0%<br />
116<br />
Between FY 2011 and 2012, allegations <strong>of</strong> abuse,<br />
neglect, exploitation and isolation increased.<br />
Allegations <strong>of</strong> self-neglect decreased (see Figure<br />
HR46, and Table HR31).<br />
Fig. HR46: <strong>Nevada</strong> Elder Abuse, Age 60 and<br />
Older: FY 2011 verus FY 2012<br />
1176 1173<br />
1036 1061<br />
1859<br />
(ADSD: EPS, 2012)<br />
The majority <strong>of</strong> clients with cases closed (i.e.,<br />
investigation concluded) during FY 2012 were White<br />
(78.8%), female (62.8%), and living independently<br />
in their <strong>com</strong>munities (80.4%). Of the remaining,<br />
7.4% were African American, 5.3% were Hispanic,<br />
2.3% were Asian, 4.4% were listed as “other,” 0.9%<br />
were American Indian/Alaskan Natives, and 0.9%<br />
were Pacific Islander/Hawaiian. In addition, 10.1%<br />
<strong>of</strong> the clients resided in nursing facilities, 9.2% lived<br />
in residential facilities for groups, and 0.3% lived<br />
in homes for individual residential care. A greater<br />
percentage <strong>of</strong> allegations for cases closed in FY 2012<br />
(25.2%) were for the oldest clients, 86 or older, than<br />
for clients in younger age groups (see Figure HR47).<br />
1711<br />
1139<br />
1171<br />
Abuse Neglect Self-Neglect Exploitation Isolation<br />
FY 2011 FY 2012<br />
142<br />
143<br />
Spouse-Significant Other<br />
Other relative<br />
Service Provider<br />
Child<br />
Self<br />
9.1%<br />
10.5%<br />
13.2%<br />
(ADSD: EPS, 2012)<br />
Of the allegations for cases closed in FY 2012,<br />
25.9% (n = 1,390) were substantiated, and 72.5% (n<br />
= 3,894) were unsubstantiated (see Table HR32). Of<br />
all substantiated cases, 38.5% were for self-neglect,<br />
22.5% were for abuse, 20.4% were for neglect,<br />
17.2% were for exploitation, and 1.4% was for<br />
isolation (Figure HR49).<br />
(ADSD: EPS, 2012)<br />
23.1%<br />
Fig. HR49: <strong>Nevada</strong>, Elder Abuse, Age 60 and<br />
Older, FY2012: Substantiated Cases<br />
22.5%<br />
20.4%<br />
38.5%<br />
17.2%<br />
33.2%<br />
1.4%<br />
Abuse Neglect Self-Neglect Exploitation Isolation
Motor Vehicle Accidents<br />
Older adults have a higher motor vehicle accident<br />
rate than younger adults (Owsley, 2004), and the<br />
accident-related fatality rate for adults 80 and older<br />
is four times the rate for adults 30-59 [National<br />
Highway Traffic Safety Administration (NHTSA),<br />
2008, p. 2). In 2010, 6,443 U.S. adults 65 and older<br />
died in motor vehicle accidents for a crude overall<br />
death rate <strong>of</strong> 16 per 100,000 (see Table HR33,<br />
WISQARS, 2010). For all adults 65 and older, the<br />
crude death rate per 100,000 was higher for males<br />
than females (see Table HR34) and increased with<br />
age (see Figure HR50). In 2010, 54 adults 65 and<br />
older in <strong>Nevada</strong> died in motor vehicle accidents for<br />
a crude death rate <strong>of</strong> 16.7 per 100,000 (WISQARS,<br />
2010). In 2011, motor vehicle accidents were the<br />
fourth-leading cause <strong>of</strong> nonfatal injuries in U.S.<br />
adults 65 and older with 194,678 nonfatal injuries<br />
and a crude injury rate <strong>of</strong> 470.3 per 100,000<br />
(WISQARS, 2011).<br />
Fig. HR50: U.S. Adults, Age 65 and<br />
Older: Age by Motor Vehicle Death<br />
Rates per 100,000<br />
12.05 12.7<br />
17.31<br />
(WISQARS, 2010)<br />
20.74<br />
23.83<br />
65-69 Years 70-74 Years 75-79 Years 80-84 Years 85 and Older<br />
Crude motor vehicle accident mortality rates for U.S.<br />
adults 65 and older varied by race in 2010 (see Table<br />
HR35, WISQARS, 2010). For example, the rate for<br />
older American Indian/Alaskan Natives was 20 per<br />
100,000, while the rate for older Whites was 16.4 per<br />
100,000. In addition, mortality rates for both groups<br />
were higher than the national 65+ rate <strong>of</strong> 16 per<br />
100,000.<br />
Risk factors for motor vehicle accidents in older<br />
adults include age-related physiological changes.<br />
Driving skills are impaired by decreases in vision,<br />
cognition, str<strong>eng</strong>th, flexibility and functional<br />
impairments such as reduced response time to<br />
stimuli (NHTSA, 2012; Owsley, 2004). A recent<br />
NHTSA study found nine performance errors in<br />
older adults involved in motor vehicle accidents,<br />
including:<br />
1. Failing to detect potential conflicts, hazards or<br />
traffic-control information;<br />
2. Misjudging gaps when crossing or merging into<br />
traffic;<br />
3. Failing to predict the development <strong>of</strong> future<br />
conflicts based on current traffic and contextual<br />
information;<br />
4. Delayed vehicle-control response;<br />
5. Inadequate visual search;<br />
6. Slowed decision-making;<br />
7. Not following the rules <strong>of</strong> the road;<br />
8. Not using safe driving practices;<br />
9. Selecting an inappropriate response (NHTSA,<br />
2012, p. 1).<br />
Age-related changes in vision, such as the growth<br />
<strong>of</strong> cataracts, are <strong>com</strong>mon in older adults. These<br />
reduce sight by decreasing visual resolution and<br />
increasing contrast sensitivity and glare (Owsley,<br />
2004). Glau<strong>com</strong>a, another age-related visual disease,<br />
results in impairment in peripheral vision and may<br />
reduce awareness <strong>of</strong> obstacles (Owsley, 2004). Aging<br />
also is associated with slowed visual-process speed<br />
and impaired ability to divide attention. These last<br />
factors are associated with a two-fold increase in<br />
crash risk (Owsley, 2004, slide #53). Increases in<br />
fragility among adults 60 and older may also factor<br />
into motor vehicle fatalities (NHTSA, 2008).<br />
According to the National Highway Traffic Safety<br />
Administration (NHTSA), seat belts (correctly used)<br />
are the most effective means <strong>of</strong> preventing serious or<br />
fatal injury in a motor vehicle crash (NHTSA, 2008,<br />
p. 1). In 2011, 93.3% (median percent) <strong>of</strong> U.S. adults<br />
and 94.6% <strong>of</strong> <strong>Nevada</strong> adults 18-44 reported that they<br />
always wear a seat belt (CDC: BRFSS, Injury, 2011).<br />
A slightly lower share (89.8%) <strong>of</strong> U.S. adults 65 and<br />
older reported that they always use a seatbelt, but<br />
4.3% reported that they nearly always wear one, and<br />
2.4% stated that they sometimes wear one (see Table<br />
HR36, CDC: BRFSS, 2011). Of the remaining, 0.6%<br />
seldom wear a seatbelt, and 1.6% indicated that they<br />
do not drive or ride in motor vehicles.<br />
Health Risks & Behaviors<br />
117
Health Risks & Behaviors<br />
Reasons for using or failing to use seatbelts vary. In<br />
a meta-analysis <strong>of</strong> 147 studies, NHTSA (2008) noted<br />
that seatbelt use for drivers <strong>of</strong> all ages is influenced<br />
by “socioeconomic status, trip l<strong>eng</strong>th, seating<br />
position, physical capabilities, and <strong>com</strong>fort and<br />
convenience” (p. 52). For older drivers in particular,<br />
non-use may result from habits/behaviors developed<br />
over time, trip l<strong>eng</strong>th, or physical limitations that<br />
negatively influence <strong>com</strong>fort. For example, older<br />
males were less likely to use seatbelts than older<br />
females. Physical limitations, such as arthritis,<br />
inability to twist the neck/torso, or obesity, may also<br />
lower the use <strong>of</strong> seatbelts (NHTSA, 2008).<br />
Veterans<br />
In this section, we will discuss specific risk<br />
behaviors in older veterans, including substance<br />
use, homelessness and motor vehicle fatalities. The<br />
current focus nationally is on veterans returning<br />
from the Iraq and Afghanistan <strong>com</strong>bat theaters<br />
rather than on the older generation <strong>of</strong> veterans<br />
who might have served in World War II, Korea or<br />
the Vietnam War. However, information obtained<br />
about recent <strong>com</strong>bat veterans may generalize to<br />
the older veterans. For this reason, recent findings<br />
about <strong>com</strong>bat veterans will be included in this<br />
section along with data specific to older veterans.<br />
A 2004 study <strong>of</strong> Vietnam (<strong>com</strong>bat) versus Vietnam-<br />
Era (non-<strong>com</strong>bat) veterans noted a higher<br />
prevalence <strong>of</strong> current and past health problems in<br />
<strong>com</strong>bat veterans, including hearing loss and such<br />
mental health issues as depression, Post Traumatic<br />
Stress Disorder (PTSD), and anxiety. In addition,<br />
the study found higher mortality rates for those<br />
who had served in <strong>com</strong>bat (CDC: Veterans’ Health<br />
Activities, 2010). Contributing to these higher<br />
mortality rates were unintentional poisonings and<br />
drug-related issues.<br />
Another study <strong>of</strong> post-<strong>com</strong>bat veterans, between<br />
2002 and 2008, found significant increases in<br />
prescription-drug abuse (NIDA: Topics in Brief,<br />
2011). In addition, the 2008 Department <strong>of</strong> Defense<br />
Health Behavior Study noted an increase in heavy<br />
alcohol use but reported that tobacco and illicit<br />
drug use decreased. The Millennium Cohort Study<br />
2001-2022 reported increased risk <strong>of</strong> alcohol use<br />
and abuse and increased smoking initiation among<br />
<strong>com</strong>bat-deployed reserve and National Guard<br />
service members (NIDA: Topics in Brief, 2011).<br />
Combined 2004-2006 data from the National<br />
Survey on Drug Use and Health (NSDUH) survey<br />
estimated that 20.9% <strong>of</strong> veterans 18-25, 11.2% <strong>of</strong><br />
veterans 26-54, and 4.3% <strong>of</strong> veterans 55 and older<br />
experienced symptoms <strong>of</strong> serious psychological<br />
distress in the year prior to the survey (SAMHSA,<br />
2007). In addition, an estimated 4.4% <strong>of</strong> veterans<br />
55 and older met criteria for substance use disorder,<br />
and 0.7% met criteria for co-occurring serious<br />
psychological distress and substance use disorder.<br />
Nora Volkow, director <strong>of</strong> the National Institute on<br />
Drug Abuse (NIDA), noted in 2009 that veterans<br />
showed 50% higher rates <strong>of</strong> tobacco use, higher<br />
rates <strong>of</strong> binge drinking, and lower rates <strong>of</strong> illicit<br />
substance abuse than civilians. She predicted even<br />
higher rates <strong>of</strong> substance use in veterans who have<br />
been in <strong>com</strong>bat and subsequently experienced<br />
PTSD or mental health issues.<br />
118
Confounding the issue for many is “service<br />
members’ reluctance to seek treatment,” for fear<br />
<strong>of</strong> military discipline (e.g., discharge) or a belief<br />
that treatment equals weakness (Volkow, 2009,<br />
para. #4). For example, Kathryn Power, director <strong>of</strong><br />
the Substance Abuse and Mental Health Services<br />
Administration’s (SAMHSA) Center for Mental<br />
Health Services, noted in 2008 that only 30% to<br />
40% <strong>of</strong> eligible veterans actually seek Veterans<br />
Administration services to address mental health<br />
(and possibly substance use) issues (Benderly,<br />
2008). Alternatively, Booth and Blow (2008) noted<br />
either consistency or an increase in baby boomer<br />
veterans’ utilization <strong>of</strong> VA inpatient substance<br />
abuse services between fiscal years 1988, 1991,<br />
1994 and 1998. They also noted an increase in<br />
use <strong>of</strong> other inpatient services where substance<br />
abuse problems were the secondary diagnosis.<br />
As these researchers indicated, “there does not<br />
appear to be an aging-out phenomenon for baby<br />
boomer veterans,” that is, veterans do not outgrow<br />
substance use as they age (Booth & Blow, 2008,<br />
Conclusion Section, para. #2).<br />
Data on the prevalence <strong>of</strong> substance-risk behaviors<br />
among older veterans in <strong>Nevada</strong> are not available<br />
for this report. In 2009, per the <strong>Nevada</strong> Legislature,<br />
veteran specialty courts were established for<br />
nonviolent <strong>of</strong>fenders charged with crimes and<br />
problems related to military service or adjustment<br />
to civilian life (<strong>Nevada</strong> Office <strong>of</strong> Veterans Services,<br />
2012, Section V). That year, Veteran’s Specialty<br />
Courts began in Washoe County and Henderson,<br />
<strong>Nevada</strong>. In July 2012, the Clark County District<br />
court system also proposed development <strong>of</strong> a<br />
veteran’s court (Jourdan, 2012); however, as <strong>of</strong> this<br />
report the court had yet to be established.<br />
2009-2012 demographics for the Washoe County<br />
Veteran’s Court indicate that 31% <strong>of</strong> veteran clients<br />
were charged with drug and alcohol crimes, 24%<br />
with crimes against a person, 24% with property<br />
crimes, and 21% with nuisance crimes (<strong>Nevada</strong><br />
Office <strong>of</strong> Veterans Services, 2012). Of these, 69%<br />
were felonies, 25% were misdemeanors, and 6%<br />
were gross misdemeanors.<br />
Between 2009 and 2012, Washoe County’s<br />
Veteran’s Court served 99 participants, ranging in<br />
age from 20 to 78 (M = 45.5 years). The majority<br />
<strong>of</strong> clients were White (80%) males (91%). Twelve<br />
percent were Black, 7% were Hispanic, and<br />
1% were Asian. The most <strong>com</strong>mon substances<br />
involved with drug- or alcohol-related crimes<br />
were poly-substance abuse, alcohol, marijuana,<br />
methamphetamines, heroin/opiates and cocaine.<br />
Homelessness in veterans also is a public health<br />
concern. A 2012 study <strong>of</strong> homelessness among<br />
veterans in the seven Continuum <strong>of</strong> Care (CoC)<br />
metropolitan areas noted that 8.2% (n = 10,726) <strong>of</strong><br />
the Homeless Management Information System<br />
homeless population (n = 130,554) were veterans<br />
(Fargo, et al., 2012). The study also found that …<br />
“… male veterans were almost 50% as<br />
likely (adjusted odds ratio [AOR], 1.47; 95%<br />
confidence interval [CI], 1.19-1.81) and female<br />
veterans were almost twice as likely (AOR,<br />
1.97; 95% CI, 1.25-3.12) to be homeless as<br />
nonveterans in the general population. Among<br />
the population in poverty, male veterans were<br />
more than twice as likely (AOR, 2.20; 95% CI,<br />
1.96-2.48) and female veterans were more than<br />
three times as likely (AOR, 3.33; 95% CI, 2.17-<br />
5.13) to be homeless as nonveterans” (Fargo., et<br />
al., 2012, p. 3).<br />
Risk factors for homelessness included sex, age,<br />
race and poverty status. Nearly 7% <strong>of</strong> the homeless<br />
veterans were between 18 and 29 years <strong>of</strong> age, 24%<br />
were 30-44, 40.8% were 45-54, 23.3% were 55-64,<br />
and 5.1% were 65 or older. Nearly 90% <strong>of</strong> homeless<br />
veterans were male, and 10.2% were female. Fortysix<br />
percent were Black and 54% were Non-Black.<br />
Veterans are more vulnerable than are non-veterans<br />
to homelessness caused by a <strong>com</strong>bination <strong>of</strong> sex,<br />
poverty and race. For example, 52.8% <strong>of</strong> Black male<br />
veterans 18-29 and 36.3% <strong>of</strong> Black female veterans<br />
living in poverty were homeless. Of the Non-Black<br />
male veterans in poverty, 7.3% were homeless, and<br />
<strong>of</strong> the Non-Black female veterans living in poverty,<br />
11.9% were homeless. In addition, <strong>of</strong> the Black<br />
male veterans in the population, only 5.4% were<br />
homeless.<br />
Health Risks & Behaviors<br />
119
Health Risks & Behaviors<br />
Among male Black veterans 65+ living in poverty,<br />
4.8% were homeless, as were 2.1% <strong>of</strong> Non-Black<br />
male veterans living in poverty. Of the Black<br />
older female veterans living in poverty, 1.7% were<br />
homeless, and <strong>of</strong> the Non-Black female veterans<br />
living in poverty, 0.8% were homeless (see Table<br />
HR37; Fargo et al., 2012).<br />
The age-adjusted rate <strong>of</strong> motor vehicle fatalities<br />
among <strong>Nevada</strong> veterans (27.8 per 100,000) is higher<br />
than in the general population (7.8 per 100,000;<br />
Ritch & Thompson, 2012). However, these data<br />
did not distinguish between veterans younger than<br />
or older than age 65. This high rate <strong>of</strong> death may<br />
be “reflective <strong>of</strong> a pattern <strong>of</strong> risk-taking behaviors<br />
found in studies <strong>of</strong> this population (veterans)” (p. 5)<br />
or may be a consequence <strong>of</strong> substance use.<br />
120
Table HR1<br />
Rate <strong>of</strong> Cigarette Smoking in U.S. Adults (Civilian, Non-institutionalized, 2010): Age and Sex<br />
All Current Every Day Some Days Former Non-<br />
Sex and Age Group Smokers Smokers Smokers Smokers smokers<br />
Both sexes 19.4% 15.1% 4.2% 21.7% 59.0%<br />
Males<br />
18–44 23.9% 17.3% 6.6% 14.9% 61.2%<br />
45–64 23.2% 19.5% 3.7% 28.9% 47.9%<br />
65 and older 9.7% 8.4% 1.3% 52.5% 37.8%<br />
Females<br />
18–44 19.1% 14.6% 4.5% 10.6% 70.3%<br />
45–64 19.1% 15.6% 3.6% 22.5% 58.4%<br />
65 and older 9.3% 7.6% 1.7% 29.3% 61.4%<br />
Health Risks & Behaviors<br />
(CDC: National Health Interview Survey, 2010, in Federal Interagency Forum, 2012, p. 128)<br />
121
Health Risks & Behaviors<br />
122<br />
Table HR2<br />
<strong>Nevada</strong> Adults, 65 and Older: Percentage <strong>of</strong> Smokers by Rate<br />
Demographic Grouping N* Every Day Some Days Former Smoker Never Smoked<br />
% C.I. % C.I. % C.I. % C.I.<br />
Region Statewide 1,657 10.7% (8.1-13.4) 2.8% (1.8-3.7) 51.8% (47.5-56.2) 34.7% (30.6-38.7)<br />
Southern Urban/Metro 588 10.7% (7.0-14.3) 2.5% (1.3-3.7) 52.4% (46.3-58.5) 34.4% (28.7-40.2)<br />
Northern Urban/Metro 600 9.7% (5.9-13.5) 3.8% (1.9-5.7) 50.3% (44.7-55.8) 36.2% (30.8-41.6)<br />
Rural/Frontier 469 12.4% (7.6-17.2) 2.5% (1.0-4.0) 51.5% (44.1-58.9) 33.6% (26.2-40.9)<br />
Age 65 - 74 1,024 14.0% (10.1-18.0) 3.8% (2.4-5.2) 50.5% (44.8-56.2) 31.7% (26.4-36.9)<br />
75 - 84 504 6.3% (3.5-9.1) 1.5% (0.3-2.6) 54.1% (46.9-61.4) 38.1% (30.9-45.2)<br />
85 and Older 129 4.0% (0.0-9.8) 0% (0.0-0.0) 52.7% (36.4-69.0) 43.3% (27.8-58.8)<br />
Sex Male 663 12.3% (8.2-16.4) 2.0% (0.7-3.3) 60.8% (55.0-66.6) 24.9% (20.1-29.7)<br />
Female 994 9.4% (6.0-12.8) 3.4% (2.1-4.7) 44.0% (37.9-50.1) 43.2% (37.1-49.2)<br />
Race White 1,431 10.9% (8.2-13.7) 2.7% (1.7-3.8) 55.8% (51.5-60.2) 30.5% (26.8-34.2)<br />
Black 47 ~ ~ ~ ~ ~ ~ ~ ~<br />
Other Race 92 13.8% (3.0-24.5) 2.5% (0.0-5.4) 33.3% (16.7-49.9) 50.4% (33.2-67.7)<br />
Hispanic 58 2.9% (0.0-6.2) 1.9% (0.0-4.6) 45.6% (24.4-66.9) 49.6% (28.1-71.1)<br />
Education Less than H.S. 120 9.0% (3.0-15.0) 1.2% (0.0-2.8) 58.9% (45.2-72.7) 30.8% (17.5-44.2)<br />
H.S. or G.E.D. 510 14.5% (8.6-20.4) 4.2% (2.3-6.2) 52.4% (45.2-59.6) 28.8% (22.9-34.8)<br />
Some Post H.S. 521 9.9% (6.0-13.7) 2.9% (1.0-4.9) 51.7% (44.4-58.9) 35.5% (28.6-42.4)<br />
College Graduate 502 7.7% (4.2-11.2) 1.5% (0.5-2.5) 45.6% (39.0-52.2) 45.2% (38.7-51.7)<br />
In<strong>com</strong>e < $15K 161 20.0% (10.6-29.4) 6.7% (2.1-11.2) 36.6% (25.4-47.8) 36.7% (24.8-48.7)<br />
$15K to $24,999 307 10.5% (3.5-17.4) 2.4% (0.8-4.0) 54.5% (44.6-64.3) 32.7% (23.9-41.5)<br />
$25K to $34,999 210 13.5% (4.5-22.4) 2.0% (0.3-3.7) 52.9% (38.8-67.1) 31.6% (17.7-45.4)<br />
$35K to $49,999 231 3.3% (0.9-5.6) 3.3% (0.0-7.1) 66.4% (56.7-76.0) 27.1% (18.4-35.8)<br />
$50K to $74,999 225 9.3% (2.8-15.9) 1.0% (0.1-2.0) 57.6% (47.7-67.4) 32.1% (22.8-41.4)<br />
$75,000+ 208 6.9% (0.0-14.4) 2.2% (0.2-4.2) 41.8% (31.8-51.9) 49.0% (38.5-59.6)<br />
*Sample sizes less than 50 are marked with ‘~’. Due to the small samples sizes, responses may not reliably represent the population; therefore, are not included.<br />
(CDC: BRFSS, 2011)
Table HR3<br />
<strong>Nevada</strong> Adults 65 and Older: Binge Drinkers (Adult Men Having Five or More Drinks on One Occasion,<br />
Females Having Four or More Drinks on One Occasion)<br />
Demographic Grouping N* Yes No<br />
% C.I. % C.I.<br />
Region Statewide 1,466 6.1% (4.3-8.0) 93.9% (92.0-95.7)<br />
Southern Urban/Metro 513 4.9% (2.5-7.4) 95.1% (92.6-97.5)<br />
Northern Urban/Metro 539 7.1% (3.8-10.3) 92.9% (89.7-96.2)<br />
Rural/Frontier 414 10.4% (5.5-15.3) 89.6% (84.7-94.5)<br />
Age 65-74 912 8.5% (5.6-11.5) 91.5% (88.5-94.4)<br />
75-84 397 2.9% (0.6-5.3) 97.1% (94.7-99.4)<br />
85 and Older 105 2.1% (0.0-5.1) 97.9% (94.9-100.0)<br />
Sex Male 586 8.7% (5.6-11.8) 91.3% (88.2-94.4)<br />
Female 880 3.9% (1.6-6.2) 96.1% (93.8-98.4)<br />
Race White 1,274 6.4% (4.3-8.6) 93.6% (91.4-95.7)<br />
Black 40 ~ ~ ~ ~<br />
Other Race 78 12.0% (0.0-26.3) 87.3% (73.7-100.0)<br />
Hispanic 48 ~ ~ ~ ~<br />
Education Less than H.S. 105 5.9% (1.1-10.8) 94.1% (89.2-98.9)<br />
H.S. or G.E.D. 438 7.3% (3.3-11.4) 92.7% (88.6-96.7)<br />
Some Post H.S. 465 3.7% (1.7-5.7) 96.3% (94.3-98.3)<br />
College Graduate 455 8.3% (4.1-12.6) 91.7% (87.4-95.9)<br />
In<strong>com</strong>e < $15,000 149 11.3% (3.4-19.2) 88.7% (80.8-96.6)<br />
$15,000 to $24,999 278 5.6% (1.4-9.8) 94.4% (90.2-98.6)<br />
$25,000 to $34,999 180 3.5% (1.0-5.9) 96.5% (94.1-99.0)<br />
$35,000 to $49,999 209 4.7% (1.5-8.0) 95.3% (92.0-98.5)<br />
$50,000 to $74,999 196 10.9% (4.3-17.4) 89.1% (82.6-95.7)<br />
$75,000+ 191 4.8% (1.8-7.7) 95.2% (92.3-98.2)<br />
Health Risks & Behaviors<br />
*Sample sizes less than 50 are marked with ‘~’. Due to the small samples sizes, responses may not reliably represent the population;<br />
therefore, are not included.<br />
(CDC: BRFSS, 2011)<br />
123
Health Risks & Behaviors<br />
Table HR4<br />
<strong>Nevada</strong> Adults, 65 and Older: Heavy Drinkers (Adult Men Having Two or More Drinks Per Day, Adult<br />
Women Having One or More Drinks Per Day)<br />
Demographic Grouping N* Yes No<br />
% C.I. % C.I.<br />
Region Statewide 1,455 4.8% (3.5-6.2) 95.2% (93.8-96.5)<br />
Southern Urban/Metro 510 3.8% (2.1-5.6) 96.2% (94.4-97.9)<br />
Northern Urban/Metro 534 6.9% (4.3-9.5) 93.1% (90.5-95.7)<br />
Rural/Frontier 411 6.6% (3.6-9.6) 93.4% (90.4-96.4)<br />
Age 65-74 905 5.8% (4.0-7.7) 94.2% (92.3-96.0)<br />
75-84 394 3.7% (1.1-6.4) 96.3% (93.6-98.9)<br />
85 and Older 105 2.6% (0.3-4.9) 97.4% (95.1-99.7)<br />
Sex Male 581 6.0% (3.6-8.4) 94.0% (91.6-96.4)<br />
Female 874 3.8% (2.4-5.2) 96.2% (94.8-97.6)<br />
Race White 1,264 5.5% (3.9-7.1) 94.5% (92.9-96.1)<br />
Black 40 ~ ~ ~ ~<br />
Other Race 77 2.0% (0.0-5.0) 98.0% (95.0-100.0)<br />
Hispanic 48 ~ ~ ~ ~<br />
Education Less than H.S. 104 4.7% (0.3-9.1) 95.3% (90.9-99.7)<br />
H.S. or G.E.D. 435 3.9% (1.9-5.9) 96.1% (94.1-98.1)<br />
Some Post H.S. 461 5.1% (2.9-7.3) 94.9% (92.7-97.1)<br />
College Graduate 452 6.4% (3.5-9.3) 93.6% (90.7-96.5)<br />
In<strong>com</strong>e < $15,000 147 4.9% (0.4-9.4) 95.1% (90.6-99.6)<br />
$15,000 to $24,999 276 5.0% (1.6-8.4) 95.0% (91.6-98.4)<br />
$25,000 to $34,999 178 4.7% (0.3-9.2) 95.3% (90.8-99.7)<br />
$35,000 to $49,999 206 4.1% (1.1-7.0) 95.9% (93.0-98.9)<br />
$50,000 to $74,999 193 6.8% (3.0-10.6) 93.2% (89.4-97.0)<br />
$75,000+ 190 7.8% (3.3-12.3) 92.2% (87.7-96.7)<br />
*Sample sizes less than 50 are marked with ‘~’. Due to the small samples sizes, responses may not reliably represent the population;<br />
therefore, are not included.<br />
(CDC: BRFSS, 2011)<br />
124
Table HR5<br />
<strong>Nevada</strong> Adults, 65 and Older: Heavy Drinkers Reporting Drinking at Least One Drink <strong>of</strong> Alcohol in<br />
Past 30 Days<br />
Demographic Grouping N* Yes No<br />
% C.I. % C.I.<br />
Region Statewide 1,473 45.4% (40.8-50.0) 54.6% (50.0-59.2)<br />
Southern Urban/Metro 517 42.1% (35.6-48.5) 57.9% (51.5-64.4)<br />
Northern Urban/Metro 541 55.2% (49.6-60.8) 44.8% (39.2-50.4)<br />
Rural/Frontier 415 47.6% (39.5-55.7) 52.4% (44.3-60.5)<br />
Age 65-74 917 50.2% (44.0-56.3) 49.8% (43.7-56.0)<br />
75-84 399 38.4% (30.6-46.3) 61.6% (53.7-69.4)<br />
85 and Older 105 41.3% (21.7-61.0) 58.7% (39.0-78.3)<br />
Sex Male 591 51.5% (45.0-58.1) 48.5% (41.9-55.0)<br />
Female 882 40.0% (33.7-46.4) 60.0% (53.6-66.3)<br />
Race White 1,280 47.7% (42.9-52.5) 52.3% (47.5-57.1)<br />
Black 40 ~ ~ ~ ~<br />
Other Race 78 36.5% (18.6-54.3) 63.5% (45.7-81.4)<br />
Hispanic 49 ~ ~ ~ ~<br />
Education Less than H.S. 107 39.3% (24.5-54.1) 60.7% (45.9-75.5)<br />
H.S. or G.E.D. 439 47.2% (39.4-55.1) 52.8% (44.9-60.6)<br />
Some Post H.S. 466 41.2% (34.2-48.2) 58.8% (51.8-65.8)<br />
College Graduate 458 56.2% (49.3-63.2) 43.8% (36.8-50.7)<br />
In<strong>com</strong>e < $15,000 148 33.9% (21.9-45.9) 66.1% (54.1-78.1)<br />
$15,000 to $24,999 278 35.7% (25.2-46.1) 64.3% (53.9-74.8)<br />
$25,000 to $34,999 182 49.7% (33.8-65.6) 50.3% (34.4-66.2)<br />
$35,000 to $49,999 209 53.7% (42.4-65.1) 46.3% (34.9-57.6)<br />
$50,000 to $74,999 197 59.2% (48.8-69.6) 40.8% (30.4-51.2)<br />
$75,000+ 191 69.8% (58.5-81.2) 30.2% (18.8-41.5)<br />
Health Risks & Behaviors<br />
*Sample sizes less than 50 are marked with ‘~’. Due to the small samples sizes, responses may not reliably represent the population;<br />
therefore, are not included.<br />
(CDC: BRFSS, 2011)<br />
125
Health Risks & Behaviors<br />
Table HR6<br />
<strong>Nevada</strong>: State Funded Treatment Centers<br />
Region Grantee Outpatient Outpatient Intensive Intensive Residential Residential<br />
Southern <strong>Nevada</strong><br />
Las Vegas X X<br />
Problem<br />
Gambling Center<br />
Pathways X X<br />
Northern <strong>Nevada</strong><br />
Reno Problem X X<br />
Gambling Center<br />
Bristlecone X X<br />
New Frontier X X X<br />
Treatment Center<br />
Salvation Army* X X<br />
*Although funded from 2006 to 2010, by 2012, this center was no longer funded by the state <strong>of</strong> <strong>Nevada</strong> to provide gambling treatment service<br />
(Bernhard & St. John, 2012).<br />
(NVDHHS, 2011, p. 3)<br />
126
Table HR7<br />
<strong>Nevada</strong> Adults 65 and Older: Had Five or More Fruits and Vegetables per Day<br />
Demographic Grouping N* Yes No<br />
% C.I. % C.I.<br />
Region Statewide 1,673 13.7% (10.9-16.4) 86.3% (83.6-89.1)<br />
Southern Urban/Metro 596 13.7% (9.8-17.7) 86.3% (82.3-90.2)<br />
Northern Urban/Metro 606 15.2% (11.7-18.8) 84.8% (81.2-88.3)<br />
Rural/Frontier 471 11.3% (7.9-14.7) 88.7% (85.3-92.1)<br />
Age 65-74 1,031 12.6% (9.3-15.9) 87.4% (84.1-90.7)<br />
75-84 454 18.8% (12.4-25.3) 81.2% (74.7-87.6)<br />
85 and Older 130 6.4% (2.4-10.4) 93.6% (89.6-97.6)<br />
Sex Male 669 13.2% (9.1-17.3) 86.8% (82.7-90.9)<br />
Female 1,004 14.0% (10.3-17.8) 86.0% (82.2-89.7)<br />
Race White 1,444 12.2% (9.6-14.7) 87.8% (85.3-90.4)<br />
Black 47 ~ ~ ~ ~<br />
Other Race 94 19.1% (7.8-30.4) 80.9% (69.6-92.2)<br />
Hispanic 59 23.2% (6.9-39.5) 76.8% (60.5-93.1)<br />
Education Less than H.S. 122 6.6% (1.2-12.1) 93.4% (87.9-98.8)<br />
H.S. or G.E.D. 512 11.7% (7.6-15.9) 88.3% (84.1-92.4)<br />
Some Post H.S. 526 15.8% (10.5-21.0) 84.2% (79.0-89.5)<br />
College Graduate 509 18.5% (13.1-23.9) 81.5% (76.1-86.9)<br />
In<strong>com</strong>e < $15K 165 20.2% (10.2-30.1) 79.8% (69.9-89.8)<br />
$15K to $24,999 307 8.2% (4.0-12.4) 91.8% (87.6-96.0)<br />
$25K to $34,999 212 11.5% (4.9-18.0) 88.5% (82.0-95.1)<br />
$35K to $49,999 234 14.3% (8.9-19.6) 85.7% (80.4-91.1)<br />
$50K to $74,999 227 12.7% (6.9-18.5) 87.3% (81.5-93.1)<br />
$75K & Higher 209 17.7% (8.8-26.5) 82.3% (73.5-91.2)<br />
Health Risks & Behaviors<br />
*Sample sizes less than 50 are marked with ‘~’. Due to the small samples sizes, responses may not reliably represent the population;<br />
therefore, are not included.<br />
(CDC: BRFSS, 2011)<br />
127
Health Risks & Behaviors<br />
Table HR8<br />
<strong>Nevada</strong> Adults 65 and Older: Did Physical Activity Other than Current Job in the Past 30 Days?<br />
Demographic Grouping N* Yes No<br />
% C.I. % C.I.<br />
Region Statewide 1,541 68.7% (64.3-73.0) 31.3% (27.0-35.7)<br />
Southern Urban/Metro 541 68.7% (62.5-74.9) 31.3% (25.1-37.5)<br />
Northern Urban/Metro 566 70.0% (64.5-75.6) 30.0% (24.4-35.5)<br />
Rural/Frontier 434 66.8% (60.2-73.4) 33.2% (26.6-39.8)<br />
Age 65-74 958 70.7% (64.8-76.6) 29.3% (23.4-35.2)<br />
75-84 420 61.6% (53.5-69.6) 38.4% (30.4-46.5)<br />
85 and Older 110 73.1% (59.9-86.3) 26.9% (13.7-40.1)<br />
Gender Male 617 75.3% (69.1-81.5) 24.7% (18.5-30.9)<br />
Female 924 62.9% (56.7-69.1) 37.1% (30.9-43.3)<br />
Race White 1,331 70.6% (66.2-74.9) 29.4% (25.1-33.8)<br />
Black 42 ~ ~ ~ ~<br />
Other Race 85 66.8% (49.0-84.6) 33.2% (15.4-51.0)<br />
Hispanic 54 62.3% (41.1-83.5) 37.7% (16.5-58.9)<br />
Education Less than H.S. 110 56.0% (42.0-70.0) 44.0% (30.0-58.0)<br />
H.S. or G.E.D. 467 64.3% (56.9-71.7) 35.7% (28.3-43.1)<br />
Some Post H.S. 490 74.3% (67.9-80.6) 25.7% (19.4-32.1)<br />
College Graduate 470 81.1% (75.1-87.2) 18.9% (12.8-24.9)<br />
In<strong>com</strong>e < $15,000 153 58.6% (46.0-71.2) 41.4% (28.8-54.0)<br />
$15,000 to $24,999 288 60.2% (49.7-70.8) 39.8% (29.2-50.3)<br />
$25,000 to $34,999 194 69.8% (55.4-84.3) 30.2% (15.7-44.6)<br />
$35,000 to $49,999 217 70.6% (58.6-82.6) 29.4% (17.4-41.4)<br />
$50,000 to $74,999 205 77.3% (68.5-86.1) 22.7% (13.9-31.5)<br />
$75,000+ 202 88.3% (81.4-95.3) 11.7% (4.7-18.6)<br />
*Sample sizes less than 50 are marked with ‘~’. Due to the small samples sizes, responses may not reliably represent the population;<br />
therefore, are not included.<br />
(CDC: BRFSS, 2011)<br />
128
Table HR9<br />
<strong>Nevada</strong> Adults 65 and Older: Met Federal Guidelines for Str<strong>eng</strong>th Training and Aerobic Exercise<br />
Demographic Grouping N* Yes No<br />
% C.I. % C.I.<br />
Region Statewide 1,435 17.8% (14.7-21.0) 82.2% (79.0-85.3)<br />
Southern Urban/Metro 497 18.4% (13.8-22.9) 81.6% (77.1-86.2)<br />
Northern Urban/Metro 532 21.2% (16.7-25.8) 78.8% (74.2-83.3)<br />
Rural/Frontier 406 10.7% (7.2-14.2) 89.3% (85.8-92.8)<br />
Age 65-74 909 19.3% (15.2-23.4) 80.7% (76.6-84.8)<br />
75-84 380 15.5% (10.0-21.0) 84.5% (79.0-90.0)<br />
85 and Older 95 13.7% (0.0-30.0) 86.3% (70.0-100.0)<br />
Gender Male 574 24.8% (19.4-30.2) 75.2% (69.8-80.6)<br />
Female 861 11.6% (8.4-14.8) 88.4% (85.2-91.6)<br />
Race White 1,250 19.3% (15.7-22.9) 80.7% (77.1-84.3)<br />
Black 35 ~ ~ ~ ~<br />
Other Race 76 20.4% (5.9-34.8) 79.6% (65.2-94.1)<br />
Hispanic 50 9.5% (0.2-18.7) 90.5% (81.3-99.8)<br />
Education Less than H.S. 105 3.8% (0.0-8.0) 96.2% (92.0-100.0)<br />
H.S. or G.E.D. 443 16.1% (10.2-22.1) 83.9% (77.9-89.8)<br />
Some Post H.S. 447 21.7% (15.5-27.9) 78.3% (72.1-84.5)<br />
College Graduate 437 31.2% (24.8-37.7) 68.8% (62.3-75.2)<br />
In<strong>com</strong>e < $15,000 143 11.3% (3.7-18.8) 88.7% (81.2-96.3)<br />
$15,000 to $24,999 270 10.7% (5.0-16.4) 89.3% (83.6-95.0)<br />
$25,000 to $34,999 188 14.7% (7.4-21.9) 85.3% (78.1-92.6)<br />
$35,000 to $49,999 200 24.9% (13.7-36.1) 75.1% (63.9-86.3)<br />
$50,000 to $74,999 193 27.3% (18.5-36.0) 72.7% (64.0-81.5)<br />
$75,000+ 192 34.5% (24.1-44.9) 65.5% (55.1-75.9)<br />
Health Risks & Behaviors<br />
*Sample sizes less than 50 are marked with ‘~’. Due to the small samples sizes, responses may not reliably represent the population;<br />
therefore, are not included.<br />
Missing Source.<br />
Table HR10<br />
Defining Weight Status by BMI<br />
BMI<br />
Considered<br />
Below 18.5<br />
Underweight<br />
18.5-24.9 Healthy Weight<br />
25.0-29.9 Overweight<br />
30 or higher Obese<br />
(CDC: Overweight and Obesity, 2012)<br />
129
Health Risks & Behaviors<br />
130<br />
Table HR11<br />
<strong>Nevada</strong> Adults 65 and Older: Weight Classification by Body Mass Index (BMI)<br />
Demographic Grouping N* Underweight Healthy Weight Overweight Obese<br />
% C.I. % C.I. % C.I. % C.I.<br />
Region Statewide 1,613 2.7% (1.3-4.1) 37.5% (33.3-41.7) 41.7% (37.4-46.1) 18.1% (14.7-21.5)<br />
Southern Urban/Metro 577 1.9% (0.5-3.3) 37.9% (31.9-43.9) 43.5% (37.4-49.7) 16.7% (11.9-21.4)<br />
Northern Urban/Metro 585 3.1% (1.3-4.8) 41.3% (35.8-46.9) 37.2% (31.5-42.8) 18.4% (14.1-22.8)<br />
Rural/Frontier 451 5.7% (0.0-12.3) 30.7% (24.3-37.2) 39.4% (32.7-46.1) 24.2% (18.4-30.0)<br />
Age 65-74 988 2.1% (0.3-3.8) 31.2% (26.2-36.2) 46.5% (40.6-52.3) 20.3% (15.5-25.1)<br />
75-84 443 3.7% (1.0-6.3) 45.9% (37.8-54.0) 32.7% (25.7-39.7) 17.7% (12.0-23.4)<br />
85 and Older 128 4.6% (0.0-10.8) 55.9% (39.9-71.9) 35.1% (20.1-50.1) 4.4% (1.0-7.9)<br />
Sex Male 664 0.6% (0.0-1.1) 33.0% (27.3-38.8) 49.6% (43.5-55.8) 16.8% (13.0-20.6)<br />
Female 949 4.6% (2.1-7.2) 41.6% (35.4-47.7) 34.5% (28.6-40.4) 19.3% (13.9-24.6)<br />
Race White 1,391 2.7% (1.4-4.0) 40.1% (35.5-44.6) 40.2% (35.7-44.7) 17.0% (14.1-20.0)<br />
Black 47 ~ ~ ~ ~ ~ ~ ~ ~<br />
Other Race 93 2.4% (0.0-6.4) 37.4% (21.6-53.2) 44.8% (27.6-61.9) 15.4% (2.6-28.3)<br />
Hispanic 56 4.7% (0.0-14.0) 28.0% (11.2-44.7) 45.4% (24.1-66.8) 21.9% (1.2-42.6)<br />
Education Less than H.S. 119 3.3% (0.0-8.4) 29.3% (17.4-41.3) 45.5% (31.6-59.4) 21.9% (9.5-34.3)<br />
H.S. or G.E.D. 486 2.8% (0.5-5.1) 38.1% (30.9-45.3) 42.9% (35.5-50.3) 16.2% (11.4-21.1)<br />
Some Post H.S. 510 2.5% (0.6-4.5) 39.1% (31.7-46.6) 40.6% (33.5-47.8) 17.7% (12.8-22.6)<br />
College Graduate 496 2.2% (0.6-3.9) 40.4% (33.9-46.9) 38.7% (32.1-45.4) 18.6% (13.9-23.4)<br />
In<strong>com</strong>e < $15K 163 1.7% (0.2-3.1) 36.5% (25.3-47.8) 41.9% (29.9-53.9) 19.9% (11.3-28.4)<br />
$15K to $24,999 294 1.8% (0.0-3.6) 44.4% (34.0-54.8) 36.4% (26.5-46.3) 17.4% (10.2-24.5)<br />
$25K to $34,999 208 1.6% (0.0-3.3) 35.1% (22.8-47.3) 39.9% (25.9-53.9) 23.4% (9.3-37.6)<br />
$35K to $49,999 229 6.3% (0.1-12.4) 30.0% (19.3-40.6) 44.6% (32.9-56.4) 19.1% (12.7-25.6)<br />
$50K to $74,999 222 0.4% (0.0-0.9) 29.1% (20.2-38.0) 49.9% (40.1-59.7) 20.6% (13.1-28.1)<br />
$75K & Higher 208 0.2% (0.0-0.6) 34.9% (25.5-44.3) 48.0% (37.7-58.3) 17.0% (9.9-24.0)<br />
*Sample sizes less than 50 are marked with ‘~’. Due to the small samples sizes, responses may not reliably represent the population; therefore, are not included.<br />
(CDC: BRFSS, 2011)
Table HR12<br />
<strong>Nevada</strong> Adults 65 and Older: Had Cholesterol Checked in Lifetime<br />
Demographic Grouping N* Yes No<br />
% C.I. % C.I.<br />
Region Statewide 1,651 94.7% (92.9-96.6) 5.3% (3.4-7.1)<br />
Southern Urban/Metro 586 94.7% (92.0-97.4) 5.3% (2.6-8.0)<br />
Northern Urban/Metro 599 97.3% (96.0-98.7) 2.7% (1.3-4.0)<br />
Rural/Frontier 466 91.6% (87.8-95.5) 8.4% (4.5-12.2)<br />
Age 65-74 1,022 96.5% (94.3-98.7) 3.5% (1.3-5.7)<br />
75-84 448 92.0% (88.4-95.6) 8.0% (4.4-11.6)<br />
85 and Older 123 90.4% (80.3-100.0) 9.6% (0.0-19.7)<br />
Sex Male 661 94.1% (91.1-97.1) 5.9% (2.9-8.9)<br />
Female 990 95.3% (92.9-97.6) 4.7% (2.4-7.1)<br />
Race White 1,425 94.9% (92.7-97.1) 5.1% (2.9-7.3)<br />
Black 46 ~ ~ ~ ~<br />
Other Race 94 95.1% (89.9-100.0) 4.9% (0.0-10.1)<br />
Hispanic 58 97.4% (92.1-100.0) 2.6% (0.0-7.9)<br />
Education Less than H.S. 122 92.0% (86.6-97.4) 8.0% (2.6-13.4)<br />
H.S. or G.E.D. 503 93.6% (89.6-97.6) 6.4% (2.4-10.4)<br />
Some Post H.S. 517 96.2% (93.6-98.9) 3.8% (1.1-6.4)<br />
College Graduate 505 97.0% (94.4-99.6) 3.0% (0.4-5.6)<br />
In<strong>com</strong>e < $15,000 162 93.6% (86.9-100.0) 6.4% (0.0-13.1)<br />
$15,000 to $24,999 304 92.7% (87.1-98.3) 7.3% (1.7-12.9)<br />
$25,000 to $34,999 210 94.2% (88.9-99.5) 5.8% (0.5-11.1)<br />
$35,000 to $49,999 230 96.2% (92.2-100.0) 3.8% (0.0-7.8)<br />
$50,000 to $74,999 224 96.4% (92.5-100.0) 3.6% (0.0-7.5)<br />
$75,000+ 208 99.3% (98.1-100.0) 0.7% (0.0-1.9)<br />
Health Risks & Behaviors<br />
*Sample sizes less than 50 are marked with ‘~’. Due to the small samples sizes, responses may not reliably represent the population;<br />
therefore, are not included.<br />
(CDC: BRFSS, 2011)<br />
131
Health Risks & Behaviors<br />
Table HR13<br />
<strong>Nevada</strong> Adults 65 and Older: Had Cholesterol Checked Within Past Five Years<br />
Demographic Grouping N* Yes No<br />
% C.I. % C.I.<br />
Region Statewide 1,629 92.7% (90.6-94.9) 7.3% (5.1-9.4)<br />
Southern Urban/Metro 577 93.5% (90.6-96.4) 6.5% (3.6-9.4)<br />
Northern Urban/Metro 592 93.3% (90.6-96.0) 6.7% (4.0-9.4)<br />
Rural/Frontier 460 88.6% (83.9-93.4) 11.4% (6.6-16.1)<br />
Age 65-74 1,010 94.2% (91.5-96.8) 5.8% (3.2-8.5)<br />
75-84 443 90.4% (86.6-94.2) 9.6% (5.8-13.4)<br />
85 and Older 119 88.5% (78.0-99.0) 11.5% (1.0-22.0)<br />
Sex Male 655 92.9% (89.6-96.2) 7.1% (3.8-10.4)<br />
Female 974 92.6% (89.8-95.4) 7.4% (4.6-10.2)<br />
Race White 1,404 92.9% (90.5-95.3) 7.1% (4.7-9.5)<br />
Black 46 ~ ~ ~ ~<br />
Other Race 93 94.9% (89.7-100.0) 5.1% (0.0-10.3)<br />
Hispanic 58 95.3% (89.1-100.0) 4.7% (0.0-10.9)<br />
Education Less than H.S. 121 90.4% (84.7-96.1) 9.6% (3.9-15.3)<br />
H.S. or G.E.D. 496 90.8% (86.3-95.3) 9.2% (4.7-13.7)<br />
Some Post H.S. 508 94.8% (91.8-97.7) 5.2% (2.3-8.2)<br />
College Graduate 500 96.3% (93.6-99.0) 3.7% (1.0-6.4)<br />
In<strong>com</strong>e < $15,000 162 90.2% (82.3-98.2) 9.8% (1.8-17.7)<br />
$15,000 to $24,999 300 89.7% (83.7-95.7) 10.3% (4.3-16.3)<br />
$25,000 to $34,999 206 94.1% (88.8-99.5) 5.9% (0.5-11.2)<br />
$35,000 to $49,999 227 95.8% (91.8-99.8) 4.2% (0.2-8.2)<br />
$50,000 to $74,999 223 96.1% (92.2-100.0) 3.9% (0.0-7.8)<br />
$75,000+ 206 98.5% (96.8-100.0) 1.5% (0.0-3.2)<br />
*Sample sizes less than 50 are marked with ‘~’. Due to the small samples sizes, responses may not reliably represent the population;<br />
therefore, are not included.<br />
(CDC: BRFSS, 2011)<br />
132
Table HR14<br />
<strong>Nevada</strong> Adults 65 and Older: Advised They Have High Cholesterol<br />
Demographic Grouping N* Yes No<br />
% C.I. % C.I.<br />
Region Statewide 1,562 54.0% (49.5-58.5) 46.0% (41.5-50.5)<br />
Southern Urban/Metro 557 55.2% (48.8-61.6) 44.8% (38.4-51.2)<br />
Northern Urban/Metro 575 54.0% (48.4-59.7) 46.0% (40.3-51.6)<br />
Rural/Frontier 430 48.0% (40.9-55.2) 52.0% (44.8-59.1)<br />
Age 65-74 985 61.0% (55.4-66.5) 39.0% (33.5-44.6)<br />
75-84 407 45.4% (37.4-53.5) 54.6% (46.5-62.6)<br />
85 and Older 114 31.7% (17.6-45.7) 68.3% (54.3-82.4)<br />
Gender Male 624 55.3% (49.0-61.6) 44.7% (38.4-51.0)<br />
Female 938 52.8% (46.4-59.2) 47.2% (40.8-53.6)<br />
Race White 1,356 53.6% (48.9-58.2) 46.4% (41.8-51.1)<br />
Black 42 ~ ~ ~ ~<br />
Other Race 85 60.1% (43.1-77.0) 39.9% (23.0-56.9)<br />
Hispanic 56 52.6% (31.0-74.2) 47.4% (25.8-69.0)<br />
Education Less than H.S. 107 51.7% (37.1-66.3) 48.3% (33.7-62.9)<br />
H.S. or G.E.D. 467 57.3% (49.9-64.7) 42.7% (35.3-50.1)<br />
Some Post H.S. 493 58.7% (51.3-66.2) 41.3% (33.8-48.7)<br />
College Graduate 491 45.7% (39.2-52.3) 54.3% (47.7-60.8)<br />
In<strong>com</strong>e < $15,000 150 60.9% (49.1-72.7) 39.1% (27.3-50.9)<br />
$15,000 to $24,999 281 51.2% (40.6-61.8) 48.8% (38.2-59.4)<br />
$25,000 to $34,999 195 57.3% (42.2-72.4) 42.7% (27.6-57.8)<br />
$35,000 to $49,999 222 59.3% (48.0-70.6) 40.7% (29.4-52.0)<br />
$50,000 to $74,999 217 59.1% (49.6-68.5) 40.9% (31.5-50.4)<br />
$75,000+ 206 48.9% (38.2-59.7) 51.1% (40.3-61.8)<br />
Health Risks & Behaviors<br />
*Sample sizes less than 50 are marked with ‘~’. Due to the small samples sizes, responses may not reliably represent the population;<br />
therefore, are not included.<br />
(CDC: BRFSS, 2011)<br />
133
Health Risks & Behaviors<br />
Table HR15<br />
<strong>Nevada</strong> Adults 65 and Older: Advised They Had Hypertension<br />
Demographic Grouping N* Yes No<br />
% C.I. % C.I.<br />
Region Statewide 1,667 61.2% (57.3-65.2) 38.8% (34.8-42.7)<br />
Southern Urban/Metro 593 63.4% (57.9-68.9) 36.6% (31.1-42.1)<br />
Northern Urban/Metro 605 57.3% (51.8-62.8) 42.7% (37.2-48.2)<br />
Rural/Frontier 469 56.6% (49.8-63.3) 43.4% (36.7-50.2)<br />
Age 65-74 1,029 59.5% (54.3-64.8) 40.5% (35.2-45.7)<br />
75-84 451 65.2% (58.2-72.2) 34.8% (27.8-41.8)<br />
85 and Older 129 58.8% (43.5-74.1) 41.2% (25.9-56.5)<br />
Gender Male 667 59.0% (53.0-65.0) 41.0% (35.0-47.0)<br />
Female 1,000 63.2% (58.0-68.4) 36.8% (31.6-42.0)<br />
Race White 1,442 60.7% (56.4-65.0) 39.3% (35.0-43.6)<br />
Black 47 ~ ~ ~ ~<br />
Other Race 94 63.2% (47.6-78.8) 36.8% (21.2-52.4)<br />
Hispanic 56 52.2% (31.6-72.8) 47.8% (27.2-68.4)<br />
Education Less than H.S. 118 76.3% (66.2-86.5) 23.7% (13.5-33.8)<br />
H.S. or G.E.D. 511 61.5% (54.5-68.4) 38.5% (31.6-45.5)<br />
Some Post H.S. 526 56.4% (49.2-63.5) 43.6% (36.5-50.8)<br />
College Graduate 509 54.6% (48.0-61.2) 45.4% (38.8-52.0)<br />
In<strong>com</strong>e < $15,000 164 75.2% (66.0-84.5) 24.8% (15.5-34.0)<br />
$15K to $24,999 307 66.5% (57.5-75.4) 33.5% (24.6-42.5)<br />
$25K to $34,999 211 71.7% (61.8-81.7) 28.3% (18.3-38.2)<br />
$35K to $49,999 233 58.7% (47.6-69.7) 41.3% (30.3-52.4)<br />
$50K to $74,999 227 58.9% (49.4-68.5) 41.1% (31.5-50.6)<br />
$75K and Higher 209 43.1% (32.7-53.6) 56.9% (46.4-67.3)<br />
*Sample sizes less than 50 are marked with ‘~’. Due to the small samples sizes, responses may not reliably represent the population;<br />
therefore, are not included.<br />
(CDC: BRFSS, 2011<br />
134
Table HR16<br />
<strong>Nevada</strong> Adults 65 and Older: Flu Shot within the Past Year<br />
Demographic Grouping N* Yes No<br />
% C.I. % C.I.<br />
Region Statewide 1,510 53.7% (49.2-58.3) 46.3% (41.7-50.8)<br />
Southern Urban/Metro 528 55.0% (48.5-61.4) 45.0% (38.6-51.5)<br />
Northern Urban/Metro 554 52.9% (47.2-58.5) 47.1% (41.5-52.8)<br />
Rural/Frontier 428 49.4% (42.3-56.5) 50.6% (43.5-57.7)<br />
Age 65-74 936 52.4% (46.3-58.4) 47.6% (41.6-53.7)<br />
75-84 413 53.6% (45.3-61.9) 46.4% (38.1-54.7)<br />
85 and older 108 63.2% (46.7-79.7) 36.8% (20.3-53.3)<br />
Sex Male 600 53.2% (46.7-59.6) 46.8% (40.4-53.3)<br />
Female 910 54.2% (47.8-60.7) 45.8% (39.3-52.2)<br />
Race White 1,308 55.0% (50.3-59.7) 45.0% (40.3-49.7)<br />
Black 42 ~ ~ ~ ~<br />
Other Race 84 62.0% (46.0-78.0) 38.0% (22.0-54.0)<br />
Hispanic 50 45.8% (23.0-68.6) 54.2% (31.4-77.0)<br />
Education Less than H.S. 108 48.6% (33.6-63.6) 51.4% (36.4-66.4)<br />
H.S. or G.E.D. 454 51.9% (44.2-59.7) 48.1% (40.3-55.8)<br />
Some Post H.S. 480 57.9% (50.7-65.0) 42.1% (35.0-49.3)<br />
College Graduate 464 54.4% (47.6-61.3) 45.6% (38.7-52.4)<br />
In<strong>com</strong>e < $15,000 152 48.6% (36.3-60.9) 51.4% (39.1-63.7)<br />
$15,000 to $24,999 284 52.0% (41.4-62.6) 48.0% (37.4-58.6)<br />
$25,000 to $34,999 192 53.6% (38.3-68.8) 46.4% (31.2-61.7)<br />
$35,000 to $49,999 209 58.8% (47.9-69.7) 41.2% (30.3-52.1)<br />
$50,000 to $74,999 201 57.0% (46.7-67.3) 43.0% (32.7-53.3)<br />
$75,000+ 200 47.5% (36.5-58.5) 52.5% (41.5-63.5)<br />
Health Risks & Behaviors<br />
*Sample sizes less than 50 are marked with ‘~’. Due to the small samples sizes, responses may not reliably represent the population;<br />
therefore, are not included.<br />
(CDC: BRFSS, 2011)<br />
135
Health Risks & Behaviors<br />
Table HR17<br />
<strong>Nevada</strong> Adults 65 and Older: Had the Pneumonia Vaccine in the Past<br />
Demographic Grouping N* Yes No<br />
% C.I. % C.I.<br />
Region Statewide 1,453 68.9% (64.3-73.5) 31.1% (26.5-35.7)<br />
Southern Urban/Metro 504 68.5% (61.8-75.1) 31.5% (24.9-38.2)<br />
Northern Urban/Metro 538 74.6% (69.6-79.5) 25.4% (20.5-30.4)<br />
Rural/Frontier 411 63.3% (56.3-70.3) 36.7% (29.7-43.7)<br />
Age 65-74 897 64.0% (57.7-70.4) 36.0% (29.6-42.3)<br />
75-84 402 74.8% (67.2-82.3) 25.2% (17.7-32.8)<br />
85 and Older 104 83.0% (70.6-95.4) 17.0% (4.6-29.4)<br />
Sex Male 572 69.2% (62.8-75.6) 30.8% (24.4-37.2)<br />
Female 881 68.6% (62.0-75.2) 31.4% (24.8-38.0)<br />
Race White 1,262 70.8% (66.3-75.2) 29.2% (24.8-33.7)<br />
Black 39 ~ ~ ~ ~<br />
Other Race 77 72.1% (57.8-86.3) 27.9% (13.7-42.2)<br />
Hispanic 50 49.8% (26.8-72.8) 50.2% (27.2-73.2)<br />
Education Less than H.S. 104 63.9% (47.6-80.2) 36.1% (19.8-52.4)<br />
H.S. or G.E.D. 442 71.3% (64.3-78.2) 28.7% (21.8-35.7)<br />
Some Post H.S. 457 70.9% (64.1-77.7) 29.1% (22.3-35.9)<br />
College Graduate 446 70.0% (63.2-76.8) 30.0% (23.2-36.8)<br />
In<strong>com</strong>e < $15,000 147 69.0% (56.4-81.6) 31.0% (18.4-43.6)<br />
$15,000 to $24,999 274 75.5% (67.3-83.6) 24.5% (16.4-32.7)<br />
$25,000 to $34,999 181 54.5% (38.1-70.9) 45.5% (29.1-61.9)<br />
$35,000 to $49,999 209 75.0% (66.6-83.4) 25.0% (16.6-33.4)<br />
$50,000 to $74,999 190 72.7% (63.2-82.2) 27.3% (17.8-36.8)<br />
$75,000+ 191 69.1% (59.4-78.8) 30.9% (21.2-40.6)<br />
*Sample sizes less than 50 are marked with ‘~’. Due to the small samples sizes, responses may not reliably represent the population;<br />
therefore, are not included.<br />
(CDC: BRFSS, 2011)<br />
136
Table HR18<br />
U.S. Preventive Services Task Force Re<strong>com</strong>mendations for Cancer Screening in Adults<br />
Type <strong>of</strong> Cancer Year Re<strong>com</strong>mendations<br />
Breast/Ovarian 2005 Re<strong>com</strong>mends genetic counseling, screening, and a consideration <strong>of</strong><br />
prophylactic treatment for women with a family history <strong>of</strong> breast or<br />
ovarian cancer related to mutations in the BRCA1 or BRCA2 genes<br />
2009 Re<strong>com</strong>mends biennial mammography for women 50-74 but<br />
concluded that there was insufficient evidence for mammography<br />
screening after the age <strong>of</strong> 75<br />
2012 Re<strong>com</strong>mends against screening for ovarian cancer in women<br />
Cervical 2012 Women 21-65, re<strong>com</strong>mends cytology (Pap) cervical screening every<br />
three years<br />
Women 30-65, re<strong>com</strong>mends cytology (Pap) and Human<br />
Papillomarvirus (HPV) screening every five years<br />
Women 66 and older, no screening re<strong>com</strong>mended in women who<br />
have had adequate prior screening and are not at high risk<br />
Colorectal 2008 Age 50-75, re<strong>com</strong>mends screening using fecal occult blood testing,<br />
sigmoidoscopy or colonoscopy. Re<strong>com</strong>mends against routine<br />
screening for adults 76-85 and re<strong>com</strong>mends against any screening for<br />
adults 85 and older.<br />
Prostate 2012 Re<strong>com</strong>mends against prostate-specific antigen (PSA) screening for<br />
prostate cancer due to over-diagnosis rates <strong>of</strong> 17-50%<br />
Health Risks & Behaviors<br />
(USPSTF: Breast Cancer Screening, 2012)<br />
137
Health Risks & Behaviors<br />
Table HR19<br />
<strong>Nevada</strong> Adults 65 and Older: Had a Blood Stool Test Within the Past Two Years<br />
Demographic Grouping N* Yes No<br />
% C.I. % C.I.<br />
Region Statewide 1,205 21.2% (18.1-24.4) 78.8% (75.6-81.9)<br />
Southern Urban/Metro 394 21.3% (16.8-25.8) 78.7% (74.2-83.2)<br />
Northern Urban/Metro 471 20.7% (16.4-24.9) 79.3% (75.1-83.6)<br />
Rural/Frontier 340 21.8% (17.1-26.5) 78.2% (73.5-82.9)<br />
Age 65-74 732 20.5% (16.3-24.6) 79.5% (75.4-83.7)<br />
75-84 338 21.4% (15.8-27.0) 78.6% (73.0-84.2)<br />
85 and Older 93 19.0% (6.6-31.3) 81.0% (68.7-93.4)<br />
Sex Male 510 22.2% (17.3-27.0) 77.8% (73.0-82.7)<br />
Female 695 20.4% (16.3-24.6) 79.6% (75.4-83.7)<br />
Race White 1,035 21.4% (18.0-24.7) 78.6% (75.3-82.0)<br />
Black 29 ~ ~ ~ ~<br />
Other Race 76 19.9% (7.2-32.6) 80.1% (67.4-92.8)<br />
Hispanic 44 ~ ~ ~ ~<br />
Education Less than H.S. 104 17.1% (8.3-26.0) 82.9% (74.0-91.7)<br />
H.S. or G.E.D. 403 19.6% (14.6-24.7) 80.4% (75.3-85.4)<br />
Some Post H.S. 386 23.4% (17.1-29.7) 76.6% (70.3-82.9)<br />
College Graduate 309 22.0% (15.9-28.0) 78.0% (72.0-84.1)<br />
In<strong>com</strong>e < $15,000 113 25.9% (15.2-36.6) 74.1% (63.4-84.8)<br />
$15,000 to $24,999 236 20.3% (13.8-26.7) 79.7% (73.3-86.2)<br />
$25,000 to $34,999 143 28.8% (17.4-40.3) 71.2% (59.7-82.6)<br />
$35,000 to $49,999 199 25.5% (16.7-34.3) 74.5% (65.7-83.3)<br />
$50,000 to $74,999 127 15.6% (7.7-23.5) 84.4% (76.5-92.3)<br />
$75,000+ 143 16.1% (8.5-23.7) 83.9% (76.3-91.5)<br />
*Sample sizes less than 50 are marked with ‘~’. Due to the small samples sizes, responses may not reliably represent the population;<br />
therefore, are not included.<br />
(CDC: BRFSS, 2010)<br />
138
Table HR20<br />
<strong>Nevada</strong> Adults 65 and Older: Had Sigmoidoscopy or Colonoscopy<br />
Demographic Grouping N* Yes No<br />
% C.I. % C.I.<br />
Region Statewide 1,224 67.6% (63.9-71.4) 32.4% (28.6-36.1)<br />
Southern Urban/Metro 399 66.6% (61.2-72.0) 33.4% (28.0-38.8)<br />
Northern Urban/Metro 478 72.8% (68.4-77.3) 27.2% (22.7-31.6)<br />
Rural/Frontier 347 64.8% (59.2-70.3) 35.2% (29.7-40.8)<br />
Age 65-74 744 68.6% (63.8-73.4) 31.4% (26.6-36.2)<br />
75-84 346 68.9% (62.3-75.5) 31.1% (24.5-37.7)<br />
85 and Older 92 59.3% (46.1-72.5) 40.7% (27.5-53.9)<br />
Sex Male 515 72.0% (67.0-77.1) 28.0% (22.9-33.0)<br />
Female 709 63.7% (58.4-69.0) 36.3% (31.0-41.6)<br />
Race White 1,052 68.6% (64.5-72.6) 31.4% (27.4-35.5)<br />
Black 28 ~ ~ ~ ~<br />
Other Race 79 55.2% (39.1-71.3) 44.8% (28.7-60.9)<br />
Hispanic 44 ~ ~ ~ ~<br />
Education Less than H.S. 100 56.5% (42.5-70.5) 43.5% (29.5-57.5)<br />
H.S. or G.E.D. 411 62.3% (55.6-69.0) 37.7% (31.0-44.4)<br />
Some Post H.S. 394 70.8% (64.2-77.4) 29.2% (22.6-35.8)<br />
College Graduate 316 74.0% (67.3-80.8) 26.0% (19.2-32.7)<br />
In<strong>com</strong>e < $15,000 113 55.2% (43.4-67.1) 44.8% (32.9-56.6)<br />
$15,000 to $24,999 239 56.0% (46.3-65.6) 44.0% (34.4-53.7)<br />
$25,000 to $34,999 147 76.5% (67.0-86.0) 23.5% (14.0-33.0)<br />
$35,000 to $49,999 202 74.4% (66.2-82.6) 25.6% (17.4-33.8)<br />
$50,000 to $74,999 131 74.6% (63.8-85.5) 25.4% (14.5-36.2)<br />
$75,000+ 147 77.2% (67.9-86.5) 22.8% (13.5-32.1)<br />
Health Risks & Behaviors<br />
*Sample sizes less than 50 are marked with ‘~’. Due to the small samples sizes, responses may not reliably represent the population;<br />
therefore, are not included.<br />
(CDC: BRFSS, 2010)<br />
139
Health Risks & Behaviors<br />
Table HR21<br />
<strong>Nevada</strong> Adults 65 and Older: Had a PSA Test Within the Past Two Years<br />
Demographic Grouping N* Yes No<br />
% C.I. % C.I.<br />
Region Statewide 498 75.5% (70.4-80.6) 24.5% (19.4-29.6)<br />
Southern Urban/Metro 169 76.4% (69.1-83.6) 23.6% (16.4-30.9)<br />
Northern Urban/Metro 190 76.1% (69.5-82.6) 23.9% (17.4-30.5)<br />
Rural/Frontier 139 70.8% (63.5-78.2) 29.2% (21.8-36.5)<br />
Age 65-74 300 73.4% (66.6-80.3) 26.6% (19.7-33.4)<br />
75-84 148 80.7% (72.4-89.0) 19.3% (11.0-27.6)<br />
85 and Older 33 62.5% (38.8-86.3) 37.5% (13.7-61.2)<br />
Race White 427 74.7% (68.9-80.4) 25.3% (19.6-31.1)<br />
Black 9 ~ ~ ~ ~<br />
Other Race 33 ~ ~ ~ ~<br />
Hispanic 19 ~ ~ ~ ~<br />
Education Less than H.S. 43 71.5% (56.2-86.8) 28.5% (13.2-43.8)<br />
H.S. or G.E.D. 137 66.0% (54.5-77.6) 34.0% (22.4-45.5)<br />
Some Post H.S. 145 79.9% (71.5-88.4) 20.1% (11.6-28.5)<br />
College Graduate 171 79.6% (71.1-88.2) 20.4% (11.8-28.9)<br />
In<strong>com</strong>e < $15,000 30 56.5% (34.1-78.9) 43.5% (21.1-65.9)<br />
$15,000 to $24,999 92 69.9% (57.7-82.1) 30.1% (17.9-42.3)<br />
$25,000 to $34,999 61 87.2% (78.9-95.5) 12.8% (4.5-21.1)<br />
$35,000 to $49,999 91 72.5% (59.3-85.7) 27.5% (14.3-40.7)<br />
$50,000 to $74,999 73 81.1% (68.0-94.2) 18.9% (5.8-32.0)<br />
$75,000+ 89 76.8% (64.7-88.9) 23.2% (11.1-35.3)<br />
*Sample sizes less than 50 are marked with ‘~’. Due to the small samples sizes, responses may not reliably represent the population;<br />
therefore, are not included.<br />
(CDC: BRFSS, 2010)<br />
140
Table HR22<br />
<strong>Nevada</strong> Adults 65 and Older: Had a Mammogram in the Past Two Years<br />
Demographic Grouping N* Yes No<br />
% C.I. % C.I.<br />
Region Statewide 713 70.4% (65.2-75.6) 29.6% (24.4-34.8)<br />
Southern Urban/Metro 228 70.4% (63.0-77.9) 29.6% (22.1-37.0)<br />
Northern Urban/Metro 283 71.6% (65.4-77.7) 28.4% (22.3-34.6)<br />
Rural/Frontier 202 68.5% (61.0-76.0) 31.5% (24.0-39.0)<br />
Age 65-74 434 77.0% (70.6-83.3) 23.0% (16.7-29.4)<br />
75-84 194 65.5% (56.1-74.8) 34.5% (25.2-43.9)<br />
85 and Older 60 54.7% (37.8-71.6) 45.3% (28.4-62.2)<br />
Race White 614 70.9% (65.1-76.6) 29.1% (23.4-34.9)<br />
Black 20 ~ ~ ~ ~<br />
Other Race 46 ~ ~ ~ ~<br />
Hispanic 24 ~ ~ ~ ~<br />
Education Less than H.S. 60 49.7% (28.8-70.7) 50.3% (29.3-71.2)<br />
H.S. or G.E.D. 269 69.3% (61.3-77.4) 30.7% (22.6-38.7)<br />
Some Post H.S. 242 72.3% (63.0-81.7) 27.7% (18.3-37.0)<br />
College Graduate 142 79.8% (71.6-88.0) 20.2% (12.0-28.4)<br />
In<strong>com</strong>e < $15,000 82 66.6% (56.6-76.7) 33.4% (23.3-43.4)<br />
$15,000 to $24,999 143 61.5% (47.0-76.1) 38.5% (23.9-53.0)<br />
$25,000 to $34,999 86 56.2% (38.8-73.5) 43.8% (26.5-61.2)<br />
$35,000 to $49,999 106 74.5% (63.0-86.0) 25.5% (14.0-37.0)<br />
$50,000 to $74,999 55 83.1% (67.9-98.4) 16.9% (1.6-32.1)<br />
$75,000+ 58 87.9% (78.1-97.7) 12.1% (2.3-21.9)<br />
Health Risks & Behaviors<br />
*Sample sizes less than 50 are marked with ‘~’. Due to the small samples sizes, responses may not reliably represent the population;<br />
therefore, are not included.<br />
(CDC: BRFSS, 2010)<br />
141
Health Risks & Behaviors<br />
Table HR23<br />
U.S., 2010: Estimated Number <strong>of</strong> HIV/AIDS Diagnoses by Age<br />
HIV<br />
AIDS<br />
Under 13 217 23<br />
13-14 Years 34 52<br />
15-19 Years 2,200 529<br />
20-24 Years 7,565 2,262<br />
25-29 Years 6,823 3,379<br />
30-34 Years 5,954 4,009<br />
35-39 Years 5,523 4,464<br />
40-44 Years 5,720 5,198<br />
45-49 Years 5,296 5,194<br />
50-54 Years 3,671 3,825<br />
55-59 Years 2,154 2,100<br />
60-64 Years 1,119 1,094<br />
65 or Older 853 889<br />
(CDC: HIV/AIDS, Statistics, 2012)<br />
142
Table HR24<br />
U.S. and <strong>Nevada</strong>, 2010: Rate <strong>of</strong> New AIDS Diagnoses<br />
Demographic Grouping Rate per 100,000<br />
U.S.<br />
<strong>Nevada</strong><br />
Year 2000 17.3 16.9<br />
2001 16.6 13.3<br />
2002 16.5 16.2<br />
2003 16.6 13.9<br />
2004 15.9 15.1<br />
2005 15 15.6<br />
2006 14.2 13<br />
2007 13.7 13.8<br />
2008 13.3 13.9<br />
2009 13 11.9<br />
2010 13 12.6<br />
Sex Male 19.9 20.8<br />
Female 6.3 4.1<br />
Age 55 and Older 5.4 6.3<br />
Race White 5.1 8.8<br />
Black 53.3 42.1<br />
Asian 4.2 8.9<br />
Multi 21.3 11.4<br />
Hispanic 18.5 14.2<br />
Health Risks & Behaviors<br />
(CDC: NCHHSTP Atlas, 2012)<br />
Table HR25<br />
New HIV Infections and Persons Living with HIV/AIDS in <strong>Nevada</strong>, 2011<br />
New HIV Infections<br />
Living with HIV/AIDS<br />
N Rate* N Rate*<br />
65+ 6 1.8 325 98.2<br />
Total 378 14.1 7,284 271.8<br />
[ <strong>Nevada</strong> State Health Division HIV/AIDS Reporting System (eHARS), 2012]<br />
*Rate per 100,000 population is based on 2012 interim population estimates from NV Demographics.<br />
143
Health Risks & Behaviors<br />
Table HR26<br />
Persons 65 and Older Living with HIV/AIDS* in <strong>Nevada</strong>, 2011<br />
Demographic Grouping 2011<br />
n % Rate**<br />
Region Southern Urban/Metro 261 80.3% 112.8<br />
(at Diagnosis) Northern Urban/Metro 40 12.3% 73.0<br />
Rural/Frontier 24 7.4% 53.6<br />
Age 65 to 74 282 86.8% 144.0<br />
75 to 84 41 12.6% 39.8<br />
85 and Older 2 0.6% 6.2<br />
Sex Male 278 85.5% 185.0<br />
Female 47 14.5% 26.0<br />
Race White, non-Hispanic 224 68.9% 114.4<br />
Black, non-Hispanic 50 15.4% 48.6<br />
Other*** 11 3.4% N/A<br />
Hispanic 40 12.3% 124.4<br />
Transmission Males<br />
Category Male-to-Male Sexual Contact (MSM) 203 73.0% N/A<br />
Injection Drug use (IDU) 23 8.3% N/A<br />
MSM+IDU 9 3.2% N/A<br />
Heterosexual contact 11 4.0% N/A<br />
Perinatal Exposure 0 0.0% N/A<br />
Transfusion/Hemophilia 1 0.4% N/A<br />
Risk Factor Not Identified or Reported 31 11.2% N/A<br />
Subtotal 278 100.0% 185.0<br />
Females<br />
Injection Drug Use 6 12.8% N/A<br />
Heterosexual contact 37 78.7% N/A<br />
Perinatal Exposure 0 0.0% N/A<br />
Transfusion/Hemophilia 0 0.0% N/A<br />
Risk Factor Not Identified or Reported 4 8.5% N/A<br />
Subtotal 47 100.0% 26.0<br />
Total 325 100.0% 98.2<br />
[<strong>Nevada</strong> State Health Division HIV/AIDS Reporting System (eHARS), 2012]<br />
*Persons living with HIV/AIDS data include data on persons living in <strong>Nevada</strong> with HIV (not yet AIDS) and AIDS based on the current address listed<br />
in the HIV/AIDS Reporting System (eHARS). These persons may or may not have been diagnosed with HIV or AIDS in <strong>Nevada</strong>.<br />
**Rate per 100,000 population is based on 2012 interim population estimates from NV Demographics.<br />
*** Includes persons who identified as Asian/Hawaiian/Pacific Islander, American Indian/Alaska Native, or multi-race/other.<br />
144
Table HR27<br />
<strong>Nevada</strong> Adults 65 and Older: STD Cases, 2011<br />
Chlamydia Gonorrhea Primary & Secondary (P&S) Early Latent (EL)<br />
Syphilis** Syphilis**<br />
N % Rate* N % Rate* N % Rate* N % Rate*<br />
Region at Diagnosis<br />
Southern<br />
Urban/Metro 8 61.5% 3.5 4 66.7% 1.7 2 50.0% 0.9 1 100% 0.4<br />
Northern<br />
Urban/Metro 3 23.1% 5.5 1 16.7% 1.8 0 0.0% 0.0 0 0.0% 0.0<br />
Rural/Frontier 2 15.4% 4.5 1 16.7% 2.2 2 50.0% 4.5 0 0.0% 0.0<br />
Total 13 100% 3.9 6 100% 1.8 4 100% 1.2 1 100% 0.3<br />
Sex<br />
Male 10 76.9% 6.7 5 83.3% 3.3 2 100% 1.3 1 100% 0.7<br />
Female 3 23.1% 1.7 1 16.7% 0.6 0 0.0% 0.0 0 0.0% 0.0<br />
Total 13 100% 3.9 6 100% 1.8 2 100% 0.6 1 100% 0.3<br />
*Rate per 100,000 population is based on 2012 interim population estimates from NV Demographics.<br />
** Primary/Secondary Syphilis: Primary stage is highly contagious, lasts 1-5 weeks, secondary lasts 4-6 weeks. Early Latent Syphilis - Less than one-year’s duration.<br />
(<strong>Nevada</strong> State Health Division Sexually Transmitted Disease Management Information Systems (STD*MIS), data as <strong>of</strong> August 2012)<br />
Health Risks & Behaviors<br />
145
Health Risks & Behaviors<br />
146<br />
Table HR28<br />
U.S. Adults 65 and Older, 2011: Ten Leading Causes <strong>of</strong> Nonfatal Injury<br />
CV<br />
(SE/National Lower 95% Upper 95%<br />
Rank Cause <strong>of</strong> Injury Injuries % Std Error Estimate) CI CI<br />
0 Overall Injuries 3,821,222 100% 356,693.4 9.3% 3,122,102.9 4,520,341.2<br />
1 Unintentional Fall 2,403,146 62.9% 197,916.0 8.2% 2,015,230.2 2,791,061.0<br />
2 Unintentional Struck By/Against 269,421 7.1% 23,184.6 8.6% 223,978.7 314,862.5<br />
3 Unintentional Overexertion 203,047 5.3% 18,102.8 8.9% 167,565.5 238,528.5<br />
4 Unintentional MV-Occupant 194,678 5.1% 22,819.8 11.7% 149,951.5 239,405.1<br />
5 Unintentional Cut/Pierce 148,065 3.9% 12,831.3 8.7% 122,916.1 173,214.7<br />
6 Unintentional Poisoning 95,841 2.5% 12,372.6 12.9% 71,591.0 120,091.6<br />
7 Unintentional Other Bite/Sting 93,856 2.5% 10,847.7 11.6% 72,594.4 115,117.3<br />
8 Unintentional Other Specified 74,873 2.0% 11,388.7 15.2% 52,550.8 97,194.6<br />
9 Unintentional Other Transport 66,445 1.7% 6,592.9 9.9% 53,522.6 79,366.8<br />
10 Unintentional Unknown/Unspecified 56,754 1.5% 8,165.7 14.4% 40,749.5 72,759.1<br />
11 All Others* 215,096 5.6% . . . . .<br />
(CDC: WISQARS, 2011)
Table HR29<br />
U.S. Adults 65 and Older, 2007: Unintentional Fall Deaths and Rates per 100,000<br />
Sex Race Number <strong>of</strong> Crude<br />
Deaths Population Rate<br />
Males White 7,895 14,155,959 55.77<br />
Black 289 1,278,555 22.6<br />
American Indian/Alaskan Native 46 95,980 47.93<br />
Asian/Pacific Islander 178 558,615 31.86<br />
8,408 16,089,109 52.26<br />
Females White 9,417 18,870,496 49.9<br />
Black 311 2,006,642 15.5<br />
American Indian/Alaskan Native 29 122,652 23.64<br />
Asian/Pacific Islander 169 736,812 22.94<br />
9,926 21,736,602 45.66<br />
Total 18,334 37,825,711 48.47<br />
Health Risks & Behaviors<br />
(CDC: WISQARS, Fatal Injury Mortality Report, 2007)<br />
147
Health Risks & Behaviors<br />
148<br />
Table HR30<br />
<strong>Nevada</strong> Elder Abuse Reporting System: FY 2012 Allegations for Cases Closed Between 7/1/11 and 6/30/12<br />
Region Abuse Neglect Self-Neglect Exploitation Isolation Total<br />
Southern Urban Metropolitan<br />
ADSD 699 690 849 672 87 2997<br />
Law Enforcement 40 26 3 29 0 98<br />
Northern Urban Metropolitan<br />
ADSD 299 292 584 328 48 1551<br />
Law Enforcement 5 0 0 2 0 7<br />
Rural/Frontier<br />
ADSD 127 160 273 138 8 706<br />
Law Enforcement 6 5 2 2 0 15<br />
Statewide Total 1176 1173 1711 1171 143 5374<br />
(ADSD: EPS Caseload Statistics, 2012)
Table HR31<br />
<strong>Nevada</strong>, FY 2011 – FY 2012: Percent Change in EPS Cases<br />
Number <strong>of</strong> Cases<br />
% Change<br />
FY11<br />
FY12<br />
Abuse 1,036 1,176 13.5%<br />
Exploitation 1,139 1,171 2.8%<br />
Isolation 142 143 0.7%<br />
Neglect 1,061 1,173 10.6%<br />
Self-Neglect 1,859 1,711 (8%)<br />
(ADSD: EPS Caseload Statistics, 2012)<br />
Health Risks & Behaviors<br />
149
Health Risks & Behaviors<br />
150<br />
Table HR32<br />
<strong>Nevada</strong> Elder Abuse Reporting System: FY 2012, Substantiated and Unsubstantiated Allegations for Cases Closed Between 7/1/11 and 6/30/12*<br />
Region Abuse Neglect Self-Neglect Exploitation Isolation Total<br />
Southern Urban Metropolitan<br />
Substantiated<br />
ADSD 141 135 146 99 8 529<br />
Law Enforcement 6 0 1 0 0 7<br />
Unsubstantiated<br />
ADSD 558 555 703 574 79 2469<br />
Law Enforcement (LE) 4 5 0 7 0 15<br />
Northern Urban Metropolitan<br />
Substantiated<br />
ADSD 127 101 284 100 11 623<br />
Law Enforcement 1 0 0 2 0 3<br />
Unsubstantiated<br />
ADSD 172 190 300 228 37 927<br />
Law Enforcement 0 0 0 0 0 0<br />
Rural/Frontier<br />
Substantiated<br />
ADSD 37 47 104 37 0 225<br />
LE 1 1 0 1 0 3<br />
Unsubstantiated<br />
ADSD 90 113 169 101 8 481<br />
LE 1 0 0 1 0 2<br />
Substantiated Statewide Total 313 284 535 239 19 1390<br />
Unsubstantiated Statewide Total 825 863 1172 911 124 3895<br />
*Note: The LE reports received by ADSD do not always show that a case is substantiated or unsubstantiated; the status <strong>of</strong> an LE case may be unknown.<br />
(ADSD: EPS, 2012)
Table HR33<br />
U.S. Adults 65 and Older: Age by Motor Vehicle Deaths and Rates per 100,000<br />
Age Group Number <strong>of</strong> Deaths Population Crude Rate<br />
65-69 1,498 12,435,263 12.1<br />
70-74 1,178 9,278,166 12.7<br />
75-79 1,267 7,317,795 17.3<br />
80-84 1,191 5,743,327 20.7<br />
85+ 1,309 5,493,433 23.8<br />
Total 6,443 40,267,984 16.0<br />
(WISQARS, 2010)<br />
Table HR34<br />
Health Risks & Behaviors<br />
U.S. Adults 65 and Older: Sex and Age by Motor Vehicle Deaths and Rates per 100,000<br />
Age Group Sex Number <strong>of</strong> Deaths Population Crude Rate<br />
65-69 Males 978 5,852,547 16.7<br />
Females 520 6,582,716 7.9<br />
1,498 12,435,263 12.1<br />
70-74 Males 745 4,243,972 17.6<br />
Females 433 5,034,194 8.6<br />
1,178 9,278,166 12.7<br />
75-79 Males 767 3,182,388 24.1<br />
Females 500 4,135,407 12.1<br />
1,267 7,317,795 17.3<br />
80-84 Males 653 2,294,374 28.5<br />
Females 538 3,448,953 15.6<br />
1,191 5,743,327 20.7<br />
85+ Males 719 1,789,679 40.2<br />
Females 590 3,703,754 15.9<br />
1,309 5,493,433 23.8<br />
Total 6,443 40,267,984 16.0<br />
(WISQARS, 2010)<br />
151
Health Risks & Behaviors<br />
Table HR35<br />
U.S. Adults 65 and Older, 2010: Race by Motor Vehicle Fatalities<br />
Race Deaths Population Crude Rate<br />
White 5,731 34,971,197 16.4<br />
Black 462 3,541,901 13.0<br />
American Indian/Alaskan Native 51 255,214 20.0<br />
Asian/Pacific Islander 199 1,499,672 13.3<br />
Total 6,443 40,267,984 16.0<br />
(WISQARS, 2010)<br />
152
Table HR36<br />
U.S. Adults 65 and Older, 2011: Frequency <strong>of</strong> Seatbelt Use in Motor Vehicles<br />
Frequency* Weighted Std Dev 95% Confidence Limits Percent Std Err 95%<br />
Frequency <strong>of</strong> for Weighted Frequency <strong>of</strong> Confidence<br />
Weighted Percent Limits for<br />
Frequency Percent<br />
Always 1,386 267,785 10,087 248,000.0 287,570.0 89.8% 1.3 87.2% 92.4%<br />
Nearly Always 65 12,885 2,412 8,154.0 17,616.0 4.3% 0.8 2.7% 5.9%<br />
Sometimes 21 7,132 2,648 1,937.0 12,327.0 2.4% 0.9 0.7% 4.1%<br />
Seldom 10 1,708 782 174.0 3,242.0 0.6% 0.3 0.1% 1.1%<br />
Never 32 4,631 1,142 2,390.0 6,872.0 1.6% 0.4 0.8% 2.3%<br />
Never drive or ride in a car 11 4,009 1,545 979.1 7,040.0 1.3% 0.5 0.3% 2.4%<br />
Total 1,525 298,151 10,183 278,177.0 318,126.0 100%<br />
*Frequency Missing = 144 (CDC: BRFSS, 2011)<br />
Health Risks & Behaviors<br />
153
Health Risks & Behaviors<br />
154<br />
Table HR37<br />
Prevalence and Risk <strong>of</strong> Homelessness Among Veterans and Nonveterans in Poverty and General Populations in 7 U.S. Metropolitan Areas<br />
Age Race % Homelessness Poverty % Homelessness Poverty<br />
Population RR* Population RR**<br />
Veterans Nonveterans Veterans Nonveterans<br />
M F M F M F M F M F M F<br />
18-29 Black 52.8 36.3 11.8 15.7 4.5 2.3 5.4 7.9 2.6 4.6 2.1 1.7<br />
Non-Black 7.3 11.9 3.3 3.9 2.2 3.1 0.7 1.6 0.5 0.8 1.4 2.1<br />
30-44 Black 33.8 35.4 23.7 13.8 1.4 2.6 4.7 6.3 4.1 3.2 1.1 2.0<br />
Non-Black 17.2 12.1 7.7 4.4 2.2 2.8 1.0 0.9 0.7 0.6 1.3 1.5<br />
45-54 Black 38.0 29.1 24.6 10.7 1.5 2.7 7.3 3.2 4.8 2.0 1.5 1.6<br />
Non-Black 21.0 12.3 8.7 4.1 2.4 3.0 1.9 1.1 0.9 0.4 2.2 2.7<br />
55-64 Black 24.2 9.1 13.6 3.7 1.8 2.4 3.8 1.4 2.4 0.7 1.6 2.1<br />
Non-Black 10.5 9.3 5.6 1.8 1.9 5.2 0.6 0.6 0.6 0.2 1.1 3.3<br />
65+ Black 4.8 1.7 3.6 0.6 1.3 2.8 0.6 0.4 0.6 0.1 1.0 3.2<br />
Non-Black 2.1 0.8 1.2 0.3 1.8 2.9 0.1 0.1 0.1 0.0 0.7 2.3<br />
All Ages Black 26.8 29.7 17.7 11.6 2.5 2.5 4.0 4.9 3.4 2.7 1.5 2.1<br />
Non-Black 10.6 9.2 5.5 3.3 2.2 3.2 0.6 0.8 0.7 0.5 1.4 2.3<br />
All Ages All Races 14.6 15.0 7.9 5.1 2.2 3.0 1.0 1.6 1.0 0.8 1.4 2.3<br />
*Prevalence <strong>of</strong> homelessness among veterans/Prevalence <strong>of</strong> homelessness among nonveterans in poverty population.<br />
**Prevalence <strong>of</strong> homelessness among veterans/Prevalence <strong>of</strong> homelessness among nonveterans in general population.<br />
(Fargo, et al., 2012, p. 8)
In the final section <strong>of</strong> the Elder’s<br />
Count <strong>Nevada</strong> (2013) report, we<br />
will examine health care among<br />
<strong>Nevada</strong>’s older adults. Sections within<br />
this chapter include discussions about<br />
health care utilization and coverage,<br />
health-policy reform and its impact on<br />
older adults in <strong>Nevada</strong>, Medicare and<br />
Medicaid enrollment, staff resources,<br />
caregivers, prescriptions drugs,<br />
expenditures, nursing home facilities<br />
and residents, and health care issues<br />
among older <strong>Nevada</strong> veterans.<br />
New to the Health Care chapter in the<br />
Elder’s Count <strong>Nevada</strong> (2013) report<br />
is a section on health care reform as<br />
it applies to older adults. In 2010, the<br />
Patient Protection and Affordable Care<br />
Act (PPACA) was signed into law. It<br />
was designed to improve access to<br />
health care through various reform<br />
provisions (Garner et al., 2012). On<br />
January 3, 2013, President Obama also<br />
approved <strong>Nevada</strong>’s plan to create an<br />
online health insurance exchange.<br />
Under law, this exchange will assist<br />
individuals and <strong>com</strong>panies with<br />
finding health insurance by allowing<br />
them to search insurance options.<br />
The exchanges are scheduled to<br />
launch open enrollment by October 1,<br />
2013, and by January 1, 2014, federal<br />
subsidies are scheduled to be available<br />
for purchases through the exchanges<br />
(Kliff, 2013).<br />
Health Care<br />
Medical Services Use & Health Insurance Coverage<br />
Health Policy Reform<br />
Medicare & Medicaid Enrollment<br />
Workforce Resources<br />
Caregivers<br />
Prescription Drugs<br />
Expenditures<br />
Nursing Home Facilities<br />
Nursing Home Residents<br />
Veterans<br />
Authors: Angela D. Broadus, Julie Kilgore, Shawna Dale Koehler Larson<br />
Content Reviewers: Caleb Cage, Tina Gerber-Winn
Health Care<br />
156<br />
Highlights<br />
Medical Services Use & Health Insurance<br />
Coverage<br />
• Inpatient Medicare admissions in <strong>Nevada</strong> stayed<br />
relatively constant between 2007 and 2010,<br />
while the number <strong>of</strong> admissions nationally<br />
decreased.<br />
• Although the number <strong>of</strong> outpatient Medicare<br />
hospital visits increased nationally between 2007<br />
and 2010, they remained relatively constant in<br />
<strong>Nevada</strong>.<br />
• Of <strong>Nevada</strong>ns 65 and older, an estimated 96.6%<br />
indicated that they have health care coverage.<br />
• Just over a fifth (22.1%) <strong>of</strong> <strong>Nevada</strong> adults and<br />
3.4% <strong>of</strong> <strong>Nevada</strong>ns 65 and older are either<br />
uninsured or under-insured.<br />
Health Policy Reform<br />
• Title I Quality, Affordable Health Care for All<br />
Americans will be an important improvement<br />
for older adults with chronic conditions such<br />
as hypertension and diabetes, or with previous<br />
conditions such as cancer.<br />
• Older adults will benefit from the 2010 Patient<br />
Protection and Affordable Care Act’s (PPACA)<br />
geriatric and rural-physician workforce<br />
development and training.<br />
• The PPACA lowered the cost <strong>of</strong> prescription<br />
drugs for <strong>Nevada</strong>ns reaching the Medicare Part<br />
D coverage gap for out-<strong>of</strong>-pocket expenses. This<br />
saved <strong>Nevada</strong>ns an average <strong>of</strong> $585 in 2012.<br />
Medicare & Medicaid Enrollment<br />
• In 2012, an estimated 13.9% (379,860) <strong>of</strong> the<br />
<strong>Nevada</strong> population and 16% (over 49 million) <strong>of</strong><br />
the U.S. population were Medicare beneficiaries.<br />
• Between 2010 and 2011, an estimated 13%<br />
(39.9 million) <strong>of</strong> the U.S. population and 13%<br />
(341,800) <strong>of</strong> <strong>Nevada</strong>ns received Medicare.<br />
• Between 2010 and 2011, 16% (50.6 million)<br />
<strong>of</strong> the U.S. population and 10% (261,200) <strong>of</strong><br />
<strong>Nevada</strong>ns received Medicaid health insurance.<br />
• <strong>Nevada</strong> is one <strong>of</strong> 17 states that do not<br />
provide a “medically needy program” to cover<br />
possible gaps in coverage for those above the<br />
“categorically needy in<strong>com</strong>e levels.”<br />
• When <strong>com</strong>pared with the United States as a<br />
whole, <strong>Nevada</strong> spent a larger share on acute<br />
care (68.1% vs. 64%) and hospital payments<br />
(6.3% vs. 4.5%).<br />
Workforce Resources<br />
• From 2000 to 2010, the number <strong>of</strong> new students<br />
enrolled in <strong>Nevada</strong> medical schools grew by<br />
273.7%, while nationally enrollment grew by<br />
22.9%. In spite <strong>of</strong> this encouraging news, the<br />
current number <strong>of</strong> active physicians in <strong>Nevada</strong> is<br />
discouraging.<br />
• In 2010, <strong>Nevada</strong>’s rate <strong>of</strong> student enrollment in<br />
medical or osteopathic school (29.4 per 100,000)<br />
was lower than the national enrollment rate <strong>of</strong><br />
31.4 per 100,000.<br />
• Between 2000 and 2010, the rate for <strong>Nevada</strong><br />
residents/fellows in ACGME programs increased<br />
by 77.8%, <strong>com</strong>pared with a 15.3% increase<br />
nationally.<br />
• The percentage <strong>of</strong> physicians retained in <strong>Nevada</strong><br />
upon graduation (39.2%) was slightly higher in<br />
2010 than found nationally (38.6%).<br />
• The percentage retained from a graduate<br />
medical education program in <strong>Nevada</strong> (57.8%)<br />
was higher than found nationally (47.8%).<br />
• In spite <strong>of</strong> the encouraging news, the current<br />
number <strong>of</strong> active physicians in <strong>Nevada</strong> is<br />
discouraging. In 2010, <strong>Nevada</strong> ranked 45th in<br />
the nation for the number <strong>of</strong> active physicians<br />
per 100,000 in population (198.3).<br />
Caregivers<br />
• The number <strong>of</strong> caregivers in <strong>Nevada</strong> during<br />
2009 ranged from a snapshot <strong>of</strong> 364,000 (in last<br />
month) to a total 532,000 annually.<br />
• These caregivers provided 348 million hours <strong>of</strong><br />
care at an average <strong>of</strong> $11.48 per hour.<br />
• The total value <strong>of</strong> care provided by <strong>Nevada</strong><br />
caregivers in 2009 was an estimated $4 billion.<br />
Prescription Drugs<br />
• In 2009, drug-induced deaths ranked as<br />
<strong>Nevada</strong>’s sixth-leading cause <strong>of</strong> death.<br />
• In 2010, <strong>Nevada</strong> ranked fourth in the nation in<br />
drug-poisoning deaths with an age-adjusted<br />
rate <strong>of</strong> 20.7 per 100,000.<br />
• Between 2009 and 2010, nonmedical use and<br />
abuse <strong>of</strong> prescription pain relievers by <strong>Nevada</strong><br />
adults 26 and older was higher (4.6%) than<br />
found nationally (3.5%).
Expenditures<br />
• <strong>Nevada</strong> was in the fastest-increasing quarter <strong>of</strong><br />
states for health care expenditures and in 2009<br />
posted a higher annual rate <strong>of</strong> growth (9.2%)<br />
than the national rate (6.5%).<br />
• <strong>Nevada</strong> health expenditures in 2009 consisted<br />
<strong>of</strong>: hospital care (34%), physician and other<br />
pr<strong>of</strong>essional services (33.1%), prescription drugs<br />
and other medical nondurables (15.6%), nursing<br />
home care (3.2%), dental services (5.8%), home<br />
health care (3.1%), medical durables (2.5%),<br />
and other health, residential and personal-care<br />
expenditures (2.8%).<br />
• <strong>Nevada</strong> devoted a smaller share <strong>of</strong> its health<br />
expenditures to hospital care, nursing home<br />
care, home health care, and other health,<br />
residential and personal care than was the case<br />
nationally.<br />
Nursing Home Facilities<br />
• Contrary to the national trend, the number <strong>of</strong><br />
nursing home facilities in <strong>Nevada</strong> increased<br />
from 44 in 2003 to 51 in 2011.<br />
• In 2011, <strong>Nevada</strong>’s certified nursing homes had a<br />
total <strong>of</strong> 5,984 beds, 4,717 residents, and a 78.8%<br />
occupancy rate (CDC: Health United States,<br />
2012). This occupancy rate was lower than<br />
found nationally (81.6 per 100 beds).<br />
• In 2009, 11 <strong>Nevada</strong> nursing homes had fewer<br />
than 50 beds, 10 had 50-99 beds, 22 had 100-<br />
199 beds, and six had 200 or more beds.<br />
• In 2009, <strong>Nevada</strong> had 45 dually certified<br />
(Medicare and Medicaid) facilities, and two<br />
facilities with single certification.<br />
• In 2009, 2.1% <strong>of</strong> nursing homes in <strong>Nevada</strong> were<br />
found to be without deficiencies, 27.1% had<br />
severe deficiencies resulting in actual harm or<br />
causing immediate jeopardy to residents, and<br />
6.3% had substandard quality <strong>of</strong> care.<br />
Nursing Home Residents<br />
• In 2009, 7.1% <strong>of</strong> U.S. adults 65 and older and<br />
21.5% <strong>of</strong> adults 85 and older had experienced<br />
at least one nursing home stay. In <strong>Nevada</strong> the<br />
corresponding figures were 3.7% and 12.4%.<br />
• In 2010, there were 7,823 nursing facility<br />
residents in <strong>Nevada</strong> with a per-facility low <strong>of</strong> 2<br />
and a high <strong>of</strong> 426. The average was 160.<br />
• Of <strong>Nevada</strong>’s nursing home residents in 2009,<br />
58.9% were female, 20.3% were 65-74, 32.8%<br />
were 75-84, and 29.3% were 85 and older. The<br />
majority were White (86.5%); 28.7% had no<br />
Activities <strong>of</strong> Daily Living (ADL) impairments;<br />
19.9% had five ADL impairments; and 43.2%<br />
did not have any cognitive impairments.<br />
• The percentage <strong>of</strong> residents with no<br />
impairments in ADL decreased from 31.5%<br />
to 28.7% between 2005 and 2009, and the<br />
percentage <strong>of</strong> those with four ADL impairments<br />
increased from 27% to 32.5%.<br />
Veterans<br />
• The Veterans Health Administration pays $8,800<br />
per veteran treated at VA clinics.<br />
• By 2020, VA health care costs are projected to<br />
increase to between $69 billion and $83 billion<br />
depending on the number <strong>of</strong> soldiers deployed<br />
in overseas conflicts and the in<strong>com</strong>e thresholds<br />
for eligibility.<br />
• In 2010, <strong>Nevada</strong> spent $527 million for veteran<br />
health care, with 57,869 veterans (unique<br />
patients) receiving treatment at a VA health care<br />
facility. By 2011, the total had increased to $533<br />
million for 59,643 patients.<br />
• Of these patients, 60.5% (36,077) resided<br />
in the Southern Urban/Metropolitan region<br />
<strong>of</strong> the state, 23.3% in the Northern Urban/<br />
Metropolitan region, and 16.2% in the Rural/<br />
Frontier region.<br />
Health Care<br />
157
Health Care<br />
Medical Services Use & Health Insurance Coverage<br />
Older adult use <strong>of</strong> medical services increased<br />
between 1998 and 2008. For example, although<br />
adults 65 and older continued to represent<br />
approximately 12% <strong>of</strong> the U.S. population, their<br />
share <strong>of</strong> physician <strong>of</strong>fice visits rose from 24% to<br />
27% (Cherry, Lucas, & Decker, 2010), their share<br />
<strong>of</strong> medication prescriptions (new or renewed)<br />
increased from 33% to 38%, and their share <strong>of</strong><br />
diagnostic and imaging orders (e.g., CT scan,<br />
MRI, X-ray, or ultrasound) increased from 26% to<br />
30%. The average number <strong>of</strong> minutes they spent<br />
during a physician <strong>of</strong>fice visit increased from 24<br />
to 28 minutes. The annual number <strong>of</strong> doctor’s<br />
appointments per person 65 or older increased from<br />
6.1 in 1998 to 6.9 in 2008. The number <strong>of</strong> doctor<br />
appointments resulting in a prescription (new or<br />
renewed) increased from 4.2 per person in 1998 to<br />
5.5 per person in 2008 (Cherry et al., 2010).<br />
According to the Centers for Medicare & Medicaid<br />
Services (CMS), the number <strong>of</strong> hospital inpatient<br />
Medicare admissions nationally increased between<br />
2007 and 2010, while admissions decreased in<br />
<strong>Nevada</strong> (see Figure HC1 and Table HC1, CDC:<br />
National Center for Health Statistics, n.d.). In<br />
addition, while the number <strong>of</strong> outpatient Medicare<br />
hospital visits increased nationally during the same<br />
period, they remained relatively constant in <strong>Nevada</strong><br />
(see Figure HC2).<br />
Fig. HC1: U.S. and <strong>Nevada</strong>: Hospital<br />
Inpatient Medicare Admissions (per 1,000<br />
Beneficiaries) by Year<br />
343.5 340.9 330.8 324.6<br />
280.0 290.8 286.5 283.5<br />
2007 2008 2009 2010<br />
(CDC: National Center for Health Statistics, n.d.)<br />
Fig. HC2: U.S. and <strong>Nevada</strong>: Hospital<br />
Outpatient Medicare Admissions (per 1,000<br />
Beneficiaries) by Year<br />
3838.6 3881.5 3972.5 4014.7<br />
2369 2360.3 2411.2 2391.7<br />
2007 2008 2009 2010<br />
U.S.<br />
NV<br />
U.S.<br />
NV<br />
Between 1978 and 2008, the use <strong>of</strong> specialists<br />
increased for adults 65 and older. In 1978,<br />
approximately 62% used primary care physicians,<br />
and approximately 37% used medical or surgical<br />
specialists (Cherry et al., 2010). By 2008, fewer older<br />
adults (45%) were using primary care physicians,<br />
and more used medical (25%) or surgical (30%)<br />
specialists. In addition, between 1998 and 2008 the<br />
number <strong>of</strong> medical visits for adults 65 and older<br />
increased for chronic conditions such as essential<br />
hypertension, cardiac dysrhythmias and diabetes,<br />
and for conditions such as lipid metabolism<br />
disorders, urinary-system issues and hypothyroidism<br />
(Cherry et al., 2010).<br />
A major factor in accessing health care was whether<br />
the individual had health insurance. In 2011, the<br />
3-Year American Community Survey found that an<br />
estimated 66.2% <strong>of</strong> the U.S. population had some<br />
type <strong>of</strong> private health insurance, 29.5% had public<br />
health insurance, and 15.2% had no health insurance<br />
(ACS, 3-Year Survey, S0201, 2011). In <strong>Nevada</strong>,<br />
an estimated 64.3% had private health insurance,<br />
23.2% had public coverage, and 22.1% had no health<br />
insurance (ACS, 3-Year Survey, S0201, 2011; Garner,<br />
Wakefield, Tyler, Samuels, & Cleveland, 2012).<br />
In the 2011 Behavioral Risk Factor Surveillance<br />
System (BRFSS), 82.1% <strong>of</strong> U.S. adults 18 and older<br />
and 72.7% <strong>of</strong> adult <strong>Nevada</strong>ns indicated that they<br />
had health care coverage. However, an estimated<br />
96.6% <strong>of</strong> <strong>Nevada</strong>ns 65 and older indicated they<br />
had coverage. This was most likely in the form <strong>of</strong><br />
Medicare (see Table HC2, CDC: BRFSS, 2011).<br />
Health care coverage rates did not differ significantly<br />
by region, age, race/ethnicity, sex, education or<br />
in<strong>com</strong>e.<br />
Cost is a major factor in health care utilization,<br />
and over the past decade, health care costs have<br />
increased dramatically. In 2010, Medicare charges<br />
per hospital stay for adults 65 and older ranged from<br />
zero dollars to over $2 million (see Table HC3; CDC:<br />
BRFSS, 2010). Additionally, the average charges per<br />
hospital stay were lower for adults over age 85 ($50,<br />
706) than for those age 65-84 years old ($63,670).<br />
158<br />
(CDC: National Center for Health Statistics, n.d.)
In 2011, an estimated 4.6% <strong>of</strong> U.S. adults 65 and<br />
older said they either did not get care or delayed<br />
care due to cost (CDC: Publication and Information:<br />
2011). When examined by age group, the share<br />
<strong>of</strong> adults 65-74 who did not get or who delayed<br />
medical care increased slightly between 1997 and<br />
2011 (5% to 5.8%). Among adults 75 and older, the<br />
share deferring care decreased, from 4.1% to 3.1%<br />
(see Figure HC3). In 2011 an estimated 4.3% <strong>of</strong> U.S.<br />
adults 65 and older did not get prescription drugs<br />
due to cost, and 7% did not get dental care (see Table<br />
HC4).<br />
Percent<br />
7.0<br />
6.0<br />
5.0<br />
4.0<br />
3.0<br />
2.0<br />
1.0<br />
0.0<br />
Fig. HC3: U.S. Adults, Age 65 and Older: Did Not Get<br />
or Delayed Medical Care due to Cost<br />
5.8<br />
5.0<br />
4.6 4.6<br />
4.1<br />
3.1<br />
1997 1998 1999 2000 2001 2002 2003 2004 2005 2006 2007 2008 2009 2010 2011<br />
65 Years and Older 65-74 Years 75 Years and Older<br />
(CDC: Publication & Information, 2011)<br />
Health Care<br />
Health Care Reform<br />
Nearly every hospital with an emergency<br />
department is required to provide emergency<br />
services to anyone, regardless <strong>of</strong> ability to pay. And<br />
even when an uninsured patient arrives planning to<br />
pay his or her own way, that patient may struggle<br />
to pay for an extended stay. The upshot: Hospitals<br />
treat tens <strong>of</strong> millions <strong>of</strong> uninsured individuals<br />
each year, and most <strong>of</strong> that care is un<strong>com</strong>pensated.<br />
Indeed, in the last decade, hospitals provided more<br />
than $300 billion in un<strong>com</strong>pensated care to the<br />
uninsured and under-insured…. And although<br />
hospitals do what they can to assist patients,<br />
burdens on uninsured individuals remain heavy.<br />
Millions <strong>of</strong> families are just one major injury or<br />
illness from financial ruin.<br />
(Brief for the American Hospital Association as<br />
Amici Curiae, 2012, p. 3)<br />
New to the Elder’s Count <strong>Nevada</strong> (2013) report is a<br />
section on health care reform as it applies to older<br />
adults. In 2010, the Patient Protection and Affordable<br />
Care Act (PPACA) was signed into law. It was<br />
designed to improve access to health care through<br />
various reform provisions (Garner et al., 2012). On<br />
January 3, 2013, President Obama also approved<br />
<strong>Nevada</strong>’s plan to create an online health insurance<br />
exchange. Under law, this exchange will assist<br />
individuals and <strong>com</strong>panies with finding health<br />
insurance by allowing them to search insurance<br />
options. The exchanges are scheduled to launch<br />
open enrollment by October 1, 2013. By January 1,<br />
2014, federal subsidies are scheduled to be available<br />
for purchases through the exchanges (Kliff, 2013).<br />
As indicated previously, 22.1% <strong>of</strong> <strong>Nevada</strong> adults<br />
and 3.4% <strong>of</strong> <strong>Nevada</strong>ns 65 and older are either<br />
uninsured or under-insured. The first reform,<br />
Title I Quality, Affordable Health Care for All<br />
Americans, eliminates the pre-existing conditions<br />
limitation for children and is designed to ensure<br />
that all Americans have access to affordable<br />
health insurance. This would be an important<br />
improvement for older adults with chronic<br />
conditions such as hypertension and diabetes, or<br />
with previous conditions such as cancer.<br />
Another reform, Title IX Revenue Provisions,<br />
specifically helps older adults in two ways: It levies<br />
an excise tax on insurance <strong>com</strong>panies or plans that<br />
have annual premiums over $1,350 for individuals<br />
or $3,000 for families or retired individuals 55 and<br />
older (Garner et al., 2012, p. 24). Also, adults 65<br />
and older will be able to claim itemized deductions<br />
on medical expenses in excess <strong>of</strong> 7.5% <strong>of</strong> adjusted<br />
gross in<strong>com</strong>e through 2016. After that, the<br />
threshold will increase to 10% <strong>of</strong> adjusted gross<br />
in<strong>com</strong>e.<br />
159
Health Care<br />
The PPACA includes workforce provisions designed<br />
to: “improve access by increasing the supply <strong>of</strong><br />
needed health workers, particularly primary care<br />
practitioners; increase efficiency and effectiveness<br />
by encouraging systems redesign; address problems<br />
<strong>of</strong> mal- distribution; and improve the quality <strong>of</strong> care<br />
through improved education and training” (AAMC,<br />
2010, p. 1). The PPACA also addresses workforce<br />
issues through development <strong>of</strong> workforce-grant<br />
programs, effective methods for financing health<br />
care education, and loan-repayment programs.<br />
Students agreeing to practice in specific areas <strong>of</strong><br />
need, such as geriatrics, for a minimum <strong>of</strong> two years<br />
post-graduation will receive tuition assistance.<br />
Eligible primary care practitioners and surgeons will<br />
receive Medicare incentive bonuses (10%), while<br />
Medicaid payments to primary care practitioners<br />
will be set at 100% <strong>of</strong> the Medicare rate in<br />
2013 and 2014. Older adults will benefit from<br />
PPACA’s geriatric and rural- physician workforce<br />
development and training. Specifically, the PPACA:<br />
• Amends Title VII <strong>of</strong> PHSA to award grants to<br />
Geriatric Education Centers (GECs) to develop<br />
Continuing Medical Education fellowships, with<br />
$10.8 million authorized for period between FYs<br />
2011-2014;<br />
• Establishes Geriatric Career Incentive Awards<br />
for non-physician providers with $10 million/<br />
year authorized for FYs 2011-2013<br />
• Expands eligibility beyond physicians for<br />
Geriatric Academic Career Awards<br />
• Amends the Title VIII Comprehensive Geriatric<br />
Education program<br />
• Amends Title VII to establish a grant program<br />
for medical schools to establish, improve, or<br />
expand “rural-focused” education and training<br />
meeting certain criteria, including recruiting<br />
students likely to practice in rural <strong>com</strong>munities<br />
(AAMC, 2010, p. 6).<br />
Finally, the PPACA lowered the out-<strong>of</strong>-pocket cost<br />
<strong>of</strong> prescription drugs for <strong>Nevada</strong>ns reaching the<br />
Medicare Part D coverage gap (Healthcare.gov,<br />
2012). The health care law provided a 50% discount<br />
for brand-name prescription drugs and a smaller<br />
discount for already lower-priced generic drugs. In<br />
2012, this saved <strong>Nevada</strong>ns an average <strong>of</strong> $585 per<br />
person (Healthcare.gov, 2012).<br />
Medicare & Medicaid Enrollment<br />
160<br />
Medicare is “the federal insurance program for people<br />
who are 65 or older, certain younger people with<br />
disabilities, and people with end-Stage Renal Disease”<br />
(www.medicare.gov). Medicaid is a state-level<br />
program that “provides health coverage for lowerin<strong>com</strong>e<br />
people, families and children, the elderly, and<br />
people with disabilities” (www.healthcare.gov).<br />
Medicare consists <strong>of</strong> four specific programs: hospital<br />
insurance (Medicare Part A), medical insurance<br />
(Medicare Part B), a <strong>com</strong>bined hospital and medical<br />
private-insurance program (Medicare Part C), and<br />
prescription-drug insurance (Medicare Part D).<br />
Beginning in 2014, the PPACA is scheduled to<br />
expand Medicare eligibility to include those younger<br />
than 65 and those with higher in<strong>com</strong>es. Eligibility<br />
also will expand to include low-in<strong>com</strong>e adults with<br />
disabilities who fail to meet Supplemental Security<br />
In<strong>com</strong>e (SSI) requirements.<br />
In 2012, an estimated 13.9% (379,860 individuals)<br />
<strong>of</strong> the <strong>Nevada</strong> population and 16% (over 49 million)<br />
<strong>of</strong> the U.S. population were Medicare beneficiaries<br />
[see Table HC5, Henry J. Kaiser Family Foundation<br />
(HJKFF), 2012].<br />
The average age <strong>of</strong> Medicare beneficiaries in<br />
<strong>Nevada</strong> was slightly lower than found nationally<br />
(see Table HC6).
Between 2010 and 2011, an estimated 13% (39.9<br />
million) <strong>of</strong> the U.S. population received Medicare<br />
and 16% (50.6 million) received Medicaid health<br />
insurance (HJKFF, 2012). During this same time,<br />
13% (341,800) <strong>of</strong> <strong>Nevada</strong>’s population received<br />
Medicare and 10% (261,200) received Medicaid<br />
health insurance. Of <strong>Nevada</strong>ns receiving Medicare,<br />
48% (184,400) were 65-74, and 26% (101,600)<br />
were 75-84 (see Figure HC4). In addition, 51%<br />
were female, 73.7% were White, and 56.5% were<br />
at 200% or more <strong>of</strong> the Federal Poverty Level (see<br />
Table HC7; HJKFF, 2012). When <strong>com</strong>pared with the<br />
nation as a whole, a greater percentage <strong>of</strong> <strong>Nevada</strong><br />
Hispanics (10.8% vs. 7.6%) and those designated<br />
as “Other” (9.5% vs. 4.7%) were Medicare<br />
beneficiaries.<br />
Fig. HC4: U.S. & <strong>Nevada</strong> Adults Age 65 &<br />
Older, 2010-2011: Age by Distribution <strong>of</strong><br />
Medicare Beneficiaries<br />
48.0%<br />
(HJKFF, 2012)<br />
44.8%<br />
26.3% 27.0%<br />
15.7% 17.0%<br />
10.3%<br />
0.0%<br />
<strong>Nevada</strong><br />
United States<br />
19-64 Years 65-74 Years 75-84 Years 85 and Older<br />
In 2009, estimated spending for Medicare in <strong>Nevada</strong><br />
was $3.3 million. Enrollees each spent an estimated<br />
$9,692 (HJKFF, 2012). In <strong>com</strong>parison, the estimated<br />
per-enrollee spending nationally was $10,365. From<br />
1991-2009, <strong>Nevada</strong> was the fastest-growing state<br />
in terms <strong>of</strong> average annual growth in Medicare<br />
spending. Its average annual growth rate was<br />
11.1%, while the national average growth rate was<br />
8% (HJKFF, 2012). However, from 1991 to 2009,<br />
<strong>Nevada</strong> was only the 12th-fastest-growing in terms<br />
<strong>of</strong> Medicare spending with an annual rate <strong>of</strong> 6.1%.<br />
During that period the national growth rate averaged<br />
6.3%.<br />
The 2009 distribution <strong>of</strong> Medicare spending by<br />
service type in <strong>Nevada</strong> is <strong>com</strong>parable to that<br />
nationally. The largest percentage <strong>of</strong> money was<br />
spent on hospital care (see Table HC8) with the<br />
lowest share spent on dental services. This is likely<br />
because Medicare covers only necessary dental<br />
procedures related to a covered medical service.<br />
(HJKFF, 2012).<br />
Medicaid provides health care coverage for the poor,<br />
the aged, and people with disabilities. In <strong>Nevada</strong>,<br />
older adults are eligible for Medicaid if they are at<br />
76%-99% <strong>of</strong> the federal poverty level (FPL), have<br />
no more than $2,000 in assets if single, and have<br />
a monthly in<strong>com</strong>e between $710.40 and $1,085.46<br />
(Kaiser Commission on Key Facts, 2010). <strong>Nevada</strong><br />
is one <strong>of</strong> 17 states that do not provide a “medically<br />
needy program” to cover possible gaps in coverage<br />
for those above the “categorically needy in<strong>com</strong>e<br />
levels” (Kaiser Commission, 2010, p. 2). However,<br />
<strong>Nevada</strong> does provide a special in<strong>com</strong>e standard <strong>of</strong><br />
300% <strong>of</strong> Supplemental Security In<strong>com</strong>e (SSI) for<br />
nursing home Medicaid.<br />
In 2009, more than half (58%) <strong>of</strong> Medicaid enrollees<br />
in <strong>Nevada</strong> were children (HJKFF, 2012). Of the<br />
remaining, 19% were adults 19-64, 14% were<br />
disabled <strong>Nevada</strong>ns under the age <strong>of</strong> 65, and 9% were<br />
adults 65 and older. Medicaid enrollment for 2009<br />
was 290,435, 11% <strong>of</strong> the state’s total population and<br />
much lower than the national rate, 20%. As <strong>of</strong> July 1,<br />
2011, <strong>Nevada</strong> ranked 16th in the nation in Medicaid<br />
Managed Care enrollment with 248,819 enrollees<br />
(HJKFF, 2012). An annual snapshot <strong>of</strong> Medicaid<br />
enrollment for all enrollee categories (see Figure<br />
HC5) shows that enrollment dropped from June 2004<br />
to December 2006 and then began to rise in 2007 at<br />
the start <strong>of</strong> the national recession.<br />
Fig. HC5: Medicaid, <strong>Nevada</strong>: Point-in-Time<br />
Monthly Enrollments by Year (in Thousands)<br />
June 2004<br />
December 2004<br />
June 2005<br />
December 2005<br />
June 2006<br />
December 2006<br />
June 2007<br />
December 2007<br />
June 2008<br />
December 2008<br />
June 2009<br />
December 2009<br />
June 2010<br />
December 2010<br />
June 2011<br />
(HJKFF, 2012)<br />
176.6<br />
174.2<br />
171.7<br />
172.8<br />
171.8<br />
166.5<br />
170.2<br />
180.0<br />
188.9<br />
195.0<br />
213.5<br />
238.6<br />
263.6<br />
280.3<br />
290.9<br />
In June 2011, the monthly Medicaid enrollment<br />
for <strong>Nevada</strong> adults 19 and older was 105,400 (see<br />
Figure HC6). Between June 2009 and 2011, <strong>Nevada</strong><br />
experienced a 22.4% increase in monthly enrollment<br />
for adults, <strong>com</strong>pared with a 12.7% increase nationally<br />
(HJKFF, 2012). Additional data specifically for older<br />
adults were not available.<br />
Health Care<br />
161
Health Care<br />
Fig. HC6: Medicaid, <strong>Nevada</strong> Adults: Point-in-<br />
Time Monthly Enrollments by Year (in<br />
Thousands)<br />
86.1<br />
107.1 105.4<br />
June 2009 June 2010 June 2011<br />
(HJKFF, 2012)<br />
<strong>Nevada</strong> ranked in the lowest quartile nationally<br />
in Medicaid state and federal spending in FY 2010<br />
with expenditures <strong>of</strong> $1.5 billion (HJKFF, 2012). The<br />
payments went for acute care (68.1%), long-term<br />
care (25.6%), and disproportionate share hospital<br />
programs for hospitals that treat indigent patients<br />
(6.3%, see Table HC9). Compared to the United<br />
States as a whole, <strong>Nevada</strong> spent more on acute care<br />
(68.1% vs. 64%) and a disproportionate share <strong>of</strong><br />
hospital payments (6.3% vs. 4.5%).<br />
Workforce Resources<br />
To meet the growing and changing demand for<br />
medical care, the United States and <strong>Nevada</strong> must<br />
have sufficient medical providers. In 2003, the<br />
Association <strong>of</strong> American Medical Colleges (AAMC)<br />
predicted a national shortage <strong>of</strong> almost 91,000<br />
physicians by 2020 due to the rising U.S. population,<br />
the aging <strong>of</strong> America, and the aging <strong>of</strong> the medicalprovider<br />
<strong>com</strong>munity (p. 2). Following enactment<br />
<strong>of</strong> the Patient Protection and Accountable Care<br />
Act (PPACA), the medical colleges revised their<br />
prediction to a “shortage <strong>of</strong> 91,500 and 130,600<br />
active-patient care physicians in 2020 and 2025,<br />
respectively, and a primary care shortage <strong>of</strong> 45,400<br />
and 65,800 physicians in 2020 and 2025” (AAMC:<br />
The impact <strong>of</strong> health care reform, 2011, p. 1).<br />
With medical-school training averaging 14 years<br />
(AAMC, 2003), the predicted shortfall must be<br />
addressed before the demand seriously outweighs<br />
the supply. Per the AAMC (2003), a 30% increase<br />
in medical-school enrollment by 2015 is essential to<br />
meet the growing demand. Between 1980 and 2005,<br />
U.S. first-year medical-school enrollment declined<br />
from a rate <strong>of</strong> 7.3 per 100,000 <strong>of</strong> population to 5.6<br />
per 100,000 (AAMC, 2003). However, a more recent<br />
AAMC report (Ward, 2012) indicated that national<br />
enrollment rates increased between 2002 and<br />
2012 by 18.4% (see Table HC10). If these increases<br />
continue, medical-school enrollment will reach the<br />
suggested 30% increase by 2016 (Ward, 2012).<br />
At the state level, <strong>Nevada</strong> has shown significant<br />
increases in enrollment rates for medical or<br />
osteopathic schools (AAMC, 2011). In 2010,<br />
<strong>Nevada</strong>’s rate <strong>of</strong> student enrollment in medical or<br />
osteopathic school (29.4 per 100,000) was lower<br />
than found nationally (31.4 per 100,000). However,<br />
between 2000 and 2010, <strong>Nevada</strong> increased the<br />
number <strong>of</strong> students by 273.7%, while enrollment<br />
grew nationally by 22.9%.<br />
In 2010, <strong>Nevada</strong> ranked in the bottom quintile<br />
with the fewest residents/fellows in Accreditation<br />
Council for Graduate Medical Education (ACGME)<br />
programs. Its rate was 10.5 per 100,000, <strong>com</strong>pared<br />
with a national rate <strong>of</strong> 35.8 per 100,000 (AAMC,<br />
2011). However, between 2000 and 2010, the rate<br />
for <strong>Nevada</strong> residents/fellows in ACGME programs<br />
increased by 77.8%, <strong>com</strong>pared with a 15.3% increase<br />
nationally. The percentage <strong>of</strong> physicians retained in<br />
<strong>Nevada</strong> upon graduation (39.2%) was higher than<br />
found nationally (38.6%), as was the percentage<br />
retained from a graduate-medical-education<br />
program (57.8% versus 47.8%).<br />
162
In spite <strong>of</strong> this encouraging news, the current<br />
number <strong>of</strong> active physicians in <strong>Nevada</strong> is<br />
discouraging. In 2010 <strong>Nevada</strong> ranked in the bottom<br />
quintile nationally for: number <strong>of</strong> active physicians<br />
per 100,000 in population (198.3, 45th in the nation);<br />
active primary care physicians (71.2, 46th in the<br />
nation); active patient-care physicians (178.1, 44th);<br />
active patient-care, primary care physicians (63.7,<br />
46th); and percentage <strong>of</strong> female physicians (25%,<br />
44th). <strong>Nevada</strong> ranked below the state median (25%)<br />
and national level (26.2%) for physicians 60 and<br />
older (24.5%) and above the state median (23.1%) for<br />
percentage <strong>of</strong> physicians who had graduated from<br />
an international medical school (27.9%; see Table<br />
HC11; AAMC, 2011). In 2010, <strong>Nevada</strong> had 5,264<br />
active physicians, <strong>of</strong> whom 4,771 were active M.D.s<br />
and 493 were active D.O.s (Doctors <strong>of</strong> Osteopathic<br />
Medicine).<br />
In addition to the need for physicians, <strong>Nevada</strong> falls<br />
behind other states nationally in other health care<br />
pr<strong>of</strong>essions. For example, from 2006 to 2011, <strong>Nevada</strong><br />
fell from 49th to last in the nation in the number <strong>of</strong><br />
registered nurses (RNs) with 605 nurses per 100,000<br />
population <strong>com</strong>pared with 874 per 100,000 nationally<br />
(HJKFF, 2012). In the same time frame, <strong>Nevada</strong><br />
moved from 47th to last in the nation in the number<br />
<strong>of</strong> nurse practitioners with 26 per 100,000 <strong>com</strong>pared<br />
with 58 per 100,000 nationally (HJKFF, 2012). Also<br />
in 2011, <strong>Nevada</strong> ranked 44th in the nation with<br />
5 dentists per 10,000 <strong>com</strong>pared with 6 per 10,000<br />
nationally, and 39th in the nation with 23 Physician<br />
Assistants per 100,000 <strong>com</strong>pared with 27 per 100,000<br />
nationally (HJKFF, 2012).<br />
Health Care<br />
Caregivers<br />
Family caregivers provide unpaid care to adults and<br />
special-needs children through a variety <strong>of</strong> means:<br />
assisting with tasks <strong>of</strong> daily living (56%); transferring<br />
in and out <strong>of</strong> beds and chairs (40%); dressing<br />
(32%); bathing, showering or other hygiene-related<br />
activities (26%); using the toilet (24%); feeding<br />
(19%); and incontinence-related issues [18%,<br />
National Alliance on Caregiving (NAC), 2009, p.<br />
5]. Feinberg, Reinhard, Houser, and Choula (2011)<br />
generated a more <strong>com</strong>prehensive list <strong>of</strong> tasks in the<br />
“new normal” for caregiver roles:<br />
• Providing <strong>com</strong>panionship and emotional support<br />
• Helping with household tasks, such as preparing<br />
meals<br />
• Handling bills and dealing with insurance claims<br />
• Carrying out personal care, such as bathing and<br />
dressing<br />
• Being responsible for nursing procedures in the<br />
home<br />
• Administering and managing multiple<br />
medications, including injections<br />
• Identifying, arranging, and coordinating services<br />
and supports<br />
• Hiring and supervising direct care workers<br />
• Arranging for or providing transportation to<br />
medical appointments and <strong>com</strong>munity services<br />
• Communicating with health pr<strong>of</strong>essionals<br />
• Serving as “advocate” for their loved one during<br />
medical appointments or hospitalizations<br />
• Implementing care plans<br />
• Playing a key role <strong>of</strong> “care coordinator” during<br />
transitions, especially from hospital to home<br />
(Feinberg et al., 2011, p. 5).<br />
Estimates <strong>of</strong> caregiving prevalence within the United<br />
States vary. One national survey estimated that<br />
65.7 million individuals have worked at least once<br />
in their lives as an unpaid caregiver (NAC, 2009).<br />
Another survey estimated that 61.6 million worked<br />
as caregivers in 2009 (Feinberg et al., 2011). Per NAC<br />
(2009), 31.2% <strong>of</strong> U.S. households (an estimated 36.5<br />
million) used a caregiver in the past year with an<br />
average caregiver burden <strong>of</strong> 18.9 hours per week. For<br />
those living with the care recipient, the caregiving<br />
burden was as high as 39.3 hours per week.<br />
The economic value <strong>of</strong> caregiving increased from<br />
$350 billion in 2006 to $375 billion in 2007 and to<br />
$450 billion in 2009 (Feinberg et al., 2011). Value<br />
increases between 2007 and 2009 reflected a 57%<br />
increase in the number <strong>of</strong> caregivers. An additional<br />
43% <strong>of</strong> the increase followed an increase in the wage<br />
value from $10.10 per hour in 2007 to $11.16 in 2009<br />
(Feinberg et al., 2011, p. 3).<br />
163
Health Care<br />
The majority <strong>of</strong> caregivers are female (66% in the<br />
NAC survey, 65% in the Feinberg et al. survey), and<br />
the average age is 49.2 years (NAC, 2009, p. 4). In<br />
2004, the average age <strong>of</strong> a caregiver was 46.4. NAC<br />
(2009) attributed the change in caregiver age to the<br />
growing number <strong>of</strong> caregivers between 50 and 64<br />
years <strong>of</strong> age.<br />
The majority <strong>of</strong> caregivers (86%) cared for relatives,<br />
36% cared for a spouse, and 14% for a child. In<br />
addition, the majority <strong>of</strong> caregivers (70%) provided<br />
care to adults 50 and older. An estimated 62% <strong>of</strong><br />
care recipients were female, the mean age being 69.3<br />
(NAC, 2009). Similar to the increase in caregiver age,<br />
the share <strong>of</strong> care recipients 75 and older increased<br />
from 43% in 2004 to 51% in 2009 (NAC, 2009, p. 4).<br />
Almost half (47%) <strong>of</strong> caregivers 65 and older and<br />
49% <strong>of</strong> co-resident caregivers provide care on their<br />
own. More than a third (35%) <strong>of</strong> caregivers had<br />
paid assistants (NAC, 2009). Of course, use <strong>of</strong> paid<br />
caregivers or assistants depends upon household<br />
in<strong>com</strong>e. For example, the 2008 recession may have<br />
been a factor in the decline <strong>of</strong> paid help from 41% in<br />
2004 to 35% in 2009 (NAC, 2009, p. 7).<br />
In a study <strong>of</strong> North Carolina caregivers, Winder,<br />
Bouldin and Andresen (2010) assessed the perception<br />
<strong>of</strong> choice in caregiving. Those who believed they<br />
had no choice in caregiving were more likely to<br />
be an adult child <strong>of</strong> the recipient. Those believing<br />
they had a choice were more likely to be a family<br />
member other than a parent or child. In addition,<br />
caregivers who believed that they had no choice<br />
were 3.1 times more likely to report stress and a<br />
higher level <strong>of</strong> burden than those who felt they had<br />
a choice (p. 3). The Rosalynn Carter Institute for<br />
Caregiving (RCI, 2010) estimates that 20%-30% <strong>of</strong><br />
caregivers suffer adverse health effects related to the<br />
stress <strong>of</strong> caregiving. These caregivers tend to neglect<br />
themselves, putting the needs <strong>of</strong> the care recipient<br />
ahead <strong>of</strong> their own (p. 5). Health issues included<br />
depression, grief, lack <strong>of</strong> sleep or exercise, poor diet,<br />
physical issues, and increased use <strong>of</strong> alcohol, nicotine<br />
or other drugs.<br />
The number <strong>of</strong> caregivers in <strong>Nevada</strong> during 2009<br />
ranged from a snapshot <strong>of</strong> 364,000 (in the last<br />
month) to 532,000 annually (Feinberg et al., 2011).<br />
These caregivers provided 348 million hours <strong>of</strong><br />
care at $11.48 per hour. Thus, the total value <strong>of</strong><br />
care provided by <strong>Nevada</strong> caregivers in 2009 was an<br />
estimated $4 billion.<br />
Between 2006 and 2009, the number <strong>of</strong> caregivers<br />
in the preceding month increased by 40%. The<br />
number <strong>of</strong> caregiving hours increased by 24.3%. The<br />
total economic value <strong>of</strong> <strong>Nevada</strong> caregiving activities<br />
increased by 33.3% (see Table HC12, Feinberg et al.,<br />
2011; Houser & Gibson, 2007, 2008).<br />
In some states, care recipients may be eligible for<br />
paid caregiving. In <strong>Nevada</strong>, home and <strong>com</strong>munitybased<br />
waivers for paid caregiving services are<br />
available for older adults with:<br />
• Physical or cognitive disabilities [Home and<br />
Community Based Waiver (HCBW)];<br />
• Eligible adults in 24-hour residential care facilities<br />
(Assisted Living Waiver);<br />
• Adults needing non-medical services in order<br />
to maintain independence in their own homes<br />
(COPE and HCBW);<br />
• Home-based care for those with severe<br />
disabilities who do not qualify for Medicaid or<br />
other resources [Personal Assistance Services<br />
(PAS); National Resource Center for Participant-<br />
Directed Services, 2012].<br />
164
Prescription Drugs<br />
As indicated in the chapter Health Risks and<br />
Behaviors, aging is associated with changes in<br />
pharmacokinetics (ability to absorb, distribute,<br />
metabolize and excrete substances) and<br />
pharmacodynamics (the physiological effects <strong>of</strong> the<br />
substance). Two potentially negative out<strong>com</strong>es may<br />
result from these age-related changes.<br />
Substances may remain active longer in an<br />
older adult’s body or brain, rising to toxic levels<br />
or resulting in paradoxical unintended effects.<br />
Common adverse drug events among seniors<br />
include:<br />
• Gastrointestinal tract events (nausea, vomiting,<br />
constipation/diarrhea)<br />
• Hemorrhagic events<br />
• Dry mouth<br />
• Urinary retention<br />
• Dizziness/lightheadedness<br />
• Toxicity from anticholinergic medication due<br />
to age-related declines in metabolism and<br />
elimination<br />
• Central Nervous Side (CNS) effects (e.g.,<br />
confusion or hallucinations) from pain<br />
medications such as Pentazocine<br />
• Impaired psychomotor functioning in those<br />
with a history <strong>of</strong> falls when prescribed<br />
Benzodiazepines (Campanelli, 2012).<br />
In a national study <strong>of</strong> adults 57-85, researchers<br />
found that 81% used at least one prescription<br />
medication, 42% used at least one over-the-counter<br />
medication, and 49% used a dietary supplement<br />
(see Figure HC7; Qato, Alexander, Conti, Johnson,<br />
Schumm, & Tessler, 2008, p. 2,867). Almost a third<br />
<strong>of</strong> adults (29%) used at least five prescriptions,<br />
46% used over-the-counter medications, and<br />
52% used dietary supplements concurrent with<br />
prescriptions medications. At least 4% were at risk<br />
for an adverse drug reaction due to con<strong>com</strong>itant<br />
use <strong>of</strong> nonprescription medications [over-thecounter<br />
medications (OTCs)] such as aspirin with<br />
prescription anticoagulants, or the use <strong>of</strong> niacin (a<br />
B-vitamin) with Atorvastatin (a cholesterol lowering<br />
medication; p. 2,872).<br />
Fig. HC7: U.S. Adults, Age 57-85: Prescription Drugs,<br />
OTC and Dietary Supplements<br />
At Least 1 Prescription Medication<br />
At Least 5 Prescription Medications<br />
At Least 1 OTC<br />
Concurrent OTC Use with Prescriptions<br />
At Least 1 Dietary Supplement<br />
Concurrent Dietary Supplements with<br />
Prescription<br />
29.0%<br />
(Qato, et al., 2008)<br />
42.0%<br />
46.0%<br />
49.0%<br />
52.0%<br />
81.0%<br />
Health Care<br />
Second, drugs that remain active longer in the body<br />
are more likely to interact with other substances<br />
or medications. This would result in adverse drug<br />
events and other medication-related problems<br />
such as drug-drug interactions or drug-disease<br />
interactions (Campanelli, 2012). Examples include:<br />
increased fluid retention or exacerbation <strong>of</strong> heart<br />
failure in seniors with a history <strong>of</strong> congestive<br />
heart failure who are taking Nonsteroidal Anti-<br />
Inflammatory Drugs (NSAIDs); lowered seizure<br />
threshold in epileptic adults prescribed Bupropion<br />
for depression or addiction-related issues; and<br />
exacerbation <strong>of</strong> Parkinson’s symptoms in older<br />
adults taking antipsychotics or antiemetics<br />
(Campanelli, 2012). Adverse drug reactions due<br />
to cardiovascular medications, anticoagulants,<br />
pain relievers, antibiotics and drugs to treat cancer<br />
and diabetes were noted in 1,678.9 (per 100,000)<br />
emergency department visits by U.S. adults 65 and<br />
older in 2010 (SAMHSA: Center for Behavioral<br />
Health Statistics and Quality, 2012).<br />
165
Health Care<br />
Evidence-based interventions, such as medication<br />
therapy management (MTM), have proven effective<br />
if in optimizing out<strong>com</strong>es and lowering risks<br />
associated with medication use in older adults.<br />
The Sanford Center for Aging at the <strong>University</strong><br />
<strong>of</strong> <strong>Nevada</strong>, Reno, <strong>of</strong>fers such a program. With<br />
funding from the <strong>Nevada</strong> Aging and Disability<br />
Services Division (ADSD) and The Marion G.<br />
Thompson Charitable Trust, the program <strong>of</strong>fers<br />
free medication reviews to low-in<strong>com</strong>e, vulnerable<br />
seniors 60 and older who are taking five or more<br />
prescription drugs. A Certified Geriatric Pharmacist<br />
(CGP) reviews an older adult’s entire drug regimen<br />
(prescription drugs, OTCs, dietary supplements) for<br />
safety and effectiveness. During FY 2011-2012, the<br />
program assisted 104 elder <strong>Nevada</strong>ns with chronic<br />
health conditions and <strong>com</strong>plex drug regimens. The<br />
MTM evaluations <strong>com</strong>pleted for this sample <strong>of</strong><br />
clients revealed that 85% were at risk for adverse<br />
side effects; 63% were at risk for a prescriptionprescription<br />
interaction; 54% had potentially<br />
untreated medical conditions; 46% were taking 15<br />
or more medications (Rx and OTCs); 14% were<br />
taking 15 or more prescription drugs; 21% were<br />
prescribed an inappropriate dosage; and 18% were<br />
on an inappropriate medication schedule.<br />
In 2009, drug-induced death ranked as <strong>Nevada</strong>’s<br />
sixth-leading cause <strong>of</strong> death (Kochanek, Xu,<br />
Murphy, Minino, & Kung, 2011). In 2010, <strong>Nevada</strong><br />
ranked fourth in the nation in drug-poisoning<br />
deaths with an age-adjusted rate <strong>of</strong> 20.7 per 100,000<br />
(CDC: Morbidity and Mortality, Drug Poisonings,<br />
2012). Between 2009 and 2010, nonmedical use<br />
and abuse <strong>of</strong> prescription pain relievers by <strong>Nevada</strong><br />
adults 26 and older was higher (4.6%) than found<br />
nationally (3.5%, SAMHSA: Center for Behavioral<br />
Health, 2013). This same trend occurred between<br />
2010 and 2011 (see Figure HC8). Between 2010 and<br />
2011, <strong>Nevada</strong> ranked seventh-worst in the nation<br />
for nonmedical use and abuse <strong>of</strong> prescription pain<br />
relievers among individuals 12 and older (5.6%,<br />
C.I. 4.57-6.89). However, use among adults 26 and<br />
older decreased from 4.6% in 2009-2010 to 4.3% in<br />
2010-2011 (SAMHSA: Center for Behavioral Health,<br />
2013).<br />
Fig. HC8: U.S. and <strong>Nevada</strong>, Adults Age 26 and<br />
Older: Nonmedical Use <strong>of</strong> Prescription Pain<br />
Relievers<br />
4.6%<br />
3.5% 3.4%<br />
4.3%<br />
U.S.<br />
<strong>Nevada</strong><br />
In addition to issues related to potential<br />
inappropriate medication use, nonmedical use and<br />
abuse <strong>of</strong> prescription drugs is a growing public<br />
health concern, particularly in <strong>Nevada</strong> (SAMHSA:<br />
Center for Behavioral Health, 2013).<br />
2009-2010 2010-2011<br />
(SAMHSA: Center for Behavioral Health, 2012)<br />
166
Expenditures<br />
In 2009, U.S. health care expenditures grew at a<br />
lower rate (4%) than in the previous 50 years <strong>of</strong><br />
National Health Expenditure monitoring (Martin<br />
et al., 2011, Martin et al., 2012, p. 208). In 2010,<br />
health care expenditure rates decreased further to<br />
3.9%. Martin, et al (2011) attributed the stall in<br />
annual spending growth to the recession and lower<br />
consumer private-health insurance spending (p. 11).<br />
In spite <strong>of</strong> the slower health care expenditure<br />
growth, U.S. health care spending as a share <strong>of</strong> the<br />
Gross Domestic Product (Martin et al., 2011, p. 11)<br />
increased from 16.2% <strong>of</strong> the Gross Domestic Product<br />
($7,483 per capita) in 2007 to 17.6% ($8,233 per<br />
capita) in 2010 [see Figure HC9; Organization for<br />
Economic Cooperation and Development (OECD):<br />
Health Data, 2012). Although U.S. health spending<br />
is 2.5 times the average spending <strong>of</strong> other nations<br />
and twice that <strong>of</strong> even other “rich” nations such<br />
as the United Kingdom and France, only 48.2% in<br />
2010 was financed through taxes and Social Security<br />
contributions (OECD: Briefing Note, 2012). The<br />
remaining portion came from private insurance and<br />
out-<strong>of</strong>-pocket consumer contributions. Interestingly,<br />
even though U.S. health care spending far outpaces<br />
the global <strong>com</strong>munity, the United States has only<br />
2.4 practicing physicians per 1,000 in population,<br />
<strong>com</strong>pared with an average <strong>of</strong> 3.1 physicians per 1,000<br />
in other OECD countries (OECD: Briefing Note,<br />
2012).<br />
Fig. HC9: U.S., 2007-2010: Percent Health<br />
Spending per GDP<br />
16.2<br />
16.6<br />
17.7<br />
17.6<br />
Total national health care expenditures for 2010<br />
($2.59 billion) consisted <strong>of</strong> health-consumption<br />
expenditures (94.3%) and investments (5.7%). The<br />
health-consumption expenditures budget can be<br />
further divided into personal health care (89.4%),<br />
government administration (1.2%), net cost <strong>of</strong> health<br />
insurance (6%), and government health activities<br />
(3.4%; see Figure HC10). Personal health care<br />
expenditures consisted <strong>of</strong> payments for: hospital care<br />
(37.2%); physician and other pr<strong>of</strong>essional services<br />
(31.5%); medical product retail outlet sales (15.6%);<br />
nursing-care facilities and continuing-care retirement<br />
<strong>com</strong>munities (6.5%), other health, residential and<br />
personal care (5.9%), and home health care (3.2%;<br />
see Figure HC11). Of the investment expenditures,<br />
spending on structures and equipment made up the<br />
majority (67%) <strong>of</strong> the cost, while research accounted<br />
for 33.1% <strong>of</strong> the budget.<br />
3.2%<br />
6.5%<br />
5.9%<br />
Fig. HC10: National Health Expenditures,<br />
2010: Health Consumption Expenditure<br />
Details<br />
6.0% 3.4%<br />
1.2%<br />
89.4%<br />
Personal Health Care<br />
Government Administration<br />
Net Cost <strong>of</strong> Health Insurance<br />
Government Public Health<br />
Activities<br />
(Martin, Lassman, Washington, Catlin, et al., 2012)<br />
Fig. HC11: National Health Expenditures, 2010:<br />
Personal Health Care Details<br />
15.6%<br />
31.5%<br />
37.2%<br />
Hospital Care<br />
Physician and Other Pr<strong>of</strong>essional Services<br />
Other Health, Residential, and Personal<br />
Care<br />
Home Health Care<br />
Nursing Care Facilities, Continuing Care<br />
Retirement Communities<br />
Medical Product Retail Outlet Sales<br />
Health Care<br />
2007 2008 2009 2010<br />
(OECD, 2012)<br />
(Martin, Lassman, Washington, Catlin, et al., 2012)<br />
167
Health Care<br />
<strong>Nevada</strong>’s total health expenditure for 2009 was 12.1%<br />
($15.1 billion) <strong>of</strong> the Gross State Product (CMS,<br />
2012) and 0.7% <strong>of</strong> total U.S. health care expenditures<br />
(Henry J. Kaiser, State Health Facts, <strong>Nevada</strong> Health,<br />
2012). <strong>Nevada</strong> was in the fastest-increasing quarter<br />
<strong>of</strong> states for health care expenditures and posted<br />
a higher annual rate <strong>of</strong> growth (9.2%) than the<br />
national rate (6.5%). However, per-capita spending<br />
for <strong>Nevada</strong>ns was lower ($5,735) than nationally<br />
($6,815), and the average annual percentage growth<br />
for the state (4.9%) was lower than the national rate<br />
(5.3%).<br />
3.2%<br />
2.5%<br />
5.8% 3.1%<br />
15.6%<br />
Fig. HC12: <strong>Nevada</strong> Health Expenditures, 2009<br />
33.1%<br />
2.8%<br />
34.0%<br />
Hospital Care<br />
Physician and Other Pr<strong>of</strong>essional<br />
Services<br />
Prescription Drugs and Other<br />
Medical Nondurables<br />
Nursing Home Care<br />
Dental Services<br />
Home Health Care<br />
Medical Durables<br />
Other Health, Residential, and<br />
Personal Care<br />
(Henry J. Kaiser: State Health Facts: <strong>Nevada</strong> Health Expenditures, 2012)<br />
<strong>Nevada</strong> health expenditures in 2009 consisted <strong>of</strong>:<br />
hospital care (34%); physician and other pr<strong>of</strong>essional<br />
services (33.1%); prescription drugs and other<br />
medical nondurables (15.6%); nursing home care<br />
(3.2%); dental services (5.8%); home health care<br />
(3.1%); medical durables (2.5%); and other health,<br />
residential and personal-care expenditures (2.8%,<br />
see Figure HS12). In 2009, <strong>Nevada</strong> spent a lower<br />
percentage than the nation as a whole on hospital<br />
care, nursing home care, home health care, and<br />
other health, residential and personal care (see Table<br />
HC13).<br />
Nursing Home Facilities<br />
The number <strong>of</strong> nursing homes in the United States<br />
decreased by 8.5% between 2000 and 2009 (17,378<br />
to 15,884, see Figure HC13). This was due partially<br />
to a decline in nonpr<strong>of</strong>it and government-sponsored<br />
facilities (see Table HC14; CMS: Nursing Homes,<br />
2010). 2 In 2009, for-pr<strong>of</strong>it nursing homes accounted<br />
for 67.5% <strong>of</strong> all nursing facilities.<br />
Fig. HC13: U.S., 2000-2009: Number <strong>of</strong><br />
Medicare/Medicaid Certified Nursing<br />
17,378<br />
17,142<br />
Facilities<br />
16,982<br />
16,774<br />
16,482<br />
16,310<br />
16,117 16,051<br />
15,954 15,884<br />
Contrary to the national trend, the number <strong>of</strong> nursing<br />
home facilities in <strong>Nevada</strong> increased from 44 in 2003<br />
to 51 in 2011 (CDC: Health, United States, 2012) 3 .<br />
In 2011, the state’s certified nursing homes included<br />
a total <strong>of</strong> 5,984 beds, 4,717 residents, and a 78.8<br />
occupancy rate per 100 beds (CDC: Health United<br />
States, 2012). The <strong>Nevada</strong> occupancy rate was lower<br />
than found nationally (81.6 per 100 beds).<br />
2000 2001 2002 2003 2004 2005 2006 2007 2008 2009<br />
(CMS: Nursing Homes, 2010)<br />
168<br />
2<br />
Note: Numbers <strong>of</strong> nursing facilities in 2003, 2004, and 2007 differ between the 2008 and 2010 CMS Nursing Home Data Compendium. In addition, the<br />
2007 data differed across sections within the 2010 CMS Nursing Home Data Compendium. Attempts at verification through alternative sources did not<br />
corroborate with either set <strong>of</strong> data. Therefore, the latest data was use and results should be interpreted with caution.<br />
3<br />
Note: Detailed CDC nursing home information by state is not yet available for 2010-2012.
In 2009, 11 <strong>Nevada</strong> nursing homes had fewer than<br />
50 beds, 10 had 50-99 beds, 22 had 100-199 beds,<br />
and six had 200 or more beds. The number <strong>of</strong> dually<br />
(Medicare and Medicaid) certified facilities increased<br />
marginally in the United States and <strong>Nevada</strong> between<br />
2005 and 2009 (see Table HC15). In the same years,<br />
the percentage <strong>of</strong> sites nationally with singlecertification<br />
decreased from 5.3% to 5.2% for those<br />
with just Medicare certification and from 7% to<br />
4.4% for those with just Medicaid certification. In<br />
2009, <strong>Nevada</strong> had 45 dually certified programs and 2<br />
facilities with single certification.<br />
The mean number <strong>of</strong> nursing home deficiencies<br />
decreased nationally between 2000 and 2009, while<br />
the number in <strong>Nevada</strong> remained relatively constant<br />
(see Figure HC14).<br />
9.9<br />
Fig. HC14: U.S. and <strong>Nevada</strong>: Mean Number<br />
<strong>of</strong> Nursing Home Deficiencies<br />
6.5<br />
10.3<br />
7.2<br />
6.9<br />
8.6 8.9<br />
7.2 7.0 6.7<br />
2005 2006 2007 2008 2009<br />
(CMS: Nursing Homes, 2010)<br />
U.S.<br />
<strong>Nevada</strong><br />
30%<br />
25%<br />
20%<br />
15%<br />
10%<br />
5%<br />
0%<br />
Fig. HC15: U.S. and <strong>Nevada</strong>, 2007-2009:<br />
Nursing Home Deficiencies Details<br />
U.S. NV U.S. NV U.S. NV<br />
2007 2008 2009<br />
No Deficiencies<br />
Severe Deficiences: Actual Harm or Immediate Jeopardy<br />
Substandard Quality <strong>of</strong> Care<br />
(CMS: Nursing Homes, 2010)<br />
In 2009, more <strong>Nevada</strong> nursing home facilities<br />
(27.1%) than found nationally (13.9%) reported<br />
health deficiencies resulting in actual harm or<br />
immediate resident jeopardy (CMS: Nursing Homes:<br />
2010). Of the deficiencies causing actual harm, 3.3%<br />
were isolated incidences and 1.2% represented a<br />
pattern <strong>of</strong> actual harm. Of the deficiencies causing<br />
immediate jeopardy to residents, 0.2% were isolated<br />
incidences and 0.2% represented a pattern <strong>of</strong><br />
behavior. More severe deficiencies both nationally<br />
and in <strong>Nevada</strong> occurred in facilities with 100 or more<br />
beds (CMS: Nursing Homes: 2009). Nationally,<br />
for-pr<strong>of</strong>it facilities were found to have the highest<br />
percentage <strong>of</strong> severe deficiencies (14.6%). In <strong>Nevada</strong><br />
that distinction belonged to non-pr<strong>of</strong>it facilities<br />
(50%).<br />
Health Care<br />
Of all U.S. nursing facilities, 8% were found to have<br />
no deficiencies in 2009, 13.9% had severe deficiencies<br />
resulting in actual harm or causing immediate<br />
jeopardy to residents, and 3.7% had substandard<br />
quality <strong>of</strong> care. (CMS: Nursing Homes, 2010). In the<br />
same year, 2.1% <strong>of</strong> nursing homes in <strong>Nevada</strong> were<br />
found to be without deficiencies, 27.1% had severe<br />
deficiencies resulting in actual harm or causing<br />
immediate jeopardy to residents, and 6.3% had<br />
substandard quality <strong>of</strong> care (see Figure HC15). The<br />
percentage <strong>of</strong> zero-deficiency facilities in <strong>Nevada</strong><br />
declined from 14.5% in 2007 to none in 2008 with<br />
slight improvement, to 2.1%, in 2009. (see Table<br />
HC16).<br />
The cost <strong>of</strong> nursing home care may be prohibitive for<br />
many older adults. In 2011, rates for private rooms<br />
in nursing facilities varied from a low <strong>of</strong> $141 per day<br />
in Louisiana to $655 per day in Alaska. The average<br />
rate was $239 daily or $87,235 annually (MetLife,<br />
2011, p. 4). The average rate for a semi-private room<br />
was $214 daily or $78,110 annually. In <strong>Nevada</strong>, the<br />
average rates were slightly lower. Rates for a private<br />
room ranged from $170 to $436 with an average <strong>of</strong><br />
$237. For a semi-private room the range was $110 to<br />
$244 with an average <strong>of</strong> $206 (MetLife, 2011, p. 2).<br />
The cost <strong>of</strong> living in an assisted-living <strong>com</strong>munity<br />
is lower <strong>com</strong>pared with nursing facility care but still<br />
may be prohibitive. The 2011 average national rate<br />
for assisted living <strong>com</strong>munities was $3,477 monthly<br />
or $41,724 annually (MetLife, 2011, pg. 4). Base rates<br />
for assisted living in <strong>Nevada</strong> were slightly lower,<br />
ranging from $1,800 to $4,850 monthly or an average<br />
<strong>of</strong> $3,151.<br />
169
Health Care<br />
Home health care and adult day services provide<br />
lower level <strong>of</strong> care options. The national hourly<br />
rate for home care services varied from a low <strong>of</strong> $13<br />
in Louisiana to a high <strong>of</strong> $29 in Minnesota for a<br />
homemaker/<strong>com</strong>panion. The national average was<br />
$19 per hour. Home health aides are slightly more<br />
expensive with an average cost <strong>of</strong> $21 per hour. The<br />
average daily rate for adult day services ranged from<br />
$29 per day in Alabama to $148 per day in Vermont<br />
with an average <strong>of</strong> $70 per day (see Table HC17).<br />
Fig. HC16: U.S. and <strong>Nevada</strong>, 2011: Cost <strong>of</strong> Care<br />
Adult Day Services Daily Rate<br />
$17,940.00<br />
$18,200.00<br />
Home Care: Homemaker Hourly Rate<br />
$20,800.00<br />
$19,760.00<br />
Home Care: Home Health Aide Hourly Rate<br />
$22,880.00<br />
$21,840.00<br />
Assisted Living Monthly Base Rate<br />
$37,812.00<br />
$41,724.00<br />
Semi-Private Room Daily Rate<br />
$75,190.00<br />
$78,110.00<br />
Private Room Daily Rate<br />
$86,505.00<br />
$87,235.00<br />
<strong>Nevada</strong> U.S.<br />
(MetLife, 2011)<br />
The annual cost for care <strong>of</strong> older adults is slightly<br />
lower in <strong>Nevada</strong> than in the United States, with<br />
the exception <strong>of</strong> the costs for home health care (see<br />
Figure HC16).<br />
Nursing Home Residents<br />
Between 2007 and 2009, the number <strong>of</strong> Americans<br />
residing in nursing homes increased from an<br />
estimated 3.2 million (CMS: Nursing Homes, 2008)<br />
to an estimated 3.3 million (CMS: Nursing Homes,<br />
2010). In 2009, 7.1% <strong>of</strong> U.S. adults 65 and older and<br />
21.5% <strong>of</strong> adults 85 and older had experienced at<br />
least one nursing home stay (see Figure HC14, CMS:<br />
Nursing Homes, 2010, p. i-ii). In <strong>Nevada</strong> during the<br />
same year, 3.7% <strong>of</strong> adults 65 and older and 12.4% <strong>of</strong><br />
adults 85 and older had been nursing home residents<br />
at least once. In 2010, there were 7,823 nursing<br />
facility residents in <strong>Nevada</strong> with a per-facility low <strong>of</strong><br />
two and a high <strong>of</strong> 426. The average was 160. (BRFSS,<br />
2011).<br />
Fig. HC17: U.S. and <strong>Nevada</strong>: Percent <strong>of</strong><br />
Residents with at Least One Nursing Home<br />
Stay<br />
65 and Older<br />
7.1%<br />
21.5%<br />
3.7%<br />
12.4%<br />
85 and Older<br />
A <strong>com</strong>parison <strong>of</strong> national and <strong>Nevada</strong> nursing home<br />
residents from 2009 revealed that fewer <strong>Nevada</strong><br />
residents were female (58.9%) than found nationally<br />
(65.4%; CMS: Nursing Homes, 2010). In addition,<br />
a higher percentage were ages 65-74 (20.3%) and<br />
75-84 (32.8%) than found nationally. Fewer were<br />
85 or older (see Table HC18). A higher percentage<br />
<strong>of</strong> <strong>Nevada</strong> nursing home residents were White<br />
(86.5%) and had either no Activities <strong>of</strong> Daily Living<br />
(ADL) impairments (28.7%) or had the maximum<br />
<strong>of</strong> five impairments (19.9%) than did nursing home<br />
residents nationally. Finally, a higher percentage <strong>of</strong><br />
<strong>Nevada</strong> nursing home residents had no cognitive<br />
impairment (43.2%) or had lower levels <strong>of</strong> cognitive<br />
impairment than found nationally.<br />
The share <strong>of</strong> residents 65-74 increased from 17.8%<br />
in 2005 to 20.3% in 2009, while the percentage <strong>of</strong> all<br />
other age groups decreased (see Figure HC18).<br />
Fig. HC18: <strong>Nevada</strong>, 2005-2009: Percent <strong>of</strong><br />
Nursing Home Residents by Age<br />
U.S.<br />
(CMS: Nursing Homes, 2010)<br />
<strong>Nevada</strong><br />
35.3% 34.7% 33.7%<br />
32.8%<br />
27.4% 27.5% 26.9% 26.7%<br />
17.8%<br />
17.7% 18.4% 19.2%<br />
32.8%<br />
26.1%<br />
20.3%<br />
65-74 Years<br />
75-84 Years<br />
85-95 Years<br />
95 and Older<br />
3.4% 3.3% 3.2% 3.3%<br />
3.2%<br />
2005 2006 2007 2008 2009<br />
(CMS: Nursing Homes: 2010)<br />
170
Between 2005 and 2009, the <strong>Nevada</strong> nursing homeresident<br />
population became slightly more diverse.<br />
The share <strong>of</strong> White residents decreased from<br />
88.6% to 86.5%. The percentage Black, Asian and<br />
Hispanic residents increased, while the percentage<br />
<strong>of</strong> American Indian/Alaskan Natives remained stable<br />
(see Table HC19). In addition, the percentage <strong>of</strong><br />
residents with no impairments in ADL decreased<br />
from 31.5% to 28.7% between 2005 and 2009, and<br />
the percentage <strong>of</strong> those with four ADL impairments<br />
increased from 27% to 32.5%. Finally, even though<br />
the percentage <strong>of</strong> <strong>Nevada</strong> nursing home residents<br />
with ADL impairment increased from 2005 to<br />
2009, the level <strong>of</strong> cognitive impairment did not.<br />
The percentage <strong>of</strong> residents with no impairment<br />
increased from 35% in 2005 to 43.2% in 2009. In<br />
addition, the decline in impairment ranged from<br />
5.3% (e.g., 13.5% in 2005 to 12.4% in 2009) for mild<br />
impairment to 53.1% (6.4% in 2005 to 3% in 2009)<br />
for very severe impairment.<br />
Health Care<br />
Veterans<br />
The Department <strong>of</strong> Veterans Affairs (VA) ensures<br />
health care services for all honorably discharged<br />
veterans who actively served in the U.S. Armed<br />
Forces. Twenty-four months <strong>of</strong> continuous service is<br />
required from veterans who enlisted after September<br />
7, 1980, or entered active duty after October 16,<br />
1981 (U.S. Department <strong>of</strong> Veterans Affairs: Health<br />
Benefits, 2012, Chapter 1). In addition, serviceconnected<br />
disabilities and in<strong>com</strong>e levels determine<br />
eligibility. Priority is given to those with servicerelated<br />
disabilities (see Table HC20; U.S. Department<br />
<strong>of</strong> Veterans Affairs: Health Benefits, 2012).<br />
For the majority <strong>of</strong> veterans, enrollment is required.<br />
Exceptions to this rule include:<br />
• Veterans with a service-connected disability <strong>of</strong> 50<br />
percent or more<br />
• Veterans seeking care for a disability the military<br />
determined was incurred or aggravated in the<br />
line <strong>of</strong> duty, but which VA has not yet rated,<br />
within 12 months <strong>of</strong> discharge<br />
• Veterans seeking care for a service-connected<br />
disability only<br />
• Veterans seeking registry examinations (Ionizing<br />
Radiation, Agent Orange, Gulf War/Operation<br />
Iraqi Freedom and Depleted Uranium<br />
(U.S. Department <strong>of</strong> Veterans Affairs: Health<br />
Benefits, 2012, Chapter 1, p. 2).<br />
In addition to the VA’s general and specialized<br />
medical care, the Veterans Health Administration<br />
(VHA) provides health care to veterans whose<br />
needs are not fully covered by Medicare [Federal<br />
Interagency Forum on Aging-Related Statistics<br />
(2012). Such needs include long-term nursing home<br />
and <strong>com</strong>munity-based care, and specialized care for<br />
a variety <strong>of</strong> acute-care issues like depression, PTSD<br />
and suicidal ideations (Federal Interagency Forum,<br />
2012, p. 59).<br />
171
Health Care<br />
In 2011, the population <strong>of</strong> veterans 65 and older<br />
was estimated at 9.4 million with 3.8 million<br />
veterans enrolled to receive health care from the<br />
VHA (Federal Interagency Forum, 2012, p. 147).<br />
Of these, 2.6 million patients received health care.<br />
VHA also estimated that 38% <strong>of</strong> enrolled veterans<br />
have Medicare Part D coverage, 23% have private<br />
insurance, 15% have TRICARE® for Life medical<br />
coverage, 14% are eligible for Medicaid, and 5% have<br />
no health insurance (Federal Interagency Forum,<br />
2012, p. 59).<br />
Fig. Fig. HC19: <strong>Nevada</strong>, 2011: Distribution <strong>of</strong> <strong>of</strong><br />
Health Care Monies by Region<br />
60.1%<br />
Southern Urban Metro<br />
60.1%<br />
Southern Urban Metro<br />
Northern Urban Metro<br />
Northern Urban Metro<br />
Rural/Frontier<br />
Rural/Frontier<br />
25.7%<br />
25.7%<br />
14.2%<br />
14.2%<br />
Southern Urban Metro Northern Urban Metro Rural/Frontier<br />
Southern Urban Metro Northern Urban Metro Rural/Frontier<br />
(U.S. Dept. <strong>of</strong> Veterans Affairs: Expenditures, 2012)<br />
In 2011, Heidi Golding, principal analyst for the<br />
Military and Veterans’ Compensation, presented cost<br />
estimates for 2011-2020 before the Committee on<br />
Veterans’ Affairs and the U.S. Senate. Per Golding<br />
(2011), the VHA pays $8,800 per veteran treated<br />
at VA clinics, and FY 2011 VA health care and<br />
research appropriations totaled $52 billion. These<br />
appropriations increased from the $44 billion in 2009<br />
and $48 billion in 2010 (Potential Costs <strong>of</strong> Veterans,<br />
2010). By 2020, VA health care costs are projected to<br />
increase to $69 billion to $83 billion depending on<br />
the number <strong>of</strong> soldiers deployed in overseas conflicts<br />
and the in<strong>com</strong>e thresholds for eligibility (Potential<br />
Costs <strong>of</strong> Veterans, 2010). Veterans returning from<br />
<strong>com</strong>bat are more likely to be young with less than<br />
1% older than 60. Therefore, projected cost increases<br />
are more likely to be war-related for injuries such as<br />
amputations, PTSD and Traumatic Brain Injury rather<br />
than because <strong>of</strong> age.<br />
In 2010, <strong>Nevada</strong> spent $527.3 million for veteran<br />
health care with 57,869 veterans (unique patients)<br />
receiving treatment at a VA health care facility. By<br />
2011, the total had increased to $533.1 million for<br />
59,643 patients (see Table HC21; U.S. Department<br />
<strong>of</strong> Veteran Affairs: Expenditures, 2012). Of these<br />
patients, 60.5% (36,077) resided in the Southern<br />
Urban/Metropolitan region <strong>of</strong> the state, 23.3% in the<br />
Northern Urban/Metropolitan region, and 16.2% in<br />
the Rural/Frontier region.<br />
By region, 60.1% ($320 million) <strong>of</strong> VA health care<br />
expenditures in 2011 went to the Southern Urban/<br />
Metropolitan region <strong>of</strong> the state, 25.7% ($137 million)<br />
went to the Northern Urban/Metropolitan region,<br />
and 14.2% ($75.5 million) went to the Rural/Frontier<br />
regions (see Figure HC19).<br />
<strong>Nevada</strong> has one regional VA <strong>of</strong>fice, in Reno; one<br />
Benefits Office, in Las Vegas; and VA Medical<br />
Centers in Las Vegas and Reno. Health Care clinics<br />
are located in Elko (1), Ely (1), Fallon (1), Henderson<br />
(1), Las Vegas (4), Minden (1), Pahrump (1) and<br />
Winnemucca (1). The Elko clinic <strong>of</strong>fers virtual<br />
medical appointments to rural, hard-to-reach older<br />
veterans through telehealth (Juretic, Hill, Luptak, et<br />
al., 2010) 4 . Services include medication management<br />
and prescription refills, routine lab tests, health<br />
education and specialty services. Finally, the state<br />
has three veteran service centers (“Vet Centers”) in<br />
Henderson, Las Vegas and Reno.<br />
172<br />
4<br />
Telehealth is the use <strong>of</strong> electronic information and tele<strong>com</strong>munications technologies to support long-distance clinical health care (http://www.hrsa.<br />
gov/ruralhealth/about/telehealth/)
Table HC1<br />
Centers for Medicare & Medicaid Services Report: U.S. and <strong>Nevada</strong>, Utilization Report by Year<br />
2007 2008 2009 2010<br />
U.S. NV U.S. NV U.S. NV U.S. NV<br />
Hospital inpatient Medicare admissions 343.5 280.0 340.9 290.8 330.8 286.5 324.6 283.5<br />
(per 1,000 beneficiaries)<br />
Imaging Medicare service events (per 1,000 beneficiaries) 3.8 9.5 3.9 8.5 3.9 8.4 3.9 8.4<br />
Hospice Medicare admissions (per 1,000 beneficiaries) 30.2 25.1 31.3 25.3 32.0 25.2 33.1 27.6<br />
Skilled nursing facility Medicare admissions 87.2 47.8 89.3 51.7 87.9 53.2 87.8 55.2<br />
(per 1,000 beneficiaries)<br />
Home health Medicare episodes (per 1,000 beneficiaries) 182.7 160.5 196.5 179.6 210.4 184.5 217.2 195.1<br />
Hospital outpatient Medicare visits (per 1,000 beneficiaries) 3838.6 2369.0 3881.5 2360.3 3972.5 2411.2 4014.7 2391.7<br />
Ambulatory surgical center Medicare service events 181.5 230.8 197.6 234.3 207.3 251.7 209.3 258.0<br />
(per 1,000 beneficiaries)<br />
Physician evaluation and management Medicare 13493.3 13363.3 13697.9 13611.6 13840.1 13835.4 13866.0 13723.0<br />
service events (per 1,000 beneficiaries)<br />
Physician procedures Medicare service events 4198.5 4220.2 4349.4 4301.0 4534.9 4636.5 4577.0 4724.4<br />
(per 1,000 beneficiaries)<br />
Imaging Medicare service events (per 1,000 beneficiaries) 4322.0 4399.8 4432.6 4533.2 4496.2 4645.6 4448.6 4603.7<br />
(CDC: National Center for Health Statistics, n.d.)<br />
Health Care<br />
173
Health Care<br />
Table HC2<br />
<strong>Nevada</strong> Adults 65 and Older, 2011: Have Health Care Coverage<br />
Demographic Grouping N* Yes No<br />
% C.I. % C.I.<br />
Region Statewide 1,670 96.6% (94.9-98.3) 3.4% (1.7-5.1)<br />
Southern Urban/Metro 596 96.2% (93.7-98.6) 3.8% (1.4-6.3)<br />
Northern Urban/Metro 604 96.6% (94.4-98.9) 3.4% (1.1-5.6)<br />
Rural/Frontier 470 98.5% (97.4-99.7) 1.5% (0.3-2.6)<br />
Age 65-74 Years 1,030 96.7% (94.4-98.9) 3.3% (1.1-5.6)<br />
47-84 Years 454 97.0% (94.4-99.7) 3.0% (0.3-5.6)<br />
85 and Older 128 93.1% (84.0-100) 6.9% (0.0-16.0)<br />
Race White 1,442 96.9% (95.1-98.7) 3.1% (1.3-4.9)<br />
Black 47 ~ ~ ~ ~<br />
Other Race 93 100% (100-100) 0% (0.0-0.0)<br />
Hispanic 59 92.5% (83.5-100) 7.5% (0.0-16.5)<br />
Sex Male 668 95.0% (91.8-98.2) 5.0% (1.8-8.2)<br />
Female 1,002 98.0% (96.4-99.6) 2.0% (0.4-3.6)<br />
Education Less than H.S. 121 95.3% (90.4-100) 4.7% (0.0-9.6)<br />
H.S. or G.E.D. 511 96.1% (93.0-99.2) 3.9% (0.8-7.0)<br />
Some Post H.S. 525 96.2% (92.9-99.6) 3.8% (0.4-7.1)<br />
College Graduate 509 99.4% (98.8-100) 0.6% (0.0-1.2)<br />
In<strong>com</strong>e < $15K 165 94.7% (88.2-100) 5.3% (0.0-11.8)<br />
$15K to $24,999 307 96.7% (92.5-100) 3.3% (0.0-7.5)<br />
$25K to $34,999 212 97.3% (94.0-100) 2.7% (0.0-6.0)<br />
$35K to $49,999 234 99.3% (98.5-100) 0.7% (0.0-1.5)<br />
$50K to $74,999 227 98.9% (97.8-99.9) 1.1% (0.1-2.2)<br />
$75K or Higher 208 94.9% (88.4-100) 5.1% (0.0-11.6)<br />
*Sample sizes less than 50 are marked with ‘~’. Due to the small samples sizes, responses may not reliably represent the population;<br />
therefore, are not included.<br />
(CDC: BRFSS, 2011)<br />
Table HC3<br />
Medicare Health Insurance Benefits (HIB), 2010: Age by Costs per Hospital Stay<br />
Age Minimum Charge Maximum Charge Average Charge<br />
65-84 $0 $2,029,985 $63,670<br />
85+ $4 $1,670,011 $50,706<br />
(CDC: BRFSS, 2010)<br />
174
Table HC4<br />
U.S. Adults 65 and Older: Did not Get or Delayed Medical Care, Prescription Drugs or Dental Care Due to Cost<br />
Did Not get or delayed medical care due to cost<br />
1997 1998 1999 2000 2001 2002 2003 2004 2005 2006 2007 2008 2009 2010 2011<br />
65 Years and Older 4.6% 4.0% 4.2% 4.5% 4.0% 4.2% 4.5% 4.7% 4.6% 4.2% 4.3% 4.5% 5.1% 5.0% 4.6%<br />
65-74 Years 5.0% 4.3% 4.7% 5.1% 4.4% 5.0% 5.1% 5.5% 5.4% 5.0% 5.3% 5.1% 6.0% 6.3% 5.8%<br />
75 Years and Older 4.1% 3.6% 3.6% 3.8% 3.5% 3.4% 3.8% 3.9% 3.7% 3.3% 3.1% 3.8% 4.0% 3.4% 3.1%<br />
Did not get prescription drugs due to cost<br />
1997 1998 1999 2000 2001 2002 2003 2004 2005 2006 2007 2008 2009 2010 2011<br />
65 Years and Older 2.8% 2.3% 2.5% 3.9% 3.9% 5.0% 4.4% 5.4% 5.1% 3.6% 3.8% 3.9% 4.2% 4.7% 4.3%<br />
65-74 Years 3.4% 2.9% 2.8% 4.4% 4.6% 6.3% 5.5% 6.2% 6.4% 3.8% 4.5% 4.8% 5.0% 6.3% 5.7%<br />
75 Years and Older 2.0% 1.5% 2.1% 3.2% 3.1% 3.5% 3.1% 4.6% 3.6% 3.5% 3.0% 2.8% 3.1% 2.8% 2.6%<br />
Did not get dental care due to cost<br />
1997 1998 1999 2000 2001 2002 2003 2004 2005 2006 2007 2008 2009 2010 2011<br />
65 Years and Older 3.5% 2.7% 2.7% 3.4% 3.5% 4.0% 4.0% 5.5% 5.2% 3.9% 5.0% 5.6% 6.2% 6.9% 7.0%<br />
65-74 Years 4.2% 3.4% 3.5% 4.6% 4.4% 4.5% 5.3% 6.7% 6.2% 4.9% 6.4% 7.4% 8.0% 9.0% 9.0%<br />
75 Years and Older 2.6% 2.0% 1.8% 1.9% 2.6% 3.3% 2.4% 4.2% 4.0% 2.7% 3.4% 3.6% 4.1% 4.3% 4.5%<br />
(CDC: Publication & Information, 2011)<br />
Health Care<br />
175
Health Care<br />
Table HC5<br />
U.S. and <strong>Nevada</strong> Medicare Beneficiaries<br />
Year United States <strong>Nevada</strong><br />
1999 39,224,343 232,617<br />
2000 39,480,028 241,806<br />
2001 40,028,458 254,341<br />
2002 40,963,671 266,974<br />
2003 42,121,333 278,785<br />
2004 42,359,734 291,959<br />
2005 43,404,885 302,537<br />
2006 44,067,816 308,802<br />
2007 44,132,245 316,606<br />
2008 44,831,390 327,629<br />
2009 45,484,782 336,383<br />
2010 46,589,141 348,168<br />
2011 47,672,971 359,968<br />
2012 49,435,610 379,860<br />
(HJKFF, 2012)<br />
Table HC6<br />
Mean Age <strong>of</strong> Medicare Beneficiaries in Adults 65 and Older: U.S. and <strong>Nevada</strong><br />
Year United States <strong>Nevada</strong><br />
2007 76.49 74.95<br />
2008 76.46 74.91<br />
2009 76.43 74.84<br />
2010 76.42 74.81<br />
(CDC: National Center for Health Statistics, n.d.)<br />
176
Table HC7<br />
U.S. & <strong>Nevada</strong>, 2010-2011: Distribution <strong>of</strong> Medicare Beneficiaries<br />
United States <strong>Nevada</strong><br />
Age 19-64 Years 17.0% 15.7%<br />
65-74 Years 44.8% 48.0%<br />
75-84 Years 27.0% 26.3%<br />
85 and Older 10.3% ~<br />
Sex Female 55.0% 51.3%<br />
Male 44.6% 48.7%<br />
Race White 77.0% 73.7%<br />
Black 10.4% 6.1%<br />
Hispanic 7.6% 10.8%<br />
Other 4.7% 9.5%<br />
Federal Poverty Level (FPL) Under 100% 16.0% 14.1%<br />
100-149% 16.7% 14.7%<br />
150-199% 13.8% 14.8%<br />
200% or Higher 54.0% 56.5%<br />
Health Care<br />
(HJKFF, 2012)<br />
177
Health Care<br />
Table HC8<br />
U.S. and <strong>Nevada</strong> Distribution <strong>of</strong> Medicare Spending by Service Type, 2009<br />
Medicare Spending by Residence Medicare Spending<br />
(in millions)<br />
Per Enrollee by<br />
State <strong>of</strong> Residence<br />
United<br />
United States <strong>Nevada</strong> States <strong>Nevada</strong><br />
% $ % $ $ $<br />
Hospital Care 46.8% $220,382 45.5% $1,511 $4,847 $4,405<br />
Physician & Clinical Services 23.2% $109,434 25.4% $843 $2,407 $2,458<br />
Other Pr<strong>of</strong>essional Services 2.9% $13,667 2.7% $90 $301 $263<br />
Dental Services 0.1% $290 0.0% $1 $6 $3<br />
Home Health Care 1 6.3% $29,835 7.2% $240 $656 $698<br />
Prescription Drugs and 12.2% $57,627 11.0% $365 $1,267 $1,064<br />
Other Medical Nondurables<br />
Durable Medical Products 1.6% $7,446 2.2% $74 $164 $215<br />
Nursing Home Care 5.9% $27,991 5.3% $177 $616 $515<br />
Other Health, Residential, 1.0% $4,588 0.7% $24 $101 $69<br />
and Personal Care<br />
Total 100% $471,260 100% $3,324 $10,365 $9,692<br />
(HJKFF, 2012)<br />
178<br />
1<br />
Home Health care covers medical care provided in the home by freestanding home health agencies (HHAs). Medical equipment sales or rentals not<br />
billed through HHAs and non-medical types <strong>of</strong> home care (Meals on Wheels, chore-worker services, friendly visits, or other custodial services) are<br />
excluded (http://www.statehealthfacts.org/pr<strong>of</strong>ileind.jsp?ind=626&cat=6&rgn=30&cmprgn=1).
Table HC9<br />
U.S. and <strong>Nevada</strong>, FY 2010: Distribution <strong>of</strong> Medicaid Spending by Service<br />
Acute Care Long Term Care Disproportionate Share<br />
Hospital Payments<br />
<strong>Nevada</strong> 68.1% 25.6% 6.3%<br />
United States 64.0% 31.5% 4.5%<br />
Health Care<br />
(HJKFF, 2012)<br />
Table HC10<br />
U.S. Medical <strong>School</strong> Applicants and Enrollment, 2002-2012<br />
% % %<br />
Change Total U.S. Change Change % Change<br />
Total from Medical from Total First- from in<br />
First-time Prior <strong>School</strong> Prior Time Prior Enrollment<br />
Year Applicants Year Applicants Year Enrollment Year from 2002<br />
2002 24,884 -0.1% 33,624 -3.5% 16,488 0.8% ~<br />
2003 26,160 5.1% 34,791 3.5% 16,541 0.3% 0.3%<br />
2004 27,190 3.9% 35,735 2.7% 16,648 0.6% 1.0%<br />
2005 28,291 4.0% 37,372 4.6% 17,003 2.1% 3.1%<br />
2006 29,583 4.6% 39,108 4.6% 17,361 2.1% 5.3%<br />
2007 31,946 8.0% 42,315 8.2% 17,759 2.3% 7.7%<br />
2008 31,019 -2.9% 42,231 -0.2% 18,036 1.6% 9.4%<br />
2009 31,062 0.1% 42,268 0.1% 18,390 2.0% 11.5%<br />
2010 31,832 2.5% 42,741 1.1% 18,665 1.5% 13.2%<br />
2011 32,654 2.6% 43,919 2.8% 19,230 3.0% 16.6%<br />
2012 33,772 3.4% 45,266 3.1% 19,517 1.5% 18.4%<br />
(Ward, 2012)<br />
179
Health Care<br />
Table HC11<br />
AAMC, 2010: U.S. and State Physician Workforce<br />
U.S.<br />
<strong>Nevada</strong><br />
Rate Per % Rate Per %<br />
100,000 100,000<br />
Total Active Physicians 258.7 198.3<br />
Primary Care Physicians 90.5 71.2<br />
Physicians Active in Patient Care 219.5 178.1<br />
Active Patient Care Primary Care Physicians 79.4 63.7<br />
Female Physicians 30.4% 25.0%<br />
Physicians, International Medical Graduates 24.0% 27.9%<br />
Physicians Age 60 or Older 26.2% 24.5%<br />
Medical and Osteopathic <strong>School</strong> Enrollment 31.4 29.4<br />
(AAMC, 2011)<br />
Table HC12<br />
<strong>Nevada</strong> Caregiving Data: 2006, 2009<br />
% Change:<br />
2006 2007 2009 2006, 2009<br />
Number <strong>of</strong> Caregivers 260,000 280,000 364,000 40.0%<br />
(In Last Month)<br />
Estimated Hours <strong>of</strong> Caregiving 280,000,000 305,000,000 348,000,000 24.3%<br />
Rate per Hour $10.47 $10.81 $11.48 9.6%<br />
Total Economic Value $3 billion $3.3 billion $4 billion 33.3%<br />
(Feinberg et al., 2011; Houser & Gibson, 2007, 2008)<br />
180
Table HC13<br />
U.S. and <strong>Nevada</strong>, 2009: Distribution <strong>of</strong> Health Care Expenditures by Service<br />
NV NV US US<br />
% $ % $<br />
Hospital Care 34.0% $5,142 36.3% $759,074<br />
Physician and Other Pr<strong>of</strong>essional Services 33.1% $5,010 27.4% $572,668<br />
Prescription Drugs and Other Medical Nondurables 15.6% $2,357 14.0% $293,163<br />
Nursing Home Care 3.2% $490 6.6% $136,971<br />
Dental Services 5.8% $874 4.9% $102,222<br />
Home Health Care 3.1% $463 3.3% $68,264<br />
Medical Durables 2.5% $375 1.7% $34,878<br />
Other Health, Residential, and Personal Care 2.8% $421 5.9% $122,623<br />
Total 100% $15,133 100% $2,089,862<br />
Health Care<br />
(Henry J. Kaiser: State Health Facts: <strong>Nevada</strong> Health Expenditures, 2012)<br />
Table HC14<br />
U.S. and <strong>Nevada</strong>, 2003-2009: Nursing Homes<br />
Total For Pr<strong>of</strong>it Non-Pr<strong>of</strong>it Government<br />
U.S. <strong>Nevada</strong> U.S. <strong>Nevada</strong> U.S. <strong>Nevada</strong> U.S. <strong>Nevada</strong><br />
2003 16,774 44 10,978 35 4,762 4 1,039 5<br />
2004 16,482 44 10,810 33 4,648 5 1,029 6<br />
2005 16,310 47 10,748 36 4,562 5 1,000 6<br />
2006 16,117 47 10,681 36 4,457 5 980 6<br />
2007 16,051 48 10,756 34 4,324 8 971 6<br />
2008 15,954 48 10,733 34 4,287 8 934 6<br />
2009 15,884 49 10,726 36 4,226 7 932 6<br />
(CMS: Nursing Homes, 2008, 2010)<br />
181
Health Care<br />
Table HC15<br />
U.S. and <strong>Nevada</strong>: Nursing Home Certification Type<br />
2005 2006 2007 2008 2009<br />
U.S. NV U.S. NV U.S. NV U.S. NV U.S. NV<br />
Dually Certified 14,301 44 14,300 44 14,326 45 14,350 44 14,360 45<br />
Medicare only 871 1 863 1 857 1 823 2 819 2<br />
Medicaid only 1,138 2 955 2 867 2 781 2 705 2<br />
Total Facilities 16,310 47 15,118 47 16,051 48 15,954 48 15,884 49<br />
(CMS: Nursing Homes, 2010)<br />
Table HC16<br />
U.S. and <strong>Nevada</strong>, 2007-2009: Nursing Home Deficiencies Details<br />
2007 2008 2009<br />
U.S. NV U.S. NV U.S. NV<br />
No Deficiencies 8.0% 14.5% 7.5% 0.0% 8.0% 2.1%<br />
Severe Deficiencies: Actual Harm or 17.1% 12.7% 16.5% 14.3% 13.9% 27.1%<br />
Immediate Jeopardy<br />
Substandard Quality <strong>of</strong> Care 3.6% 1.8% 4.4% 2.0% 3.7% 6.3%<br />
Mean Number <strong>of</strong> Deficiencies 7.2 6.9 7.0 8.6 6.7 8.9<br />
(CMS: Nursing Homes, 2010)<br />
Table HC17<br />
U.S. and <strong>Nevada</strong>, 2011: Cost <strong>of</strong> Care<br />
U.S.<br />
<strong>Nevada</strong><br />
Daily,<br />
Daily,<br />
Hourly,<br />
Hourly,<br />
Monthly Annual Monthly Annual<br />
Private Room Daily Rate $239.00 $ 87,235.00 $237.00 $ 86,505.00<br />
Semi-Private Room Daily Rate $214.00 $ 78,110.00 $206.00 $ 75,190.00<br />
Assisted Living Communities Monthly Base Rate $3,477.00 $ 41,724.00 $3,151.00 $ 37,812.00<br />
Home Care: Home Health Aide Hourly Rate $21.00 $ 21,840.00 $22.00 $ 22,880.00<br />
Home Care: Homemaker Hourly Rate $19.00 $ 19,760.00 $20.00 $ 20,800.00<br />
Adult Day Services Daily Rate $70.00 $ 18,200.00 $69.00 $ 17,940.00<br />
(MetLife, 2011)<br />
182
Table HC18<br />
U.S. and <strong>Nevada</strong>, 2009: Nursing Home Resident Characteristics<br />
U.S.<br />
<strong>Nevada</strong><br />
Sex Male 34.6% 41.1%<br />
Female 65.4% 58.9%<br />
Age 0-21 Years 0.2% 0.2%<br />
22-30 Years 0.3% 0.3%<br />
31-64 Years 13.7% 17.2%<br />
65-74 Years 16.7% 20.3%<br />
75-84 Years 32.2% 32.8%<br />
85-95 Years 31.7% 26.1%<br />
95 and Older 5.2% 3.2%<br />
Race White 82.6% 86.5%<br />
Black 11.4% 6.3%<br />
Asian 1.5% 2.5%<br />
American Indian, Alaskan Native 0.4% 0.7%<br />
Hispanic 4.1% 4.1%<br />
Number <strong>of</strong> ADL Impairments 0 26.0% 28.7%<br />
1 7.5% 6.2%<br />
2 6.6% 5.8%<br />
3 8.2% 6.8%<br />
4 33.2% 32.5%<br />
5 18.4% 19.9%<br />
Cognitive Impairment Score 0 (No Impairment) 32.3% 43.2%<br />
1 (Very Mild Impairment) 12.0% 13.8%<br />
2 (Mild Impairment) 14.8% 12.4%<br />
3 (Moderate Impairment) 23.7% 18.6%<br />
4 (Moderate Severe Impairment) 7.0% 4.6%<br />
5 (Severe Impairment) 5.1% 4.5%<br />
6 (Very Severe Impairment) 5.1% 3.0%<br />
Health Care<br />
(CMS: Nursing Homes, 2010)<br />
183
Health Care<br />
Table HC19<br />
<strong>Nevada</strong>, 2005-2009: Nursing Home Resident Characteristics<br />
2005 2006 2007 2008 2009<br />
Sex Male 38.5% 39.2% 39.6% 41.1% 41.1%<br />
Female 61.5% 60.8% 60.4% 58.9% 58.9%<br />
Age 0-21 Years 0.5% 0.4% 0.2% 0.2% 0.2%<br />
22-30 Years 0.5% 0.5% 0.5% 0.4% 0.3%<br />
31-64 Years 15.2% 15.9% 17.1% 17.4% 17.2%<br />
65-74 Years 17.8% 17.7% 18.4% 19.2% 20.3%<br />
75-84 Years 35.3% 34.7% 33.7% 32.8% 32.8%<br />
85-95 Years 27.4% 27.5% 26.9% 26.7% 26.1%<br />
95 and Older 3.4% 3.3% 3.2% 3.3% 3.2%<br />
Race White 88.6% 88.0% 87.5% 87.0% 86.5%<br />
Black 5.6% 5.7% 6.1% 6.4% 6.3%<br />
Asian 1.8% 2.0% 2.0% 2.2% 2.5%<br />
American Indian, Alaskan Native 0.6% 0.7% 0.7% 0.6% 0.7%<br />
Hispanic 3.4% 3.5% 3.7% 3.7% 4.1%<br />
Number <strong>of</strong> 0 31.5% 31.1% 29.5% 28.3% 28.7%<br />
ADL Impairments 1 6.7% 6.6% 6.6% 6.7% 6.2%<br />
2 5.9% 5.7% 5.8% 5.7% 5.8%<br />
3 7.9% 7.3% 7.5% 7.6% 6.8%<br />
4 27.0% 29.4% 29.6% 31.5% 32.5%<br />
5 21.1% 19.9% 21.0% 20.3% 19.9%<br />
Cognitive 0 (No Impairment) 35.0% 38.3% 39.1% 41.5% 43.2%<br />
Impairment Score 1 (Very Mild Impairment) 11.2% 13.1% 13.0% 13.7% 13.8%<br />
2 (Mild Impairment) 13.1% 11.5% 12.3% 12.2% 12.4%<br />
3 (Moderate Impairment) 22.3% 20.9% 20.7% 19.5% 18.6%<br />
4 (Moderate Severe Impairment) 6.9% 6.3% 5.5% 4.4% 4.6%<br />
5 (Severe Impairment) 5.3% 5.1% 5.5% 5.5% 4.5%<br />
6 (Very Severe Impairment) 6.4% 4.8% 3.9% 3.4% 3.0%<br />
(CMS: Nursing Homes, 2010)<br />
184
Veteran Priority Groups for Health Care Benefits*<br />
Table HC20<br />
Group 1 • Veterans with service-connected disabilities rated 50% or more and/or Veterans<br />
determined by VA to be unemployable due to service-connected conditions.<br />
Group 2 • Veterans with service-connected disabilities rated 30% or 40%.<br />
Health Care<br />
Group 3 • Veterans who are former POWs.<br />
• Veterans awarded the Purple Heart Medal.<br />
• Veterans awarded the Medal <strong>of</strong> Honor.<br />
• Veterans whose discharge was for a disability incurred or aggravated in the line <strong>of</strong> duty.<br />
• Veterans with VA service-connected disabilities rated 10% or 20%.<br />
• Veterans awarded special eligibility classification under Title 38, U.S.C., § 1151, “benefits<br />
for individuals disabled by treatment or vocational rehabilitation.”<br />
Group 4 • Veterans receiving increased <strong>com</strong>pensation or pension based on their need for regular aid<br />
and attendance or by being permanently housebound.<br />
• Veterans determined by VA to be catastrophically disabled.<br />
Group 5 • Non-service-connected veterans and non-<strong>com</strong>pensable service-connected Veterans<br />
rated 0%, whose annual in<strong>com</strong>e and/or net worth are not greater than the VA financial<br />
thresholds.<br />
• Veterans receiving VA pension benefits.<br />
• Veterans eligible for Medicaid benefits.<br />
Group 6 • Compensable 0% service-connected veterans. Veterans exposed to ionizing radiation<br />
during atmospheric testing or during the occupation <strong>of</strong> Hiroshima and Nagasaki. Project<br />
112/SHAD participants.<br />
• Veterans who served in the Republic <strong>of</strong> Vietnam between Jan. 9, 1962, and May 7, 1975.<br />
• Veterans who served in the Southwest Asia Theater <strong>of</strong> Combat Operations from Aug. 2,<br />
1990, through the present.<br />
• Veterans who served in a Theater <strong>of</strong> Combat Operations after Nov. 11, 1998, as follows:<br />
• Veterans discharged from active duty on or after Jan. 28, 2003, for five years post<br />
discharge.<br />
Group 7 • Veterans with in<strong>com</strong>es below the geographic means test in<strong>com</strong>e thresholds and who<br />
agree to pay the applicable copayment.<br />
185
Health Care<br />
Group 8 • Veterans with gross household in<strong>com</strong>es above the VA national in<strong>com</strong>e threshold and the<br />
geographically adjusted in<strong>com</strong>e threshold for their resident location and who agrees to<br />
pay copays.<br />
• Veterans eligible for enrollment: Non-<strong>com</strong>pensable 0% service-connected and:<br />
—Subpriority a: Enrolled as <strong>of</strong> Jan. 16, 2003, and who have remained enrolled since that<br />
date and/ or placed in this subpriority due to changed eligibility status.<br />
—Subpriority b: Enrolled on or after June 15, 2009, whose in<strong>com</strong>e exceeds the current VA<br />
National In<strong>com</strong>e Thresholds or VA National Geographic In<strong>com</strong>e Thresholds by 10% or<br />
less.<br />
• Veterans eligible for enrollment: Non-services-connected and:<br />
—Subpriority c: Enrolled as January 16, 2003, and who remained enrolled since that date<br />
and/or placed in this subpriority due to changed eligibility status<br />
—Subpriority d: Enrolled on or after June 15, 2009, whose in<strong>com</strong>es exceeds the current VA<br />
National In<strong>com</strong>e Thresholds or VA National Geographic In<strong>com</strong>e Thresholds by 10% or l<br />
less.<br />
• Veterans not eligible for enrollment: Veterans not meeting the criteria above:<br />
—Subpriority e: Non-<strong>com</strong>pensable 0% service-connected<br />
—Subpriority g: Non-service-connected<br />
*Note: Table taken directly from Health Benefits booklet and the VA website.<br />
(U.S. Department <strong>of</strong> Veterans Affairs: Health Benefits, 2012, Chapter 1, p. 2-4)<br />
186
Data Limitations, Chall<strong>eng</strong>es & Cautions<br />
All reports have inherent limitations that could<br />
influence the reliability and validity <strong>of</strong> the<br />
information presented. While citing all data<br />
limitations is not possible, key limitations, chall<strong>eng</strong>es<br />
and cautions are included in this section.<br />
Data cited in this report are from nationally<br />
recognized, reliable sources. The data also are<br />
secondary, which means that we did not develop<br />
the surveys, collect the information, or analyze<br />
the data. As such, we cannot account for the datacollection<br />
processes, the possibility <strong>of</strong> response<br />
bias, problems due to small sample size, conflicting<br />
data, or error. In addition, the dates <strong>of</strong> available data<br />
varied from 2008-2012 across (and even within)<br />
sources. Differences in years <strong>of</strong> data collection<br />
<strong>com</strong>plicated efforts to make <strong>com</strong>parisons. Therefore,<br />
we reported some <strong>of</strong> the information by year without<br />
<strong>com</strong>parison. Finally, even with efforts to crossvalidate<br />
information over multiple sources, it is still a<br />
possibility that results were misinterpreted.<br />
Other chall<strong>eng</strong>es related to the lack <strong>of</strong> national and<br />
state-level data specific to the senior population.<br />
This was particularly apparent when researching<br />
information about illicit substance use and gambling<br />
among older <strong>Nevada</strong>ns, researching data on older<br />
<strong>Nevada</strong> veterans, and getting adequate sample<br />
sizes in surveys <strong>com</strong>pleted by underrepresented<br />
populations. National sources such as the Substance<br />
Abuse and Mental Health Services Administration<br />
(SAMSHA), National Survey on Drug Use<br />
and Health (NSDUH) surveys report use and<br />
dependence data only through age 59. This makes<br />
it difficult to capture a good picture <strong>of</strong> substance use<br />
issues among the nation’s older adults.<br />
With gambling prevalence, we found a lack <strong>of</strong><br />
reliable data regarding issues relating specifically to<br />
<strong>Nevada</strong>’s older adults. Researchers in 2012 refuted<br />
a well-cited study due to methodological issues<br />
and suggested that the earlier data underestimated<br />
gambling disorders among older <strong>Nevada</strong>ns.<br />
It was chall<strong>eng</strong>ing to find information specifically<br />
about older veterans in <strong>Nevada</strong> because this<br />
population has not been on the radar <strong>of</strong> researchers.<br />
Finally, BRFSS samples sizes from underrepresented<br />
groups such as Blacks, Asians, etc., were too small<br />
to ensure reliability. We chose not to use these<br />
data, even though this left gaps in the available<br />
information. As a result, interpretations <strong>of</strong> the<br />
existing data must be made with caution.<br />
It is important to consider that participant bias<br />
may have skewed survey results, demographics<br />
and prevalence rates. A respondent may inflate<br />
measures related to education and in<strong>com</strong>e while<br />
understating other measures such as weight and<br />
number <strong>of</strong> alcoholic drinks consumed. Although<br />
retrospective accounts are understandably inaccurate<br />
and unreliable, trend data is not as sensitive to<br />
respondent bias because individuals are less likely<br />
to report with systematic bias over time. In addition,<br />
if some respondents choose not to answer specific<br />
questions, nonresponse bias may occur.<br />
In addition to respondent bias, data collection<br />
is susceptible to an array <strong>of</strong> errors, such as<br />
misinterpretations <strong>of</strong> responses by interviewers,<br />
data entry errors, and missed questions. Errors can<br />
occur during data analysis, such as <strong>com</strong>puter coding,<br />
scanning and processing.<br />
Resources such as time for research and development<br />
and funding for design and printing limited the<br />
scope <strong>of</strong> this project. In the future, as more data are<br />
collected about the older adult population, baselines<br />
and/or benchmarks could be established to measure<br />
and evaluate <strong>Nevada</strong>’s performance in meeting the<br />
needs <strong>of</strong> its older adults.<br />
Specific Data Source Information<br />
The secondary data contained in this report was<br />
collected from a variety <strong>of</strong> federal, state and private<br />
resources, chiefly the U.S. Census Bureau, Centers<br />
for Disease Control and Prevention (CDC), Henry<br />
J. Kaiser Family Foundation, Centers for Medicare<br />
and Medicaid Services (CMS), <strong>Nevada</strong> State<br />
Demographer and the <strong>Nevada</strong> State Health Division.<br />
APPENDIX<br />
187
APPENDIX<br />
CDC Behavior Risk Factor Surveillance<br />
System (BRFSS)<br />
Due to sampling and weighting procedures, the CDC<br />
re<strong>com</strong>mends that caution be taken when interpreting<br />
prevalence rates if the unweighted sample size for<br />
the denominator is less than 50. Sample sizes <strong>of</strong> less<br />
than 50 were considered unreliable and were not<br />
used in this report. The result was that responses<br />
for certain underrepresented groups were not<br />
captured at all. Thus, caution is encouraged in the<br />
interpretation <strong>of</strong> data.<br />
The <strong>Nevada</strong> State Health Division is federally<br />
funded to collect annual BRFSS data via random<br />
phone surveys <strong>of</strong> <strong>Nevada</strong> residents and to analyze<br />
the results. Although BRFSS data were collected<br />
across the state <strong>of</strong> <strong>Nevada</strong>, the percentage <strong>of</strong> older<br />
adults within each county ranged from 8.7% <strong>of</strong> Elko<br />
County to 26.2% <strong>of</strong> Esmeralda County. Older adults<br />
constituted less than a fifth <strong>of</strong> the population in every<br />
<strong>Nevada</strong> county, except Esmeralda. In addition, the<br />
percentage <strong>of</strong> older adult participants was small;<br />
therefore, the responses received from older adults<br />
may not be reflected adequately in this report.<br />
CDC National Center for Injury<br />
Prevention and Control<br />
This organization, which obtains much <strong>of</strong> its data<br />
from the National Center for Health<br />
Statistics, re<strong>com</strong>mends caution with sample sizes <strong>of</strong><br />
less than 20. The majority <strong>of</strong> health data on <strong>Nevada</strong><br />
older adults were not analyzed for prevalence and<br />
trends across races or older age groups because<br />
sample sizes were too small.<br />
U.S. Census Bureau<br />
The Census Bureau collects data through the mail,<br />
over the phone, and in person for its decennial<br />
census. The American Community Survey (ACS),<br />
an ongoing nationwide survey designed to provide<br />
<strong>com</strong>munities with a fresh look at how they are<br />
changing, is based on a sample <strong>of</strong> the <strong>com</strong>munity.<br />
The survey is administered every year to a small<br />
percentage <strong>of</strong> the population. Where possible, fiveyear<br />
ACS aggregate data were used as this provided<br />
the most <strong>com</strong>prehensive data. However, in cases<br />
where information was unavailable through this<br />
method, the one- or three-year ACS data sets were<br />
used. These data sets may not adequately reflect<br />
the smaller populations living in the rural/frontier<br />
regions <strong>of</strong> the state.<br />
188
References<br />
Acierno, R., Hernandez, M. A., Amstadter, A. B.,<br />
Resnick, H. S., Steve, K., Muzzy, W., & Kilpatrick,<br />
D. G. (2010). Prevalence and correlates<br />
<strong>of</strong> emotional, physical, sexual, and<br />
financial abuse and potential neglect in the<br />
United States: The national elder mistreatment<br />
study. Research and Practice, 100(2), 292-<br />
297.<br />
Administration on Aging (AOA). (2011). Positive<br />
aging: HIV turns 30 webinar. Retrieved from<br />
AOA: http://www.aoa.gov/AoARoot/<br />
AoA_Programs/HPW/HIV_AIDS/Webinar.<br />
aspx<br />
Administration on Aging (AOA): National Center<br />
on Elder Abuse (NCEA). (2012). Elder abuse/<br />
mistreatment defined. Retrieved from AOA<br />
website: http://www.ncea.aoa.gov/Main_<br />
Site/FAQ/Basics/Definition.aspx<br />
American Cancer Society (ACS). (2012). How many<br />
women get ovarian cancer? Retrieved from the<br />
ACS website: http://www.cancer.org/cancer/ovariancancer/overviewguide/ovariancancer-overview-key-statistics<br />
American Foundation for Suicide Prevention<br />
(AFSP). (2012). Facts and figures: State statistics.<br />
Retrieved from AFSP website: https://<br />
www.afsp.org/index.cfm?fuseaction=home.<br />
viewpage&page_id=05114FBE-E445-<br />
7831-F0C1494E2FADB8EA<br />
American Heart Association (AHA). (2012). How<br />
to get your cholesterol tested. Retrieved from<br />
AHA website: http://www.heart.org/<br />
HEARTORG/Conditions/Cholesterol/<br />
SymptomsDiagnosisMonitoring<strong>of</strong>HighCholesterol/How-To-Get-Your-Cholesterol-Tested_UCM_305595_Article.jsp<br />
APPENDIX<br />
Alzheimer’s Association (2012). Alzheimer’s disease<br />
facts and figures. Alzheimer’s & Dementia,<br />
8(2), 1-72.<br />
American Association <strong>of</strong> Retired Persons (AARP).<br />
(2012). Grandfacts: National fact sheet for<br />
grandparents and other relatives raising children.<br />
Retrieved from the AARP website:<br />
http://www.aarp.org/content/dam/aarp/<br />
relationships/friends-family/grandfacts/<br />
grandfacts-national.pdf<br />
American Cancer Society (ACS). (2012). How many<br />
men get prostate cancer? Retrieved from the<br />
ACS website: http://www.cancer.org/cancer/prostatecancer/overviewguide/prostate-cancer-overview-key-statistics<br />
American Cancer Society (ACS). (2012). How many<br />
people get colorectal cancer? Retrieved from<br />
the ACS website: http://www.cancer.org/<br />
cancer/colonandrectumcancer/overviewguide/colorectal-cancer-overview-key-statistics<br />
American Cancer Society (ACS). (2012). How many<br />
women get breast cancer? Retrieved from the<br />
ACS website: http://www.cancer.org/cancer/breastcancer/overviewguide/breastcancer-overview-key-statistics<br />
American Geriatrics Society (AGS). (2012, June).<br />
Current geriatrician shortfall. Retrieved from<br />
the AGS website: http://www.americangeriatrics.org/files/documents/Adv_Resources/GeriShortageCurrentNumbers2012.pdf<br />
American Psychiatric Association. Diagnostic criteria<br />
for 309.81: Posttraumatic stress disorder.<br />
(1994). In Diagnostic and statistical manual <strong>of</strong><br />
mental disorders (4th ed., TM., pp. 427-428).<br />
Washington, DC: American Psychiatric Association.<br />
American Society <strong>of</strong> Civil Engineers (ASCE). (2009-<br />
2012). Report card for America’s infrastructure:<br />
<strong>Nevada</strong>. Retrieved from ASCE website:<br />
http://www.infrastructurereportcard.org/<br />
state-page/nevada<br />
American Society <strong>of</strong> Civil Engineers (ASCE). (2010).<br />
2009 Report card for America’s infrastructure.<br />
Retrieved from ASCE website: http://www.<br />
infrastructurereportcard.org/sites/default/<br />
files/RC2009_roads.pdf<br />
American with Disabilities Act <strong>of</strong> 1990, as amended<br />
(ADA). (2009). The United States Department<br />
<strong>of</strong> Justice. Retrieved from ADA website:<br />
http://www.ada.gov/pubs/adastatute08.<br />
htm#12102<br />
189
APPENDIX<br />
190<br />
Anderson, L. A., Day, K. L., Beard, R. L., Reed, P.<br />
S., & Wu, B. (2009). The public’s perceptions<br />
about cognitive health and Alzheimer’s disease<br />
among the U.S. population: A national<br />
review. The Gerontologist, 49(S1), S3-S11.<br />
Association <strong>of</strong> American Medical Colleges<br />
(AAMC). (2003). Help wanted: More U.S.<br />
doctors. Retrieved from AAMC website:<br />
https://www.aamc.org/download/82874/<br />
data/helpwanted.pdf<br />
Association <strong>of</strong> American Medical Colleges<br />
(AAMC). (2011). 2011 State physician workforce<br />
data book: Center for workforce studies.<br />
Retrieved from the AAMC website: https://<br />
www.aamc.org/download/263512/data/<br />
statedata2011.pdf<br />
Association <strong>of</strong> American Medical Colleges<br />
(AAMC). (2011). The impact <strong>of</strong> health care<br />
reform on the future supply and demand for<br />
physicians updated. Retrieved from the<br />
AAMC website: https://www.aamc.org/<br />
download/158076/data/updated_projections_through_2025.pdf<br />
Association <strong>of</strong> American Medical Colleges<br />
(AAMC). (2012). Spotlight on specialties: geriatric<br />
medicine. Retrieved from the AAMC<br />
website: https://www.aamc.org/students/<br />
medstudents/cim/choicesnewsletter/<br />
spring12/278804/path_geriatricmedicine.<br />
html<br />
Bagalman, E. (2012, February 3). Suicide prevention<br />
efforts <strong>of</strong> the veterans health administration.<br />
Congressional Research Service, 7-5700/R42340:<br />
Report for Congress. Retrieved from Fetal Alcohol<br />
Syndrome website: http://www.fas.<br />
org/sgp/crs/misc/R42340.pdf<br />
Benderly, B. L. (2008, January/February). Veterans<br />
& their families: A SAMHSA priority. SAM-<br />
HSA News, 16(1), 1-5. Retrieved from SAM-<br />
HSA website: http://www.samhsa.gov/<br />
samhsa_news/volumexvi_1/article1.htm<br />
Bernhard, B. and St. John, S. (2012). Problem<br />
gambling and treatment in <strong>Nevada</strong>.<br />
Reports. Paper 49. http://digitalscholarship.unlv.edu/cgi/viewcontent.<br />
cgi?article=1048&context=social_health_nevada_reports<br />
Booth, B. M., & Blow, F. C. (2008). Chapter 9. Utilization<br />
<strong>of</strong> veteran’s health services for substance<br />
abuse: A study <strong>of</strong> aging baby boomer<br />
veterans. Substance Abuse and Mental Health<br />
Services Administration: Office <strong>of</strong> Applied Studies.<br />
Retrieved from the SAMHSA website:<br />
http://oas.samhsa.gov/aging/chap9.htm<br />
Bosworth, H. B., Hays, J. C., George, L. K., and Steffens,<br />
D. C. (2002). Psychosocial and clinical<br />
predictors <strong>of</strong> unipolar depression out<strong>com</strong>e<br />
in older adults. International Journal <strong>of</strong> Geriatric<br />
Psychiatry, 17, 238-246.<br />
Bragg, E. J., Warshaw, G. A., Meganathan, K., &<br />
Brewer, D. E. (2012). The development <strong>of</strong><br />
academic geriatric medicine in the United<br />
States 2005 to 2010: An essential resource for<br />
improving the medical care <strong>of</strong> older adults.<br />
Journal <strong>of</strong> the American Geriatrics Society,<br />
60(8), 1540-1545.<br />
Bricker, J., Kennickell, A. B., Moore, K. B., and Sabelhaus,<br />
J. (2012, June). Changes in U.S.<br />
family finances from 2007 to 2010: Evidence<br />
from the survey <strong>of</strong> consumer finances. Federal<br />
Reserve Bulletin, 98(22). Retrieved from<br />
the Federal Reserve website: http://www.<br />
federalreserve.gov/pubs/bulletin/2012/<br />
pdf/scf12.pdf<br />
Brief for the American Hospital Association as Amici<br />
Curiae, Department <strong>of</strong> Health and Human<br />
Services, et al., v Florida, et al, 11-398 (2012).<br />
Retrieved from the AAMC website: https://<br />
www.aamc.org/download/286584/data/<br />
amicusbrief2.pdf<br />
Bureau <strong>of</strong> Labor Statistics. (2012). Employment<br />
projections. Table 3.3. Civilian labor force participation<br />
rates by age, sex, race, and ethnicity.<br />
Retrieved from Bureau <strong>of</strong> Labor Statistics<br />
website: http://www.bls.gov/emp/ep_table_303.htm<br />
Campanelli, C. M. (2012). American geriatrics society<br />
updated Beers criteria for potential inappropriate<br />
medication use in older adults.<br />
Journal <strong>of</strong> the American Geriatrics Society, 1-16.<br />
DOI: 10.1111/j.1532-5415.2012.03923.x. Retrieved<br />
from www.americangeriatrics.org:<br />
http://www.americangeriatrics.org/files/<br />
documents/beers/2012BeersCriteria_JAGS.<br />
Campbell, P. R. (1996). Population projections for<br />
states by age, sex, race, and Hispanic origin:<br />
1995-2025. Washington, D.C.: U.S. Census<br />
Bureau.<br />
Centers for Disease Control and Prevention (CDC).<br />
(2011). The CDC Healthy Brain Initiative: Progress<br />
2006‒2011, Atlanta, GA: CDC. Retrieved<br />
from CDC website: http://www.cdc.gov/<br />
aging//pdf/HBIBook_508.pdf<br />
Centers for Disease Control and Prevention (CDC):<br />
Behavioral risk Factor Surveillance System<br />
Survey Data (BRFSS). (2011). Data analysis<br />
by: Office <strong>of</strong> Public Health Informatics and<br />
Epidemiology, <strong>Nevada</strong> State Health Division<br />
[unpublished data]. Carson City, NV:<br />
Department <strong>of</strong> Health and Humans Services.<br />
Centers for Disease Control and Prevention (CDC):<br />
Behavioral risk Factor Surveillance System<br />
Survey Data (BRFSS). (2011). All states –<br />
2011: Cholesterol awareness. Retrieved from<br />
CDC website: http://apps.nccd.cdc.gov/<br />
BRFSS/page.asp?yr=2011&state=All&cat=C<br />
A#CA<br />
Centers for Disease Control and Prevention (CDC):<br />
Behavioral risk Factor Surveillance System<br />
Survey Data (BRFSS). (2011). Prevalence and<br />
trends data: Nationwide – 2010 Colorectal Cancer<br />
Screening. Retrieved from CDC website:<br />
http://apps.nccd.cdc.gov/brfss/display.asp<br />
?cat=CC&yr=2010&qkey=4424&state=UB<br />
Centers for Disease Control and Prevention (CDC):<br />
Behavioral risk Factor Surveillance System<br />
Survey Data (BRFSS). (2011). Prevalence and<br />
trends data: Nationwide – 2011 Health status.<br />
Retrieved from CDC website: http://apps.<br />
nccd.cdc.gov/BRFSS/display.asp?state=US<br />
&cat=HS&yr=2011&qkey=8001&grp=0&SU<br />
BMIT4=Go<br />
Centers for Disease Control and Prevention (CDC):<br />
Behavioral risk Factor Surveillance System<br />
Survey Data (BRFSS). (2011). Prevalence<br />
and trends data: Nationwide – 2011 Immunization.<br />
Retrieved from CDC website:<br />
http://apps.nccd.cdc.gov/brfss/page.<br />
asp?cat=IM&yr=2011&state=UB#IM<br />
Centers for Disease Control and Prevention (CDC):<br />
Behavioral risk Factor Surveillance System<br />
Survey Data (BRFSS). (2011). Prevalence and<br />
trends data: Nationwide – 2011 Injury. Retrieved<br />
from CDC website: http://apps.<br />
nccd.cdc.gov/brfss/display.asp?cat=IN&yr=<br />
2011&qkey=8331&state=UB<br />
Centers for Disease Control and Prevention (CDC):<br />
Behavioral risk Factor Surveillance System<br />
Survey Data (BRFSS). (2011). Prevalence and<br />
trends data: Nationwide – 2010 Prostate cancer.<br />
Retrieved from CDC website: http://apps.<br />
nccd.cdc.gov/brfss/display.asp?state=UB&<br />
cat=PC&yr=2010&qkey=4423&grp=0&SUB<br />
MIT4=Go<br />
Centers for Disease Control and Prevention (CDC):<br />
Behavioral risk Factor Surveillance System<br />
Survey Data (BRFSS). (2011). Prevalence and<br />
trends data: Nationwide – 2010 – Women’s<br />
health. Retrieved from CDC website: http://<br />
apps.nccd.cdc.gov/brfss/display.asp?state=<br />
UB&cat=WH&yr=2010&qkey=4426&grp=0<br />
&SUBMIT4=Go<br />
Centers for Disease Control and Prevention (CDC):<br />
Behavioral risk Factor Surveillance System<br />
Survey Data (BRFSS). (n.d.). Prevalence and<br />
trends data: <strong>Nevada</strong> – 2010 – Cardiovascular<br />
disease. Retrieved from CDC website: http://<br />
apps.nccd.cdc.gov/BRFSS/display.asp?cat=<br />
CV&yr=2010&qkey=5001&state=NV<br />
Centers for Disease Control and Prevention (CDC):<br />
Behavioral risk Factor Surveillance System<br />
Survey Data (BRFSS). (n.d.). Prevalence<br />
and trends data: <strong>Nevada</strong>-1996-2011-Tobacco<br />
use. Retrieved from CDC website:<br />
http://apps.nccd.cdc.gov/BRFSS/page.<br />
asp?cat=TU&yr=2011&state=NV#TU<br />
Centers for Disease Control and Prevention<br />
(CDC): Behavioral risk Factor Surveillance<br />
System Survey Data (BRFSS).<br />
(2011). Prevalence and trends data: Physical<br />
activity. Retrieved from CDC website:<br />
http://apps.nccd.cdc.gov/BRFSS/page.<br />
asp?cat=PA&yr=2011&state=UB#PA<br />
Centers for Disease Control and Prevention (CDC):<br />
Breast Cancer. (2012). Breast cancer rates by<br />
race and ethnicity. Retrieved from the CDC<br />
website: http://www.cdc.gov/cancer/<br />
breast/statistics/race.htm<br />
APPENDIX<br />
191
APPENDIX<br />
192<br />
Centers for Disease Control and Prevention (CDC):<br />
Division <strong>of</strong> STD Prevention. (2012, December).<br />
Sexually transmitted disease surveillance,<br />
2011. Retrieved from the CDC website:<br />
http://www.cdc.gov/std/stats11/Surv2011.<br />
pdf<br />
Centers for Disease Control and Prevention (CDC):<br />
Fact Sheet. (2011). STD trends in the United<br />
States: 2011 National data for Chlamydia, gonorrhea,<br />
and syphilis. Retrieved from the CDC<br />
website: http://www.cdc.gov/std/stats11/<br />
trends-2011.pdf<br />
Centers for Disease Control and Prevention (CDC):<br />
Health, United States, 2011. (2012). Table<br />
120: Nursing homes, beds, residents, and occupancy<br />
rates, by state: United States, selected<br />
years, 1995-2011. Retrieved from CDC website:<br />
http://www.cdc.gov/nchs/hus/contents2011.htm#120<br />
Centers for Disease Control and Prevention (CDC):<br />
Healthy Aging Report. (2009). The state <strong>of</strong><br />
aging and health in America report, 2008-2009:<br />
Compare indicators by location. Retrieved<br />
from CDC website: http://apps.nccd.cdc.<br />
gov/SAHA/Default/CompareReports.<br />
aspx?Compare=US&Parent=US<br />
Centers for Disease Control and Prevention (CDC):<br />
HIV/AIDS among Persons Age 50 and Older.<br />
(2008). CDC HIV/AIDS facts. Retrieved<br />
from CDC website: http://www.cdc.gov/<br />
hiv/topics/over50/resources/factsheets/<br />
pdf/over50.pdf<br />
Centers for Disease Control and Prevention (CDC):<br />
Home & Recreational Safety. (2012). Costs <strong>of</strong><br />
falls among older adults. Retrieved from CDC<br />
website: http://www.cdc.gov/HomeandRecreationalSafety/Falls/fallcost.html<br />
Centers for Disease Control and Prevention (CDC):<br />
Home & Recreational Safety. (2012). Falls<br />
among older adults: An overview. Retrieved<br />
from CDC website: http://www.cdc.gov/<br />
HomeandRecreationalSafety/Falls/adultfalls.html<br />
Centers for Disease Control and Prevention (CDC):<br />
Home & Recreational Safety. (2012). Falls in<br />
nursing homes. Retrieved from CDC website:<br />
http://www.cdc.gov/HomeandRecreationalSafety/Falls/nursing.html<br />
Centers for Disease Control and Prevention (CDC):<br />
Home & Recreational Safety. (2012). Hip fractures<br />
among older adults. Retrieved from CDC<br />
website: http://www.cdc.gov/HomeandRecreationalSafety/Falls/adulthipfx.html<br />
Centers for Disease Control and Prevention (CDC):<br />
Morbidity and Mortality Weekly Report<br />
(MMWR). (2012, January 27). Cancer screening<br />
– United States, 2010. Retrieved from<br />
CDC website: http://www.cdc.gov/<br />
mmwr/PDF/wk/mm6103.pdf<br />
Centers for Disease Control and Prevention (CDC):<br />
Morbidity and Mortality Weekly Report<br />
(MMWR). (2012, August 17). Prevention and<br />
control <strong>of</strong> influenza with vaccines: Re<strong>com</strong>mendations<br />
<strong>of</strong> the advisory <strong>com</strong>mittee on immunization<br />
practices (ACIP) – United States, 2012-<br />
2013 influenza season. Retrieved from CDC<br />
website: http://www.cdc.gov/mmwr/<br />
preview/mmwrhtml/mm6132a3.htm?s_<br />
cid=mm6132a3<br />
Center for Disease Control and Prevention (CDC):<br />
Morbidity and Mortality Weekly Report<br />
(MMWR). (2012, December 7). Quickstats:<br />
Drug-poisoning death rates – National vital<br />
statistics sytem, United States, 2010. Retrieved<br />
from CDC website: http://www.cdc.gov/<br />
mmwr/preview/mmwrhtml/mm6148a6.<br />
htm?s_cid=mm6148a6_e<br />
Centers for Disease Control and Prevention: National<br />
Center for Health Statistics. (n.d.).<br />
Health Indicators Warehouse. Retrieved from<br />
www.healthindicators.gov [1/7/13].<br />
Center for Disease Control and Prevention (CDC):<br />
National Center for HIV/AIDS, Viral Hepatitis,<br />
STDs, and TB Prevention. (2012). AIDS<br />
diagnoses. Retrieved from CDC website:<br />
http://gis.cdc.gov/GRASP/NCHHSTPAtlas/main.html<br />
Centers for Disease Control and Prevention (CDC):<br />
Overweight and Obesity. (2012). Defining<br />
overweight and obesity. Retrieved from CDC<br />
website: http://www.cdc.gov/obesity/<br />
adult/defining.html
Centers for Disease Control and Prevention (CDC):<br />
Physical Activity. (2011). How much physical<br />
activity do you older adults need? Retrieved<br />
from CDC website: http://www.cdc.gov/<br />
physicalactivity/everyone/guidelines/olderadults.html<br />
Centers for Disease Control and Prevention (CDC):<br />
Physical Activity. (2012). Facts about physical<br />
activity. Retrieved from CDC website:<br />
http://www.cdc.gov/physicalactivity/<br />
data/facts.html<br />
Centers for Disease Control and Prevention (CDC):<br />
Prostate Cancer. (2012). Prostate cancer rates<br />
by race and ethnicity. Retrieved from CDC<br />
website: http://www.cdc.gov/cancer/prostate/statistics/race.htm<br />
Centers for Disease Control and Prevention (CDC):<br />
Publications and Information Products.<br />
(2011). Health, United States, 2011: Updated,<br />
Table 79. Retrieved from CDC website:<br />
http://www.cdc.gov/nchs/hus/contents2011.htm#079<br />
Centers for Disease Control and Prevention (CDC):<br />
Seasonal Influenza (Flu). (2012). Fluzone<br />
high-dose seasonal influenza vaccine. Retrieved<br />
from CDC website: http://www.cdc.gov/<br />
flu/protect/vaccine/qa_fluzone.htm<br />
Centers for Disease Control and Prevention (CDC):<br />
Seasonal Influenza (Flu). (2012). What you<br />
should know and do this flu season if you are<br />
65 years and older. Retrieved from CDC<br />
website: http://www.cdc.gov/flu/about/<br />
disease/65over.htm<br />
Centers for Disease Control and Prevention (CDC):<br />
Smoking & Tobacco Use. (n.d.). State tobacco<br />
activities tracking and evaluation (STATE) system.<br />
Retrieved from CDC website: http://<br />
apps.nccd.cdc.gov/statesystem/InteractiveReport/InteractiveReports.aspx<br />
Centers for Disease Control and Prevention (CDC):<br />
Vaccines & Immunizations. (2012). Pneumococcal<br />
disease in-short. Retrieved from the<br />
CDC website: http://www.cdc.gov/vaccines/vpd-vac/pneumo/in-short-both.htm<br />
Centers for Disease Control and Prevention (CDC):<br />
Veterans’ Health Activities. (2010). Environmental<br />
health. Retrieved from the CDC website:<br />
http://www.cdc.gov/nceh/veterans/<br />
vet_hlth_actvy.pdf<br />
Centers for Disease Control and Prevention (CDC):<br />
Web-based Injury Statistics Query and Reporting<br />
System (WISQARS) [Online]. (2012).<br />
Fatal injury mapping. Retrieved from CDC<br />
website: http://wisqars.cdc.gov:8080/cdc-<br />
MapFramework/mapModuleInterface.jsp<br />
[2012, December, 23].<br />
Centers for Disease Control and Prevention (CDC):<br />
Web-based Injury Statistics Query and Reporting<br />
System (WISQARS) [Online]. (2012).<br />
Fatal injury mortality report, <strong>Nevada</strong>. Retrieved<br />
from CDC website: www.cdc.gov/<br />
ncipc/wisqars [2012, December, 23].<br />
Centers for Disease Control and Prevention (CDC):<br />
Web-based Injury Statistics Query and Reporting<br />
System (WISQARS) [Online]. (2012).<br />
10 Leading causes <strong>of</strong> death, <strong>Nevada</strong>: 2010, all<br />
races, both sexes. Retrieved from CDC website:<br />
www.cdc.gov/ncipc/wisqars [2012,<br />
December, 23].<br />
Centers for Disease Control and Prevention (CDC):<br />
Web-based Injury Statistics Query and Reporting<br />
System (WISQARS) [Online]. (2012).<br />
National suicide statistics at a glance. Retrieved<br />
from CDC website: http://www.cdc.gov/<br />
ViolencePrevention/suicide/statistics/leading_causes.html<br />
[2012, December, 23].<br />
Centers for Disease Control and Prevention (CDC):<br />
Web-based Injury Statistics Query and Reporting<br />
System (WISQARS) [Online]. (2010).<br />
United States, unintentional overall motor vehicle<br />
deaths and rates per 100,000. Retrieved<br />
from CDC website: www.cdc.gov/ncipc/<br />
wisqars [2012, December, 27].<br />
Centers for Medicare & Medicaid Services (CMS):<br />
Nursing Homes. (2010). Nursing home data<br />
<strong>com</strong>pendium: 2010 Edition. Retrieved from<br />
the CMS website: http://www.cms.gov/<br />
Medicare/Provider-Enrollment-and-Certification/CertificationandComplianc/Downloads/nursinghomedata<strong>com</strong>pendium_508.<br />
pdf<br />
APPENDIX<br />
193
APPENDIX<br />
Centers for Medicare & Medicaid Services (CMS):<br />
Health Expenditures. (2012). State provider:<br />
Health expenditures by state <strong>of</strong> provider, 1980-<br />
2009. Retrieved from CMS website: http://<br />
www.cms.gov/Research-Statistics-Dataand-Systems/Statistics-Trends-and-Reports/<br />
NationalHealthExpendData/Downloads/<br />
prov-tables.pdf<br />
Cherry, D., Lucas, C., and Decker, S. L. (2010, August).<br />
Population aging and the use <strong>of</strong> <strong>of</strong>ficebased<br />
physician services. CDC: National<br />
Center for Health Statistics, Data Brief #41. Retrieved<br />
from CDC website: http://www.cdc.<br />
gov/nchs/data/databriefs/db41.htm<br />
Coleman-Jensen, A., Nord, M., Andrews, M., and<br />
Carlson, S. (2011, September). Household<br />
food security in the United States in 2010.<br />
U.S. Department <strong>of</strong> Agriculture: Economic<br />
Research Service, Report Summary. Retrieved<br />
from U.S. Department o f Agriculture website:<br />
http://www.ers.usda.gov/publications/err-economic-research-report/err125.<br />
aspx<br />
Cropp, I. (2011, May 5). Why do hearing aids cost<br />
so much? American Association <strong>of</strong> Retired Persons<br />
(AARP). Retrieved from AARP website:<br />
http://www.aarp.org/health/conditionstreatments/info-05-2011/hearing-aids-cost.<br />
html<br />
Cullinane, P. (2006). Late-life civic <strong>eng</strong>agement enhances<br />
health for individuals and <strong>com</strong>munities.<br />
The Journal on Active Aging, 66-73.<br />
Cutler, D. M., & Lleras-Muney, A. (2007, March).<br />
Education and health. National Poverty Center:<br />
Policy Brief, #9. Retrieved from National<br />
Poverty Center website: http://www.npc.<br />
umich.edu/publications/policy_briefs/<br />
brief9/policy_brief9.pdf<br />
Dickinson, W. J., Potter, G. G., Hybels, C. F., Mc-<br />
Quoid, D. R., & Steffens, D. C. (2011).<br />
Change in stress and social support as predictors<br />
<strong>of</strong> cognitive decline in older adults<br />
with and without depression. International<br />
Journal <strong>of</strong> Geriatric Psychiatry, 26(12), 1267-<br />
1274.<br />
194<br />
Colliver, J. D., Compton, W. M., Gfroerer, J. C.,<br />
& Condon, T. (2006). Projecting drug use<br />
among aging baby boomers in 2030. Annals<br />
<strong>of</strong> Epidemiology. 16(4), 257–265.<br />
Congressional Budget Office (CBO). (2010, Oct).<br />
Potential costs <strong>of</strong> veterans’ health care. Retrieved<br />
from the CBO website: http://<br />
www.cbo.gov/sites/default/files/cb<strong>of</strong>iles/<br />
ftpdocs/118xx/doc11811/2010_10_7_vahealthcare.pdf<br />
Cornwell, E. Y., and Waite, L. J. (2012). Social network<br />
resources and management <strong>of</strong> hypertension.<br />
Journal <strong>of</strong> Health and Social Behavior.<br />
53, 215-231.<br />
Corporation for National & Community Service.<br />
(2011). Volunteering in <strong>Nevada</strong>. Retrieved from<br />
Volunteering in America website: http://<br />
www.volunteeringinamerica.gov/NV<br />
Crescioni, M., Gorina, Y., Bilheimer, L., & Gillum,<br />
R. F. (2010, April 21). Trends in health status<br />
and health care use among older men.<br />
Center for Disease Control: National Health<br />
Statistics Reports. Retrieved from CDC website:<br />
http://www.cdc.gov/nchs/data/nhsr/<br />
nhsr024.pdf<br />
Duncan, D. F., Nicholson, T., White, J. B., Bradley,<br />
D. B., and Bonaguro, J. (2010). The baby<br />
boomer effect: Changing patterns <strong>of</strong> substance<br />
abuse among adults age 55 and older.<br />
Journal <strong>of</strong> Aging & Social Policy, 22(3), 237-<br />
258.<br />
Durai, U. N. B., Chopra, M. P., Coakley, E., Llorente,<br />
M. D., Krichner, J. E., Cook, J. M., & Levk<strong>of</strong>f,<br />
S. E. (2011). Journal <strong>of</strong> the American Geriatrics<br />
Society, 59, 1087-1092.<br />
Dye, B. A., Li, X., and Thornton-Evans, G. (2012,<br />
August). Oral health disparities as determined<br />
by selected healthy people 2020 oral<br />
health objectives for the United States, 2009-<br />
2010. NCHS Data Brief, 104, Hyattsville, MD:<br />
National<br />
Center for Health Statistics. Retrieved from<br />
the CDC website: http://www.cdc.gov/<br />
nchs/data/databriefs/db104.pdf<br />
Echt, K. V. (2009). Presentation 4. Health literacy in<br />
aging: Processing health information (pp. 11-<br />
12). In C. Baur (Ed.). Improving health literacy<br />
for older adults: Expert panel report, 2009, U.S.<br />
Department <strong>of</strong> Health and Human Services. Retrieved<br />
from CDC website: http://www.cdc.<br />
gov/healthliteracy/pdf/olderadults.pdf
Effros, R., B., Fletcher, C. V., Gebo, K., et al. (2008).<br />
Workshop on HIV infection and aging: What<br />
is known and future research directions.<br />
Clinical Infectious Diseases, 47, 542-53.<br />
Fakhouri, T. H. I., Kit, B. K., & Ogden, C. L. (2012,<br />
October), Consumption <strong>of</strong> diet drinks in the<br />
United States, 2009-2010. U.S. Department <strong>of</strong><br />
Health and Human Services: National Center for<br />
Health Statistics, Brief No. 109. Retrieved from<br />
CDC website: http://www.cdc.gov/nchs/<br />
data/databriefs/db109.pdf<br />
Fakhouri, T. H. I., Ogden, C. L., Carroll, M. D., Kit,<br />
Brian K., & Flegal, K. M. (2012, September).<br />
Prevalence <strong>of</strong> obesity among older adults in<br />
the United States, 2007-2010. U.S. Department<br />
<strong>of</strong> Health and Human Services: National Center<br />
for Health Statistics, Brief No. 106. Retrieved<br />
from CDC website: http://www.cdc.gov/<br />
nchs/data/databriefs/db106.pdf<br />
Fargo, J., Metraux, S., Byrne, T., Munley, E., Montgomery,<br />
A. E., Jones, H., Sheldon, G., Kane,<br />
V., & Culhane, D. (2012). Prevalence and<br />
risk <strong>of</strong> homelessness among U.S. veterans.<br />
Preventing Chronic Disease: Public Health Research,<br />
Practice, and Policy, 9(110112), 1-9. Retrieved<br />
from the CDC website: http://www.<br />
cdc.gov/pcd/issues/2012/pdf/11_0112.pdf<br />
Federal Interagency Forum on Aging-Related Statistics.<br />
(2010, July). Older Americans 2010: Key<br />
indicators <strong>of</strong> well-being. Washington, D.C.:<br />
U.S. Government Printing Office.<br />
Federal Interagency Forum on Aging-Related Statistics.<br />
(2012, June). Older Americans 2012:<br />
Key indicators <strong>of</strong> well-being. Washington, D.C.:<br />
U.S. Government Printing Office.<br />
Feinberg, L., Reinhard, S. C., Houser, A., & Choula,<br />
R. (2011). Valuing the invaluable: 2011 Update,<br />
the growing contributions and costs <strong>of</strong><br />
family caregiving. AARP Public Policy Institute:<br />
Insight on the Issues. Retrieved from the<br />
AARP website: http://www.aarp.org/relationships/caregiving/info-07-2011/valuingthe-invaluable.html<br />
Garner, D. L., Wakefield, M. A., Tyler, T. G., Samuels,<br />
A. D., & Cleveland, R. (2012). Healthcare<br />
access and insurance availability in <strong>Nevada</strong>.<br />
In D. Shalin (Ed.), The social health <strong>of</strong> <strong>Nevada</strong>:<br />
Leading indicators and quality <strong>of</strong> life in the silver<br />
state. Las Vegas, NV: UNLV Center for<br />
Democratic Culture. Retrieved from CDCLV<br />
website: http://cdclv.unlv.edu/healthnv_2012/healthaccess.pdf<br />
Geyer, S., Hemstrom, O., Peter, R., & Vagero, D.<br />
(2006). Education, in<strong>com</strong>e, and occupational<br />
class cannot be used interchangeably in<br />
social epidemiology. Empirical evidence<br />
against a <strong>com</strong>mon practice. Journal <strong>of</strong> Epidemiology<br />
and Community Health, 60, 804-810.<br />
Golding, H. L. (2011, July 27). Testimony: Potential<br />
costs <strong>of</strong> health care for veterans <strong>of</strong> reent and<br />
ongoing U.S. Military operations. Congressional<br />
Budget Office (CBO). Retrieved from<br />
the CBO website: http://www.cbo.gov/<br />
sites/default/files/cb<strong>of</strong>iles/ftpdocs/123xx/<br />
doc12315/07-27-va_healthcare.pdf<br />
Gould, E. (2008). Growing disparities in life expectancy.<br />
Economic policy institute: Research and<br />
ideas for shared prosperity. Retrieved from<br />
Economic Policy Institute website: http://<br />
www.epi.org/content.cfm/webfeatures_<br />
snapshots_20080716<br />
Grants Management Unit. (2012, May). Statewide<br />
needs survey. <strong>Nevada</strong> Department <strong>of</strong> Health<br />
and Human Services (NVDHHS). Retrieved<br />
from NVDHHS website: http://dhhs.<br />
nv.gov/grants/Documents/2012Statewid<br />
eNeedsAssessment/GMACNeedsAssessment2012.pdf<br />
Griffin, L. I. (2004). Older driver involvement in<br />
injury crashes in Texas, 1975-1999. AAA<br />
Foundation for Traffic Safety. Retrieved from<br />
AAA website: http://www.aaafoundation.<br />
org/pdf/OlderDriverInvolvementInInjury-<br />
Crashes.pdf<br />
Griswold, M. T., & Packham, J. (2011, February). <strong>Nevada</strong><br />
rural and frontier health data book – 2011<br />
edition. Reno, NV: <strong>Nevada</strong> State Office <strong>of</strong><br />
Rural Health.<br />
APPENDIX<br />
195
APPENDIX<br />
Hardcastle, J. (2010, October 11). 2010 Population<br />
projections. <strong>University</strong> <strong>of</strong> <strong>Nevada</strong>, Reno: The<br />
Business Services Group, <strong>Nevada</strong> State Demographer.<br />
Retrieved from http://nvdemography.org/featured-articles/235/<br />
Hardcastle, J. (2011). <strong>Nevada</strong> county population<br />
projections 2010 to 2030. Retrieved from<br />
http://nvdemography.org/wp-content/<br />
uploads/2010/10/2010-to-2030-Population-<br />
Projections-Report-REVISED-102610.pdf<br />
HealthCare.gov. (2012). How the health care law is<br />
making a difference for the people <strong>of</strong> <strong>Nevada</strong>.<br />
Retrieved from www.healthcare.gov/law/<br />
resources/nv.html<br />
Hoefer, M., Rytina, N., & Baker, B. C. (2010, January).<br />
Estimates <strong>of</strong> the unauthorized immigrant<br />
population residing in the United<br />
States: January 2009. Homeland Security: Office<br />
<strong>of</strong> Immigration Statistics Policy Directorate.<br />
Retrieved from DHS website: http://www.<br />
dhs.gov/xlibrary/assets/statistics/publications/ois_ill_pe_2009.pdf<br />
Houser, A., & Gibson, M. J. (2007, Nov). Valuing<br />
the invaluable: A new look at state estimates<br />
<strong>of</strong> the economic value <strong>of</strong> family caregiving<br />
(Data update). AARP Public Policy Institute:<br />
Insight on the Issues, 1-8. Retrieved from the<br />
AARP website: http://assets.aarp.org/rgcenter/il/dd158r_caregiving.pdf<br />
196<br />
Health Policy Explained. (n.d.) Military and veteran’s<br />
healthcare. www.kaiseredu.org. Retrieved<br />
from Kaiser Education website:<br />
http://www.kaiseredu.org/Issue-Modules/<br />
Military-and-Veterans-Health-Care/Background-Brief.aspx<br />
HealthyPeople.gov. (2012). Cancer: Objectives.<br />
Retrieved from the Healthy People 2020<br />
website: http://healthypeople.gov/2020/<br />
topicsobjectives2020/objectiveslist.<br />
aspx?topicId=5<br />
HealthyPeople.gov. (2012). Nutrition, physical activity,<br />
and obesity: Latest data – obesity in adults.<br />
Retrieved from Healthy People website:<br />
http://healthypeople.gov/2020/LHI/nutrition.aspx?tab=data<br />
Hearing Loss Association <strong>of</strong> America. (2012). Medicaid<br />
regulations. Retrieved from http://www.<br />
hearingloss.org/content/medicaid-regulations<br />
Henry J. Kaiser Family Foundation: State Health<br />
Facts. (2012). <strong>Nevada</strong>: Health expenditures by<br />
state <strong>of</strong> residence. Retrieved from www.statehealthfacts.org:<br />
http://www.statehealthfacts.org/pr<strong>of</strong>ileind.jsp?cat=5&sub=143&rgn<br />
=30&cmprgn=1<br />
Henry J. Kaiser Family Foundation: State Health<br />
Facts. (2012). <strong>Nevada</strong> health insurance status.<br />
Retrieved from www.statehealthfacts.org:<br />
http://www.statehealthfacts.org/pr<strong>of</strong>ileind.<br />
jsp?cat=3&sub=39&rgn=30<br />
Houser, A., & Gibson, M. J. (2008, Nov). Valuing the<br />
invaluable: The economic value <strong>of</strong> family<br />
caregiving, 2008 Update. AARP Public Policy<br />
Institute: Insight on the Issues, 1-8. Retrieved<br />
from the AARP website: http://assets.aarp.<br />
org/rgcenter/il/i13_caregiving.pdf<br />
Hoyert, D. L., & Xu, J. (2012, October). Deaths: Preliminary<br />
data for 2011. National Vital Statistics<br />
Reports, 61(6). Retrieved from CDC website:<br />
http://www.cdc.gov/nchs/data/nvsr/<br />
nvsr61/nvsr61_06.pdf<br />
Ihrke, D. K., Faber, C. S., & Koerber, W. K. (2011).<br />
Geographical mobility: 2008 to 2009. U.S.<br />
Census Bureau. Retrieved from Census Bureau<br />
website: http://www.census.gov/<br />
prod/2011pubs/p20-565.pdf<br />
Institute <strong>of</strong> Medicine <strong>of</strong> the National Academies.<br />
(2012, July). The mental health and substance<br />
use workforce for older adults: In whose hands?<br />
Retrieved from Institute <strong>of</strong> Medicine website:<br />
http://www.iom.edu/Reports/2012/<br />
The-Mental-Health-and-Substance-Use-<br />
Workforce-for-Older-Adults.aspx<br />
International Federation <strong>of</strong> Pharmaceutical Manufacturers<br />
& Associations (IFPMA). (2012).<br />
Morbidity and mortality. Retrieved from<br />
IFPMA website: http://www.ifpma.org/<br />
resources/influenza-vaccines/seasonal-influenza/morbidity-and-mortality.html
Jourdan, K. (2012, July 17). Clark county moves<br />
forward on creating veterans court. Las<br />
Vegas Review-Journal. Retrieved from LVRJ<br />
website: http://www.lvrj.<strong>com</strong>/news/clarkcounty-moves-forward-to-create-veteranscourt-162793086.html<br />
Juretic, M., Hill, R., Luptak, M., Rupper, R., Bair, B.<br />
Floyd, J., Westfield, B., & Daily, N. K. (2010).<br />
Reaching out to older veterans in need: the<br />
Elko clinic demonstration project. The Journal<br />
<strong>of</strong> Rural Health, 26(4), 325-332.<br />
Kaiser <strong>com</strong>mission on Key Facts: Medicaid and the<br />
Uninsured. (2010, February). Medicaid financial<br />
eligibility: Primary pathways for the elderly<br />
and people with disabilities. Retrieved from the<br />
H. J. Kaiser website: http://www.kff.org/<br />
medicaid/upload/8048.pdf<br />
Karpiak, S. (2011, June). The <strong>com</strong>plications <strong>of</strong> success:<br />
The aging <strong>of</strong> HIV population. In D. Nelson,<br />
Positive aging: HIV turns 30. Webinar conducted<br />
by the Administration on Aging’s<br />
Health, Prevention, and Wellness Program.<br />
Retrieved from AOA website: http://www.<br />
aoa.gov/AoARoot/AoA_Programs/HPW/<br />
HIV_AIDS/Webinar.aspx<br />
Kessler, R. C., Hwang, I., LaBrie, R., Petukhova, M.,<br />
Sampson, N. A., Winters, K. C., & Shaffer, H.<br />
J. (2008). DSM-IV pathological gambling in<br />
the national <strong>com</strong>orbidity survey replication.<br />
Psychological Medicine, 38(9), 1351-1360.<br />
Klein, W. C., & Jess, C. (2002). One last pleasure? Alcohol<br />
use among elderly people in nursing<br />
homes. Health & Social Work, 27(3), 193-203.<br />
Kliff, S. (2013, Jan. 3). Plans for health insurance<br />
exchanges approved by White House for<br />
seven more states. Washington Post Online.<br />
Retrieved from www.washingtonpost.<br />
<strong>com</strong>: http://www.washingtonpost.<strong>com</strong>/<br />
national/health-science/plans-for-healthinsurance-exchanges-approved-by-whitehouse-for-seven-more-states/2013/01/03/2<br />
eb43128-55e9-11e2-8b9e-dd8773594efc_story.<br />
html?wpisrc=nl_headlines<br />
Leach, C. R., Schoenbery, N. E. (2007, October). The<br />
vicious cycle <strong>of</strong> inadequate early detection:<br />
A <strong>com</strong>plementary study on barriers to cervical<br />
cancer screening among middle-aged<br />
and older women. Preventing Chronic Disease:<br />
Public Health Research, Practice, and Policy,<br />
4(4), 1-12. Retrieved from the CDC website:<br />
http://www.cdc.gov/pcd/issues/2007/<br />
oct/pdf/06_0189.pdf<br />
Levy, B. R., Ding, L., Lakra, D., Kosteas, J., and<br />
Niccolai, L. (2007). Older persons’ exclusion<br />
from sexually transmitted disease riskreduction<br />
clinical trials. Sexually Transmitted<br />
Diseases, 34(8), 541-544. DOI: 10.1097/01.<br />
olq.0000253342.75908.05.<br />
Lin, F. R., & Ferrucci, L. (2012). Hearing loss and<br />
falls among older adults in the United<br />
States. Archives <strong>of</strong> Internal Medicine, 172(4),<br />
369-370. Retrieved from The JAMA Network:<br />
http://0-archinte.jamanetwork.<strong>com</strong>.<br />
innopac.library.unr.edu/Issue.aspx?journali<br />
d=71&issueID=22609&direction=P<br />
Mackun, P., Wilson, S., Fischetti, T., & Goworowska,<br />
J. (2011, March). Population distribution and<br />
change: 2000 to 2010: 2010 census briefs.<br />
U.S. Census Bureau. Retrieved from Census<br />
Bureau website: http://www.census.gov/<br />
prod/cen2010/briefs/c2010br-01.pdf<br />
Martin, A. B., Lassman, D., Washington, B., Catlin,<br />
A., & the National Health Expenditure Accounts<br />
Team. (2012). Growth in U.S. health<br />
spending remained slow in 2010: Health<br />
share <strong>of</strong> gross domestic product was unchanged<br />
from 2009. Health Affairs, 31(1),<br />
208-219. Retrieved from the Kaiseredu.<br />
org: http://content.healthaffairs.org/content/31/1/208.full.pdf+html<br />
Martinez, I. L., Crooks, D., Kim, K. S., & Tanner, E.<br />
(2011). Invisible civic <strong>eng</strong>agement among<br />
older adults: Valuing the contributions <strong>of</strong> informal<br />
volunteering. Journal <strong>of</strong> Cross Cultural<br />
Gerontology, 26, 23-37.<br />
McDonald, M. (2011). United States election project:<br />
2008 General election turnout rates. Retrieved<br />
from http://elections.gmu.edu/<br />
Turnout_2008G.html<br />
APPENDIX<br />
197
APPENDIX<br />
198<br />
McDonald, M. (2011). United States election project:<br />
2010 General election turnout rates. Retrieved<br />
from http://elections.gmu.edu/<br />
Turnout_2010G.html<br />
McIntosh, J. L. (for the American Association <strong>of</strong><br />
Suicidology). (2012). U.S.A. suicide: 2009 <strong>of</strong>ficial<br />
final data. Washington, DC: American<br />
Association <strong>of</strong> Suicidology, dated January<br />
12, 2012. Retrieved from http://www.suicidology.org.<br />
McIntosh, J. L., & Drapeau, C. W. (for the American<br />
Association <strong>of</strong> Suicidology). (2012). U.S.A.<br />
suicide 2010: Official final data. Washington,<br />
DC: American Association <strong>of</strong> Suicidology,<br />
dated September 20, 2012. Retrieved from<br />
http://www.suicidology.org<br />
Menninger, J. A. (2002). Assessment and treatment<br />
<strong>of</strong> alcoholism and substance-related disorders<br />
in the elderly. Bulletin <strong>of</strong> the Menninger<br />
Clinic, 66(2), 166–183.<br />
MetLife Mature Market Institute. (2011, Oct). Market<br />
survey <strong>of</strong> long-term care costs: The 2011 metlife<br />
market survey <strong>of</strong> nursing home, assisted living,<br />
adult day services, and home care costs. Retrieved<br />
from MetLife website: https://www.metlife.<br />
<strong>com</strong>/assets/cao/mmi/publications/studies/2011/mmi-market-survey-nursing-homeassisted-living-adult-day-services-costs.pdf<br />
Miller, R. (2012). Voter registration statistics. <strong>Nevada</strong><br />
Secretary <strong>of</strong> State: Ross Miller. Retrieved<br />
from http://www.nvsos.gov/index.<br />
aspx?page=1190<br />
Mykyta, L., & Macartney, S. (2012, June). Sharing a<br />
household: Household <strong>com</strong>position and economic<br />
well-being: 2007-2010. Current Population<br />
Report, P60-242.<br />
National Alliance for Caregiving & AARP. (2009,<br />
Nov). Caregiving in the U.S. 2009. Retrieved<br />
from the NAC website: http://www.caregiving.org/pdf/research/Caregiving_in_<br />
the_US_2009_full_report.pdf<br />
National Alliance on Mental Illness (NAMI).<br />
(2011, November). State mental health<br />
cuts: The continuing crisis. Retrieved from<br />
NAMI website: http://www.nami.org/<br />
ContentManagement/ContentDisplay.<br />
cfm?ContentFileID=147763<br />
National Center for Education Statistics (NCES):<br />
Institute <strong>of</strong> Education Sciences. (2011, July).<br />
Table 12: Percentage <strong>of</strong> persons age 25 and over<br />
with high school <strong>com</strong>pletion or higher and a<br />
bachelor’s or higher degree, by race/ethnicity and<br />
state: 2007-2009. Retrieved from NCES website:<br />
http://nces.ed.gov/programs/digest/<br />
d11/tables/dt11_012.asp<br />
National Center for Environmental Health: Division<br />
<strong>of</strong> Laboratory Sciences. (2012). Second<br />
national report on biochemical indicators<br />
<strong>of</strong> diet and nutrition in the U.S. population.<br />
Centers for Disease Control and Prevention. Retrieved<br />
from CDC website: http://www.cdc.<br />
gov/nutritionreport/<br />
National Center for Environmental Health: Division<br />
<strong>of</strong> Laboratory Sciences. (2012). Second<br />
national report on biochemical indicators <strong>of</strong><br />
diet and nutrition in the U.S. population: Executive<br />
summary. Centers for Disease Control<br />
and Prevention. Retrieved from CDC website:<br />
http://www.cdc.gov/nutritionreport/pdf/<br />
ExeSummary_Web_032612.pdf#zoom=100<br />
National Center for Frontier Communities (NCFC).<br />
(2012). Retrieved from http://www.frontierus.org/defining.php<br />
National Center for Responsible Gaming: Advancing<br />
Research, Education and Awareness<br />
(NCRG). (2009-2011). Gambling disorders<br />
360°: Exploring the latest news, issues and<br />
research relating to gambling disorders and responsible<br />
gaming. Retrieved from NCRG website:<br />
http://blog.ncrg.org/issues-insights/<br />
redefining-pathological-gambling-ne-research-highlights<br />
National Conference on Citizenship. (2011). 2011 Issue<br />
brief: Civic health and unemployment – Can<br />
<strong>eng</strong>agement str<strong>eng</strong>then the economy? Retrieved<br />
from http://ncoc.net/unemployment<br />
National Council on Aging (NCOA). (2012). United<br />
states <strong>of</strong> aging. Retrieved from NCOA website:<br />
http://www.ncoa.org/assets/files/<br />
pdf/united-states-<strong>of</strong>-aging/2012-survey/8-<br />
3-12-US-<strong>of</strong>-Aging-Survey-Fact-Sheet-National-FINAL.pdf
National Highway Traffic Safety Administration<br />
(NHTSA). (2008). Occupant protection<br />
issues among older drivers and pass<strong>eng</strong>ers:<br />
Volume II appendices. Retrieved from<br />
NHTSA website: http://www.nhtsa.gov/<br />
search?q=older+adults&x=0&y=0<br />
National Highway Traffic Safety Administration<br />
(NHTSA): Traffic Tech. (2012, March). Agerelated<br />
functional limitations, countermeasures,<br />
and crash risks. Retrieved from NTHSA<br />
website: www.nhtsa.gov/staticfiles/traffic_tech/811596.pdf<br />
National Institute on Drug Abuse (NIDA): Topics in<br />
Brief. (2011, April). Substance abuse among the<br />
military, veterans, and their families: A research<br />
update form the national institute on drug abuse.<br />
Retrieved from the NIDA website: http://<br />
www.drugabuse.gov/sites/default/files/<br />
veterans.pdf<br />
National Institute <strong>of</strong> Health (NIH): National Eye<br />
Institute. (2012). Prevalence <strong>of</strong> adult vision impairment<br />
and age-related eye diseases in America:<br />
Estimated number <strong>of</strong> cases by vision problem<br />
age >/= 40. Retrieved from NIH website:<br />
http://www.nei.nih.gov/eyedata/adultvision_usa.asp<br />
National Institute <strong>of</strong> Health (NIH): National Institute<br />
on Aging (NIA). (n.d.). Go4Life: Get<br />
started. Retrieved from NIH website: http://<br />
go4life.nia.nih.gov/get-started<br />
<strong>Nevada</strong> Aging and Disability Services Division<br />
(ADSD). (2012). SB129 elder abuse training<br />
presentation. Retrieved from ADSD website:<br />
http://nvaging.net/<br />
<strong>Nevada</strong> Aging and Disability Services Division<br />
(ADSD): Elder Protective Services (EPS).<br />
(2012). Caseload statistics. Retrieved from<br />
ADSD website: http://nvaging.net/CaseloadStatistics-EPS.pdf<br />
<strong>Nevada</strong> Aging and Disability Services Division<br />
(ADSD): Appendix J: 2011 Survey <strong>of</strong> seniors<br />
and citizens with disabilities. Retrieved from<br />
the ADSD website: http://nvaging.net/<br />
sp/2012-2016/AppendixJ2011Survey<strong>of</strong>SeniorsandPersonswithDisabilities.pdf<br />
<strong>Nevada</strong> Council on Problem Gambling (NCPG).<br />
(2007). Seniors and gambling. Retrieved from<br />
NCPG website: http://www.nevadacouncil.<br />
org/seniors.php?bi=1182880971<br />
<strong>Nevada</strong> Council on Problem Gambling. (2012).<br />
FAQ: Problem Gamblers. Retrieved<br />
from NCGP website: http://www.<br />
ncpgambling.org/i4a/pages/index.<br />
cfm?pageid=3390#widespread<br />
<strong>Nevada</strong> Department <strong>of</strong> Health and Human Services<br />
(2011). Five Year Strategic Plan for Problem<br />
Gambling Treatment Services Within the State<br />
<strong>of</strong> <strong>Nevada</strong>: Fiscal Years 2012 - 2016. Carson<br />
City, NV: <strong>Nevada</strong> DHHS.<br />
APPENDIX<br />
National Institute <strong>of</strong> Health: National Institute on<br />
Deafness and Other Communication Disorders.<br />
(2012). Hearing loss and older adults.<br />
Retrieved from NIH website: http://www.<br />
nidcd.nih.gov/health/hearing/pages/older.<br />
aspx<br />
National Institute <strong>of</strong> Mental Health (NIMH). (n.d.).<br />
Older adults and mental health: Depression. Retrieved<br />
from NIMH website: http://www.<br />
nimh.nih.gov/health/topics/older-adultsand-mental-health/index.shtml<br />
National Resource Center for Participant-Directed<br />
Services. (n.d.). Find a program: <strong>Nevada</strong>. Retrieved<br />
from Boston College website: http://<br />
web.bc.edu/libtools/insights-publications.<br />
php?state=38<br />
<strong>Nevada</strong> Department <strong>of</strong> Health and Human Services:<br />
Grants Management Advisory Committee<br />
(GMAC). (2012, May). Statewide needs<br />
survey. Retrieved from NVDHHS website:<br />
http://dhhs.nv.gov/Grants/<br />
<strong>Nevada</strong> Department <strong>of</strong> Public Safety (NVDPS): Office<br />
<strong>of</strong> Traffic Safety. (2011). Highway safety<br />
plan: Fiscal year 2012. Retrieved from NVDPS<br />
website: http://ots.state.nv.us/Docs/HSP_<br />
FINAL.pdf<br />
<strong>Nevada</strong> Department <strong>of</strong> Transportation (NDOT):<br />
Projects and Programs. (2012). American<br />
recovery and reinvestment act – Overview.<br />
Retrieved from NDOT website:<br />
http://www.nevadadot.<strong>com</strong>/Content.<br />
aspx?id=1922&terms=American%20Recovery%20Act<br />
199
APPENDIX<br />
<strong>Nevada</strong> Legislature: The People’s Branch <strong>of</strong> Government.<br />
(2012). <strong>Nevada</strong> facts and state emblems.<br />
Retrieved from the NV Legislature<br />
website: http://leg.state.nv.us/General/<br />
NVFacts/index.cfm<br />
<strong>Nevada</strong> Office <strong>of</strong> Veterans Services. (2012). NSVH<br />
admissions. Retrieved from NV Office <strong>of</strong><br />
Veterans website: http://www.veterans.<br />
nv.gov/NSVH_admissions.html<br />
<strong>Nevada</strong> Office <strong>of</strong> Veterans Services. (2012, June 21).<br />
<strong>Nevada</strong> veterans services <strong>com</strong>mission quarterly<br />
meeting, June 21, 2012 at 0930 hours.<br />
<strong>Nevada</strong> State Health Division. (2012). Central Cancer<br />
Registry. Data and analysis provided by the<br />
Bureau <strong>of</strong> Health Statistics, Planning, Epidemiology<br />
and Response.<br />
<strong>Nevada</strong> Veterans Services Commission Quarterly<br />
Report (Section V). (2012, June). Veterans<br />
court: Legislative <strong>com</strong>mittee on senior citizens,<br />
veterans, and adults with special needs.<br />
Office <strong>of</strong> Management and Budget. (n.d.). Table<br />
4.1 – Outlays by agency: 1962-2017. Retrieved<br />
from OMB website: http://www.whitehouse.gov/omb/budget/Historicals<br />
Office <strong>of</strong> Management and Budget (OMB): 2010<br />
Standards for delineating metropolitan and<br />
micropolitan statistical areas; Notice. (2010,<br />
June 28). Federal Register, 75(123), 37245-<br />
29052<br />
Office <strong>of</strong> Management and Budget (OMB). (2012).<br />
Budget <strong>of</strong> the U.S. government: FY 2013 Summary<br />
tables. Retrieved from OMB website:<br />
http://www.whitehouse.gov/sites/default/files/omb/budget/fy2013/assets/<br />
budget.pdf<br />
Office <strong>of</strong> National Drug Control Policy (ONDCP).<br />
(2012). <strong>Nevada</strong> drug control update. Retrieved<br />
from ONDCP website: http://www.whitehouse.gov/sites/default/files/docs/state_<br />
pr<strong>of</strong>ile_-_nevada.pdf<br />
Office <strong>of</strong> Public Health Informatics and Epidemiology.<br />
<strong>Nevada</strong> State Health Division. (2011).<br />
Electronic death registry system. [unpublished<br />
data.]. Carson City <strong>Nevada</strong>: Department <strong>of</strong><br />
Health and Human Services.<br />
Ogden, C. L., Lamb, M. M., Carroll, M. D., & Flegal,<br />
K. M. (2010, December). Obesity and socioeconomic<br />
status in adults: United States,<br />
2005-2008. U.S. Department <strong>of</strong> Health and<br />
Human Services: National Center for Health<br />
Statistics, Brief No. 50. Retrieved from CDC<br />
website: http://www.cdc.gov/nchs/data/<br />
databriefs/db50.pdf<br />
Ogden, C. L., Carroll, M. D., Kit, B. K., & Flegal, K.<br />
M. (2012, January). Prevalence <strong>of</strong> obesity in<br />
the United States, 2009-2010. U.S. Department<br />
<strong>of</strong> Health and Human Services: National Center<br />
for Health Statistics, Brief No. 82. Retrieved<br />
from CDC website: http://www.cdc.gov/<br />
nchs/data/databriefs/db82.pdf<br />
Organization for Economic Co-operation and Development<br />
(OECD): Briefing Note. (2012).<br />
OECD health data 2012: How does the United<br />
States <strong>com</strong>pare? Retrieved from the OECD<br />
website: http://www.oecd.org/unitedstates/BriefingNoteUSA2012.pdf<br />
Organization for Economic Co-operation and Development<br />
(OECD): Health Policies and<br />
Data. (2012). OECD health data 2012: Frequently<br />
requested data. Retrieved from the<br />
OECD website: http://www.oecd.org/els/<br />
healthpoliciesanddata/oecdhealthdata2012-<br />
frequentlyrequesteddata.htm<br />
Organization for Economic Co-operation and<br />
Development (OECD): Health Statistics<br />
(database). (2012). OECD health data:<br />
Health status.<br />
doi: 10.1787/data-00540-en. Retrieved on<br />
July 16, 2012 from OECD website: http://<br />
stats.oecd.org/BrandedView.aspx?oecd_bv_<br />
id=health-data-en&doi=data-00540-en<br />
Ortiz Gustafson, C., & Ouellette, J. (2011). <strong>Nevada</strong><br />
early intervention services: Rural and frontier<br />
regional rate study. Retrieved from http://<br />
health.nv.gov/PDFs/New/EI_RuralFrontier_v5.pdf<br />
Owsley, C. (2004). Visual information capabilities <strong>of</strong><br />
older drivers. NHTSA workshop on headlamp<br />
safety metrics: Balancing visibility and<br />
glare, Birmingham, Alabama.<br />
200
Passel, J., & Cohn, D. (2011, February 1). Unauthorized<br />
immigrant population: National and<br />
state trends, 2010. Pew Research Center: Pew<br />
Hispanic Center. Retrieved from PEW website:<br />
http://www.pewhispanic.org/files/<br />
reports/133.pdf<br />
Passel, J., Cohn, D., & Gonzalez-Barrera, A. (2012,<br />
April 23). Net migration from Mexico falls to<br />
zero – and perhaps less. Pew Research Center:<br />
Pew Hispanic Center. Retrieved from PEW<br />
website: http://www.pewhispanic.org/<br />
files/2012/04/Mexican-migrants-report_final.pdf<br />
Ritch, L. J., & Thompson, J. L. (2012). Suicide<br />
mortality in <strong>Nevada</strong>’s military veterans,<br />
2008-2010. <strong>Nevada</strong> State Health Division.<br />
Retrieved from NV State Health Division<br />
website: http://health.nv.gov/Publications/2008-2010_Suicide_<strong>Nevada</strong>_Veterans.<br />
pdf<br />
Roger, V. L., et al. (2012). Heart disease and stroke<br />
statistics: 2012 Update, A report from the<br />
American Heart Association. Circulation, 125,<br />
e2-e220. doi: 10.1161/CIR.0b013e31823ac046.<br />
Retrieved from http://circ.ahajournals.org/<br />
content/125/1/e2.full.pdf+html<br />
APPENDIX<br />
Performance Analysis Division. (2011). State <strong>of</strong> <strong>Nevada</strong><br />
transportation: 2011 Facts and figures. Retrieved<br />
from NDOT website: http://www.<br />
nevadadot.<strong>com</strong>/uploadedFiles/NDOT/<br />
About_NDOT/NDOT_Divisions/Planning/<br />
Performance_Analysis/Fact%20Book%20<br />
2011%20Final(1).pdf<br />
Perry, M. J., Mackun, P. J., Baker, J. D., Joyce, C. D.,<br />
Lollock, L. R., & Pearson, L. S. (2001). Population<br />
change and distribution: Census 2000<br />
brief. U.S. Census Bureau. Retrieved from<br />
Census Bureau website: http://www.census.gov/prod/2001pubs/c2kbr01-2.pdf<br />
Pew Research Center: The Databank. (2012). 10,000<br />
– Baby boomers retire. Retrieved from PEW<br />
website: http://pewresearch.org/databank/<br />
dailynumber/?NumberID=1150<br />
Qato, D. M., Alexander, G. C., Conti, R. M., Johnson,<br />
M., Schumm, P., and Tessler, S. (2008). Use <strong>of</strong><br />
prescription and over-the-counter medications<br />
and dietary supplements among older<br />
adults in the United States. Journal <strong>of</strong> the<br />
American Medical Association, 300(24), 2867-<br />
2878. Doi: 10.1001/jama.2008.892. Retrieved<br />
from the NIH website: http://www.ncbi.<br />
nlm.nih.gov/pmc/articles/PMC2702513/<br />
pdf/nihms84868.pdf<br />
Reid, H. (n.d.). Issues. United States Senator for <strong>Nevada</strong>:<br />
Harry Reid. Retrieved from http://www.reid.<br />
senate.gov/issues/transportation.cfm/<br />
Rintamaki, L. S., Weaver, F. M., Elbaum, P. L.,<br />
Klama, E. N., & Miskevics, S. A. (2009).<br />
Persistence <strong>of</strong> traumatic memories in World<br />
War II prisoners <strong>of</strong> war. Journal <strong>of</strong> the American<br />
Geriatrics Society, 57(12), 2257-2262.<br />
Rosalynn Carter Institute (RCI). (2010). Averting the<br />
caregiving crisis: Why we must act now. Retrieved<br />
from the RCI website: http://www.<br />
rosalynncarter.org/UserFiles/File/RCI_Position_Paper100310_Final.pdf<br />
Sandoval, B., Willden, M.J., & O’Mara, L. G. (2011,<br />
May 23). <strong>Nevada</strong>’s state health information<br />
technology strategic and operational plan.<br />
Office <strong>of</strong> the national coordinator for health information<br />
technology.<br />
Sanford Center for Aging. (2009). Elders count <strong>Nevada</strong>:<br />
Key health indicators for <strong>Nevada</strong>’s elders.<br />
<strong>University</strong> <strong>of</strong> <strong>Nevada</strong>, Reno.<br />
Sayer, N., Scholten, J., Scott, S., & Hall, C. (2012,<br />
April). Polytrauma & blast-related injuries.<br />
VA Office <strong>of</strong> Research and Development, Health<br />
Services Research and Development Service:<br />
QUERI Fact Sheet. Retrieved from VA website:<br />
http://www.queri.research.va.gov/<br />
about/factsheets/polytrauma_factsheet.pdf<br />
Schrank, D., Lomax, T., and Eisele, B. (2011, September).<br />
TTI’s 2011 urban mobility report:<br />
Powered by INRIX traffic data. Texas Transportation<br />
Institute: The Texas A&M <strong>University</strong><br />
System. Retrieved from http://tti.tamu.edu/<br />
documents/mobility-report-2011.pdf<br />
Smith (2011). Assembly concurrent resolution no.<br />
10. Legislative Committee on Health Care.<br />
Smith, S. K., & Ahmed, B. (1990). A demographic<br />
analysis <strong>of</strong> the population growth <strong>of</strong> states,<br />
1950-1980. Journal <strong>of</strong> Regional Science, 30(2),<br />
209-227.<br />
201
APPENDIX<br />
Staplin, L., Lococo, K. H., Stewart, J., & Decina,<br />
L. E. (1999). Safe mobility for older people<br />
notebook. Office <strong>of</strong> Research and Traffic Records,<br />
National Highway Traffic Safety Administration,<br />
DOT HS 808853. Retrieved from<br />
National Highway Traffic Safety website:<br />
http://www.nhtsa.gov/people/injury/olddrive/safe/tech-doc.htm<br />
State <strong>of</strong> <strong>Nevada</strong> Official Website: Cooperative libraries<br />
automated network. (2008). A history<br />
<strong>of</strong> <strong>Nevada</strong>. Retrieved from http://www.clan.<br />
lib.nv.us/content.asp?id=1.<br />
Stitt, B. G., Giacopassi, D., & Nichols, M. (2003).<br />
Gambling among older adults: A <strong>com</strong>parative<br />
analysis. Experimental Aging Research, 29,<br />
189-203.<br />
Substance Abuse and Mental Health Services Administration<br />
(SAMHSA). (n.d.). Co-occurring<br />
disorder-related quick facts: Gambling. Retrieved<br />
from SAMHSA website: http://<br />
www.samhsa.gov/co-occurring/topics/<br />
data/GamblingQuickFacts.pdf<br />
Substance Abuse and Mental Health Services Administration<br />
(SAMHSA). (2010). Results from<br />
the 2009 national survey on drug use and health:<br />
Volume I. Summary <strong>of</strong> national findings. Office<br />
<strong>of</strong> Applied Studies, NSDUH Series H-38A,<br />
HHS Publication No. SMA 10-4856 Findings.<br />
Rockville, MD: Substance Abuse and Mental<br />
Health Services Administration. Retrieved<br />
from SAMHSA website: http://oas.samhsa.<br />
gov/NSDUH/2k9NSDUH/2k9Results.<br />
htm#3.1<br />
Substance Abuse and Mental Health Services Administration<br />
(SAMHSA). (2011). Results<br />
from the 2010 national survey on drug use<br />
and health: Summary <strong>of</strong> national Findings.<br />
NSDUH Series H-41, HHS Publication<br />
No. (SMA) 11-4658. Rockville, MD: Substance<br />
Abuse and Mental Health Services<br />
Administration. Retrieved from SAM-<br />
HSA website: http://www.samhsa.gov/<br />
data/NSDUH/2k10NSDUH/2k10Results.<br />
htm#2.4<br />
Substance Abuse and Mental Health Services Administration<br />
(SAMHSA). (2012). State estimates<br />
<strong>of</strong> substance use and mental disorders<br />
from the 2009-2010 national surveys on drug<br />
use and health, NSDUH Series H-43, HHS Publication<br />
No. (SMA) 12-4703. Rockville, MD:<br />
Substance Abuse and Mental Health Services<br />
Administration.<br />
Substance Abuse and Mental Health Services Administration<br />
(SAMHSA): Center for Behavioral<br />
Health Statistics and Quality. (2012,<br />
July 2). The DAWN report: Highlights <strong>of</strong> the<br />
2010 drug abuse warning network (DAWN)<br />
findings on drug-related emergency department<br />
visits. Rockville, MD. Retrieved from<br />
SAMHSA website: http://www.samhsa.<br />
gov/data/2k12/DAWN096/SR096EDHighlights2010.htm<br />
Substance Abuse and Mental Health Services Administration<br />
(SAMHSA): Center for Behavioral<br />
Health Statistics and Quality. (2013,<br />
Jan 8). The NSDUH report: State estimates <strong>of</strong><br />
nonmedical use <strong>of</strong> prescription pain relievers.<br />
Rockville, MD. Retrieved from the SAM-<br />
HSA website: http://www.samhsa.gov/<br />
data/2k12/NSDUH115/sr115-nonmedicaluse-pain-relievers.htm<br />
Substance Abuse and Mental Health Services Administration<br />
(SAMHSA): Office <strong>of</strong> Applied<br />
Studies. (2007, Nov 1). The NSDUH report:<br />
Serious psychological distress and substance use<br />
disorder among veterans. Rockville, MD. Retrieved<br />
from the SAMHSA website: http://<br />
www.samhsa.gov/data/2k7/veteransDual/<br />
veteransDual.htm<br />
Substance Abuse and Mental Health Services Administration<br />
(SAMHSA): Office <strong>of</strong> Applied<br />
Studies. (2009, Nov 11). The N-SSATS report:<br />
Substance abuse treatment facilities operated by<br />
the department <strong>of</strong> veterans affairs. Rockville,<br />
MD. Retrieved from the SAMHSA website:<br />
http://oas.samhsa.gov/2k9/213/213VAfaci<br />
lities2k9Web.pdf<br />
202
Substance Abuse and Mental Health Services Administration<br />
(SAMHSA): Office <strong>of</strong> Applied<br />
Studies. (2010, Sept 9). The DAWN report:<br />
Emergency department visits involving illicit<br />
drug use by older adults: 2008. Rockville, MD.<br />
Retrieved from SAMHSA website: http://<br />
oas.samhsa.gov/2k10/DAWN015/IllicitAbuseHTML.pdf<br />
Substance Abuse and Mental Health Services Administration<br />
(SAMHSA): Treatment Episode<br />
Data Set (TEDS), 2009. (2012). Discharges<br />
from substance abuse treatment services, DA-<br />
SIS series: S-60, HHS Publication No. (SMA)<br />
12-4704. Rockville, MD; Substance Abuse<br />
and Mental Health Services Administration.<br />
Retrieved from SAMHSA website: http://<br />
www.samhsa.gov/data/2k12/TEDS2009N/<br />
TEDS09DAck.htm<br />
Sundararaman, R., Panangala, S. V., & Lister, S. A.<br />
(2008, May 5). Suicide prevention among<br />
veterans. CRS Report for Congress, RL34471.<br />
Retrieved from FAS website: http://www.<br />
fas.org/sgp/crs/misc/RL34471.pdf<br />
U.S. Census Bureau. (2011). Poverty thresholds by size<br />
<strong>of</strong> family and number <strong>of</strong> children. Retrieved from<br />
Census Bureau website: http://www.census.<br />
gov/hhes/www/poverty/data/threshld/<br />
U.S. Census Bureau: American Factfinder. (2010).<br />
American <strong>com</strong>munity survey: Poverty status in<br />
the past 12 months by household type by age <strong>of</strong><br />
householder, ACS 1 Year estimates. Retrieved<br />
from Census Bureau website: http://factfinder2.census.gov<br />
U.S. Census Bureau: American Factfinder. (2010).<br />
American <strong>com</strong>munity survey: Poverty status in<br />
the past 12 months by household type by age <strong>of</strong><br />
householder, ACS 5 Year average 2006-2010.<br />
Retrieved from Census Bureau website:<br />
http://factfinder2.census.gov<br />
U.S. Census Bureau: American Factfinder. (2010).<br />
American <strong>com</strong>munity survey: Selected population<br />
pr<strong>of</strong>ile in the United States, 2009-2011<br />
American <strong>com</strong>munity survey 3-year estimates,<br />
S0201. Retrieved from Census Bureau website:<br />
http://factfinder2.census.gov<br />
APPENDIX<br />
The Council <strong>of</strong> State Governments. (2010). Capitol<br />
facts and figures, extension <strong>of</strong> enhanced medicaid<br />
benefits to states (FMAP) [Data file]. Retrieved<br />
from http://knowledgecenter.csg.org/drupal/system/files/FMAP_9-22_1.pdf<br />
The National Center on Elder Abuse (NCEA).<br />
(1998, September). The national elder abuse<br />
incidence study: Final report. Retrieved from<br />
AOA website: http://www.aoa.gov/AoA-<br />
Root/AoA_Programs/Elder_Rights/Elder_<br />
Abuse/docs/ABuseReport_Full.pdf<br />
Tse, S., Hong, S., Wang, C., & Cunningham-Williams,<br />
R. M. (2012). Gambling behavior and<br />
problems among older adults: A systematic<br />
review <strong>of</strong> empirical studies. Journals <strong>of</strong> Gerontology<br />
Series B: Psychological Sciences and<br />
Social Sciences, 67(5), 639-652.<br />
U.S. Census Bureau. (2010). 2010 Census urban and<br />
rural classification and urban area criteria.<br />
Retrieved from Census Bureau website:<br />
http://www.census.gov/geo/www/<br />
ua/2010urbanruralclass.html<br />
U.S. Census Bureau: American Factfinder. (2010).<br />
American <strong>com</strong>munity survey: Sex by age by employment<br />
status for the population 16 years and<br />
over, ACS 1 Year estimates. Retrieved from<br />
Census Bureau website: http://factfinder2.<br />
census.gov<br />
U.S. Census Bureau: American Factfinder. (2010).<br />
American <strong>com</strong>munity survey: Sex by age by employment<br />
status for the population 16 years and<br />
over, ACS 5 Year average 2006-2010. Retrieved<br />
from Census Bureau website: http://factfinder2.census.gov<br />
U.S. Census Bureau: American Factfinder. (2010).<br />
American factfinder glossary. Retrieved from<br />
Census Bureau website: http://factfinder2.<br />
census.gov<br />
U.S. Census Bureau: American Factfinder. (2012).<br />
American <strong>com</strong>munity survey: 2006-2010–<br />
B10051-Grandparents living with own grandchildren<br />
under 18 years by responsibility for own<br />
grandchildren by presence <strong>of</strong> parent <strong>of</strong> grandchildren<br />
and age <strong>of</strong> grandparent. Retrieved from<br />
Census Bureau website: http://factfinder2.<br />
census.gov/faces/tableservices/jsf/pages/<br />
productview.xhtml?pid=ACS_10_5YR_<br />
B10051&prodType=table<br />
203
APPENDIX<br />
U.S. Census Bureau: American Factfinder. (2012).<br />
American <strong>com</strong>munity survey: 2006-2010–<br />
B10001-Grandchildren under 18 years living<br />
with a grandparent householder by age<br />
<strong>of</strong> grandchild. Retrieved from Census<br />
Bureau website: http://factfinder2.census.gov/faces/tableservices/jsf/pages/<br />
productview.xhtml?pid=ACS_10_5YR_<br />
B10001&prodType=table<br />
U.S. Census Bureau: American Factfinder.<br />
(2012). American <strong>com</strong>munity survey: 2006-<br />
2010–B21001-Sex by age by veteran status<br />
for the civilian population 18 years and<br />
over. Retrieved from Census Bureau<br />
website: http://factfinder2.census.<br />
gov/faces/tableservices/jsf/pages/<br />
productview.xhtml?pid=ACS_10_5YR_<br />
B21001&prodType=table<br />
U.S. Census Bureau: American Factfinder.<br />
(2012). American <strong>com</strong>munity survey:<br />
2006-2010–B07401-Migration by age and<br />
county. Retrieved from Census Bureau<br />
website: http://factfinder2.census.<br />
gov/faces/tableservices/jsf/pages/<br />
productview.xhtml?pid=ACS_10_5YR_<br />
B07401&prodType=table<br />
U.S. Census Bureau: American Factfinder.<br />
(2012). American <strong>com</strong>munity survey:<br />
2006-2010–B01001-Population by sex, age<br />
and county. Retrieved from Census Bureau<br />
website: http://factfinder2.census.<br />
gov/faces/tableservices/jsf/pages/<br />
productview.xhtml?pid=ACS_10_5YR_<br />
B01001&prodType=table<br />
U.S. Census Bureau: American Factfinder. (2012).<br />
American <strong>com</strong>munity survey: 2006-2010–<br />
B09017-Relationship by household type (including<br />
living alone) for the population 65<br />
years and over. Retrieved from Census<br />
Bureau website: http://factfinder2.census.gov/faces/tableservices/jsf/pages/<br />
productview.xhtml?pid=ACS_10_5YR_<br />
B09017&prodType=table<br />
U.S. Census Bureau: American Factfinder.<br />
(2012). American <strong>com</strong>munity survey: 2006-<br />
2010–B15001-Sex by age by educational attainment<br />
for the population 18 years and<br />
over. Retrieved from Census Bureau<br />
website: http://factfinder2.census.<br />
gov/faces/tableservices/jsf/pages/<br />
productview.xhtml?pid=ACS_10_5YR_<br />
B15001&prodType=table<br />
U.S. Census Bureau: American Factfinder. (2012).<br />
American <strong>com</strong>munity survey: 2006-2010–<br />
B12002-Sex by marital status by age for the<br />
population 15 years and over. Retrieved from<br />
Census Bureau website: http://factfinder2.<br />
census.gov/faces/tableservices/jsf/pages/<br />
productview.xhtml?pid=ACS_10_5YR_<br />
B12002&prodType=table<br />
U.S. Census Bureau: American Factfinder.<br />
(2012). American <strong>com</strong>munity survey:<br />
2006-2010–DP05-Demographic and housing<br />
estimates. Retrieved from Census Bureau<br />
website: http://factfinder2.census.<br />
gov/faces/tableservices/jsf/pages/<br />
productview.xhtml?pid=ACS_10_5YR_<br />
DP05&prodType=table<br />
U.S. Census Bureau: American Factfinder. (2012).<br />
American <strong>com</strong>munity survey: 2006-2010–<br />
S0103 - Population 65 years and over in<br />
the United States. Retrieved from Census<br />
Bureau website: http://factfinder2.census.gov/faces/tableservices/jsf/pages/<br />
productview.xhtml?pid=ACS_10_5YR_<br />
S0103&prodType=table<br />
U.S. Census Bureau: American Factfinder. (2012).<br />
American <strong>com</strong>munity survey: 5-Year public use<br />
microdata sample (PUMS): <strong>Nevada</strong> 2006-2010.<br />
Retrieved from Census Bureau website:<br />
http://factfinder.census.gov<br />
U.S. Census Bureau: American Factfinder. (2012).<br />
American <strong>com</strong>munity survey: Median household<br />
in<strong>com</strong>e in the past 12 months (In 2010 inflationadjusted<br />
dollars) by age <strong>of</strong> householder. U.S.,<br />
1-Year average 2006, 2007, 2008, 2009, 2010.<br />
Retrieved from Census Bureau website:<br />
http://factfinder2.census.gov<br />
204
U.S. Census Bureau: American Factfinder. (2012).<br />
American <strong>com</strong>munity survey: Median household<br />
in<strong>com</strong>e in the past 12 months (In 2010 inflationadjusted<br />
dollars) by age <strong>of</strong> householder. U.S.,<br />
5-Year average 2006-2010. Retrieved from<br />
Census Bureau website: http://factfinder.<br />
census.gov<br />
U.S. Census Bureau: Current Population Survey.<br />
(2011). Educational attainment: Current population<br />
survey data on educational attainment: CPS<br />
2011 detailed tables – Table 3. Retrieved from<br />
Census Bureau website: http://www.census.gov/hhes/socdemo/education/data/<br />
cps/2011/tables.html<br />
U.S. Census Bureau: Newsroom. (2011, December<br />
21). Texas gains the most in population since the<br />
census. Retrieved from Census Bureau website:<br />
http://www.census.gov/newsroom/<br />
releases/archives/population/cb11-215.<br />
html<br />
U.S. Census Bureau: Population Estimates. (2008).<br />
Vintage 2009 – National tables: Table 2. Cumulative<br />
Estimates <strong>of</strong> Resident Population Change<br />
for the United States, Regions, States, and Puerto<br />
Rico and Region and State Rankings: April<br />
1, 2000 to July 1, 2009 (NST-EST2009-02).<br />
Retrieved from Census Bureau website:<br />
http://www.census.gov/popest/data/<br />
historical/2000s/vintage_2009/index.html<br />
U.S. Census Bureau: Social Explorer. (2010).<br />
American <strong>com</strong>munity survey: ACS 2010 (1-<br />
year estimates). Retrieved from Census<br />
Bureau website: http://www.socialexplorer.<strong>com</strong>/pub/reportdata/htmlresults.<br />
aspx?ReportId=R10283930<br />
U.S. Census Bureau: State and County Quickfacts.<br />
(2012). <strong>Nevada</strong>. Retrieved from Census Bureau<br />
website: http://quickfacts.census.gov/<br />
qfd/states/32000.html<br />
U.S. Department <strong>of</strong> Agriculture (USDA) and U.S.<br />
Department <strong>of</strong> Health and Human Services.<br />
(2010, December). Dietary guidelines for<br />
Americans, 2010, 7th Edition, Washington,<br />
DC: U.S. Government Printing Office. Retrieved<br />
from USDA website: http://www.<br />
cnpp.usda.gov/publications/dietaryguidelines/2010/policydoc/policydoc.pdf<br />
U.S. Department <strong>of</strong> Defense. (n.d.). Defense finance<br />
and accounting service. Retrieved from U.S.<br />
Department <strong>of</strong> Defense website: http://<br />
www.dfas.mil/retiredmilitary/about/contact-who.html<br />
U.S. Department <strong>of</strong> Health & Human Services<br />
(USDHHS). (2012). Get active. www.healthfinder.gov.<br />
Retrieved from USDHHS website:<br />
http://www.healthfinder.gov/prevention/<br />
PrintTopic.aspx?topicID=22&catId=<br />
APPENDIX<br />
U.S. Census Bureau: Population Estimates. (2010).<br />
Vintage 2009 – National tables: Table 1. Annual<br />
estimates <strong>of</strong> the resident population by sex<br />
and five-year age groups for the United States:<br />
April 1, 2000 to July 1, 2009 (NC-EST2009-01).<br />
Retrieved from Census Bureau website:<br />
http://www.census.gov/popest/data/<br />
historical/2000s/vintage_2009/index.html<br />
U.S. Census Bureau: Population Estimates. (2011).<br />
State population estimates and demographic<br />
<strong>com</strong>ponents <strong>of</strong> change – 1900 to 1960 total<br />
population estimates. Retrieved from Census<br />
Bureau website: http://www.census.gov/<br />
popest/data/state/asrh/1980s/tables/<br />
st5060ts.txt<br />
U.S. Census Bureau: Population Estimates. (2012).<br />
State totals: Vintage 2011. Retrieved from<br />
Census Bureau website: http://www.census.gov/popest/data/state/totals/2011/<br />
index.html<br />
U.S. Department <strong>of</strong> Health & Human Services (US-<br />
DHHS): Administration on Aging. (2011).<br />
Positive aging: HIV turns 30 webinar. Retrieved<br />
from AOA website: http://www.<br />
aoa.gov/AoARoot/AoA_Programs/HPW/<br />
HIV_AIDS/Webinar.aspx<br />
U.S. Department <strong>of</strong> Homeland Security. (2011).<br />
Yearbook <strong>of</strong> immigration statistics: 2010. Washington,<br />
D.C.: U.S. Department <strong>of</strong> Homeland<br />
Security, Office <strong>of</strong> Immigration Statistics.<br />
U.S. Department <strong>of</strong> Justice: District <strong>of</strong> <strong>Nevada</strong>.<br />
(2012). Tribal matters: A snapshot <strong>of</strong> <strong>Nevada</strong>’s<br />
Indian country. Retrieved from U.S. Department<br />
<strong>of</strong> Justice website: http://www.justice.<br />
gov/usao/nv/tribal_matters/index.html<br />
205
APPENDIX<br />
U.S. Department <strong>of</strong> Labor, Bureau <strong>of</strong> Labor Statistics.<br />
(2012). Consumer expenditure survey,<br />
Table 3850. Age <strong>of</strong> reference person: Average annual<br />
expenditures and characteristics. Retrieved<br />
from Bureau <strong>of</strong> Labor and Statistics website:<br />
http://www.bls.gov/cex/tables.htm<br />
U.S. Department <strong>of</strong> Veterans Affairs (n.d.) Retrieved<br />
from VA website: http://www.vba.va.gov/<br />
U.S. Department <strong>of</strong> Veterans Affairs. (2012). Expenditures:<br />
National center for veterans analysis<br />
and statistics. Retrieved from the VA website:<br />
http://www.va.gov/vetdata/Expenditures.<br />
asp<br />
U.S. Department <strong>of</strong> Veterans Affairs. (2012). Federal<br />
benefits for veterans: Dependents and survivors.<br />
Retrieved from the VA.gov website: http://<br />
www.va.gov/opa/publications/benefits_<br />
book/2012_Federal_benefits_ebook_final.pdf<br />
U.S. Department <strong>of</strong> Veterans Affairs. (2012). Veteran<br />
population: National center for veterans analysis<br />
and statistics. Retrieved from VA website:<br />
http://www.va.gov/vetdata/Veteran_Population.asp<br />
U.S. Preventive Services Task Force (USPSTF).<br />
(2005). Genetic risk assessment and BRCA<br />
mutation testing for breast and ovarian cancer<br />
susceptibility: Re<strong>com</strong>mendation statement.<br />
Annals <strong>of</strong> Internal Medicine, 143, 355-61.<br />
Retrieved from USPSTF website: http://<br />
www.uspreventiveservicestaskforce.org/<br />
uspstf05/brcagen/brcagenrs.htm#copyright<br />
U.S. Preventive Services Task Force (USPSTF).<br />
(2005). Screening for breast cancer: Re<strong>com</strong>mendation<br />
statement. Annals <strong>of</strong> Internal<br />
Medicine, 151,716-726. Retrieved from USP-<br />
STF website: http://www.uspreventiveservicestaskforce.org/uspstf09/breastcancer/<br />
brcanrs.htm<br />
U.S. Preventive Services Task Force (USPSTF).<br />
(2005). Screening for cervical cancer: Re<strong>com</strong>mendation<br />
statement. AHRQ Publication No.<br />
11-05156-EF-2. Retrieved from USPSTF<br />
website: http://www.uspreventiveservicestaskforce.org/uspstf11/cervcancer/cervcancerrs.htm<br />
U.S. Preventive Services Task Force (USPSTF).<br />
(2008). Screening for colorectal cancer: Re<strong>com</strong>mendation<br />
statement. AHRQ Publication 08-<br />
05124-EF-3. Retrieved from USPSTF website:<br />
http://www.uspreventiveservicestaskforce.<br />
org/uspstf08/colocancer/colors.htm<br />
U.S. Preventive Services Task Force (USPSTF).<br />
(2012). Screening for ovarian cancer: Re<strong>com</strong>mendation<br />
statement. AHRQ Publication No.<br />
12-05165-EF-2. Retrieved from USPSTF website:<br />
http://www.uspreventiveservicestaskforce.org/uspstf12/ovarian/ovarcancerrs.<br />
htm<br />
U.S. Preventive Services Task Force (USPSTF).<br />
(2012). Screening for prostate cancer: Final<br />
re<strong>com</strong>mendation statement. AHRQ Publication<br />
No. 12-05160-EF-2. Retrieved from USPSTF<br />
website: http://www.uspreventiveservicestaskforce.org/prostatecancerscreening/<br />
prostatefinalrs.htm<br />
U.S. Social Security Administration, Office <strong>of</strong> Retirement<br />
and Disability Policy, Office <strong>of</strong><br />
Research, Evaluation, and Statistics. (2012).<br />
Annual Statistical Supplement, 2011. Retrieved<br />
from Social Security website: http://www.<br />
socialsecurity.gov/policy<br />
U.S. Social Security Administration, Office <strong>of</strong> Retirement<br />
and Disability Policy, Office <strong>of</strong><br />
Research, Evaluation, and Statistics. (2012).<br />
OASDI Beneficiaries by State and County, December<br />
2010. Retrieved from Social Security<br />
website: http://www.socialsecurity.gov/<br />
policy/docs/stat<strong>com</strong>ps/ssi_sc/2010/index.<br />
html<br />
Villa, V. M., Harada, N. D., Washington, D., &<br />
Damron-Rodriguez, J. (2003, May-Jun). The<br />
health and functional status <strong>of</strong> U.S. veterans<br />
aged 65+: Implications for VA health programs<br />
serving an elderly, diverse veteran<br />
population. American Journal <strong>of</strong> Medical Quality,<br />
18(3), 108-116.<br />
Volberg, R. A. (2002). Gambling and problem gambling<br />
in <strong>Nevada</strong>: Report to the <strong>Nevada</strong> department <strong>of</strong><br />
human resources. Retrieved from NCPG website:<br />
http://www.ncpgambling.org/i4a/<br />
pages/index.cfm?pageid=3390#widespread<br />
206
Volkow, N. D. (2009, Nov 1). Substance abuse<br />
among troops, veterans, and their families.<br />
National Institute on Drug Abuse: NIDA Notes.<br />
Retrieved from NIDA website: http://<br />
www.drugabuse.gov/news-events/nidanotes/2009/11/substance-abuse-amongtroops-veterans-their-families<br />
Volkow, N. D. (2011, Dec 19). Substance abuse<br />
among older adults. National Institute on<br />
Drug Abuse. Retrieved from NIDA website:<br />
http://www.drugabuse.gov/news-events/<br />
nida-notes/2011/12/substance-abuseamong-older-adults<br />
Ward, L. (2012, Oct 23). Medical school enrollment<br />
continues to climb with new diversity gains.<br />
AAMC.org. Retrieved from the AAMC website:<br />
https://www.aamc.org/newsroom/<br />
newsreleases/310002/121023.html<br />
World Health Organization (WHO). (2008). Closing<br />
the gap in a generation: Health equity through<br />
action on the social determinants <strong>of</strong> health.<br />
Retrieved from WHO website: http://<br />
whqlibdoc.who.int/hq/2008/WHO_IER_<br />
CSDH_08.1_<strong>eng</strong>.pdf<br />
Wysocki, A., Butler, M., Kane, R. L., Kane, R. A.,<br />
Shippee, T., and Sainfort, F. (2012, Nov.).<br />
Long term care for older adults: A review <strong>of</strong><br />
home and <strong>com</strong>munity-based services versus<br />
institutional care. Effective Health Care Program:<br />
Comparative Effectiveness Review No. 81.<br />
(Prepared by the Minnesota Evidence-based<br />
Practice Center under Contract No. 290-<br />
2007-10064-I.) AHRQ Publication No.12(13)-<br />
EHC134-EF. Rockville, MD: Agency for<br />
Healthcare Research and Quality. Retrieved<br />
from www.effectivehealthcare.ahrq.gov/<br />
reports/final.cfm<br />
APPENDIX<br />
Wentworth, S. G. and Pattison, D. (2001/2002). In<strong>com</strong>e<br />
growth and future poverty rates <strong>of</strong> the<br />
aged. Social Security Bulletin, 64(3).<br />
Werner, C. A. (2011). The older population: 2010<br />
– 2010 Census briefs. U.S. Census bureau:<br />
Census briefs. Retrieved from Census Bureau<br />
website: http://www.census.gov/prod/<br />
cen2010/briefs/c2010br-09.pdf<br />
Wharton, C. (2012, March 12). <strong>Nevada</strong> state demographer<br />
releases population estimates.<br />
<strong>University</strong> <strong>of</strong> <strong>Nevada</strong>, Reno: Media newsroom.<br />
Retrieved from http://newsroom.unr.<br />
edu/2012/03/12/nevada-state-demographer-releases-population-estimates/<br />
Whitley, P. (2008). American cultural history, 1900-<br />
1909. The Decades. Retrieved from http://<br />
kclibrary.lonestar.edu/decade00.html<br />
Winter, K. H., Bouldin, E. D., & Andresen, E. M.<br />
(2010, March). Lack <strong>of</strong> choice in caregiving<br />
decision and caregiver risk <strong>of</strong> stress, North<br />
Carolina, 2005. Preventing Chronic Disease:<br />
Public Health Research, Practice, and Policy,<br />
7(2, A41), 1-11. Retrieved from the CDC<br />
website: http://www.cdc.gov/pcd/issues/2010/mar/09_0037.htm<br />
Ziliak, J. P., & Gundersen, C. (2012). Senior hunger<br />
in America 2010: An annual report. Meals on<br />
Wheels Research Foundation. Retrieved from<br />
Meals on Wheels website: http://mealsonwheelserie.org/2012/08/07/the-meals-onwheels-research-foundation/<br />
207
Notes<br />
“The success <strong>of</strong> a report card depends on nesting messages and finding how to balance<br />
a simple and elegant presentation that will spark interest among individuals and organizations<br />
with information and translates that information into action.”<br />
—Center for Advancement <strong>of</strong> Health
Sanford Center for Aging<br />
Mail Stop 146<br />
<strong>University</strong> <strong>of</strong> <strong>Nevada</strong>, Reno<br />
Reno, NV 89557-0146<br />
(775) 784-4774 phone • (775) 784-1814 fax<br />
email address: sanford@unr.edu<br />
website: www.unr.edu/sanford