- Page 1: Songquan Deng / Shutterstock.com
- Page 7: Wei Yang, MD, PhD Professor of Epid
- Page 11 and 12: Executive Summary This report was c
- Page 13: Divorce: Sixteen percent of Nevada
- Page 16 and 17: Population Highlights Population Gr
- Page 18 and 19: Population From 2000 to 2010, the n
- Page 20 and 21: Population Given current state and
- Page 22 and 23: Population Race & Ethnicity Almost
- Page 24 and 25: Population The lack of social suppo
- Page 26 and 27: Population As shown in Figure P25 b
- Page 28 and 29: Population Fig. P29: Nevada Veteran
- Page 30 and 31: Population 20 Table P2 County and S
- Page 32 and 33: Population Table P5 Percentage Seni
- Page 34 and 35: Population Table P7 Nevada Populati
- Page 36 and 37: Population Nevada Race/Ethnicity: A
- Page 38 and 39: Population Table P15 U.S. Departmen
- Page 40 and 41: Population 30 Table P18 Nevada Vete
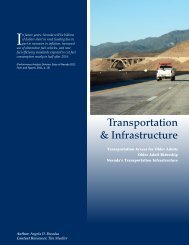
- Page 42 and 43: TRANSPORTATION & infrastructure Hig
- Page 44 and 45: TRANSPORTATION & infrastructure Old
- Page 46 and 47: TRANSPORTATION & infrastructure Tab
- Page 49 and 50: The following section contains an o
- Page 51 and 52: Labor Force Participation A person
- Page 53 and 54:
$70,000 $65,000 $60,000 $55,000 $50
- Page 55 and 56:
Assets Income does not fully accoun
- Page 57 and 58:
Using average five-year data betwee
- Page 59 and 60:
$160,000 $140,000 $120,000 $100,000
- Page 61 and 62:
Health, morbidity, and access to he
- Page 63 and 64:
Veterans • Over half (51%) of the
- Page 65 and 66:
Fig. HS2: Age-adjusted Death Rates
- Page 67 and 68:
The proportion of adults 75-84 who
- Page 69 and 70:
Activity limitations due to disabil
- Page 71 and 72:
Visual & Hearing Health Age-associa
- Page 73 and 74:
Fig. HS23: National - Prevalence of
- Page 75 and 76:
Fig. HS28: Nevada Adults, Age 65 an
- Page 77 and 78:
Veterans Veterans make up approxima
- Page 79 and 80:
Even though 9.3% of the older Nevad
- Page 81 and 82:
Nevada: Leading Causes of Death, 20
- Page 83 and 84:
Table HS6 Nevada Residents, Age 65
- Page 85 and 86:
Table HS8 Nevada Adults, Age 65 and
- Page 87 and 88:
Table HS10 Nevada Adults, Age 65 an
- Page 89 and 90:
Table HS12 Nevada Adults, Age 65 an
- Page 91 and 92:
Table HS14 Nevada Adults Age 65 and
- Page 93 and 94:
Table HS16 Nevada Adults Age 65 and
- Page 95 and 96:
Table HS18 Nevada Veterans, Age 65
- Page 97 and 98:
Table HS20 Nevada Veterans, Age 65
- Page 99 and 100:
Table HS22 Nevada Veterans, Age 65
- Page 101 and 102:
Risk and protective factors influen
- Page 103 and 104:
Overweight & Obesity • In 2011, a
- Page 105 and 106:
Tobacco Use Tobacco use is associat
- Page 107 and 108:
National rates of binge drinking in
- Page 109 and 110:
63.8% Fig. HR10: DAWN, 2008 : ER Vi
- Page 111 and 112:
In spite of Stitt et al.’s (2003)
- Page 113 and 114:
Physical Activity In addition to pr
- Page 115 and 116:
Overweight & Obesity Body weight, i
- Page 117 and 118:
Cholesterol & Blood Pressure Hyperl
- Page 119 and 120:
Influenza & Pneumonia Vaccinations
- Page 121 and 122:
An estimated 81.3% (median percent)
- Page 123 and 124:
Of older Nevada adults living with
- Page 125 and 126:
In 2007, 107 Nevada adults 65 and o
- Page 127 and 128:
Motor Vehicle Accidents Older adult
- Page 129 and 130:
Confounding the issue for many is
- Page 131 and 132:
Table HR1 Rate of Cigarette Smoking
- Page 133 and 134:
Table HR3 Nevada Adults 65 and Olde
- Page 135 and 136:
Table HR5 Nevada Adults, 65 and Old
- Page 137 and 138:
Table HR7 Nevada Adults 65 and Olde
- Page 139 and 140:
Table HR9 Nevada Adults 65 and Olde
- Page 141 and 142:
Table HR12 Nevada Adults 65 and Old
- Page 143 and 144:
Table HR14 Nevada Adults 65 and Old
- Page 145 and 146:
Table HR16 Nevada Adults 65 and Old
- Page 147 and 148:
Table HR18 U.S. Preventive Services
- Page 149 and 150:
Table HR20 Nevada Adults 65 and Old
- Page 151 and 152:
Table HR22 Nevada Adults 65 and Old
- Page 153 and 154:
Table HR24 U.S. and Nevada, 2010: R
- Page 155 and 156:
Table HR27 Nevada Adults 65 and Old
- Page 157 and 158:
Table HR29 U.S. Adults 65 and Older
- Page 159 and 160:
Table HR31 Nevada, FY 2011 - FY 201
- Page 161 and 162:
Table HR33 U.S. Adults 65 and Older
- Page 163 and 164:
Table HR36 U.S. Adults 65 and Older
- Page 165 and 166:
In the final section of the Elder
- Page 167 and 168:
Expenditures • Nevada was in the
- Page 169 and 170:
In 2011, an estimated 4.6% of U.S.
- Page 171 and 172:
Between 2010 and 2011, an estimated
- Page 173 and 174:
In spite of this encouraging news,
- Page 175 and 176:
Prescription Drugs As indicated in
- Page 177 and 178:
Expenditures In 2009, U.S. health c
- Page 179 and 180:
In 2009, 11 Nevada nursing homes ha
- Page 181 and 182:
Between 2005 and 2009, the Nevada n
- Page 183 and 184:
Table HC1 Centers for Medicare & Me
- Page 185 and 186:
Table HC4 U.S. Adults 65 and Older:
- Page 187 and 188:
Table HC7 U.S. & Nevada, 2010-2011:
- Page 189 and 190:
Table HC9 U.S. and Nevada, FY 2010:
- Page 191 and 192:
Table HC13 U.S. and Nevada, 2009: D
- Page 193 and 194:
Table HC18 U.S. and Nevada, 2009: N
- Page 195 and 196:
Veteran Priority Groups for Health
- Page 197 and 198:
Data Limitations, Challenges & Caut
- Page 199 and 200:
References Acierno, R., Hernandez,
- Page 201 and 202:
Campbell, P. R. (1996). Population
- Page 203 and 204:
Centers for Disease Control and Pre
- Page 205 and 206:
Effros, R., B., Fletcher, C. V., Ge
- Page 207 and 208:
Jourdan, K. (2012, July 17). Clark
- Page 209 and 210:
National Highway Traffic Safety Adm
- Page 211 and 212:
Passel, J., & Cohn, D. (2011, Febru
- Page 213 and 214:
Substance Abuse and Mental Health S
- Page 215 and 216:
U.S. Census Bureau: American Factfi
- Page 217 and 218:
Volkow, N. D. (2009, Nov 1). Substa
- Page 220:
Sanford Center for Aging Mail Stop