S ongquan D eng / Shutterstock .com - University of Nevada School ...
S ongquan D eng / Shutterstock .com - University of Nevada School ...
S ongquan D eng / Shutterstock .com - University of Nevada School ...

You also want an ePaper? Increase the reach of your titles
YUMPU automatically turns print PDFs into web optimized ePapers that Google loves.
Population<br />
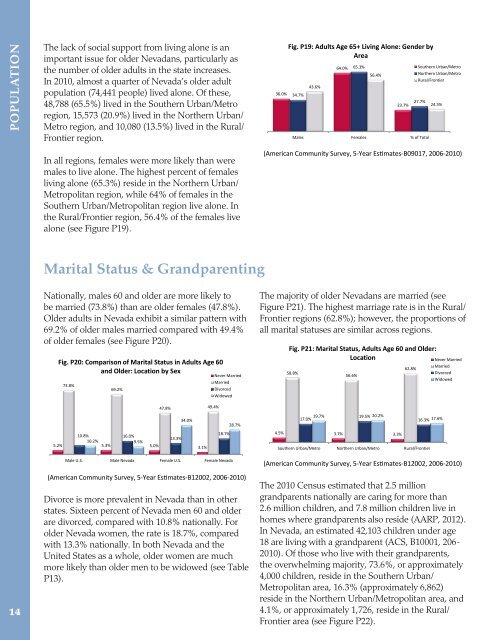
The lack <strong>of</strong> social support from living alone is an<br />
important issue for older <strong>Nevada</strong>ns, particularly as<br />
the number <strong>of</strong> older adults in the state increases.<br />
In 2010, almost a quarter <strong>of</strong> <strong>Nevada</strong>’s older adult<br />
population (74,441 people) lived alone. Of these,<br />
48,788 (65.5%) lived in the Southern Urban/Metro<br />
region, 15,573 (20.9%) lived in the Northern Urban/<br />
Metro region, and 10,080 (13.5%) lived in the Rural/<br />
Frontier region.<br />
In all regions, females were more likely than were<br />
males to live alone. The highest percent <strong>of</strong> females<br />
living alone (65.3%) reside in the Northern Urban/<br />
Metropolitan region, while 64% <strong>of</strong> females in the<br />
Southern Urban/Metropolitan region live alone. In<br />
the Rural/Frontier region, 56.4% <strong>of</strong> the females live<br />
alone (see Figure P19).<br />
36.0%<br />
Fig. P19: Adults Age 65+ Living Alone: Gender by<br />
Area<br />
34.7%<br />
43.6%<br />
64.0%<br />
65.3%<br />
56.4%<br />
23.7%<br />
27.7%<br />
Males Females % <strong>of</strong> Total<br />
Southern Urban/Metro<br />
Northern Urban/Metro<br />
Rural/Frontier<br />
24.5%<br />
(American Community Survey, 5-Year Estimates-B09017, 2006-2010)<br />
Marital Status & Grandparenting<br />
14<br />
Nationally, males 60 and older are more likely to<br />
be married (73.8%) than are older females (47.8%).<br />
Older adults in <strong>Nevada</strong> exhibit a similar pattern with<br />
69.2% <strong>of</strong> older males married <strong>com</strong>pared with 49.4%<br />
<strong>of</strong> older females (see Figure P20).<br />
Fig. P20: Comparison <strong>of</strong> Marital Status in Adults Age 60<br />
and Older: Location by Sex<br />
Never Married<br />
73.8%<br />
69.2%<br />
47.8% 49.4%<br />
34.0%<br />
10.8% 16.0%<br />
13.3%<br />
10.2% 9.5%<br />
5.2% 5.3% 5.0% 3.1%<br />
Married<br />
Divorced<br />
Widowed<br />
18.7%<br />
Male U.S. Male <strong>Nevada</strong> Female U.S. Female <strong>Nevada</strong><br />
28.7%<br />
(American Community Survey, 5-Year Estimates-B12002, 2006-2010)<br />
Divorce is more prevalent in <strong>Nevada</strong> than in other<br />
states. Sixteen percent <strong>of</strong> <strong>Nevada</strong> men 60 and older<br />
are divorced, <strong>com</strong>pared with 10.8% nationally. For<br />
older <strong>Nevada</strong> women, the rate is 18.7%, <strong>com</strong>pared<br />
with 13.3% nationally. In both <strong>Nevada</strong> and the<br />
United States as a whole, older women are much<br />
more likely than older men to be widowed (see Table<br />
P13).<br />
The majority <strong>of</strong> older <strong>Nevada</strong>ns are married (see<br />
Figure P21). The highest marriage rate is in the Rural/<br />
Frontier regions (62.8%); however, the proportions <strong>of</strong><br />
all marital statuses are similar across regions.<br />
Fig. P21: Marital Status, Adults Age 60 and Older:<br />
Location<br />
Never Married<br />
58.8%<br />
56.6%<br />
19.7% 19.5% 20.2%<br />
17.0%<br />
4.5% 3.7% 3.3%<br />
62.8%<br />
Southern Urban/Metro Northern Urban/Metro Rural/Frontier<br />
Married<br />
Divorced<br />
Widowed<br />
16.3% 17.6%<br />
(American Community Survey, 5-Year Estimates-B12002, 2006-2010)<br />
The 2010 Census estimated that 2.5 million<br />
grandparents nationally are caring for more than<br />
2.6 million children, and 7.8 million children live in<br />
homes where grandparents also reside (AARP, 2012).<br />
In <strong>Nevada</strong>, an estimated 42,103 children under age<br />
18 are living with a grandparent (ACS, B10001, 206-<br />
2010). Of those who live with their grandparents,<br />
the overwhelming majority, 73.6%, or approximately<br />
4,000 children, reside in the Southern Urban/<br />
Metropolitan area, 16.3% (approximately 6,862)<br />
reside in the Northern Urban/Metropolitan area, and<br />
4.1%, or approximately 1,726, reside in the Rural/<br />
Frontier area (see Figure P22).