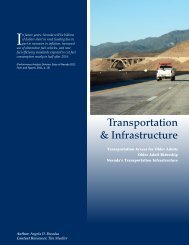
S ongquan D eng / Shutterstock .com - University of Nevada School ...
S ongquan D eng / Shutterstock .com - University of Nevada School ...
S ongquan D eng / Shutterstock .com - University of Nevada School ...

Create successful ePaper yourself
Turn your PDF publications into a flip-book with our unique Google optimized e-Paper software.
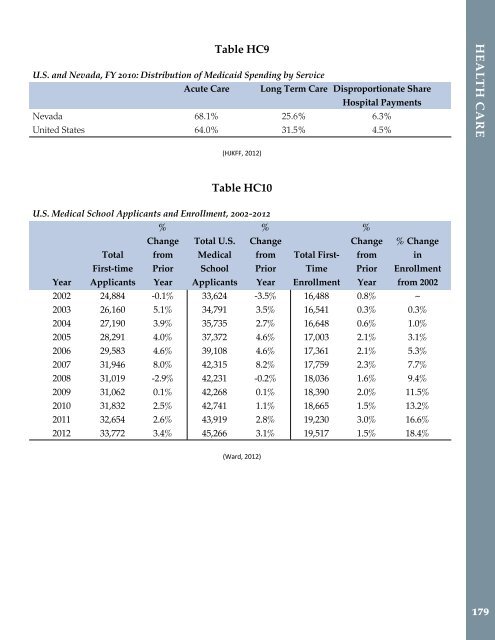
Table HC9<br />
U.S. and <strong>Nevada</strong>, FY 2010: Distribution <strong>of</strong> Medicaid Spending by Service<br />
Acute Care Long Term Care Disproportionate Share<br />
Hospital Payments<br />
<strong>Nevada</strong> 68.1% 25.6% 6.3%<br />
United States 64.0% 31.5% 4.5%<br />
Health Care<br />
(HJKFF, 2012)<br />
Table HC10<br />
U.S. Medical <strong>School</strong> Applicants and Enrollment, 2002-2012<br />
% % %<br />
Change Total U.S. Change Change % Change<br />
Total from Medical from Total First- from in<br />
First-time Prior <strong>School</strong> Prior Time Prior Enrollment<br />
Year Applicants Year Applicants Year Enrollment Year from 2002<br />
2002 24,884 -0.1% 33,624 -3.5% 16,488 0.8% ~<br />
2003 26,160 5.1% 34,791 3.5% 16,541 0.3% 0.3%<br />
2004 27,190 3.9% 35,735 2.7% 16,648 0.6% 1.0%<br />
2005 28,291 4.0% 37,372 4.6% 17,003 2.1% 3.1%<br />
2006 29,583 4.6% 39,108 4.6% 17,361 2.1% 5.3%<br />
2007 31,946 8.0% 42,315 8.2% 17,759 2.3% 7.7%<br />
2008 31,019 -2.9% 42,231 -0.2% 18,036 1.6% 9.4%<br />
2009 31,062 0.1% 42,268 0.1% 18,390 2.0% 11.5%<br />
2010 31,832 2.5% 42,741 1.1% 18,665 1.5% 13.2%<br />
2011 32,654 2.6% 43,919 2.8% 19,230 3.0% 16.6%<br />
2012 33,772 3.4% 45,266 3.1% 19,517 1.5% 18.4%<br />
(Ward, 2012)<br />
179