Transportation & Infrastructure - University of Nevada, Reno
Transportation & Infrastructure - University of Nevada, Reno
Transportation & Infrastructure - University of Nevada, Reno

Create successful ePaper yourself
Turn your PDF publications into a flip-book with our unique Google optimized e-Paper software.
TRANSPORTATION & INFRASTRUCTURE<br />
Older Adult Ridership<br />
Although public transportation is essential to<br />
meeting the growing mobility needs <strong>of</strong> <strong>Nevada</strong>’s<br />
seniors, obtaining accurate data on senior ridership is<br />
problematic. Total ridership data do not exist specific<br />
to the older adult population. Where data have been<br />
collected, the data on riders 65 and older have been<br />
confounded with the inclusion <strong>of</strong> individuals with<br />
disabilities <strong>of</strong> all ages and the general public. Other<br />
transportation services that receive NDOT funds (i.e.,<br />
sub-recipients), such as senior centers and regional<br />
services, do not collect age-specific data, although<br />
their passengers are primarily from local senior<br />
centers. For example, Churchill County and other<br />
sub-recipients in Douglas, Esmeralda, Humboldt,<br />
Lander, Lincoln, Lyon, Mineral and Pershing counties<br />
might not report ridership by age alone, even though<br />
they regularly pick up passengers from the county<br />
senior centers. Also, Douglas County operates the<br />
BlueGo transit with Lake Tahoe tourists, and the<br />
senior centers in Minden and Gardnerville operate<br />
the DART public transit system. Rural transit in White<br />
Pine operates through the White Pine County Senior<br />
Services (M. Gardner, Personal Communication,<br />
August 30, 2012).<br />
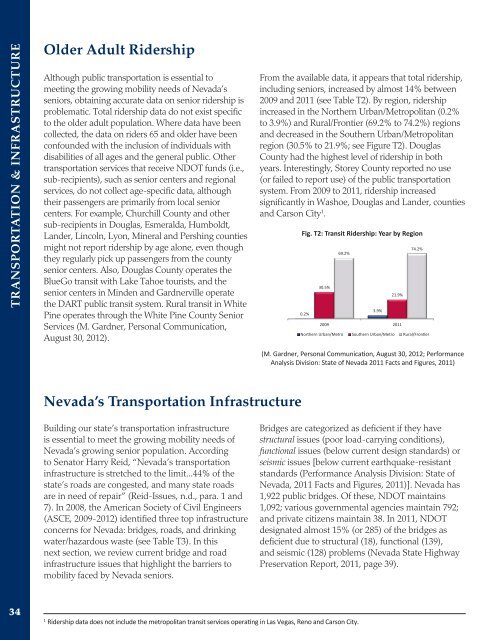
From the available data, it appears that total ridership,<br />
including seniors, increased by almost 14% between<br />
2009 and 2011 (see Table T2). By region, ridership<br />
increased in the Northern Urban/Metropolitan (0.2%<br />
to 3.9%) and Rural/Frontier (69.2% to 74.2%) regions<br />
and decreased in the Southern Urban/Metropolitan<br />
region (30.5% to 21.9%; see Figure T2). Douglas<br />
County had the highest level <strong>of</strong> ridership in both<br />
years. Interestingly, Storey County reported no use<br />
(or failed to report use) <strong>of</strong> the public transportation<br />
system. From 2009 to 2011, ridership increased<br />
significantly in Washoe, Douglas and Lander, counties<br />
and Carson City 1 .<br />
Fig. T2: Transit Ridership: Year by Region<br />
0.2%<br />
30.5%<br />
69.2%<br />
3.9%<br />
21.9%<br />
2009 2011<br />
74.2%<br />
Northern Urban/Metro Southern Urban/Metro Rural/Frontier<br />
(M. Gardner, Personal Communication, August 30, 2012; Performance<br />
Analysis Division: State <strong>of</strong> <strong>Nevada</strong> 2011 Facts and Figures, 2011)<br />
<strong>Nevada</strong>’s <strong>Transportation</strong> <strong>Infrastructure</strong><br />
Building our state’s transportation infrastructure<br />
is essential to meet the growing mobility needs <strong>of</strong><br />
<strong>Nevada</strong>’s growing senior population. According<br />
to Senator Harry Reid, “<strong>Nevada</strong>’s transportation<br />
infrastructure is stretched to the limit...44% <strong>of</strong> the<br />
state’s roads are congested, and many state roads<br />
are in need <strong>of</strong> repair” (Reid-Issues, n.d., para. 1 and<br />
7). In 2008, the American Society <strong>of</strong> Civil Engineers<br />
(ASCE, 2009-2012) identified three top infrastructure<br />
concerns for <strong>Nevada</strong>: bridges, roads, and drinking<br />
water/hazardous waste (see Table T3). In this<br />
next section, we review current bridge and road<br />
infrastructure issues that highlight the barriers to<br />
mobility faced by <strong>Nevada</strong> seniors.<br />
Bridges are categorized as deficient if they have<br />
structural issues (poor load-carrying conditions),<br />
functional issues (below current design standards) or<br />
seismic issues [below current earthquake-resistant<br />
standards (Performance Analysis Division: State <strong>of</strong><br />
<strong>Nevada</strong>, 2011 Facts and Figures, 2011)]. <strong>Nevada</strong> has<br />
1,922 public bridges. Of these, NDOT maintains<br />
1,092; various governmental agencies maintain 792;<br />
and private citizens maintain 38. In 2011, NDOT<br />
designated almost 15% (or 285) <strong>of</strong> the bridges as<br />
deficient due to structural (18), functional (139),<br />
and seismic (128) problems (<strong>Nevada</strong> State Highway<br />
Preservation Report, 2011, page 39).<br />
34<br />
1<br />
Ridership data does not include the metropolitan transit services operating in Las Vegas, <strong>Reno</strong> and Carson City.