Classification and Diversity
Classification and Diversity
Classification and Diversity

Create successful ePaper yourself
Turn your PDF publications into a flip-book with our unique Google optimized e-Paper software.
DATA ANALYSIS<br />
Amino Acid Differences<br />
Among Species<br />
TRANSFORMING DATA<br />
DATA ANALYSIS<br />
ClassZone.com<br />
Researchers rarely publish raw data by itself. Instead, data are usually analyzed in<br />
some way. This is because certain types of observations <strong>and</strong> patterns can be made<br />
clearer when data are presented in different ways. For example, data that show<br />
change or difference may be best represented as percentage difference.<br />
EXAMPLE<br />
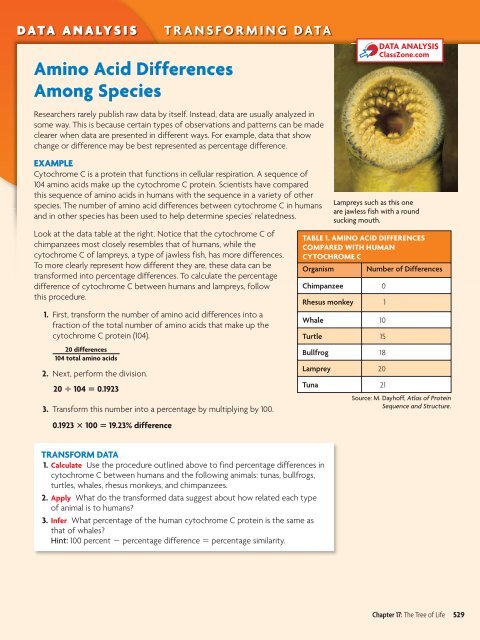
Cytochrome C is a protein that functions in cellular respiration. A sequence of<br />
104 amino acids make up the cytochrome C protein. Scientists have compared<br />
this sequence of amino acids in humans with the sequence in a variety of other<br />
species. The number of amino acid differences between cytochrome C in humans<br />
<strong>and</strong> in other species has been used to help determine species’ relatedness.<br />
Look at the data table at the right. Notice that the cytochrome C of<br />
chimpanzees most closely resembles that of humans, while the<br />
cytochrome C of lampreys, a type of jawless fish, has more differences.<br />
To more clearly represent how different they are, these data can be<br />
transformed into percentage differences. To calculate the percentage<br />
difference of cytochrome C between humans <strong>and</strong> lampreys, follow<br />
this procedure.<br />
1. First, transform the number of amino acid differences into a<br />
fraction of the total number of amino acids that make up the<br />
cytochrome C protein (104).<br />
_______<br />
20 differences<br />
104 total amino acids<br />
2. Next, perform the division.<br />
20 104 0.1923<br />
3. Transform this number into a percentage by multiplying by 100.<br />
0.1923 100 19.23% difference<br />
Lampreys such as this one<br />
are jawless fish with a round<br />
sucking mouth.<br />
TABLE 1. AMINO ACID DIFFERENCES<br />
COMPARED WITH HUMAN<br />
CYTOCHROME C<br />
Organism Number of Differences<br />
Chimpanzee 0<br />
Rhesus monkey 1<br />
Whale 10<br />
Turtle 15<br />
Bullfrog 18<br />
Lamprey 20<br />
Tuna 21<br />
Source: M. Dayhoff, Atlas of Protein<br />
Sequence <strong>and</strong> Structure.<br />
TRANSFORM DATA<br />
1. Calculate Use the procedure outlined above to find percentage differences in<br />
cytochrome C between humans <strong>and</strong> the following animals: tunas, bullfrogs,<br />
turtles, whales, rhesus monkeys, <strong>and</strong> chimpanzees.<br />
2. Apply What do the transformed data suggest about how related each type<br />
of animal is to humans?<br />
3. Infer What percentage of the human cytochrome C protein is the same as<br />
that of whales?<br />
Hint: 100 percent percentage difference percentage similarity.<br />
Chapter 17: The Tree of Life 529