A First Look at the Literacy of America's Adults in the 21st Century
A First Look at the Literacy of America's Adults in the 21st Century
A First Look at the Literacy of America's Adults in the 21st Century

You also want an ePaper? Increase the reach of your titles
YUMPU automatically turns print PDFs into web optimized ePapers that Google loves.
A <strong>First</strong> <strong>Look</strong> <strong>at</strong> <strong>the</strong> <strong>Literacy</strong> <strong>of</strong> America’s <strong>Adults</strong> <strong>in</strong> <strong>the</strong> 21 st <strong>Century</strong><br />
<strong>Literacy</strong> by Employment St<strong>at</strong>us<br />
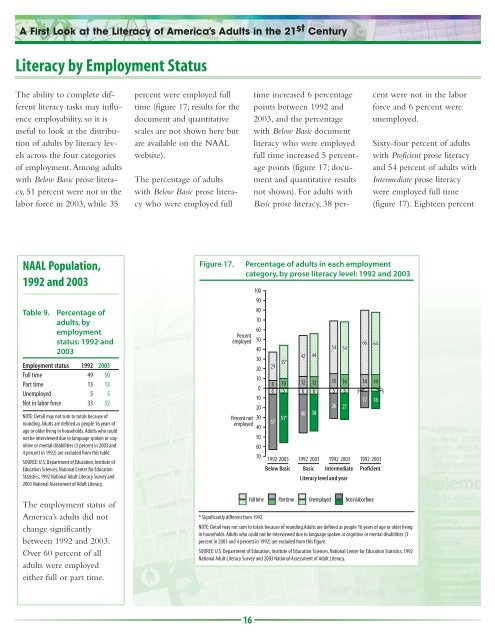
The ability to complete different<br />
literacy tasks may <strong>in</strong>fluence<br />
employability, so it is<br />
useful to look <strong>at</strong> <strong>the</strong> distribution<br />
<strong>of</strong> adults by literacy levels<br />
across <strong>the</strong> four c<strong>at</strong>egories<br />
<strong>of</strong> employment. Among adults<br />
with Below Basic prose literacy,<br />
51 percent were not <strong>in</strong> <strong>the</strong><br />
labor force <strong>in</strong> 2003, while 35<br />
NAAL Popul<strong>at</strong>ion,<br />
1992 and 2003<br />
Table 9. Percentage <strong>of</strong><br />
adults, by<br />
employment<br />
st<strong>at</strong>us: 1992 and<br />
2003<br />
Employment st<strong>at</strong>us 1992 2003<br />
Full time 49 50<br />
Part time 13 13<br />
Unemployed 5 5<br />
Not <strong>in</strong> labor force 33 32<br />
NOTE: Detail may not sum to totals because <strong>of</strong><br />
round<strong>in</strong>g. <strong>Adults</strong> are def<strong>in</strong>ed as people 16 years <strong>of</strong><br />
age or older liv<strong>in</strong>g <strong>in</strong> households. <strong>Adults</strong> who could<br />
not be <strong>in</strong>terviewed due to language spoken or cognitive<br />
or mental disabilities (3 percent <strong>in</strong> 2003 and<br />
4 percent <strong>in</strong> 1992) are excluded from this table.<br />
SOURCE: U.S. Department <strong>of</strong> Educ<strong>at</strong>ion, Institute <strong>of</strong><br />
Educ<strong>at</strong>ion Sciences, N<strong>at</strong>ional Center for Educ<strong>at</strong>ion<br />
St<strong>at</strong>istics, 1992 N<strong>at</strong>ional Adult <strong>Literacy</strong> Survey and<br />
2003 N<strong>at</strong>ional Assessment <strong>of</strong> Adult <strong>Literacy</strong>.<br />
The employment st<strong>at</strong>us <strong>of</strong><br />
America’s adults did not<br />
change significantly<br />
between 1992 and 2003.<br />
Over 60 percent <strong>of</strong> all<br />
adults were employed<br />
ei<strong>the</strong>r full or part time.<br />
percent were employed full<br />
time (figure 17; results for <strong>the</strong><br />
document and quantit<strong>at</strong>ive<br />
scales are not shown here but<br />
are available on <strong>the</strong> NAAL<br />
website).<br />
The percentage <strong>of</strong> adults<br />
with Below Basic prose literacy<br />
who were employed full<br />
time <strong>in</strong>creased 6 percentage<br />
po<strong>in</strong>ts between 1992 and<br />
2003, and <strong>the</strong> percentage<br />
with Below Basic document<br />
literacy who were employed<br />
full time <strong>in</strong>creased 5 percentage<br />
po<strong>in</strong>ts (figure 17; document<br />
and quantit<strong>at</strong>ive results<br />
not shown). For adults with<br />
Basic prose literacy, 38 per-<br />
Figure 17. Percentage <strong>of</strong> adults <strong>in</strong> each employment<br />
c<strong>at</strong>egory, by prose literacy level: 1992 and 2003<br />
Percent<br />
employed<br />
100<br />
90<br />
80<br />
70<br />
60<br />
50<br />
40<br />
30<br />
20<br />
10<br />
0<br />
10<br />
20<br />
Percent not 30<br />
employed<br />
40<br />
50<br />
60<br />
70<br />
Full time<br />
29<br />
8<br />
6<br />
57<br />
35*<br />
10<br />
5<br />
51*<br />
1992 2003<br />
Below Basic<br />
Part time<br />
42<br />
12<br />
6<br />
40<br />
44<br />
12<br />
6<br />
38<br />
1992 2003<br />
Basic<br />
54<br />
15<br />
5<br />
26<br />
54<br />
14<br />
5<br />
27<br />
1992 2003<br />
Intermedi<strong>at</strong>e<br />
<strong>Literacy</strong> level and year<br />
Unemployed<br />
66<br />
14<br />
3<br />
17<br />
cent were not <strong>in</strong> <strong>the</strong> labor<br />
force and 6 percent were<br />
unemployed.<br />
Sixty-four percent <strong>of</strong> adults<br />
with Pr<strong>of</strong>icient prose literacy<br />
and 54 percent <strong>of</strong> adults with<br />
Intermedi<strong>at</strong>e prose literacy<br />
were employed full time<br />
(figure 17). Eighteen percent<br />
64<br />
14<br />
3<br />
18<br />
1992 2003<br />
Pr<strong>of</strong>icient<br />
Not <strong>in</strong> labor force<br />
* Significantly different from 1992.<br />
NOTE: Detail may not sum to totals because <strong>of</strong> round<strong>in</strong>g.<strong>Adults</strong> are def<strong>in</strong>ed as people 16 years <strong>of</strong> age or older liv<strong>in</strong>g<br />
<strong>in</strong> households. <strong>Adults</strong> who could not be <strong>in</strong>terviewed due to language spoken or cognitive or mental disabilities (3<br />
percent <strong>in</strong> 2003 and 4 percent <strong>in</strong> 1992) are excluded from this figure.<br />
SOURCE: U.S. Department <strong>of</strong> Educ<strong>at</strong>ion, Institute <strong>of</strong> Educ<strong>at</strong>ion Sciences, N<strong>at</strong>ional Center for Educ<strong>at</strong>ion St<strong>at</strong>istics, 1992<br />
N<strong>at</strong>ional Adult <strong>Literacy</strong> Survey and 2003 N<strong>at</strong>ional Assessment <strong>of</strong> Adult <strong>Literacy</strong>.<br />
16