A First Look at the Literacy of America's Adults in the 21st Century
A First Look at the Literacy of America's Adults in the 21st Century
A First Look at the Literacy of America's Adults in the 21st Century

Create successful ePaper yourself
Turn your PDF publications into a flip-book with our unique Google optimized e-Paper software.
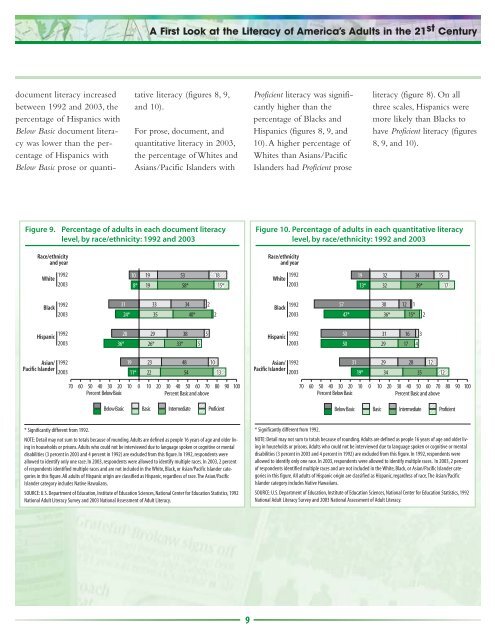
document literacy <strong>in</strong>creased<br />
between 1992 and 2003, <strong>the</strong><br />
percentage <strong>of</strong> Hispanics with<br />
Below Basic document literacy<br />
was lower than <strong>the</strong> percentage<br />
<strong>of</strong> Hispanics with<br />
Below Basic prose or quanti-<br />
A <strong>First</strong> <strong>Look</strong> <strong>at</strong> <strong>the</strong> <strong>Literacy</strong> <strong>of</strong> America’s <strong>Adults</strong> <strong>in</strong> <strong>the</strong> 21 st <strong>Century</strong><br />
t<strong>at</strong>ive literacy (figures 8, 9,<br />
and 10).<br />
For prose, document, and<br />
quantit<strong>at</strong>ive literacy <strong>in</strong> 2003,<br />
<strong>the</strong> percentage <strong>of</strong> Whites and<br />
Asians/Pacific Islanders with<br />
Figure 9. Percentage <strong>of</strong> adults <strong>in</strong> each document literacy<br />
level, by race/ethnicity: 1992 and 2003<br />
Race/ethnicity<br />
and year<br />
1992<br />
White<br />
2003<br />
Black<br />
1992<br />
2003<br />
Hispanic<br />
1992<br />
2003<br />
Asian/<br />
Pacific Islander<br />
1992<br />
2003<br />
31<br />
36*<br />
24*<br />
28<br />
19<br />
10<br />
8*<br />
11*<br />
19 53 18<br />
19 58* 15*<br />
33 34 2<br />
35 40* 2<br />
29 38 5<br />
26* 33* 5<br />
23 48 10<br />
22 54 13<br />
70 60 50 40 30 20 10 0 10 20 30 40 50 60 70 80 90 100<br />
Percent Below Basic Percent Basic and above<br />
Below Basic Basic Intermedi<strong>at</strong>e Pr<strong>of</strong>icient<br />
* Significantly different from 1992.<br />
NOTE: Detail may not sum to totals because <strong>of</strong> round<strong>in</strong>g. <strong>Adults</strong> are def<strong>in</strong>ed as people 16 years <strong>of</strong> age and older liv<strong>in</strong>g<br />
<strong>in</strong> households or prisons. <strong>Adults</strong> who could not be <strong>in</strong>terviewed due to language spoken or cognitive or mental<br />
disabilities (3 percent <strong>in</strong> 2003 and 4 percent <strong>in</strong> 1992) are excluded from this figure. In 1992, respondents were<br />
allowed to identify only one race. In 2003, respondents were allowed to identify multiple races. In 2003, 2 percent<br />
<strong>of</strong> respondents identified multiple races and are not <strong>in</strong>cluded <strong>in</strong> <strong>the</strong> White, Black, or Asian/Pacific Islander c<strong>at</strong>egories<br />
<strong>in</strong> this figure. All adults <strong>of</strong> Hispanic orig<strong>in</strong> are classified as Hispanic, regardless <strong>of</strong> race.The Asian/Pacific<br />
Islander c<strong>at</strong>egory <strong>in</strong>cludes N<strong>at</strong>ive Hawaiians.<br />
SOURCE: U.S. Department <strong>of</strong> Educ<strong>at</strong>ion, Institute <strong>of</strong> Educ<strong>at</strong>ion Sciences, N<strong>at</strong>ional Center for Educ<strong>at</strong>ion St<strong>at</strong>istics, 1992<br />
N<strong>at</strong>ional Adult <strong>Literacy</strong> Survey and 2003 N<strong>at</strong>ional Assessment <strong>of</strong> Adult <strong>Literacy</strong>.<br />
9<br />
Pr<strong>of</strong>icient literacy was significantly<br />
higher than <strong>the</strong><br />
percentage <strong>of</strong> Blacks and<br />
Hispanics (figures 8, 9, and<br />
10). A higher percentage <strong>of</strong><br />
Whites than Asians/Pacific<br />
Islanders had Pr<strong>of</strong>icient prose<br />
literacy (figure 8). On all<br />
three scales, Hispanics were<br />
more likely than Blacks to<br />
have Pr<strong>of</strong>icient literacy (figures<br />
8, 9, and 10).<br />
Figure 10. Percentage <strong>of</strong> adults <strong>in</strong> each quantit<strong>at</strong>ive literacy<br />
level, by race/ethnicity: 1992 and 2003<br />
Race/ethnicity<br />
and year<br />
1992<br />
White<br />
2003<br />
Black<br />
1992<br />
2003<br />
Hispanic<br />
1992<br />
2003<br />
Asian/<br />
Pacific Islander<br />
1992<br />
2003<br />
57<br />
47*<br />
50<br />
50<br />
31<br />
19<br />
13*<br />
19*<br />
32 34 15<br />
32 39* 17<br />
30 12 1<br />
36* 15* 2<br />
31 16 3<br />
29 17 4<br />
29 28 12<br />
34 35 12<br />
70 60 50 40 30 20 10 0 10 20 30 40 50 60 70 80 90 100<br />
Percent Below Basic Percent Basic and above<br />
Below Basic Basic Intermedi<strong>at</strong>e Pr<strong>of</strong>icient<br />
* Significantly different from 1992.<br />
NOTE: Detail may not sum to totals because <strong>of</strong> round<strong>in</strong>g. <strong>Adults</strong> are def<strong>in</strong>ed as people 16 years <strong>of</strong> age and older liv<strong>in</strong>g<br />
<strong>in</strong> households or prisons. <strong>Adults</strong> who could not be <strong>in</strong>terviewed due to language spoken or cognitive or mental<br />
disabilities (3 percent <strong>in</strong> 2003 and 4 percent <strong>in</strong> 1992) are excluded from this figure. In 1992, respondents were<br />
allowed to identify only one race. In 2003, respondents were allowed to identify multiple races. In 2003, 2 percent<br />
<strong>of</strong> respondents identified multiple races and are not <strong>in</strong>cluded <strong>in</strong> <strong>the</strong> White, Black, or Asian/Pacific Islander c<strong>at</strong>egories<br />
<strong>in</strong> this figure. All adults <strong>of</strong> Hispanic orig<strong>in</strong> are classified as Hispanic, regardless <strong>of</strong> race.The Asian/Pacific<br />
Islander c<strong>at</strong>egory <strong>in</strong>cludes N<strong>at</strong>ive Hawaiians.<br />
SOURCE: U.S. Department <strong>of</strong> Educ<strong>at</strong>ion, Institute <strong>of</strong> Educ<strong>at</strong>ion Sciences, N<strong>at</strong>ional Center for Educ<strong>at</strong>ion St<strong>at</strong>istics, 1992<br />
N<strong>at</strong>ional Adult <strong>Literacy</strong> Survey and 2003 N<strong>at</strong>ional Assessment <strong>of</strong> Adult <strong>Literacy</strong>.