A First Look at the Literacy of America's Adults in the 21st Century
A First Look at the Literacy of America's Adults in the 21st Century
A First Look at the Literacy of America's Adults in the 21st Century

Create successful ePaper yourself
Turn your PDF publications into a flip-book with our unique Google optimized e-Paper software.
<strong>of</strong> adults with Pr<strong>of</strong>icient prose<br />
literacy and 27 percent <strong>of</strong><br />
adults with Intermedi<strong>at</strong>e prose<br />
literacy were not <strong>in</strong> <strong>the</strong> labor<br />
force; 3 percent <strong>of</strong> adults with<br />
Pr<strong>of</strong>icient prose literacy and 5<br />
percent <strong>of</strong> adults with<br />
Intermedi<strong>at</strong>e prose literacy<br />
were unemployed.<br />
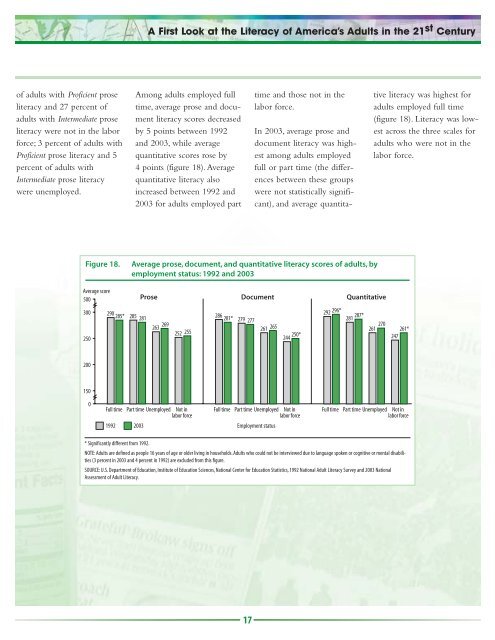
Figure 18. Average prose, document, and quantit<strong>at</strong>ive literacy scores <strong>of</strong> adults, by<br />
employment st<strong>at</strong>us: 1992 and 2003<br />
Average score<br />
500<br />
300<br />
250<br />
200<br />
150<br />
0<br />
290 285* 285 281<br />
A <strong>First</strong> <strong>Look</strong> <strong>at</strong> <strong>the</strong> <strong>Literacy</strong> <strong>of</strong> America’s <strong>Adults</strong> <strong>in</strong> <strong>the</strong> 21 st <strong>Century</strong><br />
Among adults employed full<br />
time, average prose and document<br />
literacy scores decreased<br />
by 5 po<strong>in</strong>ts between 1992<br />
and 2003, while average<br />
quantit<strong>at</strong>ive scores rose by<br />
4 po<strong>in</strong>ts (figure 18). Average<br />
quantit<strong>at</strong>ive literacy also<br />
<strong>in</strong>creased between 1992 and<br />
2003 for adults employed part<br />
Prose Document Quantit<strong>at</strong>ive<br />
263 269<br />
252 255<br />
Full time Part time Unemployed Not <strong>in</strong><br />
labor force<br />
286 281* 279 277<br />
17<br />
261 265<br />
244 250*<br />
Full time Part time Unemployed Not <strong>in</strong><br />
labor force<br />
1992 2003 Employment st<strong>at</strong>us<br />
time and those not <strong>in</strong> <strong>the</strong><br />
labor force.<br />
In 2003, average prose and<br />
document literacy was highest<br />
among adults employed<br />
full or part time (<strong>the</strong> differences<br />
between <strong>the</strong>se groups<br />
were not st<strong>at</strong>istically significant),<br />
and average quantita-<br />
292 296*<br />
281 287*<br />
261 270<br />
261*<br />
247<br />
Full time Part time Unemployed Not <strong>in</strong><br />
labor force<br />
* Significantly different from 1992.<br />
NOTE: <strong>Adults</strong> are def<strong>in</strong>ed as people 16 years <strong>of</strong> age or older liv<strong>in</strong>g <strong>in</strong> households. <strong>Adults</strong> who could not be <strong>in</strong>terviewed due to language spoken or cognitive or mental disabilities<br />
(3 percent <strong>in</strong> 2003 and 4 percent <strong>in</strong> 1992) are excluded from this figure.<br />
SOURCE: U.S. Department <strong>of</strong> Educ<strong>at</strong>ion, Institute <strong>of</strong> Educ<strong>at</strong>ion Sciences, N<strong>at</strong>ional Center for Educ<strong>at</strong>ion St<strong>at</strong>istics, 1992 N<strong>at</strong>ional Adult <strong>Literacy</strong> Survey and 2003 N<strong>at</strong>ional<br />
Assessment <strong>of</strong> Adult <strong>Literacy</strong>.<br />
tive literacy was highest for<br />
adults employed full time<br />
(figure 18). <strong>Literacy</strong> was lowest<br />
across <strong>the</strong> three scales for<br />
adults who were not <strong>in</strong> <strong>the</strong><br />
labor force.