International Trade Statistics - World Trade Organization
International Trade Statistics - World Trade Organization
International Trade Statistics - World Trade Organization

You also want an ePaper? Increase the reach of your titles
YUMPU automatically turns print PDFs into web optimized ePapers that Google loves.
I.<br />
I. WORLD TRADE DEVELOPMENTS<br />
Merchandise trade and GDP<br />
<strong>Trade</strong> slows down due to weakening demand from<br />
developed economies<br />
<strong>Trade</strong> slowed down in 2007 due to weakening demand from developed economies.<br />
Realignments in exchange rates and fl uctuations in the prices for commodities,<br />
such as oil and gas, introduced uncertainties into the global markets. Growth<br />
in world merchandise exports slipped to 6 per cent in real terms in 2007, following<br />
a year-to-year expansion of world gross domestic product (GDP) of 3.4 per cent.<br />
The slowdown of trade growth from 8.5 per cent in 2006 is due to a deceleration<br />
of import demand, mainly in the United States but also in Europe and Japan.<br />
<strong>Trade</strong> remained strong in most developing countries. Regions such as Africa, the<br />
Middle East, the Commonwealth of Independent States (CIS), developing Asia,<br />
and South and Central America showed sustained growth in their economies in<br />
2007. While higher commodity prices<br />
helped to improve the fi nancial situation<br />
of certain countries, higher energy and<br />
food prices also increased infl ationary<br />
pressures worldwide.<br />
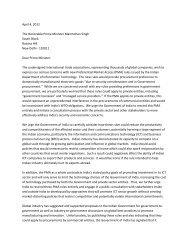
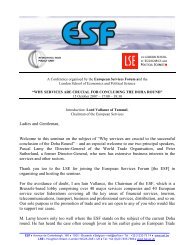
Chart I.1<br />
(Annual percentage change)<br />
10<br />
<br />
<br />
<br />
<br />
IN THIS CHAPTER :<br />
Merchandise trade and GDP<br />
Merchandise trade by product<br />
Regional trade flows<br />
Regional <strong>Trade</strong> Agreements<br />
Merchandise trade flows of<br />
Brazil, India and China<br />
Least-developed countries<br />
<br />
The Highlights<br />
<strong>Trade</strong> in services<br />
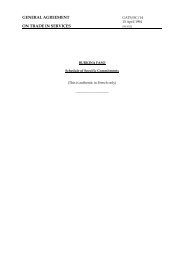
Volume of world merchandise exports<br />
and gross domestic product, 2000-2007<br />
IWORLD TRADE DEVELOPMENTS<br />
For the 2000-2007 period, exports<br />
on average increased by 2.7 percentage<br />
points faster than real gross domestic<br />
product. The only exception was in<br />
2001, when trade marginally declined<br />
due to the dot.com bubble burst.<br />
8<br />
6<br />
4<br />
2<br />
0<br />
-2<br />
2000-07 2001 2002 2003 2004 2005 2006 2007<br />
GDP<br />
Volume of total exports<br />
Merchandise trade by product<br />
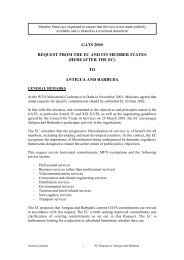
<strong>Trade</strong> in manufactured products is growing faster than trade in agriculture and<br />
in fuels and mining products<br />
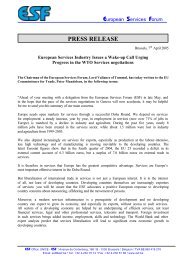
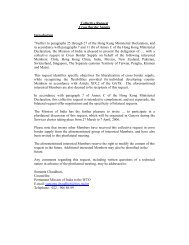
Exports of manufactured products expanded by 7.5 per cent in volume terms in 2007, maintaining its lead over both agriculture<br />
and fuels and mining products, which grew by 5 per cent and 3 per cent respectively. The deceleration in trade in manufactured<br />
products from the 10 per cent level achieved in 2006 is partly due to the slowdown of activity in major importing economies.<br />
Asian exports of manufactured products expanded by<br />
Chart I.2<br />
(Percentage change)<br />
Manufactures<br />
Mining<br />
Agriculture<br />
Volume growth of world merchandise trade<br />
by sector, 2007<br />
0.0 1.0 2.0 3.0 4.0 5.0 6.0 7.0 8.0<br />
13.5 per cent in 2007, but North American and European<br />
exports increased by only 4.5 per cent and 4 per<br />
cent respectively, almost half their 2006 rates. OPEC<br />
production, which declined in 2007, contributed to the<br />
stagnant volumes of fuels and mining exports from the<br />
Middle East. Crude oil exports from Africa grew by 4.5<br />
per cent, much higher than the 1.5 per cent increases in<br />
2005 and 2006. The CIS increased its exports of fuels<br />
and mining products by 7 per cent, the highest growth<br />
of all regions.<br />
1