International Trade Statistics - World Trade Organization
International Trade Statistics - World Trade Organization
International Trade Statistics - World Trade Organization

Create successful ePaper yourself
Turn your PDF publications into a flip-book with our unique Google optimized e-Paper software.
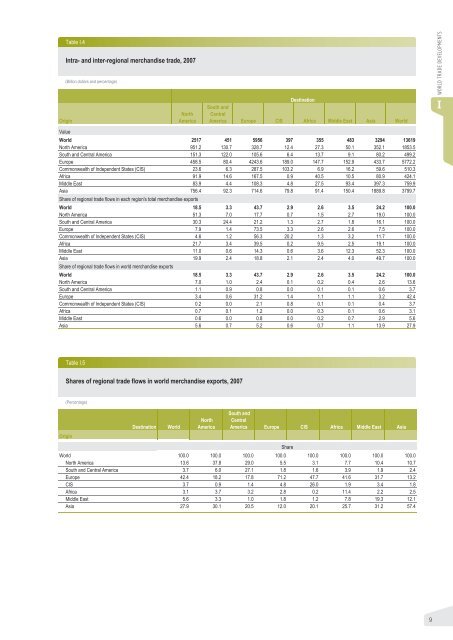
Table I.4<br />
Intra- and inter-regional merchandise trade, 2007<br />
(Billion dollars and percentage)<br />
Origin<br />
North<br />
America<br />
Destination<br />
South and<br />
Central<br />
America Europe CIS Africa Middle East Asia <strong>World</strong><br />
IWORLD TRADE DEVELOPMENTS<br />
Value<br />
<strong>World</strong> 2517 451 5956 397 355 483 3294 13619<br />
North America 951.2 130.7 328.7 12.4 27.3 50.1 352.1 1853.5<br />
South and Central America 151.3 122.0 105.6 6.4 13.7 9.1 80.2 499.2<br />
Europe 458.5 80.4 4243.6 189.0 147.7 152.9 433.7 5772.2<br />
Commonwealth of Independent States (CIS) 23.6 6.3 287.5 103.2 6.9 16.2 59.6 510.3<br />
Africa 91.9 14.6 167.5 0.9 40.5 10.5 80.9 424.1<br />
Middle East 83.9 4.4 108.3 4.8 27.5 93.4 397.3 759.9<br />
Asia 756.4 92.3 714.6 79.8 91.4 150.4 1889.8 3799.7<br />
Share of regional trade flows in each region's total merchandise exports<br />
<strong>World</strong> 18.5 3.3 43.7 2.9 2.6 3.5 24.2 100.0<br />
North America 51.3 7.0 17.7 0.7 1.5 2.7 19.0 100.0<br />
South and Central America 30.3 24.4 21.2 1.3 2.7 1.8 16.1 100.0<br />
Europe 7.9 1.4 73.5 3.3 2.6 2.6 7.5 100.0<br />
Commonwealth of Independent States (CIS) 4.6 1.2 56.3 20.2 1.3 3.2 11.7 100.0<br />
Africa 21.7 3.4 39.5 0.2 9.5 2.5 19.1 100.0<br />
Middle East 11.0 0.6 14.3 0.6 3.6 12.3 52.3 100.0<br />
Asia 19.9 2.4 18.8 2.1 2.4 4.0 49.7 100.0<br />
Share of regional trade flows in world merchandise exports<br />
<strong>World</strong> 18.5 3.3 43.7 2.9 2.6 3.5 24.2 100.0<br />
North America 7.0 1.0 2.4 0.1 0.2 0.4 2.6 13.6<br />
South and Central America 1.1 0.9 0.8 0.0 0.1 0.1 0.6 3.7<br />
Europe 3.4 0.6 31.2 1.4 1.1 1.1 3.2 42.4<br />
Commonwealth of Independent States (CIS) 0.2 0.0 2.1 0.8 0.1 0.1 0.4 3.7<br />
Africa 0.7 0.1 1.2 0.0 0.3 0.1 0.6 3.1<br />
Middle East 0.6 0.0 0.8 0.0 0.2 0.7 2.9 5.6<br />
Asia 5.6 0.7 5.2 0.6 0.7 1.1 13.9 27.9<br />
Table I.5<br />
Shares of regional trade flows in world merchandise exports, 2007<br />
(Percentage)<br />
Origin<br />
Destination<br />
<strong>World</strong><br />
North<br />
America<br />
South and<br />
Central<br />
America Europe CIS Africa Middle East Asia<br />
<strong>World</strong> 100.0 100.0 100.0 100.0 100.0 100.0 100.0 100.0<br />
North America 13.6 37.8 29.0 5.5 3.1 7.7 10.4 10.7<br />
South and Central America 3.7 6.0 27.1 1.8 1.6 3.9 1.9 2.4<br />
Europe 42.4 18.2 17.8 71.2 47.7 41.6 31.7 13.2<br />
CIS 3.7 0.9 1.4 4.8 26.0 1.9 3.4 1.8<br />
Africa 3.1 3.7 3.2 2.8 0.2 11.4 2.2 2.5<br />
Middle East 5.6 3.3 1.0 1.8 1.2 7.8 19.3 12.1<br />
Asia 27.9 30.1 20.5 12.0 20.1 25.7 31.2 57.4<br />
Share<br />
9