International Trade Statistics - World Trade Organization
International Trade Statistics - World Trade Organization
International Trade Statistics - World Trade Organization

Create successful ePaper yourself
Turn your PDF publications into a flip-book with our unique Google optimized e-Paper software.
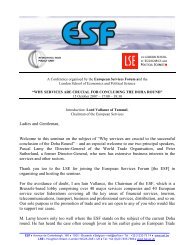
Table I.7<br />
<strong>World</strong> merchandise imports by region and selected economy, 1948, 1953, 1963, 1973, 1983, 1993, 2003 and 2007<br />
(Billion dollars and percentage)<br />
1948 1953 1963 1973 1983 1993 2003 2007<br />
Value<br />
<strong>World</strong> 62 85 164 595 1882 3787 7691 13968<br />
Share<br />
<strong>World</strong> 100.0 100.0 100.0 100.0 100.0 100.0 100.0 100.0<br />
North America 18.5 20.5 16.1 17.2 18.5 21.4 22.5 19.4<br />
United States 13.0 13.9 11.4 12.3 14.3 15.9 16.9 14.5<br />
Canada 4.4 5.5 3.9 4.2 3.4 3.7 3.2 2.8<br />
Mexico 1.0 0.9 0.8 0.6 0.7 1.8 2.3 2.1<br />
South and Central America 10.4 8.3 6.0 4.4 3.8 3.3 2.5 3.3<br />
Brazil 1.8 1.6 0.9 1.2 0.9 0.7 0.7 0.9<br />
Argentina 2.5 0.9 0.6 0.4 0.2 0.4 0.2 0.3<br />
Europe 45.3 43.7 52.0 53.3 44.2 44.6 45.0 43.4<br />
Germany a 2.2 4.5 8.0 9.2 8.1 9.0 7.9 7.6<br />
United Kingdom 13.4 11.0 8.5 6.5 5.3 5.5 5.2 4.4<br />
France 5.5 4.9 5.3 6.3 5.6 5.7 5.2 4.4<br />
Italy 2.5 2.8 4.6 4.7 4.2 3.9 3.9 3.6<br />
Commonwealth of Independent States (CIS) b - - - - - 1.2 1.7 2.7<br />
Africa 8.1 7.0 5.2 3.9 4.6 2.6 2.1 2.6<br />
South Africa c 2.5 1.5 1.1 0.9 0.8 0.5 0.5 0.7<br />
Middle East 1.8 2.1 2.3 2.7 6.2 3.3 2.7 3.4<br />
Asia 13.9 15.1 14.1 14.9 18.5 23.6 23.5 25.3<br />
China 0.6 1.6 0.9 0.9 1.1 2.7 5.4 6.8<br />
Japan 1.1 2.8 4.1 6.5 6.7 6.4 5.0 4.4<br />
India 2.3 1.4 1.5 0.5 0.7 0.6 0.9 1.6<br />
Australia and New Zealand 2.9 2.3 2.2 1.6 1.4 1.5 1.4 1.4<br />
Six East Asian traders 3.5 3.7 3.1 3.7 6.1 10.3 8.6 8.7<br />
Memorandum item:<br />
EU d - - 29.0 39.2 39.2 39.2 41.8 39.9<br />
USSR, former 1.9 3.3 4.3 3.5 4.3 - - -<br />
GATT/WTO Members e 58.1 66.9 75.3 85.5 81.3 88.7 94.9 95.0<br />
IWORLD TRADE DEVELOPMENTS<br />
a Figures refer to the Fed. Rep. of Germany from 1948 through 1983.<br />
b Figures are significantly affected by i) changes in the country composition of the region and major adjustment in trade conversion factors between 1983 and 1993 and ii) including the mutual trade flows of the Baltic<br />
States and the CIS between 1993 and 2003.<br />
c Beginning with 1998, figures refer to South Africa only and no longer to the Southern African Customs Union.<br />
d Figures refer to the EEC(6) in 1963, EC(9) in 1973, EC(10) in 1983, EU(12) in 1993, and EU(25) in 2003 and EU(27) in 2007.<br />
e Membership as of the year stated.<br />
Note: Between 1973 and 1983 and between 1993 and 2003 export shares were significantly influenced by oil price developments.<br />
11