Fly-tipping: Causes, Incentives and Solutions - Keep Britain Tidy
Fly-tipping: Causes, Incentives and Solutions - Keep Britain Tidy
Fly-tipping: Causes, Incentives and Solutions - Keep Britain Tidy

Create successful ePaper yourself
Turn your PDF publications into a flip-book with our unique Google optimized e-Paper software.
UCL JILL DANDO INSTITUTE OF CRIME SCIENCE<br />
<strong>Fly</strong>-<strong>tipping</strong>: <strong>Causes</strong>, <strong>Incentives</strong> <strong>and</strong><br />
<strong>Solutions</strong><br />
Barry Webb<br />
Ben Marshall<br />
Sarah Czarnomski<br />
Nick Tilley<br />
Jill D<strong>and</strong>o Institute of Crime Science<br />
University College London<br />
31 May 2006
<strong>Fly</strong>-<strong>tipping</strong>: <strong>Causes</strong>, <strong>Incentives</strong> <strong>and</strong> <strong>Solutions</strong><br />
Commissioned by the<br />
Department for Environment<br />
Food <strong>and</strong> Rural Affairs<br />
ii
<strong>Fly</strong>-<strong>tipping</strong>: <strong>Causes</strong>, <strong>Incentives</strong> <strong>and</strong> <strong>Solutions</strong><br />
EXECUTIVE SUMMARY<br />
<strong>Fly</strong>-<strong>tipping</strong> is currently receiving a good deal of policy attention from the UK<br />
government. While the Environment Agency is responsible for dealing with the<br />
serious end of the problem, it is local authorities which have to tackle the large<br />
volume of fly-<strong>tipping</strong>. Much has been done to increase the powers available to<br />
local authorities in taking action against fly-tippers. However, there is now<br />
growing interest in working out how to prevent fly-<strong>tipping</strong> from happening in<br />
the first place.<br />
The aims of this project were to develop a better underst<strong>and</strong>ing of the<br />
incentives for, <strong>and</strong> ‘causes’ of fly-<strong>tipping</strong> as it affects local authorities, <strong>and</strong> to<br />
provide advice <strong>and</strong> guidance on how to develop more effective strategies<br />
aimed at reducing <strong>and</strong> preventing the problem.<br />
The project involved collecting <strong>and</strong> analysing information from a number of<br />
different sources:<br />
• a thorough review of the available literature on fly-<strong>tipping</strong>;<br />
• interrogation of the <strong>Fly</strong>capture database;<br />
• a national survey of all waste collection <strong>and</strong> disposal authorities in<br />
Engl<strong>and</strong>;<br />
• case study work in 10 areas;<br />
• a national survey of 2,000 householders;<br />
• an analysis of data on convicted fly-tippers; <strong>and</strong><br />
• one-to-one interviews with 10 offenders <strong>and</strong> 10 trades people.<br />
The study produced two documents: A research report, describing the results<br />
of the research <strong>and</strong> drawing out the implications for policy <strong>and</strong> practice; <strong>and</strong> a<br />
Good Practice Guide for local authorities, with practice recommendations<br />
supported with evidence. This is the research report.<br />
Literature review<br />
The research literature on fly <strong>tipping</strong> <strong>and</strong> responses to it is sparse. Such<br />
evidence as there is suggests, however, that fly-<strong>tipping</strong> comprises a serious<br />
problem:<br />
• Crime <strong>and</strong> Disorder Reduction Partnership audits find that it is a major<br />
problem in many areas. For example it was found to be citizens’ top<br />
concern in Aston in 2004;<br />
• a 2001-2002 survey by EnCams found that almost three quarters of local<br />
authorities thought fly <strong>tipping</strong> a significant or major problem;<br />
• fly-<strong>tipping</strong> has been found to cause a wide range of problems to the natural,<br />
social <strong>and</strong> economic environment, such as disease transmission, soil<br />
contamination, the attraction of other crimes to affected neighbourhoods,<br />
increased fear of crime, substantial clear-up costs <strong>and</strong> discouragement of<br />
inward investment.<br />
In relation to patterns of, explanations for <strong>and</strong> preventive responses to fly<strong>tipping</strong>,<br />
directly related <strong>and</strong> ancillary literature suggests that:<br />
iii
<strong>Fly</strong>-<strong>tipping</strong>: <strong>Causes</strong>, <strong>Incentives</strong> <strong>and</strong> <strong>Solutions</strong><br />
• <strong>Fly</strong>-<strong>tipping</strong> will occur where perceived benefits exceed perceived costs,<br />
where weaknesses in collection <strong>and</strong> disposal services provoke those<br />
with waste to get rid of, <strong>and</strong> where those producing <strong>and</strong> disposing of<br />
waste are ignorant of their responsibilities for or methods of disposing<br />
of it lawfully;<br />
• incentives for fly-<strong>tipping</strong> may inadvertently arise from l<strong>and</strong>fill tax, the<br />
principle of producer payment, <strong>and</strong> reductions in the economic return<br />
from sale of spent goods, for example when the price of scrap metal<br />
has fallen;<br />
• there is a range of rather different fly-<strong>tipping</strong> problems, which involve<br />
different forms of waste (for example household waste, construction<br />
waste, green materials), different places (for example alleyways, poorly<br />
lit access roads, unused industrial structures) <strong>and</strong> different sorts of<br />
perpetrator (for example householders, organised criminals, travellers);<br />
• potential methods of preventing fly-<strong>tipping</strong> fall into several categories:<br />
increasing difficulty, increasing risk, reducing reward, reducing<br />
provocation <strong>and</strong> removing excuses for offenders.<br />
Adopting a problem-solving approach will require that each different type of<br />
fly-<strong>tipping</strong> problem be subjected to careful analysis in order to work through<br />
which menu of plausible preventive responses will be worth trying. Moreover<br />
evidence of effectiveness would need to be collected to learn what works best<br />
under which circumstances. There is little evidence that this type of work is<br />
currently taking place.<br />
<strong>Fly</strong>capture<br />
<strong>Fly</strong>capture was launched by the Environment Agency in April 2004. All local<br />
authorities <strong>and</strong> the Environment Agency are required to submit monthly<br />
returns to it on the number, size, waste-types <strong>and</strong> location-types of fly-tips.<br />
This provides a national picture of the fly-<strong>tipping</strong> problems faced by local<br />
authorities. Several patterns emerged from the data:<br />
• Monthly fly-tips recorded from July 2004 to June 2005 show a slight<br />
downward trend with a pronounced winter dip;<br />
• there is an average of 250 recorded tips per month per local authority,<br />
but with huge variations. Five per cent of local authorities account for<br />
45% of all fly-tips;<br />
• there are higher rates of fly-<strong>tipping</strong> in more densely populated areas,<br />
<strong>and</strong> most especially in those suffering multiple deprivation, notably<br />
where there is overcrowding, poverty <strong>and</strong> unemployment. Opportunities<br />
to store waste <strong>and</strong> transport it for legal disposal at civic amenity sites<br />
may be limited for residents here;<br />
• recorded fly-<strong>tipping</strong> occurs most commonly on that l<strong>and</strong> where there is<br />
a local authority interest: highways, council l<strong>and</strong>, alleyways <strong>and</strong><br />
footpaths;<br />
• most fly-tips involve relatively small quantities, no more than a boot or<br />
small van-full;<br />
• household waste is the most commonly tipped type of waste. <strong>Fly</strong>-tipped<br />
hazardous waste is relatively rarely recorded.<br />
iv
<strong>Fly</strong>-<strong>tipping</strong>: <strong>Causes</strong>, <strong>Incentives</strong> <strong>and</strong> <strong>Solutions</strong><br />
Waste authority survey<br />
All waste collection <strong>and</strong> disposal authorities in Engl<strong>and</strong> were surveyed<br />
yielding 118 responses (30%).<br />
The strong view of waste authorities is that there are two key drivers of fly<strong>tipping</strong>:<br />
• the costs of legitimate disposal; <strong>and</strong><br />
• the availability of civic amenity <strong>and</strong> other waste disposal sites.<br />
There was little evidence of a strategic response to fly-<strong>tipping</strong>. Seventy-six per<br />
cent said they had no written strategy for reducing it, <strong>and</strong> 68% indicated that<br />
there had been no data analysis to inform strategy or tactics. Whilst<br />
occasional work with other bodies was quite common regular or formal<br />
partnership was much rarer.<br />
The dominant response to fly-<strong>tipping</strong> was to clear the tip quickly in accordance<br />
with the BVPIs. Enforcement <strong>and</strong> education were the most often used<br />
preventive strategies though they were perceived to be less effective than less<br />
often used measures such as restriction of access to tip sites, provision of<br />
community skips <strong>and</strong> provision of free collection services for bulky items.<br />
CCTV was commonly used though was also the measure whose<br />
effectiveness local authorities felt least able to estimate. That said, throughout<br />
this piece of work there were very few signs of systematic or rigorous efforts<br />
to establish the outcome effectiveness of any of the measures put in place.<br />
Case studies<br />
The ten case study areas were those making returns to the survey of waste<br />
authorities who suggested that they had good data <strong>and</strong> had implemented<br />
successful interventions. Enthusiastic, co-operative <strong>and</strong> committed officials<br />
were found in each area visited. Yet the data were generally found on closer<br />
inspection to be poor. Little systematic analysis had been undertaken, even<br />
where data were available. Different problems generally were not, <strong>and</strong> could<br />
not be discriminated, even in most of these energetic <strong>and</strong> innovative areas.<br />
Systematic local evaluation of the effectiveness of the measures put in place<br />
was very rare. Nevertheless, a range of promising interventions was identified,<br />
as highlighted in the sister publication to this research report – the Good<br />
Practice Guide.<br />
The householder survey<br />
The household survey achieved a response rate of 65%, with 1,196<br />
successful interviews. It asked respondents both whether they had fly-tipped<br />
<strong>and</strong> whether that had been tempted to do so. Only one per cent said they had<br />
fly-tipped <strong>and</strong> a further 3% had been tempted. This seems to show a low level<br />
of public involvement in fly-<strong>tipping</strong> <strong>and</strong> quite a strong resistance to temptation.<br />
The most frequently mentioned reasons for fly-<strong>tipping</strong> (or being tempted into it)<br />
included the fact that the local tip was closed (24%), lack of storage space for<br />
v
<strong>Fly</strong>-<strong>tipping</strong>: <strong>Causes</strong>, <strong>Incentives</strong> <strong>and</strong> <strong>Solutions</strong><br />
rubbish (24%), lack of transport to the local tip (18%) <strong>and</strong> not knowing where<br />
to dispose of rubbish (18%). The respondents as a whole expressed high<br />
levels of satisfaction with their local tips. The largest problem was with<br />
queuing where 15% rated their local facilities as poor or very poor.<br />
Convicted fly-tippers<br />
The number of prosecutions for fly-<strong>tipping</strong> offences has increased rapidly<br />
since 1991. Roughly three in five of those prosecuted had been convicted of<br />
only one offence. Two fifths had been convicted of two or more. Six per cent<br />
of those convicted accounted for 22% of the offences. There seems to be a<br />
small number of relatively incorrigible prolific offenders <strong>and</strong> a larger number of<br />
occasional more easily deterred individuals. The more prolific fly-<strong>tipping</strong><br />
offenders tended to be specialists, which the more occasional offenders<br />
appeared to have been involved in a wider range of offences of which fly<strong>tipping</strong><br />
was but one. This suggests different categories of offender in relation<br />
to whom different preventive responses will be appropriate.<br />
Offender <strong>and</strong> trades people interviews<br />
For traders, avoiding the costs of legitimate waste disposal facilities emerged<br />
as the strongest motive for fly-<strong>tipping</strong>. It was not, however, simply the fact that<br />
they were charged that is the issue but how pricing practices affect their<br />
competitiveness locally. They listed a range of what they saw as practices that<br />
tempted them into fly-<strong>tipping</strong> either because they saw them as inherently<br />
unfair or because they felt that these disadvantaged them in relation to their<br />
competitors who may be charged less.<br />
The availability of tip sites was an issue for traders insofar as this could impact<br />
also on their business. This was not so much to do with the distance needed<br />
to travel to the site, but more to do with how the tip site operated. Inconvenient<br />
opening hours was an oft mentioned frustration. This was particularly the case<br />
in winter months when daylight hours meant the sites often closed early.<br />
Another issue which emerged strongly in relation to tip sites was information<br />
about where they were. Traders often complained about the lack of<br />
information. The experience of the researchers also was that such information<br />
was not easily obtained, even from the local authority or civic amenity site<br />
workers.<br />
Finally, the duty of care system seems to have fallen into disrepute. Some<br />
businesses see no incentive for buying a waste carrier licence. Some feel that<br />
the system disadvantaged small businesses as the cost per vehicle was much<br />
higher for them than their larger competitors. Some are unaware of the recent<br />
duty of care legislation, <strong>and</strong> those that are cannot see how it would make<br />
much difference to fly-<strong>tipping</strong>. Overall, the picture painted is of a system which<br />
actually at times made it quite hard to behave honestly <strong>and</strong> legally. There<br />
seem to be few incentives to comply with the duty of care regulations, <strong>and</strong><br />
those that did felt disadvantaged competitively.<br />
vi
<strong>Fly</strong>-<strong>tipping</strong>: <strong>Causes</strong>, <strong>Incentives</strong> <strong>and</strong> <strong>Solutions</strong><br />
In terms of householders, black bin bags or household rubbish consistently<br />
emerge as the main fly-tip problem. Costs of legitimate disposal emerge as<br />
less of driver for fly-<strong>tipping</strong> than being able to use a civic amenity site.<br />
Householders fly-tipped because the site was closed or they didn’t have<br />
transport to get to it.<br />
Conclusions<br />
<strong>Fly</strong>-<strong>tipping</strong> is widespread. There is, however, not one problem but a variety of<br />
separate ones, distinguishable in terms of places, people, materials, <strong>and</strong><br />
opportunities for legal as well as illegal disposal. Different problems call for<br />
different solutions. Careful <strong>and</strong> detailed analysis is needed to tease them out.<br />
This is not currently undertaken in local authorities. Indeed, notwithst<strong>and</strong>ing<br />
the development of <strong>Fly</strong>capture it is not often possible given the forms of data<br />
collection that are undertaken.<br />
Local authority policies <strong>and</strong> practices can inadvertently create temptations <strong>and</strong><br />
opportunities for fly-<strong>tipping</strong>. Opening hours of, information systems relating to,<br />
sites for, rules of, accessibility to, <strong>and</strong> patterns of charges for civic amenity<br />
sites can all be configured in ways more or less conducive to fly-<strong>tipping</strong> by<br />
householders, businesses, waste carriers <strong>and</strong> travellers. Likewise, waste<br />
collection <strong>and</strong> clear-up practices may also be important. Here there may be<br />
scope, for example, to differentiate the needs of densely populated, relatively<br />
poor inner-city residential areas <strong>and</strong> the suburbs in terms of collection<br />
arrangements. At a national level, waste carriage licensing arrangements,<br />
duty of care responsibilities, <strong>and</strong> penalties for fly-<strong>tipping</strong> also emerged as<br />
significant parts of the opportunity structures for, risks of <strong>and</strong> rewards for fly<strong>tipping</strong><br />
or legal disposal of waste material, although these were the main focus<br />
of this piece of work.<br />
There is scope for a more strategic, joined up, problem-solving approach to<br />
fly-<strong>tipping</strong> with greater use of analysis, more co-operation between authorities,<br />
the police <strong>and</strong> the Environment Agency, <strong>and</strong> stronger evaluation of initiatives<br />
to build a firmer knowledge-base for dealing with the issues. This will be more<br />
promising than current approaches, which tend to stress enforcement when<br />
the opportunity arises <strong>and</strong> clearance after the event.<br />
vii
<strong>Fly</strong>-<strong>tipping</strong>: <strong>Causes</strong>, <strong>Incentives</strong> <strong>and</strong> <strong>Solutions</strong><br />
ACKNOWLEDGEMENTS<br />
Many people have helped us with various parts of this study, <strong>and</strong> we thank<br />
them all. We would like to acknowledge the following for their particular<br />
assistance <strong>and</strong> support:<br />
Joe Speck <strong>and</strong> Sally Kendall from the Department for the Environment Food<br />
<strong>and</strong> Rural Affairs (Defra); Simon Baxter, London Borough of Southwark; Dave<br />
Rounding, Buckinghamshire County Council; Kevin Moore, Local Government<br />
Association; <strong>and</strong> Alan D’Arcy, Environment Agency.<br />
We would also like to extend particular thanks to Helen Day, Craig Medhurst,<br />
James Parry, John Seddon, Haley Garret, Hugh Murphy, Melanie Price, Colin<br />
Newmarch, Graham Perrior, PC Kevin Warner, Gary Brown, Rob Dalby, Dave<br />
Pascoe, Ron Dawes, Sarah Veitch, Duncan Hollingworth, Bill Hickson, Ian<br />
Cantley <strong>and</strong> the many others who kindly gave us their time to speak to us<br />
during the course of our research.<br />
viii
<strong>Fly</strong>-<strong>tipping</strong>: <strong>Causes</strong>, <strong>Incentives</strong> <strong>and</strong> <strong>Solutions</strong><br />
CONTENTS<br />
Executive Summary ........................................................................................ iii<br />
Acknowledgements........................................................................................viii<br />
Contents ......................................................................................................... ix<br />
1 Introduction <strong>and</strong> approach to the study.........................................................1<br />
2 What the literature tells us ............................................................................3<br />
3 What <strong>Fly</strong>capture tells us..............................................................................24<br />
4 Practice <strong>and</strong> capacity in waste authorities ..................................................39<br />
4.1 The Waste Authority survey.............................................................39<br />
4.2 The case studies .............................................................................46<br />
5 The offender’s perspective..........................................................................49<br />
5.1 Prosecutions <strong>and</strong> criminal careers...................................................49<br />
5.2 The household survey .....................................................................57<br />
ix
<strong>Fly</strong>-<strong>tipping</strong>: <strong>Causes</strong>, <strong>Incentives</strong> <strong>and</strong> <strong>Solutions</strong><br />
1 Introduction <strong>and</strong> approach to the study<br />
Background<br />
<strong>Fly</strong>-<strong>tipping</strong> is currently receiving a good deal of policy attention from the UK<br />
government. While the Environment Agency is responsible for dealing with the<br />
serious end of the problem, it is local authorities who have to tackle the large<br />
volume of fly-<strong>tipping</strong>. Much has been done to increase the powers of local<br />
authorities to take action against fly-tippers. There is now, however, more<br />
interest in working out how to prevent fly-<strong>tipping</strong> from happening in the first<br />
place. Little is known about the problem, though, to enable effective<br />
preventative strategies to be developed locally <strong>and</strong> nationally.<br />
Aims <strong>and</strong> approach of the project<br />
The aim of the project is to develop a better underst<strong>and</strong>ing of the scale <strong>and</strong><br />
nature of the problem as it affects local authorities, <strong>and</strong> develop advice <strong>and</strong><br />
guidance on how to develop more effective strategies aimed at reducing <strong>and</strong><br />
preventing the problem. In order to do this, the project takes a problem<br />
oriented approach to the research. Problem-oriented approaches to crime <strong>and</strong><br />
anti-social behaviour have generally found it useful to identify sub-sets of<br />
problems, to underst<strong>and</strong> what drives or ‘causes’ them <strong>and</strong> consequently what<br />
might work as a preventative response to each.<br />
Methodology<br />
The approach to this study involved a number of different data collection<br />
exercises:<br />
1. Literature review – a thorough review of the available literature on fly<strong>tipping</strong>,<br />
internationally, <strong>and</strong> including ‘grey’ literature (PhD theses etc)<br />
2. <strong>Fly</strong>capture analysis – interrogation of the <strong>Fly</strong>capture database to<br />
provide a general description of the extent <strong>and</strong> distribution of the<br />
problem, what is dumped <strong>and</strong> the kinds of location used for fly-<strong>tipping</strong><br />
3. National Survey of all Waste Collection <strong>and</strong> Disposal Authorities<br />
in Engl<strong>and</strong> – to provide <strong>and</strong> an assessment of current practices <strong>and</strong><br />
policies, <strong>and</strong> the capacity to undertake problem-solving work locally<br />
4. Case study work in 10 areas – to examine data in more depth <strong>and</strong><br />
provide more detailed descriptions of problems, identify <strong>and</strong> illustrate<br />
good practice, <strong>and</strong> evaluate any interventions<br />
5. National household survey – a module was developed for inclusion in<br />
the National Statistics Omnibus survey of a r<strong>and</strong>om sample of 2,000<br />
householders. The purpose was to provide an assessment of the scale<br />
<strong>and</strong> nature of fly-<strong>tipping</strong> by householders, their motives for fly-<strong>tipping</strong><br />
<strong>and</strong> the effectiveness of current waste collection <strong>and</strong> disposal services.<br />
1
<strong>Fly</strong>-<strong>tipping</strong>: <strong>Causes</strong>, <strong>Incentives</strong> <strong>and</strong> <strong>Solutions</strong><br />
6. Analysis of data on convicted fly-tippers – to provide a picture of<br />
current enforcement activity, trends <strong>and</strong> outcomes in prosecutions <strong>and</strong><br />
profile fly-tippers in terms of their other possible criminal activity<br />
7. One-to-one interviews with offenders <strong>and</strong> trades people – to<br />
explore the motivations <strong>and</strong> drivers for fly-<strong>tipping</strong>, <strong>and</strong> identify issues<br />
for attention that could remove the ‘causes’ of fly-<strong>tipping</strong><br />
Products<br />
The study has produced two documents:<br />
• A full research report for Defra, describing the results of the research <strong>and</strong><br />
drawing out the implications for policy <strong>and</strong> practice<br />
• A Good Practice Guide for local authorities, with practice<br />
recommendations supported with evidence <strong>and</strong> presented as simply <strong>and</strong><br />
succinctly as possible.<br />
This is the research report.<br />
2
<strong>Fly</strong>-<strong>tipping</strong>: <strong>Causes</strong>, <strong>Incentives</strong> <strong>and</strong> <strong>Solutions</strong><br />
2 What the literature tells us<br />
There is a very sparse research literature on fly-<strong>tipping</strong>. A search of academic<br />
databases, in Engl<strong>and</strong>, Europe <strong>and</strong> the USA, unearthed few pieces of<br />
published work <strong>and</strong> just one piece of ‘grey literature’ (Old, 2003). This review<br />
has been exp<strong>and</strong>ed, therefore, to include literature on related behaviours of<br />
littering <strong>and</strong> ab<strong>and</strong>oned vehicles on the basis that these might lend some<br />
insight into the problem of fly-<strong>tipping</strong>. It also includes various surveys <strong>and</strong><br />
other small unpublished pieces of analysis conducted locally.<br />
The current context – roles <strong>and</strong> responsibilities<br />
<strong>Fly</strong>-<strong>tipping</strong>, defined by Defra (www.Defra.gov.uk) as ‘the illegal disposal of<br />
waste’, is illegal under section 33 of the Environmental Protection Act (1990,<br />
c.43 part II). In addition to the actual <strong>tipping</strong> of waste, the Act also makes it an<br />
offence to h<strong>and</strong>le waste carelessly (so-called duty of care offences) or without<br />
a waste management licence. Data discussed later in this report shows how<br />
convictions for all these offences have grown continually since 1990. Much of<br />
what follows, however, refers to the first of these – the <strong>tipping</strong> of waste<br />
illegally.<br />
The powers available to enforcement agencies (the Environment Agency <strong>and</strong><br />
local authorities) <strong>and</strong> the penalties available to the courts have been<br />
substantially increased by the Clean Neighbourhoods <strong>and</strong> Environment Act<br />
(2005). Specifically, it:<br />
• raises the maximum penalty fine available in the Magistrates Court for fly<strong>tipping</strong><br />
from £20k to £50k;<br />
• makes a guilty offender pay for all court <strong>and</strong> investigation costs that<br />
enforcement agencies had to pay in bringing the action to court;<br />
• allows courts to award clean up costs to enforcement agencies <strong>and</strong><br />
l<strong>and</strong>owners/occupiers;<br />
• provides for forfeiture of vehicles used in fly-<strong>tipping</strong>;<br />
• gives waste collection authorities <strong>and</strong> the Environment Agency power to<br />
stop <strong>and</strong> search vehicles (a police officer must still be present to stop a<br />
vehicle) which are used for fly-<strong>tipping</strong>, carrying waste when not registered<br />
as a waste carrier, or committing a waste duty of care offence;<br />
• allows fixed penalty notices for certain regulatory offences.<br />
Importantly, all acts of fly-<strong>tipping</strong> are now arrestable offences providing local<br />
authorities <strong>and</strong> the Environment Agency with increased police support with<br />
their enforcement strategies.<br />
In addition to providing greater powers to local authorities <strong>and</strong> the courts, the<br />
government is also encouraging greater attention to the problem locally<br />
through the establishment in 2005 of a Best Value Performance Indicator<br />
(BVPI) on fly-<strong>tipping</strong> (BVPI 199d). Progress against this BVPI is measured by<br />
local authority returns to the national <strong>Fly</strong>capture database, with progress<br />
indicated through a reduction in the number of fly-<strong>tipping</strong> incidents reported<br />
over consecutive years <strong>and</strong> an increasing number of enforcement actions<br />
3
<strong>Fly</strong>-<strong>tipping</strong>: <strong>Causes</strong>, <strong>Incentives</strong> <strong>and</strong> <strong>Solutions</strong><br />
taken against fly-tippers (ODPM, 2005). This particular BVPI sits within the<br />
wider context of Public Service Agreement (PSA) target 8 – ‘to lead the<br />
delivery of cleaner, safer, greener public spaces <strong>and</strong> improvement of the<br />
quality of the built environment in deprived areas <strong>and</strong> across the country, with<br />
measurable improvement by 2008’ (ODPM, 2005).<br />
Responsibility for dealing with fly-<strong>tipping</strong> <strong>and</strong> fly-tippers rests primarily with the<br />
Environment Agency <strong>and</strong> local authorities. In order to clarify who deals with<br />
what, a working protocol has been agreed (Working Better Together, <strong>Fly</strong><strong>tipping</strong><br />
Protocol, 6, 2005). The agreement, in essence, is that the Environment<br />
Agency will deal with the more serious fly-<strong>tipping</strong> problems irrespective of<br />
where they occur. These are defined as those involving large scale dumping<br />
(more than a lorry load – approx. 20m 3 ), or tipped by an organised gang or<br />
group of offenders or involving certain hazardous wastes. Local authorities are<br />
responsible for smaller fly-tips on public l<strong>and</strong>, roads, <strong>and</strong> by-ways.<br />
In cases where the waste is tipped on private l<strong>and</strong>, however, it is the<br />
responsibility of the l<strong>and</strong>owner to remove the waste. Indeed if they have<br />
deposited, knowingly caused or permitted the deposit then a notice can now<br />
be served on either the occupier or the l<strong>and</strong>owner by the enforcement<br />
authority requiring them to remove the waste. Appeals can be made to a<br />
Magistrates Court, within 21 days (Section 59, Environmental Protection Act<br />
1990). Private l<strong>and</strong> owners include organisations such as the National Trust,<br />
Network Rail, British Waterways <strong>and</strong> Highways Authorities who own<br />
substantial amounts of l<strong>and</strong>; through to farmers <strong>and</strong> urban residents with<br />
much smaller plots of l<strong>and</strong>. All have to pay the cost of dealing with fly-<strong>tipping</strong>.<br />
How their responsibility for keeping communities clean of waste are carried<br />
out by local authorities can be complicated by the way in which the roles of<br />
waste collection <strong>and</strong> waste disposal are organised. This can lead to some<br />
perverse incentives. In two-tiered authorities, the roles of waste collection <strong>and</strong><br />
waste disposal are separated with the County Council taking responsibility for<br />
waste disposal, including managing the Civic Amenity sites, while the<br />
Local/District Authority deals with the waste collection. Under this<br />
arrangement, it is the local/district authorities that bear most of the costs of fly<strong>tipping</strong>.<br />
They bear all the costs of the clean up, with waste disposal authorities<br />
bearing the cost of disposal. Since it costs waste disposal authorities the<br />
same amount to dispose of household waste whether it is collected, brought<br />
to a civic amenity site or fly-tipped, the only actual additional cost of fly-<strong>tipping</strong><br />
on waste disposal authorities is the loss of revenue in cases where the waste<br />
usually carries a charge for its disposal, such as trade or hazardous waste.<br />
Waste Disposal Authorities are concerned with meeting targets for re-cycling<br />
<strong>and</strong> minimising use of l<strong>and</strong>fill sites. They may, therefore, introduce policies<br />
<strong>and</strong> practices, such as alternating refuse/recycling collection, closed lid <strong>and</strong><br />
no side-waste policies, which make it harder for people to dispose of waste<br />
properly. The effect of this could be to tempt more people into fly-<strong>tipping</strong>,<br />
thereby increasing the burden on their waste collection colleagues but not on<br />
themselves. In unitary authorities, however, where the same organisation is<br />
responsible for both waste collection <strong>and</strong> disposal services the potential for<br />
4
<strong>Fly</strong>-<strong>tipping</strong>: <strong>Causes</strong>, <strong>Incentives</strong> <strong>and</strong> <strong>Solutions</strong><br />
such perverse incentives is less. In this situation, the authority responsible for<br />
providing both waste collection <strong>and</strong> disposal policies feels the effect of fly<strong>tipping</strong>,<br />
<strong>and</strong> may therefore be incentivised to look at the problem more<br />
holistically <strong>and</strong> strategically.<br />
<strong>Fly</strong>-<strong>tipping</strong> data <strong>and</strong> its use<br />
One of the problems facing agencies in trying to control fly-<strong>tipping</strong>, is a lack of<br />
knowledge about the problem (Park, 2000). Collection of data locally is patchy<br />
<strong>and</strong> until recently there were no data available nationally on the scale of the<br />
problem. This data problem was highlighted in a review conducted by the<br />
National Audit Office (2002). As a response, the government launched<br />
<strong>Fly</strong>capture in April 2004<br />
(www.Defra.gov.uk/environment/localenv/fly<strong>tipping</strong>/<strong>Fly</strong>capture.htm).<br />
<strong>Fly</strong>capture<br />
The purpose of <strong>Fly</strong>capture is to provide a picture nationally of the fly-<strong>tipping</strong><br />
problem dealt with by local authorities <strong>and</strong> the Environment Agency (it does<br />
not aim to provide a complete national picture, since it does not deal with the<br />
majority of incidents that occur on private l<strong>and</strong>). All local authorities <strong>and</strong> the<br />
Environment Agency are required to submit monthly returns to the <strong>Fly</strong>capture<br />
database including:<br />
• The number of incidents, broken down by l<strong>and</strong> type, waste type<br />
<strong>and</strong> size;<br />
• the total costs;<br />
• the number of enforcement actions completed by type;<br />
• the number of prosecution outcomes by type; <strong>and</strong><br />
• the number of fines by amount.<br />
The data collected through <strong>Fly</strong>capture is presented <strong>and</strong> discussed later in this<br />
report.<br />
<strong>Fly</strong>-<strong>tipping</strong> <strong>and</strong> local crime <strong>and</strong> disorder reduction strategies<br />
The 1998 Crime <strong>and</strong> Disorder Act requires police forces <strong>and</strong> local authorities<br />
to work together to reduce crime <strong>and</strong> disorder in their local areas. They would<br />
do this by undertaking, once every three years, an analysis (audit) of local<br />
crime <strong>and</strong> disorder problems, <strong>and</strong> on the basis of their findings develop <strong>and</strong><br />
implement a strategy for reducing those identified as priority problems. This<br />
has led to the creation of so-called Crime <strong>and</strong> Disorder Reduction<br />
Partnerships (CDRPs) in each local authority area, responsible for this work.<br />
A review of their most recent audit <strong>and</strong> strategy documents reveals that fly<strong>tipping</strong><br />
is often mentioned as an issue. For example, 63% of the 48 CDRPs in<br />
the East of Engl<strong>and</strong> attend to fly-<strong>tipping</strong> specifically in their audits. Whether<br />
this is an increase over the previous round of audits is not known, but it seems<br />
likely for a number of reasons:<br />
5
<strong>Fly</strong>-<strong>tipping</strong>: <strong>Causes</strong>, <strong>Incentives</strong> <strong>and</strong> <strong>Solutions</strong><br />
• the Government has specifically encouraged CDRPs to attend much more<br />
to anti-social behaviour problems in their most recent round of audits <strong>and</strong><br />
strategies.<br />
• Section 1 of the Clean Neighbourhoods <strong>and</strong> Environment Act 2005<br />
requires anti-social behaviour <strong>and</strong> local environmental quality to be<br />
considered as part of any strategy. <strong>Fly</strong>-<strong>tipping</strong> is mentioned in government<br />
guidance to CDRPs as an issue to examine in this context.<br />
• the introduction of the national <strong>Fly</strong>capture database now enables CDRPs<br />
to include some, albeit rather basic, analysis of fly-<strong>tipping</strong> in their local<br />
areas with relative ease. What gets measured gets attention.<br />
There is, however, little analysis of the local problem beyond what is available<br />
from <strong>Fly</strong>capture <strong>and</strong> little or no benchmarking for comparative analysis with<br />
other areas. This means that it is largely public opinion, expressed through the<br />
consultation exercise that has to be undertaken as part of the audit process,<br />
that identifies fly-<strong>tipping</strong> as a priority problem locally.<br />
In only a few CDRPs, however, does the problem of fly-<strong>tipping</strong> progress from<br />
being an issue in the audit to having a strategic plan for its reduction. In the<br />
East of Engl<strong>and</strong>, for example, while 63% of the 48 CDRPs mentioned fly<strong>tipping</strong><br />
in their audits, <strong>and</strong> 19% said it was a priority, only 4% include it in their<br />
strategic plan for reducing local crime <strong>and</strong> disorder. Where it is, the action<br />
proposed is largely confined to clean-up, either through conducting clean-up<br />
days or introducing targets for clean-up of reported incidents, <strong>and</strong> to<br />
introducing CCTV into fly-tipped hot spots.<br />
The problem of fly-<strong>tipping</strong><br />
Evidence from the CDRP audits suggests that fly-<strong>tipping</strong> is a problem in many<br />
areas. This is reflected within local authority resident satisfaction surveys that<br />
also show that fly-<strong>tipping</strong> is seen as a prominent problem. For example, a<br />
West Midl<strong>and</strong>s Police citizen survey of Aston in 2004 showed that overall the<br />
citizens’ highest concern was fly-<strong>tipping</strong> in their area (West Midl<strong>and</strong>s Police,<br />
2004). Also, a survey of residents living in ‘New Deal for Communities (NDC)’<br />
areas, found fly-<strong>tipping</strong> to be a concern. Seventy percent of respondents<br />
indicated that fly-<strong>tipping</strong> was ‘a problem’ or ‘a serious problem’ in their area<br />
(Cole, Hickman & Green, 2003).<br />
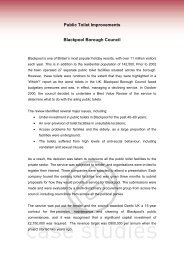
At national level, a series of surveys of local authorities conducted by <strong>Tidy</strong><br />
<strong>Britain</strong> (now Encams) over a number of years gives some insight into scale<br />
<strong>and</strong> trends in fly-<strong>tipping</strong>. Figure 2.1 below shows how local authorities in<br />
Engl<strong>and</strong>, Wales <strong>and</strong> Northern Irel<strong>and</strong> assessed the problem over four sweeps<br />
of the survey. It shows a fairly stable trend between 1994/1995 <strong>and</strong><br />
1997/1998 with around 50% of authorities considering fly-<strong>tipping</strong> either a<br />
significant or major problem. In 2001/2002, however, a distinct change in<br />
trend is observed, with 73% of authorities now assessing the problem as<br />
either significant or major. There could be a number of reasons for this,<br />
including increased attention <strong>and</strong> sensitivity to the problem. Sixty percent of<br />
local authorities thought that the introduction of the l<strong>and</strong>fill tax had made the<br />
6
<strong>Fly</strong>-<strong>tipping</strong>: <strong>Causes</strong>, <strong>Incentives</strong> <strong>and</strong> <strong>Solutions</strong><br />
problem worse. Since this was introduced in 1996 one might have expected to<br />
see an increase in fly-<strong>tipping</strong> almost immediately.<br />
Figure 2.1: Local Authority opinions of the fly-<strong>tipping</strong> problem in their area,<br />
results from the EnCams surveys.<br />
100%<br />
90%<br />
6% 7% 5%<br />
19%<br />
Percentage of local authorities<br />
80%<br />
70%<br />
42%<br />
47%<br />
44%<br />
60%<br />
54%<br />
50%<br />
40%<br />
30%<br />
48%<br />
45%<br />
49%<br />
20%<br />
28%<br />
10%<br />
0%<br />
4%<br />
2%<br />
2%<br />
1994/95 1996/97 1997/98 2001/02<br />
Year<br />
SOURCE: EnCams, 2003<br />
major problem<br />
significant problem<br />
minor problem<br />
no problem<br />
The damage caused by fly-<strong>tipping</strong><br />
<strong>Fly</strong>-<strong>tipping</strong> is a problem in its own right, but it can also lead to many other<br />
problems. Three areas of ‘collateral damage’ have been raised in the literature.<br />
Natural environment damage<br />
<strong>Fly</strong>-tipped waste causes pollution, habitat destruction <strong>and</strong> death of wildlife.<br />
It is beyond the scope of this review to explain the full impact of fly-<strong>tipping</strong> on<br />
the environment. The following, however, provide examples:<br />
• Dumped black bin bags slowly rip apart <strong>and</strong> begin leaking contaminated<br />
fluid, which then seeps down into the soil. This potentially not only affects<br />
the soil <strong>and</strong> the plants that grow in it, but also any aquifers below;<br />
• animals get into the rubbish bags <strong>and</strong> ingest items, which may cause<br />
serious damage or death to native wildlife <strong>and</strong> household pets alike;<br />
• black bags containing food waste will draw rodents <strong>and</strong> other small<br />
mammals to the area, many of whom carry disease (EPA, 1998);<br />
• dump sites are also at risk of catching fire by spontaneous combustion, or<br />
become targets for arson (EPA, 1998);<br />
• contaminated muck away (construction <strong>and</strong> excavation waste) used as<br />
topsoil on large grassl<strong>and</strong> areas ('Dumping on <strong>Britain</strong>', BBC One) will not<br />
only contaminate the soil, but also aversely affect the local wildlife, <strong>and</strong><br />
those people who use the grassl<strong>and</strong> for recreation;<br />
7
<strong>Fly</strong>-<strong>tipping</strong>: <strong>Causes</strong>, <strong>Incentives</strong> <strong>and</strong> <strong>Solutions</strong><br />
• waste fly-tipped near streams <strong>and</strong> rivers, or in their catchments risks being<br />
swept into the waterways <strong>and</strong> contaminating the water, <strong>and</strong> the wildlife<br />
who use the waterways (Williams & Simmons, 1999).<br />
Social environment damage<br />
<strong>Fly</strong>-<strong>tipping</strong> is unsightly <strong>and</strong> affects the quality of life of residents who see it<br />
every day. In particular, two theories of crime suggest how fly-<strong>tipping</strong> can lead<br />
to other social problems which impact on the quality of residential life.<br />
1. Broken Windows: The so-called ‘broken windows’ theory suggests that a<br />
small visible piece of damage to property, be it public or private, which is<br />
not quickly rectified, attracts more damage <strong>and</strong> other more serious crime<br />
(Wilson <strong>and</strong> Kelling, 1982). This happens because not rectifying the<br />
original damage indicates to offenders that no-one cares about the area –<br />
so it is free to ‘trash’, so to speak. The oft used example is that of a broken<br />
window. If someone throws a stone through a window of a property <strong>and</strong> it<br />
is not fixed, this sends a message that that property is not cared about. It<br />
is then more likely that the same property will get more stones through its<br />
windows, <strong>and</strong> graffiti on its walls. This will then spread through the<br />
community until the whole area slips into decline. In the case of fly-<strong>tipping</strong>,<br />
one black bag of waste that is not removed quickly will signal to others that<br />
such <strong>tipping</strong> in that location is tolerated, <strong>and</strong> thus more potential offenders<br />
will seize the opportunity to commit similar crime at or near that location.<br />
The preventative implication of this theory is that any fly-tipped waste<br />
should be removed quickly, this being the first step in any project with the<br />
aim of reducing fly-<strong>tipping</strong> (Huffman, Grossnickle, Cope & Huffman, 1995).<br />
2. Signal Crime Theory: This is different from Broken Windows. It focuses on<br />
fear of crime rather than the behaviour of offenders. Signal Crime theory<br />
stipulates that the visible presence of actual or impending crime (from<br />
serious crime to anti-social behaviour) can signal to residents that there is<br />
a crime or anti-social behaviour problem in their area (Innes, 2004a). In<br />
this way, such crime affects not only the specific victims, but also the<br />
community at large who may become fearful of what is happening in their<br />
community (Innes, 2004a). Thus the occurrence of a very visible event<br />
such as fly-<strong>tipping</strong> in a community may increase residents’ fear of crime.<br />
Such fear will be most pronounced when there is high ‘dissonance’<br />
between the type of crime which has occurred <strong>and</strong> the community it has<br />
occurred in. For example, an inner city community with massive ongoing<br />
development projects may not notice fly-<strong>tipping</strong> as much as a pristine rural<br />
community. It is the latter where fly-<strong>tipping</strong> is likely to become a ‘signal<br />
crime’, <strong>and</strong> generate fear of crime. Multiple signal crimes which are in<br />
close proximity to each other will also increasingly sensitise the community<br />
to such events (Innes, 2004b). The practical response to signal crime<br />
theory has been the introduction of the National Reassurance Policing<br />
Programme. Those areas where fear of crime is high, <strong>and</strong> signal crimes<br />
are the cause of that fear, receive a style of policing which is targeted at<br />
the source of that fear (http://www.reassurancepolicing.co.uk).<br />
8
<strong>Fly</strong>-<strong>tipping</strong>: <strong>Causes</strong>, <strong>Incentives</strong> <strong>and</strong> <strong>Solutions</strong><br />
Economic environment damage<br />
Economically, fly-<strong>tipping</strong> can be very expensive for a community in a number<br />
of different ways. For example:<br />
• <strong>Fly</strong>capture reports suggest that local authorities in Engl<strong>and</strong> spent around<br />
£44 million on clearing <strong>and</strong> disposing of fly-tips between April 2004 <strong>and</strong><br />
March 2005. This means tax payers’ money is diverted away from other<br />
local public services to cover these costs, or local taxes are raised.<br />
However if you add in the costs to private l<strong>and</strong>owners these costs could<br />
double as if fly-tip occurs on private l<strong>and</strong>, l<strong>and</strong>owners have to pay directly<br />
for the clear up. The Environment Agency estimates that the total cost of<br />
fly-<strong>tipping</strong> to taxpayers <strong>and</strong> private l<strong>and</strong>owners is in the region of £100m-<br />
150m;<br />
• the sight of a significant amount of fly-<strong>tipping</strong> in an area may discourage<br />
financial investment in the area (EnCams, 2003);<br />
• residential property values in a fly-tipped area are likely to decrease (EPA,<br />
1998);<br />
• fly-<strong>tipping</strong> undermines the financial viability of commercially-based waste<br />
disposal businesses, weakening the whole waste disposal infrastructure<br />
(EnCams, 2003).<br />
The ‘causes’ of fly-<strong>tipping</strong><br />
There are a number of potential ‘reasons’ for, or drivers of fly-<strong>tipping</strong> that have<br />
been discussed in the literature. The following summarises the main ones.<br />
Economic drivers<br />
Smith, Jacobson <strong>and</strong> Webb’s (2004) analysis of ab<strong>and</strong>oned vehicles shows<br />
how changes in the economic environment of waste disposal can lead to<br />
changes in <strong>tipping</strong> behaviour. Although the reliability of the data is problematic,<br />
they do show increasing numbers of ab<strong>and</strong>oned vehicles concurrent with<br />
increased costs of legitimate scrapping. The increased costs of legitimate<br />
disposal arise for two reasons:<br />
1. The drop in the market price for scrap metal; <strong>and</strong><br />
2. increased controls over how noxious substances from vehicle scrapping<br />
are dealt with.<br />
Where end of life vehicles once had a value, <strong>and</strong> scrap dealers would pay for<br />
them, owners now have to pay for the disposal of their vehicles. This, coupled<br />
with the ability to avoid being identified as the vehicle keeper, has led more<br />
<strong>and</strong> more owners to dump their unwanted vehicles by the roadside. It is often<br />
a combination of such rewards <strong>and</strong> risks that leads to problems emerging,<br />
something which is discussed further below.<br />
Changes in the economic context of waste disposal appear powerful drivers<br />
for illegal dumping of waste. The following discusses two specific economic<br />
changes likely to affect fly-<strong>tipping</strong> in similar ways to that documented for<br />
ab<strong>and</strong>oned vehicles.<br />
9
<strong>Fly</strong>-<strong>tipping</strong>: <strong>Causes</strong>, <strong>Incentives</strong> <strong>and</strong> <strong>Solutions</strong><br />
L<strong>and</strong>fill Tax<br />
October 1996 saw the introduction of the l<strong>and</strong>fill tax (Turner, Salmons, Powell<br />
& Craighill, 1998; The ENDS Report 278, 1998), brought in to reduce the<br />
amount of waste going to l<strong>and</strong>fill <strong>and</strong> encourage more recycling (Martin &<br />
Scott, 2003; Turner, Salmons, Powell & Craighill, 1998). The amount of tax<br />
payable is based on weight, with increased tax levies for each extra ton of<br />
waste. For those l<strong>and</strong>fill or waste transfer sites that do not have weighbridges,<br />
the l<strong>and</strong>fill workers estimate the waste weight.<br />
It is commonly believed that the introduction of the l<strong>and</strong>fill tax is a prime driver<br />
for fly-<strong>tipping</strong>. However, there is little evidence in the literature to substantiate<br />
this theory. Nevertheless, the Environment Agency claim a rapid increase in<br />
fly-<strong>tipping</strong> incidents was observed over the time the l<strong>and</strong>fill tax was introduced<br />
(EA, personal communication). In addition, an Encams survey (1998)<br />
suggested that most local authorities believe the l<strong>and</strong>fill tax tempted more<br />
people into fly-<strong>tipping</strong>. An analysis by Oxfordshire County Council provides<br />
some rare data showing quite clearly the impact of increased disposal costs<br />
on the fly-<strong>tipping</strong> of tyres.<br />
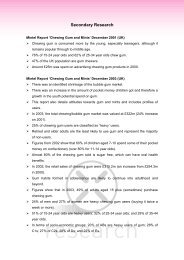
The EC L<strong>and</strong>fill Directive banned<br />
the l<strong>and</strong> filling of whole tyres from<br />
2003, thereby increasing the<br />
disposal costs for tyres. Figure 2.2<br />
below compares the costs to<br />
Oxfordshire County Council of<br />
dealing with selected types of flytipped<br />
waste. It shows that the<br />
costs of disposing of fly-tipped<br />
tyres doubled after the Directive<br />
took effect.<br />
10
<strong>Fly</strong>-<strong>tipping</strong>: <strong>Causes</strong>, <strong>Incentives</strong> <strong>and</strong> <strong>Solutions</strong><br />
Figure 2.2: Costs of disposal of selected fly-tipped waste in Oxfordshire<br />
134,000<br />
132,000<br />
<strong>Fly</strong><strong>tipping</strong> Costs<br />
Other Costs<br />
Asbestos Costs<br />
Tyres Costs<br />
Vehicles Costs<br />
130,000<br />
128,000<br />
126,000<br />
£'s<br />
124,000<br />
122,000<br />
120,000<br />
118,000<br />
116,000<br />
114,000<br />
2002-2003 2003-2004<br />
Fiscal Year<br />
Source: internal report by Oxfordshire County Council<br />
Producers pay<br />
The climate now being created primarily through EU legislation is that<br />
producers pay the costs of disposal of their products. This will profoundly<br />
impact the economics of waste disposal, <strong>and</strong> could theoretically have a<br />
powerful affect on illegal waste dumping. In relation to vehicles, the End of<br />
Life Vehicle Directive has already come into force (2000/53/EC) although it<br />
will not take effect in the UK until 2007 when producers will have to pay ‘all or<br />
a significant part’ of the cost of vehicle dismantling <strong>and</strong> recycling. Smith,<br />
Jacobson <strong>and</strong> Webb (2004) suggest that, once this happens, the problem of<br />
ab<strong>and</strong>oned vehicles in the UK should diminish as the economic incentive for<br />
dumping vehicles disappears. They do point out, however, that in the interim,<br />
a culture of dumping vehicles could easily develop which might be hard to turn<br />
around. In addition, some end of life vehicles may have been ab<strong>and</strong>oned<br />
11
<strong>Fly</strong>-<strong>tipping</strong>: <strong>Causes</strong>, <strong>Incentives</strong> <strong>and</strong> <strong>Solutions</strong><br />
because they have simply stopped working, making it hard <strong>and</strong> costly to get<br />
them to disposal sites.<br />
The Waste Electronic <strong>and</strong> Electrical Equipment (WEEE) directive (2002/96/EC)<br />
similarly requires producers to recover, recycle, <strong>and</strong> treat old items from their<br />
customers. It was expected to be brought into British law by 13 August 2005<br />
for implementation by 1 st January, 2006. However this process has been<br />
delayed <strong>and</strong> a new timetable for implementation was not yet released at the<br />
time of writing. WEEE items include:<br />
• Household appliances;<br />
• IT <strong>and</strong> telecommunications equipment;<br />
• audiovisual <strong>and</strong> lighting equipment;<br />
• electrical <strong>and</strong> electronic tools;<br />
• toys, leisure <strong>and</strong> sports equipment;<br />
• medical devices; <strong>and</strong><br />
• automatic dispensers.<br />
(EA: Online, accessed July, 2005)<br />
The impact of this initiative on fly-<strong>tipping</strong> may not be as straightforward as for<br />
vehicles. Unlike vehicles, for example, householders can currently take small<br />
electrical <strong>and</strong> electronic goods to civic amenity sites for free. Indeed, much of<br />
the fly-tipped household waste could be taken to civic amenity sites for free.<br />
This implies that factors other than economics are driving the problem. These<br />
could include ignorance of what to do with the waste, or simply convenience,<br />
coupled with perception of low risk of capture.<br />
Opportunity structures<br />
The above discussion shows that while economic factors are clearly an<br />
important driver for fly-<strong>tipping</strong>, there are other factors that combine to create a<br />
situation where fly-<strong>tipping</strong> is more or less likely. This more complex notion of<br />
the ‘causes’ of fly-<strong>tipping</strong> is known as the opportunity structure. The<br />
opportunity structure describes the context which gives rise to the problem,<br />
<strong>and</strong> the different factors that combine to facilitate the problem. Webb <strong>and</strong><br />
Marshall (2004) provide a good example of an opportunity structure in relation<br />
to the fly-<strong>tipping</strong> of construction <strong>and</strong> demolition waste in London.<br />
Example of a fly-<strong>tipping</strong> opportunity structure:<br />
<strong>Fly</strong> <strong>tipping</strong> of construction & demolition waste: the offenders<br />
perspective<br />
• formal controls over waste movement are weak<br />
• you get paid on the basis of how much waste you move <strong>and</strong> how<br />
quickly, not where it ends up<br />
• using l<strong>and</strong>fill sites is expensive<br />
• there are many ‘suitable’ places to tip<br />
• it is easy to hide the identity of trucks <strong>and</strong> their owners<br />
• the design of trucks makes <strong>tipping</strong> fast<br />
• the risk of getting caught is small<br />
12
<strong>Fly</strong>-<strong>tipping</strong>: <strong>Causes</strong>, <strong>Incentives</strong> <strong>and</strong> <strong>Solutions</strong><br />
One can see that it is a complex interplay of the offenders judgement of the<br />
ease, rewards, <strong>and</strong> risks that lead them to engage in this kind of fly-<strong>tipping</strong>,<br />
<strong>and</strong> that these judgements are affected by many different aspects of the<br />
environment in which they work – the effectiveness of the regulation system,<br />
the economic incentives <strong>and</strong> levers, the design of trucks, the availability of<br />
suitable locations, the ease of making excuses for your behaviour, <strong>and</strong> so on.<br />
There are a number of important implications of this way of thinking about<br />
such problems:<br />
1. These factors work in combination to affect offenders’ judgements. This<br />
implies that dealing with any one of these could alter the opportunity<br />
structure sufficiently to have an impact on the problem.<br />
2. Defining the opportunity structure enables a range of potential<br />
interventions to be identified, <strong>and</strong> helps to exp<strong>and</strong> the scope for action.<br />
3. The opportunity structure will be different for different kinds of problem<br />
behaviour. The analysis has to be very crime specific. The example above<br />
applies to a very well defined problem of large scale <strong>tipping</strong> of construction<br />
<strong>and</strong> demolition waste. It would not apply to householders dumping black<br />
bags of rubbish over the railway fence. This problem would have a very<br />
different opportunity structure <strong>and</strong> require, therefore, very different<br />
interventions.<br />
Future research that is policy oriented should aim to develop an<br />
underst<strong>and</strong>ing of the opportunity structures underlying the different kinds of<br />
fly-<strong>tipping</strong> problem.<br />
Profiling different fly-<strong>tipping</strong> problems<br />
All the available evidence is that household waste appears to make up most<br />
incidents of fly-tipped waste (EnCams,1998; Defra, the Environment Agency<br />
<strong>and</strong> the LGA, 2005). Studies also show that the locations in which fly-<strong>tipping</strong><br />
takes place are very varied. In the US, the Environmental Protection Agency<br />
(EPA, 1998) suggests the following as common fly-<strong>tipping</strong> sites:<br />
• Undeveloped lots/ab<strong>and</strong>oned structures/unused industrial facilities;<br />
• poorly lit access roads;<br />
• property along railways <strong>and</strong> highways;<br />
• alleys;<br />
• charity drop box locations;<br />
• construction sites;<br />
• forests/woods/farms; <strong>and</strong><br />
• borders of cities <strong>and</strong> counties because of lack of police presence in<br />
these areas<br />
EnCams (1998) identifies a rather different, <strong>and</strong> more rural, list of commonly<br />
fly-tipped places which include:<br />
• Lay-bys;<br />
• field openings;<br />
13
<strong>Fly</strong>-<strong>tipping</strong>: <strong>Causes</strong>, <strong>Incentives</strong> <strong>and</strong> <strong>Solutions</strong><br />
• roadside verges;<br />
• outside tips; <strong>and</strong><br />
• hedge bottoms in country lanes, cul-de-sacs <strong>and</strong> car parks.<br />
‘Other highways’ <strong>and</strong> ‘industry/warehousing/retail sheds’ emerge from the<br />
more recent Local Environmental Quality Survey of Engl<strong>and</strong> (EnCams, 2003).<br />
An unpublished survey of farms in Engl<strong>and</strong> <strong>and</strong> Wales (Marcus Hodges<br />
Environment Limited & BDB Associates, 2002) suggested that gateways were<br />
the most commonly fly-tipped hot spot, followed by ditches <strong>and</strong> fields.<br />
A more robust study of fifty sites along the River Taff <strong>and</strong> its catchment area<br />
found many kinds of location suffered from fly-<strong>tipping</strong> (Williams <strong>and</strong> Simmons,<br />
1999). Seventy-five percent of industrial sites, 62% of commercial areas, 48%<br />
of residential sites <strong>and</strong> 45% of open spaces were fly-tipped.<br />
These surveys identify a wide variety of locations where fly-<strong>tipping</strong> takes place.<br />
Searching for common characteristics of what makes a fly-<strong>tipping</strong> location<br />
suitable, the EPA claims that tippers look for convenient places to tip where<br />
the chance of being caught is considered small. They suggest that locations<br />
on jurisdiction boundaries may be vulnerable in this respect. Another common<br />
‘requirement’ seems to be that sites allow easy vehicular access. Williams <strong>and</strong><br />
Simmons (1999) found that 60% of the sites which had good vehicular access<br />
had been fly-tipped, compared with just 28% of sites without vehicular access.<br />
This suggests that inability to transport waste to a legal disposal site it not a<br />
driver for such fly-<strong>tipping</strong>. It also points to ways in which popular fly-<strong>tipping</strong><br />
locations might be protected.<br />
Who fly-tips?<br />
The kinds of analysis cited above do not lend any insight into the various<br />
different kinds of fly-<strong>tipping</strong> problem. Analysis of who fly-tips, however, quickly<br />
reveals different sub-sets of fly-<strong>tipping</strong> problems, each with its own set of<br />
drivers <strong>and</strong>, therefore, ‘opportunity structures’.<br />
According to the London wide Initiative for <strong>Fly</strong>-<strong>tipping</strong> (LIFT, cited in EnCams,<br />
1998), there are four groups of people who fly-tip.<br />
1. Organised criminal fly-tippers, for whom financial reward is the driver<br />
2. Commercial fly-tippers wanting to avoid waste disposal charges<br />
3. Domestic fly-tippers for whom legal disposal methods are inconvenient<br />
4. Travellers who leave a lot of waste on their sites<br />
Source: LIFT, 1984 cited in EnCams, 1998.<br />
Organised criminals<br />
The inclusion of organised crime as a separate group begs the question of<br />
how these are defined, <strong>and</strong> how they are different from the three other groups<br />
listed. In relation to the export of stolen cars, for example, Brown <strong>and</strong> Clarke<br />
(2004) concluded that there is less involvement of conventional organised<br />
14
<strong>Fly</strong>-<strong>tipping</strong>: <strong>Causes</strong>, <strong>Incentives</strong> <strong>and</strong> <strong>Solutions</strong><br />
groups in this than claimed. The conventional concept of organised crime as<br />
‘mafia’ type groups is also not always correct. Brown <strong>and</strong> Clarke claimed that<br />
organised crime groups are becoming smaller, <strong>and</strong> more fluid networks of<br />
people taking advantage of opportunities as they arise.<br />
Examples of organised fly-<strong>tipping</strong> include:<br />
• A series of incidents involving one set of offenders who organised the<br />
dumping of 1,705 lorry loads of waste (34,000 tonnes) over a 12 month<br />
period (cited by Webb <strong>and</strong> Marshall, 2004).<br />
• A case whereby 18 articulated trailers of tyres where tipped in lay-bys<br />
in North West Engl<strong>and</strong> over a three week period dumping<br />
approximately 30,000 tyres (EA, personal communication).<br />
• A case where two offenders have illegally deposited waste in four<br />
different Environment Agency regions by deceiving <strong>and</strong> coercing<br />
l<strong>and</strong>owners into accepting waste on their l<strong>and</strong>. The deposits are<br />
typically more than 50 lorry loads of demolition <strong>and</strong> construction waste<br />
(EA, personal communication).<br />
Organised fly-tippers have been known to carry weapons (including firearms),<br />
intimidate witnesses <strong>and</strong> use various counter detection methods, including oil<br />
smeared on number plates, false paper work <strong>and</strong> false building site signs (EA,<br />
personal communication).<br />
Commercial fly-tippers<br />
Potentially, the temptation for independent waste truck drivers to avoid the<br />
l<strong>and</strong>fill tax could be large, particularly in a competitive environment where<br />
margins <strong>and</strong> wages may be small. They st<strong>and</strong> to gain economically, by<br />
charging their customers for the removal of waste including the l<strong>and</strong>fill tax,<br />
then dumping the waste wherever is convenient (illegally). There are ways to<br />
avoid this situation. Webb <strong>and</strong> Marshall found, for example, that larger waste<br />
haulage companies pay the l<strong>and</strong>fill tax direct rather than rely on their drivers<br />
to pay, thus removing the incentive <strong>and</strong> opportunity for this kind of fraud.<br />
There is also evidence of quite a lot of ignorance particularly amongst small<br />
<strong>and</strong> medium sized enterprises (SMEs) of their legal responsibilities <strong>and</strong> duties<br />
of care in relation to waste, which could lead to fly-<strong>tipping</strong>.<br />
The NetRegs survey “How green are small businesses” (NetRegs, 2002)<br />
found that only 18% of SMEs could name any environmental legislation that<br />
applied to their business. Prior to prompting, 86% did not believe their<br />
business’s actions caused any harm to the environment. Just over half the<br />
participants (54%) had heard of the ‘Duty of Care’ regulations, but only 17%<br />
could name three of its requirements. 32% of larger businesses (50-250<br />
employees) could name the Environmental Protection Act, 1990 compared<br />
with just 5% of the smaller businesses (0-9 employees).<br />
15
<strong>Fly</strong>-<strong>tipping</strong>: <strong>Causes</strong>, <strong>Incentives</strong> <strong>and</strong> <strong>Solutions</strong><br />
Domestic fly-tippers<br />
Household waste emerges time <strong>and</strong> again as the most common type of waste<br />
dumped. Some of this might come from waste contractors but some will<br />
undoubtedly be dumped by householders directly. The reasons can be varied,<br />
including:<br />
• Missing the kerbside rubbish collection service or having a poor service,<br />
leading waste being dumped rather than kept until the next collection;<br />
• not having any personal transport, <strong>and</strong> so being unable to take waste<br />
to the civic amenity site;<br />
• discovering the civic amenity site is closed, <strong>and</strong> dumping waste at the<br />
front gate either out of frustration, or because it is believed that the<br />
waste will be taken into the site the following day.<br />
Economic drivers are only relevant for residents when it comes to disposing of<br />
large items, as charges are often levied by waste collection authorities<br />
although they do vary in their policies. This charge may apply to the collection<br />
<strong>and</strong> disposal of white goods such as refrigerators <strong>and</strong> freezers as these items<br />
contain hazardous gases that need careful h<strong>and</strong>ling. Some local authorities<br />
may also charge their residents for other bulky waste, such as furniture, to be<br />
collected. This can create the temptation for some people who are able, to flytip<br />
these items <strong>and</strong> avoid the charges. The speed with which local authorities<br />
can collect bulky waste may also be an important factor, <strong>and</strong> may interact with<br />
cost – some may be happy to pay for collection if the goods are taken quickly.<br />
No good behavioural evidence is available currently on the impact on fly<strong>tipping</strong><br />
of varying services in this way.<br />
Lack of awareness of legal responsibilities <strong>and</strong> duties of care will also be an<br />
issue for householders, particularly if they pay someone else to collect their<br />
waste. From November 2005 in Engl<strong>and</strong> <strong>and</strong> January 2006 in Wales,<br />
householders are required to do all they can to ensure that their waste is<br />
disposed of properly by those they pay to take it away. This amounts, in<br />
practice, to ensuring that the waste is collected by properly licensed waste<br />
contractors. The extent to which this new policy is understood by<br />
householders, is practicable <strong>and</strong> works in controlling fly-<strong>tipping</strong> are all<br />
questions that future research might address. There may also be value in<br />
conducting research to determine what householders underst<strong>and</strong> by the term<br />
‘fly-<strong>tipping</strong>’.<br />
Travellers<br />
Travellers are mentioned In a number of reports as being associated with fly<strong>tipping</strong>:<br />
• A report by LIFT (1984; cited in EnCams, 1998) identified Travellers as<br />
one of four groups who fly-tip;<br />
• Seven percent of farmers asked who they think were responsible for<br />
fly-<strong>tipping</strong> on their farms mentioned Travellers (Marcus Hodges<br />
Environment Ltd & BDB Associates, 2002);<br />
• Webb <strong>and</strong> Marshall (2004) report that about 5% of incidents of fly<strong>tipping</strong><br />
recorded on the Environment Agency database of construction<br />
16
<strong>Fly</strong>-<strong>tipping</strong>: <strong>Causes</strong>, <strong>Incentives</strong> <strong>and</strong> <strong>Solutions</strong><br />
<strong>and</strong> demolition waste incidents, were associated with Traveller sites;<br />
<strong>and</strong><br />
• a survey of local authorities owners <strong>and</strong> managers of traveller sites<br />
found that fly- <strong>tipping</strong> <strong>and</strong> waste disposal was the single most often<br />
mentioned site management problem with rubbish <strong>and</strong>/or fly-<strong>tipping</strong><br />
being identified as a problem on, or adjacent to, two-thirds of Traveller<br />
sites (Niner, 2003).<br />
One possibility for this association is that Travellers often do not have access<br />
to the same kerbside collection provisions as permanent residents. This<br />
means Travellers must find alternative waste disposal arrangements, let the<br />
waste accumulate on-site or fly-tip it near-by. Niner (2003) reports that while<br />
accumulations of waste near Traveller sites are most commonly attributed to<br />
the activities of the site‘s residents, non-resident dumping is identified on six<br />
out of the ten sites with a waste problem. This is recognised by Travellers,<br />
who feel they frequently get the blame for other people’s <strong>tipping</strong>.<br />
The waste may also be a product of traditional Traveller trades, such as<br />
garden work, tarmac <strong>and</strong> other building works <strong>and</strong> scrap dealing. As such, the<br />
motivation for fly-<strong>tipping</strong> this waste is akin to that of trade waste, i.e. to avoid<br />
costs of legitimate disposal.<br />
What has been, <strong>and</strong> could be done about fly-<strong>tipping</strong>?<br />
There are many ideas around about what might be done to reduce fly-<strong>tipping</strong><br />
(see for example the EPA guidebook, 1998), <strong>and</strong> much has been tried. The<br />
<strong>Tidy</strong> <strong>Britain</strong> Group Survey in 1998 (EnCams,1998) showed that the most<br />
common approach to tackling fly-<strong>tipping</strong> reported by local authorities then was<br />
‘enforcement of current legislation’ (43%) followed by ‘restriction to fly-<strong>tipping</strong><br />
sites’ (36%). However, only 39% of local authorities believed that their<br />
methods had proved successful. Few initiatives, however, have been soundly<br />
evaluated. The knowledge base of ‘what works’ is, therefore, very poor.<br />
This section outlines these varied types of intervention using the framework<br />
developed from situational crime prevention. Situational Crime Prevention<br />
(SCP) has been used widely in conventional crime prevention work, <strong>and</strong> many<br />
evaluations have shown its value. Essentially, SCP involves searching for<br />
measures that do one of more of the following in relation to the specific<br />
problem of concern:<br />
• Increase the effort needed for an offender to commit the crime;<br />
• increase the risks to the offender for committing the crime;<br />
• reduce the rewards that offenders would gain from committing crime;<br />
• reduce the provocations which can induce crime; or<br />
• remove excuses that offenders can make to rationalise the crime<br />
(Clark & Eck, 2003).<br />
Increasing effort<br />
• Target hardening of locations<br />
17
<strong>Fly</strong>-<strong>tipping</strong>: <strong>Causes</strong>, <strong>Incentives</strong> <strong>and</strong> <strong>Solutions</strong><br />
Target hardening of locations or hot spots for fly-<strong>tipping</strong> is a popular<br />
approach <strong>and</strong> has been tried by many local authorities. These measures<br />
try to make it harder for fly-tippers to use these locations, usually by<br />
physically preventing vehicular access. They don’t always work, though.<br />
One local authority installed concrete barriers in front of lay-bys to prevent<br />
waste being dumped by the roadside. After these were installed, however,<br />
waste was simply dumped in front of <strong>and</strong> on top of the barriers (personal<br />
communication, Spelthorne District Council, 11 May 2005). This is not an<br />
uncommon story.<br />
Alley-gating is a popular measure currently. In East Manchester, residents<br />
had a problem with people dumping rubbish in the alleyways at the sides<br />
<strong>and</strong> backs of their houses, making these hard to use (Cole, Hickman &<br />
Green, 2003). The residents approached the local authority about this, <strong>and</strong><br />
the solution was to gate-off the alleyways. The process takes time as<br />
planning permission is needed (see Johnson & Loxley, 2001), but once<br />
gating is completed no-one can access the alleyway except residents who<br />
have keys. Alley-gates have been found to be effective in reducing<br />
burglary so there is every reason to believe it would be effective in<br />
reducing fly-<strong>tipping</strong> – unless offenders are householders who have access<br />
to the alleys.<br />
Increasing risks<br />
A study by Environmental Resources Management Ltd (ERM) in 2003 showed<br />
that the risk of being caught <strong>and</strong> prosecuted for fly-<strong>tipping</strong> was very small.<br />
70% of 73 authorities who answered the questionnaire had not prosecuted a<br />
fly-<strong>tipping</strong> case between 1998-2003. Of the 19 who had, only eight were<br />
satisfied with the outcome (Dupont & Zakkour, 2003). Dupont <strong>and</strong> Zakkour<br />
suggest that because of vast variation in detection <strong>and</strong> prosecution between<br />
local authorities, there is a risk that fly-tippers will move their activities out of<br />
the ‘tougher’ areas <strong>and</strong> into those areas where their capture is less likely<br />
(Dupont & Zakkour, 2003). The ERM study also examined the perceived<br />
obstacles to prosecution. The most common response was the lack of<br />
sufficient evidence for a charge (Dupont & Zakkour, 2003). Other obstacles<br />
included not having a full time enforcement officer for fly-<strong>tipping</strong>, <strong>and</strong> a lack of<br />
perceived support from the legal section of the local authority.<br />
Detection <strong>and</strong> prosecution of even the more serious cases attracting the<br />
attention of the Environment Agency can be problematic. Webb <strong>and</strong> Marshall<br />
(2004) found that just 2.5% of cases of construction <strong>and</strong> demolition waste<br />
reported to the Environment Agency in NE <strong>and</strong> SE Thames regions in 2002,<br />
resulted in a successful prosecution <strong>and</strong> conviction. This is due mostly to the<br />
difficulty in tracing this kind of waste to its source. However, when a fly-tipper<br />
is caught, the fines (<strong>and</strong> it is often fines) are often considered derisory <strong>and</strong><br />
well worth the small risk to offenders. The Environment Agency claim that the<br />
average fine for the last four years for the more serious fly-<strong>tipping</strong> offences the<br />
Agency takes to court has maintained around the £1500 level (Environment<br />
Agency, personal communication).<br />
18
<strong>Fly</strong>-<strong>tipping</strong>: <strong>Causes</strong>, <strong>Incentives</strong> <strong>and</strong> <strong>Solutions</strong><br />
• CCTV<br />
CCTV is a common tool used to increase enforcement capacity by those<br />
local authorities able to invest in the technology. EnCams has produced a<br />
good practice guide on ‘using surveillance equipment to tackle fly-<strong>tipping</strong>’<br />
(M.E.L Research, 2003). This guide covers everything from the legal<br />
considerations when using CCTV, to choosing the right equipment <strong>and</strong><br />
taking enforcement action. There are also case studies presented showing<br />
where CCTV has helped to prevent or reduce fly-<strong>tipping</strong>.<br />
More robust evaluations of CCTV, however, find that its impact on crime is<br />
mixed <strong>and</strong> often disappointing (Gill & Spriggs, 2005). Welsh <strong>and</strong><br />
Farrington (2002) in a rare systematic review conclude that CCTV is place<br />
<strong>and</strong> crime specific in terms of its effectiveness in reducing crime. They<br />
found, for example, that its effect on public transport was unclear but that it<br />
was much more effective in reducing crime against vehicles in car parks. It<br />
can also provoke responses from offenders to reduce its value. For<br />
example, when CCTV was introduced into building societies to prevent<br />
robberies, there was some evidence that robbers responded by wearing<br />
disguises, thus undermining the usefulness of CCTV (Austin, 1988). In<br />
relation to fly-<strong>tipping</strong>, lorries can disguise their identity using false<br />
registration plates, obscuring the plates with mud <strong>and</strong> oil, or not being<br />
registered or registered to a false name <strong>and</strong> address.<br />
The key to using CCTV effectively is to think through how it is supposed to<br />
work in relation to the particular problem of concern. Tilley (1993)<br />
describes at least nine different ways in which CCTV could work. Which<br />
one is triggered will depend on the context. He concludes that it is most<br />
effective in those situations where offenders are convinced that the risk of<br />
identification <strong>and</strong> capture is increased. Where increased risk is not<br />
plausible, for example in relation to pick-pocketing on Oxford Circus (Webb<br />
& Laycock, 1991) there is no effect.<br />
A further issue with CCTV is its sustainability. There is some evidence that,<br />
if CCTV does make an impact, its effectiveness may fade over time<br />
(Phillips, 1999). Webb <strong>and</strong> Laycock (1991) suggest that this is a<br />
consequence of offenders testing the system <strong>and</strong> learning the extent to<br />
which risk of capture really has increased. This may mean that mobile<br />
cameras are a more economic option, followed up with more permanent<br />
interventions to consolidate the short term impact. It also implies that<br />
strategic use of publicity will be important, to make the most of any<br />
successful detections, <strong>and</strong> help sustain in the minds of offenders<br />
heightened risk. The following example shows another way in which<br />
offenders might be informed of increased risk:<br />
One rubbish tip in the Borough of Maidstone has eleven CCTV<br />
cameras in operation in the area; these cameras are linked up to a<br />
security company who provide sirens <strong>and</strong> high powered halogen lights<br />
<strong>and</strong> speakers. When the security company believe someone is about to<br />
fly-tip they turn on the alarms in order to deter the potential offender; if<br />
that does not work the public address system is used with a message<br />
19
<strong>Fly</strong>-<strong>tipping</strong>: <strong>Causes</strong>, <strong>Incentives</strong> <strong>and</strong> <strong>Solutions</strong><br />
of “Put your waste back into the vehicle <strong>and</strong> take it away, you are being<br />
filmed by CCTV cameras”(Maidstone Borough Council, 2002, p8).<br />
• Registration of vehicles<br />
Given that vehicles are so important in fly-<strong>tipping</strong>, much detection effort is<br />
vehicle-led. This, however, is undermined by the ease with which<br />
offenders can disguise the identity of their vehicles, not just through crude<br />
efforts to obscure the number plate but also by registering false<br />
information in the various vehicle, waste carrying <strong>and</strong> operating licensing<br />
systems. For example, currently vehicles which carry waste do not have to<br />
be individually registered as waste carriers. Waste carrier registration is<br />
given to the companies who own the vehicles (Control of Pollution<br />
(Amendment) Act 1989). Unless companies can keep a reliable check of<br />
who is driving which vehicle at any particular time, it will be hard to use the<br />
licensing system to detect fly-tippers. Registering individual vehicles could<br />
remove this anonymity, although there would still be scope for registering<br />
false identities. The increased effort required to evade detection may,<br />
however, be sufficient to deter some offenders.<br />
• Tax evasion charges<br />
An alternative to trying to prosecute for fly-<strong>tipping</strong> is the seldom considered<br />
option of charging offenders with ‘tax evasion’ in order to deter them from<br />
fly-<strong>tipping</strong>. By failing to deposit waste in legal waste disposal sites<br />
offenders are also failing to pay l<strong>and</strong>fill tax, thus they could be charged<br />
with tax evasion (Turner, Salmons, Powell & Craighill, 1998). This remedy<br />
still requires offenders to be caught, <strong>and</strong> enough evidence still needs to be<br />
in place for the charges to stick. However, simply advertising the fact that<br />
offenders risk these charges may be enough to deter some, more so if<br />
highly publicised examples are made of a few. Baroness Young of Old<br />
Scone, the Chief Executive of the Environment Agency, has said that they<br />
(the Environment Agency) have been examining the idea of using tax<br />
evasion charges against fly-<strong>tipping</strong> offenders (Public Accounts Committee,<br />
22 January 2003).<br />
• Encouraging reporting<br />
Maidstone Council (2002) suggested that a reward scheme should be in<br />
place in their borough to encourage people to report fly-<strong>tipping</strong>. If a<br />
resident gave information which led to a fly-tipper being successfully<br />
prosecuted, the resident would receive a monetary reward up to the value<br />
of £500 (Maidstone Borough Council, 2002). It is not known if this proposal<br />
was implemented <strong>and</strong>, if so, whether it was effective. There will be many<br />
challenges to implementing such a scheme <strong>and</strong> making it work. While<br />
reward giving has been shown to work well in changing environmental<br />
behaviour, it is often more cost effective to change the environment in<br />
which the unwanted behaviour occurs (Huffmann et. al., 1995).<br />
• Undercover operations<br />
Undercover operations are another potential option in tackling fly-<strong>tipping</strong><br />
(Skumatz, Van Dusen & Carton, 2001). Undercover operations can lead to<br />
arrests, <strong>and</strong> strategic use of publicity can make the most of any success to<br />
20
<strong>Fly</strong>-<strong>tipping</strong>: <strong>Causes</strong>, <strong>Incentives</strong> <strong>and</strong> <strong>Solutions</strong><br />
build in a deterrent mechanism as well as an incapacitation one. They are,<br />
however, very expensive, requiring a lot of police involvement <strong>and</strong><br />
equipment, <strong>and</strong> such a tactic is probably best reserved for the most<br />
serious cases justifying such costs.<br />
Reducing rewards<br />
Within the field of pollution control, there is a considerable body of literature<br />
on economic incentives <strong>and</strong> levers for encouraging ‘green’ behaviour. These<br />
essentially focus on how to design taxation <strong>and</strong> subsidy systems that ensure<br />
the costs of illegal behaviour outweigh the costs of behaving honestly, <strong>and</strong> are<br />
summarised in Webb <strong>and</strong> Marshall (2004).<br />
In relation to fly-<strong>tipping</strong>, two ideas have been suggested as a way of reducing<br />
rewards <strong>and</strong> encouraging ‘green’ behaviour. One is about billing people who<br />
fly-tip for the costs of the clean up, <strong>and</strong> the other is about rewarding those<br />
who don’t.<br />
• Direct billing of fly-tippers for the costs of clean up <strong>and</strong> disposal<br />
This is akin to the enforcement approach except that it is not a criminal<br />
justice remedy, but a purely economic one where the offenders are<br />
charged directly for the full costs of cleaning up their tip <strong>and</strong> disposing of<br />
the rubbish. It has a number of advantages over conventional enforcement<br />
remedies. First, it is civil action <strong>and</strong> therefore the burden of proof is lower.<br />
Secondly, it places the true cost of the fly-tip on the offenders, <strong>and</strong> thirdly it<br />
can be a much faster process than one that has to proceed through the<br />
criminal justice system. All these characteristics suggest that it could a<br />
more powerful way of deterring fly-<strong>tipping</strong>. In addition, of course, it would<br />
also save the local authority time <strong>and</strong> money preparing <strong>and</strong> prosecuting a<br />
court case. It is now possible for local authorities in Engl<strong>and</strong> to apply this<br />
approach using new powers provided through the Clean Neighbourhoods<br />
<strong>and</strong> Environment Act 2005 (s22). Fixed Penalty Notices can be used to<br />
fine directly individuals who can be identified as having fly-tipped waste.<br />
Linderhof, Kooreman, Allers <strong>and</strong> Wiersma (2001) examined the weightbased<br />
pricing experiment introduced in the Dutch Municipality of Oostzaan.<br />
In order to control any side-effects on fly-<strong>tipping</strong>, Oostzaan put in place<br />
services for residents to report any incidents of littering or fly-<strong>tipping</strong>.<br />
Efforts were then made to trace the origin of any fly-tipped waste, with<br />
those households then charged for the waste collection <strong>and</strong> fined as well<br />
(Linderhof et. al., 2001). This seems to have been effective, to the extent<br />
that the authors report that 4-5% of waste from Oostzaan was taken over<br />
the border into neighbouring Municipalities to relatives, employers or<br />
friends to dispose of who did not have the weight-based pricing system!<br />
• Deposit-refund systems<br />
Ferrara (2003) suggests the introduction of a deposit-refund system to<br />
incentivise good waste disposal practice. Consumers would be charged a<br />
deposit for consumption at the point of sale, but this deposit would be<br />
refunded at the point of waste disposal. This should give householders a<br />
21
<strong>Fly</strong>-<strong>tipping</strong>: <strong>Causes</strong>, <strong>Incentives</strong> <strong>and</strong> <strong>Solutions</strong><br />
big incentive to dispose of waste legally, <strong>and</strong> also help to cover the cost of<br />
any clearing up of fly-<strong>tipping</strong>. Fullerton <strong>and</strong> Kinnaman (1995) also contend<br />
that a deposit refund system is the best for optimal disposal. There are,<br />
however, substantial implementation challenges <strong>and</strong> administrative costs<br />
<strong>and</strong> would require a detailed cost-benefit analysis before investing in such<br />
a system.<br />
Reducing provocations<br />
• Opening hours at Civic Amenity sites<br />
<strong>Fly</strong>-<strong>tipping</strong> can often be seen outside the gates of civic amenity sites,<br />
suggesting that this particular problem may arise because, finding the site<br />
closed, people leave the waste outside the site gates in frustration <strong>and</strong><br />
some annoyance. Trialling later opening hours for local Civic Amenity sites<br />
may help prevent such a problem (Maidstone Council, 2002). Later<br />
opening hours over the summer period when there are more daylight<br />
hours <strong>and</strong> more people doing house <strong>and</strong> garden maintenance for longer<br />
periods of time could be a positive move. Some local authorities already<br />
do this, <strong>and</strong> while its effectiveness in controlling fly-<strong>tipping</strong> is not known, it<br />
makes perfect sense from a customer service point of view.<br />
Removing excuses<br />
• Free skip weekends<br />
Some councils such as the London Borough of Barnet offer free ‘skip<br />
weekends’, when skips are located around the borough enabling residents<br />
to dispose of their bulky items for free (Defra, 2002). The EnCams survey<br />
(2003) showed that 70% of local authorities who implemented such<br />
community skip initiatives thought they were effective.<br />
There are costs to such schemes, for example policing the skips to ensure<br />
that they are only used for domestic waste. Also, the skip weekends may<br />
not resolve fly-<strong>tipping</strong> that occurs at other times when skips are not<br />
available. Perhaps it might be better to think of them as being the starting<br />
point for a multi-faceted fly-<strong>tipping</strong> strategy, providing the programme with<br />
a clean start on which to build.<br />
• Advertising<br />
Another way to remove the ability of people to excuse their behaviour is<br />
through advertising, making it clear what the rules are <strong>and</strong> what is<br />
unacceptable behaviour. The impact of advertising on behaviour is a<br />
complex topic, <strong>and</strong> like CCTV the effects in crime prevention can be<br />
disappointing. Hansmann <strong>and</strong> Scholz (2003), however, describe an<br />
experiment using advertising to control littering behaviour which seems to<br />
have been effective. The aim was to reduce the amount of litter dropped<br />
by movie-goers on a cinema floor during a film, by showing a series of<br />
messages on the screen before the film began. The results showed a 28%<br />
reduction in the weight of litter dropped on the floor per person compared<br />
to baseline levels, although the researchers questioned whether this<br />
impact was sustainable over time.<br />
22
<strong>Fly</strong>-<strong>tipping</strong>: <strong>Causes</strong>, <strong>Incentives</strong> <strong>and</strong> <strong>Solutions</strong><br />
Care has to be taken in generalising from studies such as this. The case<br />
above targets a very specific behaviour, a behaviour which is seldom<br />
enforced, <strong>and</strong> in very specific circumstances. Other research produces<br />
more disappointing results. Riley <strong>and</strong> Mayhew (1980), for example, found<br />
that television advertising of the risks of v<strong>and</strong>alism did not reduce<br />
v<strong>and</strong>alism in Manchester compared to the control area of Bradford.<br />
Generally, the lessons from research are that publicity can be a powerful<br />
tactic in reducing crime if it is associated with a very specific problem <strong>and</strong><br />
increases offenders perceptions of risk (Bowers <strong>and</strong> Johnson, 2003;<br />
Johnson <strong>and</strong> Bowers, 2003). The authors of the littering study described<br />
above are also right to worry about sustaining effects produced by<br />
advertising. Research shows that offenders do learn about risk, <strong>and</strong> that<br />
any initial impact may fade if no real increase in risk can be demonstrated<br />
(Webb & Laycock, 1991)<br />
23
<strong>Fly</strong>-<strong>tipping</strong>: <strong>Causes</strong>, <strong>Incentives</strong> <strong>and</strong> <strong>Solutions</strong><br />
3 What <strong>Fly</strong>capture tells us<br />
In an effort to get a clearer national picture of the fly-<strong>tipping</strong> problem the<br />
Environment Agency launched the <strong>Fly</strong>capture database in April 2004. All local<br />
authorities as well as the Environment Agency are required to submit monthly<br />
returns on the number, size, waste <strong>and</strong> location type of the fly-tips recorded<br />
each month. It is intended that in the future, local authorities will also be<br />
required to report the actions taken against fly-tippers.<br />
Problems with data<br />
This study revealed a number of problems of reliability <strong>and</strong> validity of the data:<br />
1. Although guidance is provided to local authorities on how to classify fly-tips,<br />
it is clear that local authorities have different ideas of what constitutes a flytip<br />
<strong>and</strong> what does not. Side-waste is a particular issue, recorded in some<br />
local authorities as fly-<strong>tipping</strong>, but not in others. This can generate huge<br />
differences in the data. Liverpool, for instance, had to be excluded from<br />
this analysis as its <strong>Fly</strong>capture returns showed that black-bag fly-<strong>tipping</strong><br />
incidents in alley-ways increased suddenly by a factor of more than a<br />
hundred as a result of their inclusion of side-waste in the figures.<br />
2. While most local authorities comply with the requirement to submit<br />
<strong>Fly</strong>capture returns in terms of reporting the number of incidents that have<br />
taken place each month, not all have been so willing to break down these<br />
returns into the separate <strong>Fly</strong>capture categories: size, waste <strong>and</strong> location<br />
type. For some local authorities that do not have the appropriate systems<br />
in place, collating this information requires considerably more effort.<br />
Consequently, some authorities only complete part of the return or dump<br />
all incidents into one field; entering ‘0’s for the others. In addition, there<br />
was some evidence to suggest that a few local authorities simply guess<br />
how their fly-<strong>tipping</strong> incidents are distributed across categories.<br />
3. Some local authority performance targets are based on <strong>Fly</strong>capture data.<br />
This creates an incentive to inflate the number of incidents at the base-line<br />
so that performance targets are more easily met, <strong>and</strong> to include incidents<br />
that other local authorities might reject as fly-<strong>tipping</strong>.<br />
4. Since local authorities are only required to submit data on fly-<strong>tipping</strong><br />
incidents they deal with, not all fly-tips are reported to <strong>Fly</strong>capture. Those<br />
occurring on private l<strong>and</strong>, for example, which are not the council’s<br />
responsibility, are frequently not entered on the system.<br />
5. <strong>Fly</strong>capture guidance stipulates that a fly-tip can only be classified into one<br />
category. This makes it hard to know how to record a mixed waste fly-tip<br />
comprising of a fridge, a sofa <strong>and</strong> several bags of building rubble, for<br />
example. This example could be classed as either ‘white goods’, ‘other<br />
household waste’, or ‘construction <strong>and</strong> demolition waste’.<br />
24
<strong>Fly</strong>-<strong>tipping</strong>: <strong>Causes</strong>, <strong>Incentives</strong> <strong>and</strong> <strong>Solutions</strong><br />
6. <strong>Fly</strong>capture returns contain aggregated data only. It is not a record of<br />
individual fly-<strong>tipping</strong> incidents. This limits the way the data can be analysed.<br />
For example, while it might be possible to ascertain that the majority of tips<br />
were comprised of household waste or construction waste, which were<br />
dumped mostly on roads or fields, it is impossible to determine whether<br />
either waste type was disproportionately associated with either one of the<br />
l<strong>and</strong> types.<br />
These problems either place limitations on how the data can be analysed or<br />
introduce a certain amount of unreliability into the information. It is important<br />
that this is kept in mind when interpreting the analyses below.<br />
It must also be kept in mind that the following analyses are based on returns<br />
submitted by local authorities between July 2004 <strong>and</strong> June 2005. Since the<br />
database was launched only a few months prior to this (April 2004), this<br />
represents <strong>Fly</strong>capture’s early stages. In some cases it took local authorities<br />
several months to put systems in place to collect the data <strong>and</strong> get up to speed<br />
with the submission process. It was therefore decided to exclude local<br />
authorities who failed to provide at least six returns in this twelve month period.<br />
Further, Liverpool <strong>and</strong> Sheffield City Councils were excluded for the reason<br />
given in point 1 above.<br />
The scale of the fly-<strong>tipping</strong><br />
Based on <strong>Fly</strong>capture figures, it is estimated there were about 1.1 million<br />
incidents of fly-<strong>tipping</strong> in the 12 months June 2004-July 2005, with local<br />
authorities experiencing an average of around 250 fly-tips per month. Figure<br />
3.1 shows the trend over this period, revealing what we know from more<br />
detailed work in local authorities is the seasonal dip in the winter months. Also,<br />
the trend over this period is down, with June 2005 dipping below 250 tips for<br />
the first time in this period.<br />
25
<strong>Fly</strong>-<strong>tipping</strong>: <strong>Causes</strong>, <strong>Incentives</strong> <strong>and</strong> <strong>Solutions</strong><br />
Figure 3.1: Average number of fly-tips per month<br />
300.00<br />
250.00<br />
Avg LA incidents per month<br />
200.00<br />
150.00<br />
100.00<br />
50.00<br />
0.00<br />
Jul-04<br />
Aug-04<br />
Sep-04<br />
Oct-04<br />
Nov-04<br />
Dec-04<br />
Jan-05<br />
Feb-05<br />
Mar-05<br />
Apr-05<br />
May-05<br />
Jun-05<br />
Local authorities vary enormously in the numbers of fly-tips they report to<br />
<strong>Fly</strong>capture. Figure 3.2 shows the distribution of fly-<strong>tipping</strong> across English local<br />
authorities.<br />
26
<strong>Fly</strong>-<strong>tipping</strong>: <strong>Causes</strong>, <strong>Incentives</strong> <strong>and</strong> <strong>Solutions</strong><br />
Figure 3.2: Number of fly-tips reported by local authority area per month<br />
Figure 3.2 shows pockets of quite high concentration of fly-<strong>tipping</strong>, <strong>and</strong> these<br />
seem generally to be areas of high population density. <strong>Fly</strong>-<strong>tipping</strong> seems<br />
particularly focused around urban areas in London, the North West of Engl<strong>and</strong><br />
<strong>and</strong> the North East.<br />
Calculating a rate per head of population controls for the possibility that these<br />
areas have more fly-<strong>tipping</strong> simply because more people live there. If<br />
population density were the main driver for the distribution shown in Figure 3.2,<br />
the rate per head of population should be similar across all local authorities.<br />
Figure 3.3 shows both the number <strong>and</strong> rate for each local authority.<br />
27
<strong>Fly</strong>-<strong>tipping</strong>: <strong>Causes</strong>, <strong>Incentives</strong> <strong>and</strong> <strong>Solutions</strong><br />
Figure 3.3: Number of fly-tips <strong>and</strong> rate per month per 1,000 population by<br />
local authority<br />
7000<br />
30<br />
6000<br />
5000<br />
4000<br />
3000<br />
No. of incidents<br />
Incidents per population<br />
25<br />
20<br />
15<br />
2000<br />
10<br />
1000<br />
5<br />
0<br />
1 11 21 31 41 51 61 71 81 91 101 111 121 131 141 151 161 171 181 191 201 211 221 231 241 251 261 271 281 291 301<br />
0<br />
There are a number of interesting points from Figure 3.3:<br />
1. The rate is not flat, which means that factors other than simply population<br />
density drive the problem. Statistical analysis does show that part of the<br />
variance in rate is correlated with density of population (this is discussed in<br />
more depth below), but Figure 3.3 suggests that the problem increases<br />
exponentially, i.e. it increases much more than would be expected by<br />
population density alone. Two possibilities could explain this:<br />
a. further statistical analysis shows that the variance is also strongly<br />
correlated with Indices of Multiple Deprivation. Issues such as overcrowding<br />
<strong>and</strong> poverty emerge as relevant <strong>and</strong> plausible drivers of the<br />
problem<br />
b. the exponential rate of increase would be consistent with the ‘broken<br />
windows’ theory described above, i.e. that fly-<strong>tipping</strong> in areas of<br />
multiple deprivation encourages more people to fly-tip<br />
2. Some local authorities suffer massively more than others. Liverpool <strong>and</strong><br />
Sheffield have been excluded from this analysis, as they report unusually<br />
high numbers – between three <strong>and</strong> six times as much as the next highest<br />
local authority. This looks like a recording issue. A number of local<br />
authorities, however, suffer very high numbers <strong>and</strong> rates of fly-<strong>tipping</strong>. 5%<br />
of local authorities account for 45% of all fly-tips. The top six report an<br />
28
<strong>Fly</strong>-<strong>tipping</strong>: <strong>Causes</strong>, <strong>Incentives</strong> <strong>and</strong> <strong>Solutions</strong><br />
average of 3,573 fly-tips per month, with a monthly rate of 18 per 1000<br />
population. These figures are more than ten times the average for Engl<strong>and</strong><br />
nationally. Concentrations like this deserve closer attention as reductions<br />
here have the potential to alter the national picture.<br />
3. Two local authorities st<strong>and</strong> out as having high numbers but low rates –<br />
Leeds <strong>and</strong> Birmingham, which represent the two blips in Figure 3.3) . This<br />
pattern goes against the trend <strong>and</strong> is also deserving of attention as it may<br />
provide good practice lessons<br />
4. One local authority has low number but high rates – the Corporation of<br />
London – because the size of the residential population is so low.<br />
The nature of fly-<strong>tipping</strong><br />
Figure 3.4 shows the locations which suffer from fly-<strong>tipping</strong>. The low level of<br />
risk for private, commercial, rail, water <strong>and</strong> farm l<strong>and</strong> is probably an<br />
underestimate for the reason given on page 24 – 25% of farmers claimed to<br />
have experience fly-<strong>tipping</strong> on their farms over a five year period, 33% of<br />
which claimed never to have reported a fly-tip to the authorities (Marcus<br />
Hodges Environment Ltd & BDB Associates, 2002). What Figure 3.4, <strong>and</strong><br />
<strong>Fly</strong>capture generally, shows is how the problem impinges on local authority<br />
responsibilities. This explains why highways, council l<strong>and</strong> <strong>and</strong> other access<br />
routes emerge so strongly, because these are the main areas of l<strong>and</strong> for<br />
which the local authority are responsible for keeping clear. Highways probably<br />
suffer so much more than other areas such as alleyways <strong>and</strong> footpaths<br />
because so much fly-<strong>tipping</strong> is vehicle-based.<br />
Figure 3.4: Location of fly-<strong>tipping</strong><br />
Mean per month (per million population)<br />
900<br />
798.0<br />
800<br />
700<br />
600<br />
500<br />
400<br />
390.6<br />
300<br />
229.3<br />
200<br />
138.7<br />
100<br />
61.3<br />
37.4 28.9 25.0<br />
0<br />
Highway<br />
Council_L<strong>and</strong><br />
Back_Alleyway<br />
Footpath___Bridleway<br />
Other__unidentified_<br />
Private___Residential<br />
Commercial___Industrial<br />
Agricultural<br />
Watercourse___Bank<br />
5.0 1.7<br />
Railway<br />
Figure 3.5 shows the kind of waste which is fly-tipped. Thankfully, hazardous<br />
waste is relatively rare although the impact on the environment is clearly<br />
29
<strong>Fly</strong>-<strong>tipping</strong>: <strong>Causes</strong>, <strong>Incentives</strong> <strong>and</strong> <strong>Solutions</strong><br />
disproportionate to the number of fly-tips. Household waste fly-<strong>tipping</strong> is much<br />
more prevalent than commercial waste <strong>tipping</strong>, with many more incidents of<br />
household black refuse bags being tipped than, say, green waste. Figure 3.5<br />
does not, however, reflect the size of tip. In terms of volume, for example, one<br />
tip of green waste is likely be much more extensive than one black refuse bag,<br />
<strong>and</strong> be more expensive to clean up.<br />
Figure 3.5: Type of waste tipped<br />
Mean per month (per million population)<br />
450 423.1<br />
400<br />
350<br />
300 288.2<br />
250<br />
194.3<br />
200<br />
150<br />
90.1<br />
100<br />
85.1<br />
75.7<br />
58.6<br />
42.8 41.4<br />
50<br />
30.5 29.1<br />
15.0 7.7 5.4 3.8<br />
0<br />
Other_Household_Waste<br />
Black_Bags___Household<br />
Other__unidentified_<br />
White_Goods<br />
Constr___Demol___Excav<br />
Green<br />
Other_Commercial_Waste<br />
Black_Bags___Commercial<br />
Tyres<br />
Other_Electrical<br />
Vehicle_Parts<br />
Animal_Carcass<br />
Chemical_Drums__Oil__Fuel<br />
Asbestos<br />
Clinical<br />
Figure 3.6 shows the volume of fly-<strong>tipping</strong> as measured by <strong>Fly</strong>capture. In line<br />
with the picture presented in Figure 3.5, most fly-tips amount to no more than<br />
a car boot or small van load, or a single item. Larger loads are relatively rare,<br />
although again the impact of these will be far in excess of their number. One<br />
lorry can tip 20 tonnes of waste, while one car probably tips a couple of black<br />
bags <strong>and</strong> a carpet!<br />
30
<strong>Fly</strong>-<strong>tipping</strong>: <strong>Causes</strong>, <strong>Incentives</strong> <strong>and</strong> <strong>Solutions</strong><br />
Figure 3.6: Size of fly-tips<br />
Mean per month (per million population)<br />
450<br />
400<br />
350<br />
300<br />
250<br />
200<br />
150<br />
100<br />
50<br />
0<br />
407.0 400.3<br />
351.7<br />
155.4<br />
37.7<br />
9.9<br />
Car_Boot_or_Less<br />
Single_Item<br />
Small_Van_Load<br />
Transit_Van_Load<br />
Tipper_Lorry_Load<br />
Significant___Multi_Loads<br />
It is difficult to delve any deeper into the problem using <strong>Fly</strong>capture data, for<br />
example cross tabulations are not possible because of its aggregation.<br />
However, some rather crude analysis does begin to show the need <strong>and</strong><br />
potential for such deeper analysis. Figure 3.7 shows the distribution of two<br />
types of problem around London – single item/car-boot load fly-tips <strong>and</strong> tipper<br />
load or more fly-tips. It shows rather different patterns, with larger tips<br />
occurring more on the outskirts of urban conurbations than smaller tips. This<br />
suggests the need <strong>and</strong> potential for rather different solutions to these<br />
problems.<br />
31
<strong>Fly</strong>-<strong>tipping</strong>: <strong>Causes</strong>, <strong>Incentives</strong> <strong>and</strong> <strong>Solutions</strong><br />
Figure 3.7: The distribution of small <strong>and</strong> large-scale tips around London<br />
Comparing <strong>Fly</strong>capture data with other local area statistics potentially provides<br />
insight into fly-<strong>tipping</strong> problems. However, the limitations of <strong>Fly</strong>capture<br />
described at the beginning of this section mean such analyses must be<br />
treated with caution. Furthermore, since local authority areas vary greatly by<br />
way of population density, housing, income, l<strong>and</strong> use, amount of construction<br />
work, rurality <strong>and</strong> proximity to cities etc., it is likely the factors that contribute<br />
to fly-<strong>tipping</strong> may differ between areas too. For example, in terms of access to<br />
civic amenity sites, distance might be an important factor in rural areas,<br />
whereas in urban areas, traffic conditions may be more significant. More<br />
importantly, many factors thought to be associated with fly-<strong>tipping</strong> co-vary to a<br />
considerable extent. For example, areas that are densely populated are the<br />
same areas where you find poor quality overcrowded housing, low income<br />
families, etc. This complicates the analysis <strong>and</strong> renders conclusions hard to<br />
make with any degree of confidence.<br />
The remainder of this section considers some factors that could be<br />
hypothesised as being associated with fly-<strong>tipping</strong>. It must be emphasised that<br />
these analyses are speculative with the associations described are not to be<br />
considered conclusive; but as warranting more in-depth investigation at most.<br />
32
<strong>Fly</strong>-<strong>tipping</strong>: <strong>Causes</strong>, <strong>Incentives</strong> <strong>and</strong> <strong>Solutions</strong><br />
Table 3.1 shows the correlation between average local authority fly-<strong>tipping</strong><br />
rates <strong>and</strong> several local area statistics.<br />
33
<strong>Fly</strong>-<strong>tipping</strong>: <strong>Causes</strong>, <strong>Incentives</strong> <strong>and</strong> <strong>Solutions</strong><br />
Table 3.1: Covariates of local authority fly-<strong>tipping</strong> rate (Spearman’s<br />
correlations)<br />
Index of<br />
multiple<br />
deprivation<br />
(IMD)<br />
Population<br />
density<br />
Average<br />
distance<br />
to nearest<br />
CA site 1<br />
Percentage<br />
of<br />
households<br />
without a car<br />
IMD<br />
measure of<br />
overcrowding<br />
IMD<br />
combined<br />
measure<br />
of income<br />
Rate of<br />
fly<strong>tipping</strong><br />
0.52** 0.41** -0.25** 0.58** 0.46** 0.24**<br />
** p
<strong>Fly</strong>-<strong>tipping</strong>: <strong>Causes</strong>, <strong>Incentives</strong> <strong>and</strong> <strong>Solutions</strong><br />
Table 3.1 shows that, at a general level, average local authority fly-<strong>tipping</strong><br />
rates correlate strongly with many factors. However, as discussed many of<br />
these factors correlate with each other. This covariance is perhaps best<br />
illustrated by the negative correlation found between fly-<strong>tipping</strong> <strong>and</strong> distance<br />
to civic amenity site. At first glance this association seems counter-intuitive<br />
since many would expect fly-<strong>tipping</strong> to increase as the distance from<br />
legitimately means of disposal increases, not decreases. However, this begins<br />
to make sense when considering that the largest distances to civic amenity<br />
sites occur in the most rural areas of Engl<strong>and</strong>, areas which have lower<br />
population density, less overcrowded housing, etc. These areas are not as<br />
prone to fly-<strong>tipping</strong> as built-up urban areas. To gain a better underst<strong>and</strong>ing of<br />
the extent to which these factors are associated with fly-<strong>tipping</strong> it is useful to<br />
control for the rurality of the area. Table 3.2 shows the association between<br />
Index of Multiple Deprivation <strong>and</strong> local authority fly-<strong>tipping</strong> rates, broken down<br />
into six rural classes (as defined by Defra,<br />
www.http://statistics.defra.gov.uk/esg/rural_resd/rural_definition.asp)<br />
Table 3.2: Correlations between fly-<strong>tipping</strong> <strong>and</strong> IMD by rural class<br />
Major<br />
urban<br />
Large<br />
urban<br />
Other<br />
urban<br />
Significant<br />
rural Rural 50 Rural 80<br />
Correlation 0.414** 0.660** 0.286* 0.375** 0.434** 0.266*<br />
**p
<strong>Fly</strong>-<strong>tipping</strong>: <strong>Causes</strong>, <strong>Incentives</strong> <strong>and</strong> <strong>Solutions</strong><br />
Table 3.1 suggests that population density is strongly associated with fly<strong>tipping</strong>.<br />
However, Table 3.3 shows that when controlling for rurality, population<br />
density is only associated with fly-<strong>tipping</strong> in major urban areas. An even closer<br />
look at particular waste types fly-tipped in these areas 2 suggests that<br />
population density is particularly associated with commercial waste <strong>and</strong><br />
household black bags. It can be argued that the more dense an area is, the<br />
less space there may be for storing waste, both for residents <strong>and</strong> for<br />
businesses. If waste storage is the dominant factor, a relationship would be<br />
expected for fly-<strong>tipping</strong> household waste in overcrowded areas.<br />
As can be seen in Table 3.3, overcrowding is strongly associated with fly<strong>tipping</strong><br />
in urban areas. This relationship is particularly prominent for fly-<strong>tipping</strong><br />
of household <strong>and</strong> commercial waste particularly black bags <strong>and</strong> bulky waste<br />
(including white goods). Construction <strong>and</strong> demolition waste is also associated<br />
with overcrowding but to a lesser extent.<br />
A closer look at the relationship between fly-<strong>tipping</strong> <strong>and</strong> income reveals that,<br />
in urban areas, income is associated with construction <strong>and</strong> demolition waste,<br />
bulky waste, commercial waste <strong>and</strong> vehicle parts. No significant association<br />
was found with fly-<strong>tipping</strong> of black bin bags <strong>and</strong> income. In rural areas,<br />
however, there is a weak association with household black bags, but more so<br />
for bulky waste.<br />
As well as factors associated with deprivation, incentives to fly-tip may include<br />
those relating to accessing legitimate waste disposal services.<br />
2 Please refer to the appendices for details of these correlations<br />
36
<strong>Fly</strong>-<strong>tipping</strong>: <strong>Causes</strong>, <strong>Incentives</strong> <strong>and</strong> <strong>Solutions</strong><br />
Table 3.4 gives the correlations between fly-<strong>tipping</strong> <strong>and</strong> the average distance<br />
to civic amenity site <strong>and</strong> the percentage of households in a local authority<br />
without a car by rural class.<br />
37
<strong>Fly</strong>-<strong>tipping</strong>: <strong>Causes</strong>, <strong>Incentives</strong> <strong>and</strong> <strong>Solutions</strong><br />
Table 3.4: Correlations between fly-<strong>tipping</strong>, distance to civic amenity sites <strong>and</strong><br />
percentage of households without a car by rural class<br />
Major<br />
urban<br />
Large<br />
urban<br />
Other<br />
urban<br />
Significant<br />
rural Rural 50 Rural 80<br />
Distance to<br />
CA site<br />
-0.148 0.422** 0.089 0.011 -0.156 -0.149<br />
Households<br />
without a car<br />
0.620** 0.677** 0.298 0.390* 0.256 0.102<br />
**p
<strong>Fly</strong>-<strong>tipping</strong>: <strong>Causes</strong>, <strong>Incentives</strong> <strong>and</strong> <strong>Solutions</strong><br />
4 Practice <strong>and</strong> capacity in waste authorities<br />
Two str<strong>and</strong>s of work were conducted to assess current practice in waste<br />
collection <strong>and</strong> disposal authorities, <strong>and</strong> their state of readiness to develop<br />
more preventive interventions – the national survey of waste authorities, <strong>and</strong><br />
detailed case study work in selected areas. This section describes the findings<br />
from both.<br />
4.1 The Waste Authority survey<br />
In July 2005, a survey was distributed to all waste collection authorities<br />
(WCAs), waste disposal authorities (WDAs) <strong>and</strong> unitary authorities in Engl<strong>and</strong>.<br />
Its aims were to:<br />
• gauge each authority’s specific fly-<strong>tipping</strong> problems;<br />
• underst<strong>and</strong> the context in which each authority operates;<br />
• identify examples of good practice; <strong>and</strong><br />
• inform the selection of suitable case studies for more detailed analysis<br />
<strong>and</strong> inclusion in a good practice guide<br />
Key findings from the survey are presented below. Full details of the survey,<br />
the questions asked <strong>and</strong> the responses received, are given in the appendix.<br />
Response rate<br />
In total 118 authorities returned the questionnaire representing a 29.9%<br />
response rate. Considering the survey’s complexity <strong>and</strong> its non-obligatory<br />
nature, the response rate was always expected to be low. This rate is<br />
comparable to the 38% response rate reported by Encams in its 2003 survey.<br />
Table 4.1 <strong>and</strong> Figure 4.1 depict the rate <strong>and</strong> geographical spread of the<br />
responses to the survey.<br />
Table 4.1: Waste authority survey response rates<br />
No. authorities<br />
responding<br />
Total in<br />
Engl<strong>and</strong><br />
Response<br />
Rate<br />
WCAs 83 274 30.3%<br />
Unitary authorities 21 80 26.3%<br />
Total Collection Authorities 104 354 29.4%<br />
WDAs 14 40 35.0%<br />
Total waste authorities 118 394 29.9%<br />
39
<strong>Fly</strong>-<strong>tipping</strong>: <strong>Causes</strong>, <strong>Incentives</strong> <strong>and</strong> <strong>Solutions</strong><br />
Figure 4.1: Distribution of waste collection/unitary authorities responding to<br />
the waste authority survey<br />
Perception of the problem<br />
How concentrated is it?<br />
Figure 4.2 compares local authority perceptions of fly-<strong>tipping</strong> problems in this<br />
survey compared to previous Encams surveys (1998, 2003).<br />
40
<strong>Fly</strong>-<strong>tipping</strong>: <strong>Causes</strong>, <strong>Incentives</strong> <strong>and</strong> <strong>Solutions</strong><br />
Figure 4.2: Waste authority perception of fly-<strong>tipping</strong> problems in their area<br />
100%<br />
90%<br />
6% 7% 5%<br />
19%<br />
4%<br />
Percentage of local authorities<br />
80%<br />
70%<br />
60%<br />
50%<br />
40%<br />
30%<br />
20%<br />
10%<br />
0%<br />
42%<br />
47%<br />
44%<br />
69%<br />
54%<br />
48%<br />
45%<br />
49%<br />
28% 27%<br />
4% 2% 2%<br />
1994/95 1996/97 1997/98 2001/2002 2005<br />
major problem<br />
significant problem<br />
minor problem<br />
no problem<br />
Year<br />
Four percent of local authorities considered fly-<strong>tipping</strong> to be a major problem,<br />
a figure in line with most of the previous sweeps of the Encams survey (with<br />
the exception of the survey in 2001/02). This is also the picture presented by<br />
<strong>Fly</strong>capture data which shows the problem, in terms of number of fly-tips,<br />
massively concentrated with around 5% of local authorities suffering 45% of<br />
all fly-tips nationally.<br />
The perception by 69% of local authorities that fly-<strong>tipping</strong> is a significant<br />
problem for them is rather different from that presented by the <strong>Fly</strong>capture data,<br />
which suggests a figure more around 30%. But that is based purely on the<br />
number of fly-tips, which can be a misleading indicator of size of problem.<br />
What are the main problems?<br />
The type of waste fly-tipped <strong>and</strong> the locations used for <strong>tipping</strong> waste all mirror<br />
the picture presented in <strong>Fly</strong>capture, i.e. mainly household rubbish, with<br />
householders <strong>and</strong> small trade/builders being the main culprits, <strong>and</strong> highways<br />
being the main location (see appendix). The survey did allow, however, more<br />
discrete problems to be described by respondents in a way that <strong>Fly</strong>capture<br />
cannot. Figure 4.3 describes the prevalence of particular problems waste<br />
authorities say they have.<br />
41
<strong>Fly</strong>-<strong>tipping</strong>: <strong>Causes</strong>, <strong>Incentives</strong> <strong>and</strong> <strong>Solutions</strong><br />
Figure 4.3: Top 10 particular problems of fly-<strong>tipping</strong> – proportion of authorities<br />
saying they have this problem<br />
Household (Black bag) waste dumped on streets/residential areas<br />
24%<br />
Green waste dumped on laybys, highways <strong>and</strong> rural areas<br />
9%<br />
Waste fly-tipped, or left by travellers<br />
9%<br />
Building/construction waste dumped in rural areas<br />
9%<br />
Householders dumping garden/green waste<br />
9%<br />
Building/Construction waste tipped on roads, laybys or alley-ways<br />
Household, business <strong>and</strong>/or building waste tipped at recycling<br />
banks<br />
7%<br />
8%<br />
Green waste dumped by 'tree service' companies/Odd jobbers<br />
5%<br />
Bulky items including white goods dumped on streets <strong>and</strong> in alleys.<br />
Households <strong>and</strong> businesses putting black bags out prior to<br />
collection day/time<br />
4%<br />
4%<br />
0% 5% 10% 15% 20% 25% 30%<br />
Interestingly, Figure 4.3 reveals even more the problem of household black<br />
refuse bags being dumped in residential streets. This problem is much greater<br />
than any other. It is also easy to see how this can get mixed up with the side<br />
waste issue. A black bag left out three days before collection is due looks like<br />
a bag that has been dumped, even though the motivation is different.<br />
Green waste emerges in a number of different ways – either tipped by garden<br />
services or by householders. The greater prevalence of householders <strong>tipping</strong><br />
green waste is perhaps surprising as they have available to them free<br />
disposal services which traders do not. Building waste also emerges in two<br />
forms – waste dumped around housing, <strong>and</strong> waste transported for dumping in<br />
rural areas. White goods do not figure much as a problem.<br />
This sort of analysis begins to illustrate the need to identify discrete problems<br />
for closer examination, as these will each suggest rather different responses.<br />
What are the causes?<br />
In relation to possible ‘drivers’ for these problems, two clear winners emerged<br />
from this survey – attempts to avoid the costs of disposal, <strong>and</strong> availability of<br />
civic amenity sites. A range of other ‘causes’ of fly-<strong>tipping</strong> were mentioned but<br />
these two dominated as Figure 4.4 shows.<br />
42
<strong>Fly</strong>-<strong>tipping</strong>: <strong>Causes</strong>, <strong>Incentives</strong> <strong>and</strong> <strong>Solutions</strong><br />
Figure 4.4: Authority perceptions of the ‘causes’ if fly-<strong>tipping</strong><br />
Aggrevating factors<br />
60<br />
Number of mentions (n=94)<br />
50<br />
40<br />
30<br />
20<br />
10<br />
0<br />
Costs <strong>and</strong> restrictions on legal disposal<br />
Access <strong>and</strong> availability of CA sites<br />
LA collection services <strong>and</strong> policies/Bulky waste...<br />
48<br />
42<br />
20<br />
17<br />
14 14 13 12 11<br />
Conflicting waste reduction strategies/legislation<br />
Lack of awareness of services<br />
Socioeconomic reasons/culture<br />
Lack of enforcement/deterrent<br />
Ignorance of legal responsibilities<br />
Laziness/lack of respect<br />
Lack of LA resources<br />
6<br />
Other<br />
25<br />
Responses<br />
There was little evidence of a strategic response being taken to the problem.<br />
76% said they had no written strategy for reducing fly-<strong>tipping</strong> <strong>and</strong> 68% said<br />
that there had been no data-driven analysis conducted to help develop<br />
strategies or tactics. 44% said that fly-<strong>tipping</strong> had been included in the local<br />
Crime <strong>and</strong> Disorder Reduction strategy, but 43% didn’t know if it had or not.<br />
In relation to specific kinds of intervention, the picture that emerges from the<br />
survey is of a field where preventive work is undeveloped. Clearing up the tip<br />
is still the dominant response, as Figure 4.5 shows.<br />
43
<strong>Fly</strong>-<strong>tipping</strong>: <strong>Causes</strong>, <strong>Incentives</strong> <strong>and</strong> <strong>Solutions</strong><br />
Figure 4.5: Distribution of local authority spend in response to fly-<strong>tipping</strong><br />
Enforcement, 12%<br />
Prevention, 7%<br />
Clearance, 81%<br />
Another indicator of the immature state of preventive work in this field is<br />
the little collaborative work that is undertaken with other agencies. As<br />
Figure 4.6 shows, as much as a quarter of local authorities never work with<br />
other agencies, with little over 27% of local authorities working regularly with<br />
their neighbouring authorities.<br />
Figure 4.6: Extent of partnership working<br />
Q: To what extent does your WCA/unitary authority work with<br />
the following public agencies to improve the fly-<strong>tipping</strong><br />
situation?<br />
100%<br />
90%<br />
80%<br />
70%<br />
60%<br />
50%<br />
40%<br />
30%<br />
20%<br />
10%<br />
0%<br />
23.7%<br />
36.8%<br />
26.3%<br />
10.5%<br />
51.6%<br />
28.4%<br />
20.8%<br />
49.0%<br />
19.8%<br />
25.5%<br />
47.9%<br />
19.1%<br />
13.2% 9.5% 10.4% 7.4%<br />
WDA EA Police Neighbouring<br />
authorities<br />
Never<br />
Occasionally<br />
Regularly (informally)<br />
Formal local agreement<br />
When preventive tactics are used, however, the experience is that these are<br />
usually effective. Indeed, they are often seen as more effective than<br />
44
<strong>Fly</strong>-<strong>tipping</strong>: <strong>Causes</strong>, <strong>Incentives</strong> <strong>and</strong> <strong>Solutions</strong><br />
enforcement work <strong>and</strong> education work, even though the latter are more<br />
common responses.<br />
Figure 4.7 shows that 72% of authorities had adopted enforcement tactics, but<br />
less than 50% thought these effective. Difficulties in obtaining convictions<br />
were considered the main problem here. Only 43% had tried restricting<br />
access to hot spots, but over 80% of these projects were judged successful.<br />
Perhaps these more situational crime prevention tactics will become more<br />
common as experience of their efficacy grows <strong>and</strong> the word spreads.<br />
Figure 4.7: Proportion of Local Authorities attempting different responses,<br />
<strong>and</strong> proportion judging these as very or quite effective<br />
90<br />
80<br />
70<br />
60<br />
50<br />
40<br />
% using the tactic<br />
% judging it very or quite successful<br />
30<br />
20<br />
10<br />
0<br />
Enforcement Education CCTV(covert) Restricted<br />
access to hot<br />
spots<br />
Community<br />
Skip Schemes<br />
Free bulky<br />
waste<br />
collection<br />
CCTV(visible)<br />
Generally speaking, <strong>and</strong> again in line with the undeveloped preventive<br />
approach, there was little good data being collected on the problem with which<br />
to evaluate the effectiveness of interventions. Many local authorities said they<br />
either didn’t know whether their responses had been effective, that it was too<br />
early to tell or simply didn’t answer the question. Figure 4.8 shows that this<br />
varied by response. CCTV was the most common response implemented with<br />
little knowledge of its effectiveness, perhaps following the current ‘fashion’ for<br />
CCTV. Local authorities restricting access to hot spots, however, tended to be<br />
able to judge whether it had worked or not, perhaps because it is more<br />
obvious whether a hot spot has stopped attracting fly-<strong>tipping</strong>.<br />
45
<strong>Fly</strong>-<strong>tipping</strong>: <strong>Causes</strong>, <strong>Incentives</strong> <strong>and</strong> <strong>Solutions</strong><br />
Figure 4.8: Proportion of local authorities implementing different responses<br />
who were unable to judge their effectiveness<br />
70<br />
60<br />
50<br />
40<br />
30<br />
20<br />
10<br />
0<br />
CCTV(covert) CCTV(visible) Education Free bulky waste<br />
collection<br />
Enforcement<br />
Community Skip<br />
Schemes<br />
Restricted access to<br />
hot spots<br />
4.2 The case studies<br />
One of the aims of the survey was to identify those local authorities where<br />
some in depth work <strong>and</strong> analysis might be conducted, to show how to<br />
describe problems better <strong>and</strong> what works in responding. Ten areas were<br />
selected on the basis that they said they had good data <strong>and</strong> had implemented<br />
successful interventions.<br />
The details of the resulting case studies appear in the good practice guide <strong>and</strong><br />
won’t be repeated here. The following, however, describes the more general<br />
findings from this work. Bear in mind that these areas were apparently better<br />
set up for problem solving preventive work than others.<br />
Perhaps the first thing to note is the general enthusiasm of those at the sharp<br />
end who helped us with the study. They were all willing participants in the<br />
study <strong>and</strong> had variously made efforts to improve processes, such as<br />
clearance of tips, collection of evidence, preparation of cases for court, <strong>and</strong><br />
work in partnership with others.<br />
The overwhelming finding has to be, however, the poverty of the data<br />
collected locally. We had hoped to be able to undertake some detailed<br />
analysis of local data to produce some examples of the kinds of problem<br />
classifications good crime prevention work involves. <strong>Fly</strong>-<strong>tipping</strong> involves a<br />
range of different people dumping different waste for different reasons. Good<br />
problem solving work requires the detailed analysis of these individual<br />
problems in order to generate effective solutions. In the end, we were unable<br />
to do this with the data available. Particular problems were<br />
46
<strong>Fly</strong>-<strong>tipping</strong>: <strong>Causes</strong>, <strong>Incentives</strong> <strong>and</strong> <strong>Solutions</strong><br />
• Records not being kept about individual incidents<br />
• Inconsistencies in field entries<br />
• Changes in categories used<br />
• Vague, if any, geo-referencing<br />
There was little evidence of analysis of data locally, <strong>and</strong> in any case these<br />
problems severely limit the scope of what would be possible. One example<br />
illustrates the point:<br />
This experienced researcher spent several days trying to make use<br />
of this authority’s data. Even though there were (unusually) records of<br />
each incident kept in Excel going back to 1999, he had to conclude that<br />
nothing useful could be done - the spatial referencing was too<br />
imprecise, data were missing <strong>and</strong> apparently could not be provided, the<br />
spelling/definitions of sub-areas were inconsistent, <strong>and</strong> the goods<br />
tipped had to be manually recoded.<br />
Another problem relates to the lack of any coding, or even recognition often,<br />
of different kinds of problem. For example, analysis of records in another case<br />
study revealed three rather different kinds of problem, all of which were<br />
lumped together as fly-<strong>tipping</strong>:<br />
• what you might call conventional fly-<strong>tipping</strong>, with strangers being seen<br />
dumping waste from vehicles,<br />
• neighbour problems where there seemed to be a persistent problem with a<br />
particular set of nuisance neighbours (who likely appear in other local<br />
authority department <strong>and</strong> police records) <strong>and</strong><br />
• littering, for example throwing a cigarette packet or fast food wrapping out<br />
of a car window<br />
The problem arises in part because of the emphasis on clean up <strong>and</strong><br />
enforcement, so that the data systems are set up to track cases through a<br />
legal process (even here, though, records here were weak, for example in<br />
relation to fine-payment) or to monitor a waste collection contract. More<br />
recently they have been ‘tweaked’ to provide returns to <strong>Fly</strong>capture.<br />
The data are not set up to inform the development of strategic approaches to<br />
the reduction of the problem. Such an approach makes much more dem<strong>and</strong><br />
on data systems that capture the right kind of information, in a consistent way,<br />
<strong>and</strong> the skills of local analysts. Moreover, there didn’t seem to be much<br />
underst<strong>and</strong>ing or appreciation of the need to keep such data, again because<br />
of the overwhelming emphasis of reactive enforcement work rather than<br />
proactive strategic thinking<br />
In relation to interventions, aside from cleaning up the tips, there were broadly<br />
three kinds of effort:<br />
• Enforcement, special crackdowns as well as the routine work of<br />
enforcement officers<br />
47
<strong>Fly</strong>-<strong>tipping</strong>: <strong>Causes</strong>, <strong>Incentives</strong> <strong>and</strong> <strong>Solutions</strong><br />
• Some situational measures, notably CCTV, fencing, the erection of<br />
barriers, <strong>and</strong> the facilitation of natural surveillance by cutting down foliage<br />
• Public education about citizen responsibilities <strong>and</strong> local authority facilities<br />
for disposing of water.<br />
In almost all cases the evidence of impact was at best anecdotal. There was<br />
little if any systematic evaluation.<br />
Bearing in mind that the sites chosen for case study work appeared the better<br />
ones from the survey, the conclusion must be that local authorities are<br />
currently poorly set up to undertake problem analysis <strong>and</strong> strategically driven<br />
reduction work.<br />
48
<strong>Fly</strong>-<strong>tipping</strong>: <strong>Causes</strong>, <strong>Incentives</strong> <strong>and</strong> <strong>Solutions</strong><br />
5 The offender’s perspective<br />
Developing a perspective on the problem from the offender’s point of view<br />
was a major objective of this study. This section examines what we know<br />
about offenders <strong>and</strong> what we have learned from talking to them. There are<br />
three parts to this:<br />
• The first examines what we know from official court records of<br />
prosecutions <strong>and</strong> offenders’ criminal careers<br />
• The second describes the results of a national r<strong>and</strong>omised household<br />
survey of the extent of fly-<strong>tipping</strong><br />
• The third examines the issues to emerge from one-to-one interviews with<br />
convicted offenders <strong>and</strong> businesses involved in the transportation <strong>and</strong><br />
disposal of waste<br />
5.1 Prosecutions <strong>and</strong> criminal careers<br />
This section examines what we know about convicted offenders. Two<br />
datasets were created from nationally held databases:<br />
a) details of prosecutions in magistrate’s courts for contraventions against<br />
four sections of the Environmental Protection Act 1990, for the period<br />
1991-2004. These data were extracted from the Court Proceedings<br />
Database held by the Office for Criminal Justice Reform. The offences<br />
were:<br />
Relevant legislation Environmental Protection Act 1990 section 33 (1)<br />
Description<br />
Depositing, causing the deposition or permitting the deposition,<br />
treating, keeping or disposing of controlled (but not hazardous)<br />
in or on l<strong>and</strong> without a licence<br />
Referred to below as TIPPING CONTROLLED WASTE<br />
Relevant legislation Environmental Protection Act 1990 section 33 (1)<br />
Description<br />
Depositing, causing the deposition or permitting the deposition<br />
of hazardous waste in or on l<strong>and</strong> without a licence<br />
Referred to below as TIPPING HAZARDOUS WASTE<br />
Relevant legislation Environmental Protection Act 1990 section 34<br />
Description<br />
Importing, producing, carrying, keeping, treats or disposes of<br />
controlled waste without taking reasonable measures; failing to<br />
comply with the secretary of states requirements<br />
Referred to below as DUTY OF CARE<br />
Relevant legislation Environmental Protection Act 1990 section 33 (6)<br />
Description<br />
Contravening conditions of a waste management licence<br />
Referred to below as WASTE MANAGEMENT LICENCE<br />
49
<strong>Fly</strong>-<strong>tipping</strong>: <strong>Causes</strong>, <strong>Incentives</strong> <strong>and</strong> <strong>Solutions</strong><br />
b) details of offenders, including their criminal histories, for those<br />
convicted for the above offences in 2004. This data was extracted from<br />
the Police National Computer<br />
Prosecutions<br />
Figure 5.1 shows the number of prosecutions of each type over the 14 year<br />
period, essentially since the Environmental Protection Act was introduced.<br />
Figure 5.1: Number of prosecutions in magistrates courts (Engl<strong>and</strong> & Wales)<br />
450<br />
400<br />
350<br />
300<br />
250<br />
200<br />
150<br />
Tipping controlled waste<br />
Tipping hazardous waste<br />
Duty of care<br />
Waste management licence<br />
100<br />
50<br />
0<br />
1993 1994 1995 1996 1997 1998 1999 2000 2001 2002 2003 2004<br />
Clearly, the number of prosecutions has grown enormously over this period,<br />
as would be expected with new legislation. The risk of prosecution, however,<br />
remains small. On the basis that <strong>Fly</strong>capture suggests around one million flytips<br />
per year, the risk of being sanctioned for fly-<strong>tipping</strong> is less than 1%, even<br />
taking into account the possibility that these court figures underestimate rates<br />
of sanctioning. The upward trend, however, is promising <strong>and</strong> can be expected<br />
to continue, even pick up pace as local authorities exercise their new powers<br />
<strong>and</strong> exp<strong>and</strong> their enforcement work.<br />
There are two rather unusual trends that are worth commenting on here. The<br />
first is the sharp increase in duty of care prosecutions in 2004. This probably<br />
reflects the powers now available to local authorities to check waste transfer<br />
notes <strong>and</strong> suggests that they are indeed beginning to make use of these.<br />
The second is the increase in prosecutions for waste management licence<br />
contraventions, which picks up pace from 2000. The reasons for this are<br />
unknown.<br />
The proportion of cases prosecuted which end in a conviction remain steady<br />
throughout this period at around 80%, <strong>and</strong> as Figure 5.2 shows fines are the<br />
most common sentence for all offences. There is no change in the pattern of<br />
sentencing over this period. The average fine per offender was £2,000, but<br />
50
<strong>Fly</strong>-<strong>tipping</strong>: <strong>Causes</strong>, <strong>Incentives</strong> <strong>and</strong> <strong>Solutions</strong><br />
there was enormous variation. For example, fines for <strong>tipping</strong> hazardous waste<br />
ranged from £300 to £20,899. Immediate custody was rare <strong>and</strong> seems<br />
reserved for the most serious of cases where hazardous waste is involved.<br />
Figure 5.2: Sentencing outcomes 1993-2004<br />
% of those found guilty<br />
1200<br />
1000<br />
800<br />
600<br />
400<br />
200<br />
Tipping controlled waste<br />
Tipping hazardous waste<br />
Duty of care<br />
Waste management<br />
licence<br />
0<br />
Absolute<br />
Discharge<br />
Conditional<br />
Discharge<br />
Fine<br />
Community<br />
Sentence<br />
Suspended<br />
Sentence<br />
Immediate<br />
Custody<br />
Other<br />
Disposal<br />
The figures reported in Figure 5.1 <strong>and</strong> Figure 5.2 show a slightly different<br />
pattern to that reported by the Environment Agency. The conviction rate of<br />
prosecutions brought by the EA is higher at 96% but with a lower average fine<br />
of £1500 (Better Regulation Executive, 2005).<br />
Figure 5.3 shows prosecutions by region, <strong>and</strong> reveals the extent to which duty<br />
of care cases are concentrated in London. Again, the reason for this unusual<br />
pattern is not known.<br />
51
<strong>Fly</strong>-<strong>tipping</strong>: <strong>Causes</strong>, <strong>Incentives</strong> <strong>and</strong> <strong>Solutions</strong><br />
Figure 5.3: Number of prosecutions by region, 1993-2004<br />
North East<br />
North West<br />
Yorkshire <strong>and</strong> Humberside<br />
East Midl<strong>and</strong>s<br />
West Midl<strong>and</strong>s<br />
East<br />
London<br />
South East<br />
South West<br />
Wales<br />
0 100 200 300 400 500 600 700 800 900<br />
Number of Prosecutions<br />
Tipping Controlled Waste Tipping Hazardous Waste Duty of Care Waste Management Licence<br />
Source: Court Proceedings Database at the Office for Criminal Justice Reform.<br />
Offenders’ criminal careers<br />
Information about individuals convicted of one or more of the fly-<strong>tipping</strong><br />
offences during 2004 was obtained from the Home Office Police National<br />
Computer data. This included importantly their criminal histories, to develop<br />
an offender profile.<br />
In matching court records of prosecutions with those on the PNC,<br />
discrepancies between the two databases emerged. According to the Court<br />
Proceedings Database at the Office for Criminal Justice Reform, the total<br />
number of convictions for these four offences in 2004 was 705. However,<br />
PNC only appeared to have a record of 342 of these offences. These<br />
differences varied according to the type of offence, as shown in Table 5.1.<br />
Table 5.1: Number of fly-<strong>tipping</strong> convictions in Engl<strong>and</strong> <strong>and</strong> Wales in 2004,<br />
according to the Court Proceedings Database at the Office for Criminal<br />
Justice Reform (CPD at OCJR) <strong>and</strong> the Home Office Police National<br />
Computer (HOPNC).<br />
CPD at<br />
OCJR<br />
HOPNC<br />
52
<strong>Fly</strong>-<strong>tipping</strong>: <strong>Causes</strong>, <strong>Incentives</strong> <strong>and</strong> <strong>Solutions</strong><br />
Tipping Controlled Waste 185 218<br />
Tipping Hazardous Waste 40 44<br />
Duty of Care 217 34<br />
Waste Management Licence 263 46<br />
All Offences 705 342<br />
Source: Court Proceedings Database at the Office for Criminal Justice<br />
Reform <strong>and</strong> Home Office Police National Computer.<br />
While there are discrepancies in most offence types, these are more<br />
pronounced for the duty of care <strong>and</strong> waste management licence cases where<br />
only 20% appear on PNC. One possible reason for this is that local authorities<br />
<strong>and</strong> the Environment Agency are not routinely informing PNC of convictions in<br />
the cases that they prosecute. This means that knowledge about offenders,<br />
<strong>and</strong> particularly their previous offences, is compromised. This is an issue<br />
worth exploring further.<br />
PNC revealed that 170 offenders were responsible for the 342 fly-<strong>tipping</strong><br />
offences. Moreover they had also between them been previously convicted of<br />
1,008 other offences.<br />
The age profile of this group was older than for the general criminal population.<br />
Their mean age for a first appearance in court for a fly-<strong>tipping</strong> offence was<br />
37.4 years 3 , see Figure 5.4 (SD=14.4; min=15.8; max=73.7). This compares<br />
with studies showing that the peak age for offending generally is the late teens<br />
<strong>and</strong> early 20s. Indeed, the age at which these offenders appear in court for<br />
any offence is 30.2yrs. They appear, on the whole, to be a group of offenders<br />
who either begin a criminal career later, or are cleverer, having managed to<br />
avoid capture for some time.<br />
3 Please note this data was available for just 138 offenders (81.2% of the total sample).<br />
53
<strong>Fly</strong>-<strong>tipping</strong>: <strong>Causes</strong>, <strong>Incentives</strong> <strong>and</strong> <strong>Solutions</strong><br />
Figure 5.4: Age at first appearance in court for a fly-<strong>tipping</strong> offence<br />
20<br />
15<br />
Frequency<br />
10<br />
5<br />
0<br />
20.00 30.00 40.00 50.00 60.00 70.00<br />
Analysis of their offending patterns reveals that 61% of these offenders had<br />
been convicted of just one offence (Table 5.2), but that there were some<br />
prolific offenders. The 39% of offenders accounted for 70% of all offences <strong>and</strong><br />
6% of offenders account for 22% of offences. Within the specific offence types:<br />
• 7% of <strong>tipping</strong> controlled waste offenders accounted for 24% of these<br />
offences<br />
• 6% of <strong>tipping</strong> hazardous waste offenders accounted for 23% of these<br />
offences<br />
• 5% of duty of care offenders accounted for 12% of these offences<br />
• 5% of waste management licence offenders accounted for 28% of these<br />
offences<br />
Table 5.2: Percentage of offenders <strong>and</strong> offences by offence type<br />
Number of <strong>Fly</strong>-<strong>tipping</strong><br />
Offences<br />
Age<br />
1 2 3 4 5 6 7 8 13 15<br />
N<br />
base<br />
TIPPING % Offenders 70 16 7 4 1 1 1 136<br />
CONTROLLED<br />
WASTE % Offences 44 20 12 9 5 3 7 218<br />
TIPPING % Offenders 77 16 6 31<br />
HAZARDOUS<br />
WASTE % Offences 55 23 23 44<br />
DUTY OF % Offenders 57 29 10 5 21<br />
CARE % Offences 35 35 18 12 34<br />
WASTE % Offenders 63 11 5 11 5 5 19<br />
54
<strong>Fly</strong>-<strong>tipping</strong>: <strong>Causes</strong>, <strong>Incentives</strong> <strong>and</strong> <strong>Solutions</strong><br />
MANAGEMENT<br />
LICENCE<br />
% Offences<br />
26 9 7 17 13 28 46<br />
ALL<br />
% Offenders 61 14 11 7 1 3 1 2 1 170<br />
OFFENCES % Offences 30 14 17 14 3 9 2 7 4 342<br />
Source: Home Office Police National Computer.<br />
The implication is that a small number of offenders don’t appear to have been<br />
deterred by their first experiences of the criminal justice system <strong>and</strong> continue<br />
to commit a large number of fly-<strong>tipping</strong> offences.<br />
In addition to fly-<strong>tipping</strong>, 45% of this sample of 170 fly-tippers had criminal<br />
careers, which included other offences. At Table 5.3 shows, 77 fly-tippers also<br />
had convictions for 1,008 other offences.<br />
Table 5.3: Number of non-fly-<strong>tipping</strong> offences committed by fly-<strong>tipping</strong><br />
offenders.<br />
Offence<br />
Number of<br />
Offences<br />
Number of Offenders<br />
(offenders may appear in<br />
more than one offence<br />
category)<br />
Summary motoring offences 255 28<br />
Theft <strong>and</strong> h<strong>and</strong>ling stolen goods 185 50<br />
Summary offences (exc. Motoring) 164 50<br />
Other indictable offences (exc.<br />
58<br />
Motoring) 99<br />
Unknown / Non Engl<strong>and</strong> & Wales 72 23<br />
Burglary 62 22<br />
Violence against the person 50 25<br />
Drug offences 37 14<br />
Criminal damage 32 19<br />
Fraud <strong>and</strong> forgery 30 15<br />
Indictable motoring offences 15 9<br />
Sexual offences 5 4<br />
Robbery 2 2<br />
Total 1,008 77<br />
Source: Home Office Police National Computer.<br />
Further analysis was carried out to test whether fly-tippers have particular<br />
criminal careers <strong>and</strong> profiles. In relation to prolificacy, there seemed little<br />
relationship between a prolific general crime career <strong>and</strong> degree of<br />
involvement in fly-<strong>tipping</strong>. A Pearson’s correlation was conducted between the<br />
proportion of fly-<strong>tipping</strong> offences in an offender’s criminal history <strong>and</strong> the total<br />
number of offences committed. Results showed a significant negative<br />
correlation (r= -.57, p
<strong>Fly</strong>-<strong>tipping</strong>: <strong>Causes</strong>, <strong>Incentives</strong> <strong>and</strong> <strong>Solutions</strong><br />
general offenders might get involved in some fly-<strong>tipping</strong>, the more prolific flytippers<br />
are specialists.<br />
<strong>Fly</strong>-tippers did, however, seem to have a particular type of criminal history.<br />
Table 5.4 compares the proportion of the fly-<strong>tipping</strong> sample convicted of<br />
different offences at different ages with the general population (using<br />
estimates given by Prime, White, Liriano <strong>and</strong> Patel, 2001). The highlighted<br />
cells indicate where the proportion in the fly-<strong>tipping</strong> group is higher than would<br />
be expected from the population estimate.<br />
Table 5.4: Percentage of male fly-<strong>tipping</strong> offenders committing other crimes,<br />
as compared to male population estimates from Prime et al (2001), by age<br />
group<br />
<strong>Fly</strong>-<strong>tipping</strong>: <strong>Causes</strong>, <strong>Incentives</strong> <strong>and</strong> <strong>Solutions</strong><br />
offences, taking the opportunity in relation to less serious offending but<br />
not getting involved in anything more serious<br />
2. The persistent serial fly-tipper who specialises in this, <strong>and</strong> is not<br />
deterred by anything the criminal justice system has thrown at him yet<br />
There are implications here for strategy, in that the two groups are likely to<br />
require different responses.<br />
5.2 The household survey<br />
In order to assess the prevalence of fly-<strong>tipping</strong> amongst the general<br />
household population, a module was included in the December 2005 sweep of<br />
the ONS Omnibus survey. This survey is run by National Statistics every<br />
twelve months, <strong>and</strong> allows government departments to collect data on various<br />
aspects of social policy. A r<strong>and</strong>om sample of 2,000 residential addresses is<br />
selected, <strong>and</strong> one person at each address over the age of 16 yrs is selected<br />
for face-to-face interview. Addresses are visited three times on different days<br />
at different times before the household is coded as a ‘non-contact’.<br />
The fly-<strong>tipping</strong> module explored both actual fly-<strong>tipping</strong> behaviour, <strong>and</strong><br />
temptation to fly-tip. It also examined views about the adequacy of local waste<br />
collection <strong>and</strong> disposal services <strong>and</strong> facilities. The full questionnaire is<br />
available in Appendix A.<br />
A response rate of 65% was achieved for the fly-<strong>tipping</strong> module which<br />
amounted to 1,169 successful interviews from a base of 1,801 eligible<br />
households.<br />
For the household survey, fly-<strong>tipping</strong> was defined as ‘discarding rubbish in<br />
places other than council rubbish tips, or via council waste collection services’.<br />
Respondents were asked to only include items of a 'household black rubbish<br />
bag' size or larger <strong>and</strong> not to include general litter.<br />
Results<br />
Only 1% (11) of respondents said they had fly-tipped in the last 12 months,<br />
although a further 3% said they had been tempted to do so but had not. The<br />
following analyses are based on the 39 people who said they had, or had<br />
been tempted to, fly-tip in the last 12 months.<br />
Table 5.1 shows that the black refuse bag is the most common item to be, or<br />
likely to be dumped followed closely by a range of other waste types.<br />
Interestingly, there is some evidence of a gender effect, with electrical goods<br />
most likely to be dumped by males but garden waste by females. Perhaps this<br />
reflects some gender-based division of labour within the household.<br />
57
<strong>Fly</strong>-<strong>tipping</strong>: <strong>Causes</strong>, <strong>Incentives</strong> <strong>and</strong> <strong>Solutions</strong><br />
Table 5.1: Waste type dumped or tempted to dump, by gender<br />
Type of waste<br />
Male<br />
(%)<br />
Female<br />
(%)<br />
Total<br />
(%)<br />
Black refuse bag 27 27 27<br />
White goods 24 24 24<br />
Furniture 23 21 22<br />
Garden waste 13 31 21<br />
Building waste 22 17 20<br />
Electrical goods (TV, computer, stereo 20 4 13<br />
etc)<br />
Vehicle parts 3 - 2<br />
Tyres 3 - 2<br />
Other 8 16 11<br />
No particularly strong pattern emerged in the types of locations favoured for<br />
fly-<strong>tipping</strong>, the most common location being the roadside but only in 24% of<br />
occasions. The factors that made a location suitable for fly-<strong>tipping</strong> were mainly<br />
convenience (in 42% of cases) <strong>and</strong> because there was already rubbish there<br />
(in 37% of cases). Interestingly, 30% of women said they tried not to be<br />
spotted. This didn’t seem to be an issue for men.<br />
The reasons given for fly-<strong>tipping</strong>, or being tempted to fly-tip are shown in<br />
Table 5.2. Costs emerge from this as less important than ease of access to<br />
waste disposal facilities, including knowing where to go, particularly when<br />
waste storage capacity at home is tight.<br />
Table 5.2: Reasons for fly-<strong>tipping</strong> or being tempted to fly-tip, by gender.<br />
Reason given<br />
Male<br />
(%)<br />
Female<br />
(%)<br />
Total<br />
(%)<br />
Local rubbish tip closed 23 27 24<br />
Nowhere to store rubbish in own<br />
15 36 24<br />
property<br />
Lack of transport to a local rubbish tip 22 12 18<br />
Didn’t known where to dispose of<br />
10 29 18<br />
rubbish<br />
Council charge to pick up large items 6 10 7<br />
Cost of taking waste to a rubbish tip 3 6 5<br />
Local rubbish tip too far 6 3 5<br />
Missed kerb-side collection - 9 4<br />
Other 34 22 29<br />
Generally speaking, however, the views about waste disposal facilities were<br />
very positive. Seventy-two percent of those interviewed had used their local<br />
civic amenity site in the last 12 months <strong>and</strong> Table 5.3 shows their views on a<br />
range of different aspects. Queuing seems to be the worst problem. Other<br />
58
<strong>Fly</strong>-<strong>tipping</strong>: <strong>Causes</strong>, <strong>Incentives</strong> <strong>and</strong> <strong>Solutions</strong><br />
than that, there seems little more that local waste disposal authorities could do<br />
to improve matters. Overall, 79% of those interviewed said that the experience<br />
of taking rubbish to the local tip was either very easy or easy. Only 9% rated it<br />
as difficult or very difficult. Although the number of fly-tippers is small, their<br />
views of the local tip do not differ greatly from this overall picture. Perhaps this<br />
explains why such a small proportion of people with waste to dispose of do so<br />
by fly-<strong>tipping</strong>.<br />
Table 5.3: Householder rating of local tip<br />
Very good<br />
(%)<br />
Good<br />
(%)<br />
Neither<br />
(%)<br />
Quite poor<br />
(%)<br />
Very poor<br />
(%)<br />
Don’t know<br />
(%)<br />
Distance 43 44 6 4 1 1<br />
Opening times 35 45 8 3 1 8<br />
Queuing 22 44 17 12 3 3<br />
Vehicular<br />
51 35 5 4 2 3<br />
access<br />
Staff help 34 34 17 5 2 8<br />
Capacity 39 43 7 4 1 5<br />
It is interesting that three times as many people were tempted to fly-tip as<br />
went through with it. The reason so many people do not give in to the<br />
temptation seems to be because they are a mainly decent, law-abiding group<br />
for whom it is likely that any risk of being caught is a sufficient deterrent.<br />
When waste disposal facilities appear to be on the whole very good, it seems<br />
simply not worth the risk.<br />
Table 5.4: Reasons for not fly-<strong>tipping</strong>, by gender<br />
Male<br />
(%)<br />
Female<br />
(%)<br />
Total<br />
(%)<br />
Would not knowingly break the law 51 29 43<br />
Fear of being caught 39 53 44<br />
Did not want to harm the environment 37 24 32<br />
Legal disposal method became<br />
29 34 31<br />
available<br />
The opportunity did nor arise 4 12 7<br />
Discouraged by police operations 4 - 3<br />
Discouraged by council action against 4 - 3<br />
fly-tippers<br />
Other 7 - 5<br />
5.3 Interviews with offenders <strong>and</strong> waste producers/carriers<br />
This section describes the issues that emerged from interviews with ten<br />
convicted fly-tippers <strong>and</strong> ten waste producing <strong>and</strong> h<strong>and</strong>ling businesses. The<br />
59
<strong>Fly</strong>-<strong>tipping</strong>: <strong>Causes</strong>, <strong>Incentives</strong> <strong>and</strong> <strong>Solutions</strong><br />
perspective described here comes from the business rather than residential<br />
community.<br />
The ten offender interviews were the result of a long <strong>and</strong> intensive process<br />
trying to persuade offenders to participate in the study. Contact details for 88<br />
offenders convicted in the last twelve months were provided by twelve local<br />
authorities. All these offenders were sent letters inviting their participation.<br />
After a poor response, some local authority enforcement officers made<br />
personal approaches to offenders to persuade them to take part <strong>and</strong> reassure<br />
them about confidentiality. In the end, ten offenders agreed <strong>and</strong> were<br />
interviewed by telephone. The aim was to explore in more depth the incident<br />
for which they were convicted, to underst<strong>and</strong> the circumstances <strong>and</strong> the<br />
reasons why they fly-tipped. In the end, we suspect that those who agreed<br />
were the less serious offenders. More serious <strong>and</strong> serial offenders did not<br />
emerge from our sample.<br />
A total of 594 businesses from the following categories were sampled from the<br />
London area of the Yellow Pages: tyres, gardening, electricians, plumbers,<br />
builders, <strong>and</strong> waste disposal. Ten agreed to be interviewed – five gardening or<br />
l<strong>and</strong>scaping businesses, two waste transfer stations, one removals business,<br />
one skip hire company, <strong>and</strong> one builder. The aim of these interviews was to<br />
explore the issues which interviewees felt would tempt people to fly-tip. These<br />
interviewees were, in effect, ‘proxy’ offenders who may not have fly-tipped<br />
themselves but would be able to express a view from the fly-tippers<br />
perspective.<br />
The following describes the key issues to emerge from these 20 interviews.<br />
They fall into essentially two groups – issues to do with the use of legitimate<br />
tip sites, <strong>and</strong> issues to do with regulation <strong>and</strong> policing of fly-<strong>tipping</strong><br />
Use of legitimate tips<br />
Costs<br />
Avoiding the costs of using legitimate waste disposal facilities emerged as a<br />
strong motive for fly-<strong>tipping</strong>. Eleven interviewees mentioned this unprompted<br />
<strong>and</strong> a further seven explicitly said they were unhappy with the price they had<br />
to pay when using commercial waste disposal sites. None disputed the reality<br />
of having to pay for the service, but the tight margins that many of them<br />
worked with <strong>and</strong> the competitive market meant they were extremely sensitive<br />
to cost issues.<br />
“If you’re a bit hard up on your luck <strong>and</strong> then you see an opportunity to<br />
save some money, <strong>and</strong> it’s a question of making money on a job or<br />
not…then you would be tempted.”<br />
“ it seems like fly-<strong>tipping</strong> has got worse since the rates have<br />
increased.”<br />
60
<strong>Fly</strong>-<strong>tipping</strong>: <strong>Causes</strong>, <strong>Incentives</strong> <strong>and</strong> <strong>Solutions</strong><br />
“If [the prices] continue to go up <strong>and</strong> up we have no choice but to put<br />
the prices up with our clients…we may start losing clients to one man<br />
vans.”<br />
They were particularly sensitive to price increases <strong>and</strong> what they saw as<br />
unfair charging practices. A number of practices that were seen as unfair, <strong>and</strong><br />
potential drivers for fly-<strong>tipping</strong>, emerged<br />
1. Interviewees from small businesses were very sensitive to differences in<br />
cost between local authorities. This was seen as unfair in two ways. First,<br />
it meant that businesses in one area had higher disposal costs than others<br />
<strong>and</strong> second, it implied that one local authority was charging more than they<br />
should.<br />
“They’ve got to make [tip charges] more even across the board.”<br />
The problem arises because disposal sites are run by different companies<br />
who set their own prices. Councils can, however, control this by writing<br />
price limits into the tender documents.<br />
2. Secondly, they were very exercised about how vans were treated which<br />
they thought was often unfair. Vans are usually treated at waste disposal<br />
sites as carrying commercial waste, even though they may contain<br />
household rubbish. This means vans pay more regardless.<br />
“Just because I have a van <strong>and</strong> the bloke next door has a car, he can<br />
take his waste in [to the civic amenity site] but I can’t.”<br />
“You could get an estate car <strong>and</strong> go in 30 times a day couldn’t you?”<br />
3. Setting a minimum charge at many commercial waste disposal sites was<br />
an issue particularly for smaller businesses when the minimum charge was<br />
set at a weight of one ton.<br />
“As a small business owner I can’t afford to do it, I can’t.”<br />
“The minimum charge is unfair.”<br />
“We [contractors] can’t afford to pay one ton <strong>tipping</strong>…It crucifies small<br />
business men.”<br />
Minimum charges such as this affected gardening businesses particularly.<br />
While they may have a large volume of waste (filling their work vehicles) it<br />
is usually quite light so they feel they are being overcharged.<br />
On the other side of the argument one waste transfer station explained<br />
why they have a minimum charge. Each person who comes into the waste<br />
transfer station takes up an employee’s time as they have to check that the<br />
waste is not hazardous <strong>and</strong> supervise them. There is also the paper work<br />
to consider on the accounts.<br />
61
<strong>Fly</strong>-<strong>tipping</strong>: <strong>Causes</strong>, <strong>Incentives</strong> <strong>and</strong> <strong>Solutions</strong><br />
4. Some interviewees felt that charging the same rates for recyclable as nonrecyclable<br />
waste was unfair. Recyclable waste has some value, <strong>and</strong> it was<br />
felt that councils are making money from it.<br />
“Your paying to dump it, <strong>and</strong> they’re gonna turn around, recycle it, <strong>and</strong><br />
make money out of that.”<br />
“You’ve got to give something back, you can’t charge on both ends.”<br />
Others were disappointed that there were no, or very few, local or national<br />
government schemes for waste recycling for business i.e. depots where<br />
traders can deposit recyclable waste.<br />
“There is no recycling facilities for commercial vehicles.”<br />
“For commercial businesses the recycling is abysmal, ridiculous, they<br />
don’t do it.”<br />
Considering the requirement to meet EU recycling targets, it would be<br />
sensible for the government to encourage more business recycling,<br />
especially in businesses where a large proportion of the waste is<br />
recyclable e.g. gardening, l<strong>and</strong>scaping, <strong>and</strong> building.<br />
5. Interviewees also mentioned that some of the tips they went to would not<br />
invoice them for the <strong>tipping</strong> charges, requiring them to pay cash which they<br />
didn’t like for security reasons. Some tips operated accounts for customers<br />
who tipped large amounts of waste, but not for small businesses which<br />
they thought unfair<br />
6. Lastly, one interviewee mentioned, from the householders perspective, the<br />
unfairness of restricting the number of times householders could go to the<br />
tip in one year. If householders go over this number they are charged.<br />
“They limit the amount of time you can go household waste <strong>tipping</strong>…6<br />
times within a year…I don’t put a limit on how much I pay in council tax<br />
do I.”<br />
Various options were suggested to make charging systems fairer, all of which<br />
give some insight into reasons why people get tempted into fly-<strong>tipping</strong>:<br />
• Staggering the price list based on vehicle size, e.g. a car pays £10, a car<br />
<strong>and</strong> trailer pay £15, a van pays £20, a bigger van pays £30 etc.<br />
• Fix prices by volume rather than weight – as it can be difficult to know how<br />
much your rubbish weighs <strong>and</strong> therefore how much you have to pay at the<br />
tip.<br />
• Ensure the price for <strong>tipping</strong> waste legitimately is less than the fines for fly<strong>tipping</strong>.<br />
62
<strong>Fly</strong>-<strong>tipping</strong>: <strong>Causes</strong>, <strong>Incentives</strong> <strong>and</strong> <strong>Solutions</strong><br />
Availability <strong>and</strong> ease of use<br />
Cost emerges as an issue not only in relation to direct charges but also to the<br />
time it takes to use tips - travelling to the tip, getting weighed in, unloading<br />
waste, getting weighed out, <strong>and</strong> getting to the next job.<br />
“It takes time, plus you have to pay for it”<br />
This can impact on the earnings of a small business, especially a ‘one man’<br />
business, <strong>and</strong> fly-<strong>tipping</strong> becomes an option which some choose to take. Two<br />
interviewees believed that increasing the availability of tips locally will make it<br />
much more likely that people are going to use them.<br />
“The more localised the facility the more likely it is to be used.”<br />
“I think there should be more rubbish bins <strong>and</strong> dumps around.”<br />
When asked what would prevent fly-<strong>tipping</strong> one interviewee answered “better<br />
collection services [domestic], <strong>and</strong> more dumps.”.<br />
Queues outside tips can also present a cost to small businesses. One<br />
interviewee fly-tipped because the queue was too long at the local tip <strong>and</strong> he<br />
needed to clear his vehicle for the next job of the day. He decided to fly-tip.<br />
The opening times of local tips was also mentioned as an issue <strong>and</strong> potential<br />
obstacle to their use. For example, often tips will close at 3.30pm in the winter<br />
because of daylight hours. Many interviewees, however, would work beyond<br />
this time <strong>and</strong> need their vans free to complete the days work as well as to<br />
start a new job the next morning.<br />
“I think opening hours are an issue.”<br />
“The dumps could be open longer.”<br />
Another interviewee stated that his local tip operated restricted opening hours<br />
for commercial vehicles, so that it was not available until 3pm. This could<br />
mean being unable to tip waste <strong>and</strong> empty the vehicle, <strong>and</strong> therefore continue<br />
with the days work.<br />
Knowing where the tips are<br />
Interviewees highlighted the lack of information about local commercial <strong>tipping</strong><br />
facilities <strong>and</strong> this was indeed supported by the researchers own experiences<br />
in talking to local authorities, many of whom also did not know where all the<br />
available commercial tip sites were.<br />
“It’s not commonly known where people [businesses] can go to dispose<br />
of recyclable waste”<br />
63
<strong>Fly</strong>-<strong>tipping</strong>: <strong>Causes</strong>, <strong>Incentives</strong> <strong>and</strong> <strong>Solutions</strong><br />
Similarly, when individuals take waste to the tip <strong>and</strong> find out they can’t dump it<br />
there for whatever reason, the tip workers sometimes cannot tell them an<br />
alternative place to take it.<br />
“There’s nowhere to dump fridges <strong>and</strong> computers…if you go down to<br />
the local dump they won’t take it off you…<strong>and</strong> they won’t tell you where<br />
you can take it”<br />
.<br />
Often these businesses work in areas they are unfamiliar with, which puts<br />
them at even more of a disadvantage. One interviewee told how, in such<br />
circumstances, he spent the best part of two days trying to find a registered<br />
waste disposal site. He tried the local council who were of no help then he<br />
phoned the EA. The EA were only able to give him the address of one site,<br />
when the interviewee turned up at the site he found it was closed down.<br />
Interviewees would like a simple way to find out local information – especially<br />
when their jobs require them to travel to places they are not familiar with.<br />
Some suggested that there should be an internet service set up for this. While<br />
the EA does have online public registers, it does not include a register of all<br />
waste disposal sites <strong>and</strong> what waste can be taken there.<br />
Corruption at tips<br />
We were told some stories of what amounted to some very dubious <strong>and</strong><br />
possibly even corrupt practices at tips. These highlight the areas of sensitivity<br />
for businesses, <strong>and</strong> where they are most vulnerable.<br />
Some tips workers take advantage of the need for workers to clear their vans<br />
at the end of the day. One practice seemed to be to prevent vans entering<br />
after 3.15pm, claiming that they wouldn’t be able to clear their waste <strong>and</strong> be<br />
off site by closing time at 3.30pm, unless a bribe was paid. The going rate<br />
seemed to be £10.<br />
Another practice was to take bribes for allowing waste to be dumped for free<br />
or a reduced cost. At tips where there are no weighbridges <strong>and</strong> weight is<br />
estimated by tip workers, there is more scope to get away with such corrupt<br />
practices.<br />
While not corruption, one interviewee told of a tip that would turn people away<br />
if they weren’t wearing a yellow high visibility jacket. Even if they were wearing<br />
an orange high visibility jacket, they would be made to buy a yellow one from<br />
the tip workers before being allowed on site.<br />
The regulation <strong>and</strong> policing of fly-<strong>tipping</strong><br />
Waste carriers’ licences<br />
It was clear from our interviews that the waste carrier license had fallen into<br />
disrepute. One interviewee described it as a “complete scam”. Not all of the<br />
businesses we interviewed who needed a waste carrier’s licence had one,<br />
64
<strong>Fly</strong>-<strong>tipping</strong>: <strong>Causes</strong>, <strong>Incentives</strong> <strong>and</strong> <strong>Solutions</strong><br />
<strong>and</strong> six out of ten businesses interviewed couldn’t see the value of having one<br />
“I’m paying the dump to dump stuff, why do I have to pay you [Environment<br />
Agency]?…its basically a certificate, <strong>and</strong> that’s all we do get” .<br />
It was felt that if a value could be demonstrated, more people would get one.<br />
Two particular ways which might encourage more take up would be if it:<br />
• gave them access to places they otherwise couldn’t use. Generally,<br />
businesses are not checked for their licence when taking waste to an<br />
appropriate waste disposal site<br />
• gave them access to information that was relevant to their business. Four<br />
businesses felt that for the cost of the licence they should at least receive<br />
regular updates from the EA on waste disposal regulations <strong>and</strong> other<br />
related information . At the moment it was felt that “There is precious little<br />
information… As a licensed waste carrier there should be some form of<br />
information that comes out to you”.<br />
Perhaps because of this lack of any practical value, many people didn’t even<br />
know they needed a licence. “Not a great deal of people i.e. builders, know<br />
the law until they are stopped.”. This particular interviewee felt it was unfair<br />
that he paid for the licence while his competitors didn’t even know they<br />
needed one. “If it’s law for one it should be law for everybody.”<br />
Interviewees couldn’t see how the licence as currently operated could control<br />
fly-<strong>tipping</strong>. “If you force every contractor to have a licence – doesn’t mean<br />
they’re not going to tip”.. One interviewee pointed out that in theory you could<br />
be stopped by police <strong>and</strong> the council could check your waste carriers licence,<br />
but then after the check you could just dump the waste a couple of miles down<br />
the road.<br />
In addition to giving the licence some practical value, a number of other ideas<br />
were suggested for improvement:<br />
• there should only be licences for hazardous waste, WEEE, <strong>and</strong> other<br />
specifically regulated waste<br />
• displaying the licence in the front windscreen of vehicles – similar to a tax<br />
disc, which would be easier for authorities to check; <strong>and</strong> doing proper<br />
checks on people before they get given licences.<br />
• licences should be charged per vehicle rather than per business. Currently,<br />
this disadvantages the smaller ‘one man <strong>and</strong> a van’ business who has to<br />
pay as much as the larger business operating many vehicles<br />
• more checks on those people applying for a licence to make sure they are<br />
fit <strong>and</strong> proper to h<strong>and</strong>le waste. “As far as I’m concerned it’s just a paper<br />
exercise…there doesn’t seem for me to be any checks done into who is<br />
actually applying.”<br />
65
<strong>Fly</strong>-<strong>tipping</strong>: <strong>Causes</strong>, <strong>Incentives</strong> <strong>and</strong> <strong>Solutions</strong><br />
Duty of care<br />
There was scepticism amongst some of these businesses about the impact of<br />
the new duty of care regulations for householders. Particularly it was felt that<br />
their ‘clients’ would not know about these <strong>and</strong> continue to employ the<br />
cheapest contractors who undercut others by fly-<strong>tipping</strong>. Indeed some<br />
businesses did not know about these new regulations themselves <strong>and</strong> had to<br />
be told by the interviewer.<br />
To enable householders to operate their new duties, it was thought key to<br />
inform them more about the costs of waste disposal. This would then enable<br />
them to be alert to any unrealistically low quote for a clearance job, <strong>and</strong> to<br />
employ more honest contractors. Otherwise such contractors face being<br />
undercut <strong>and</strong> going out of business<br />
“Let the public know more, if they know it’s £100 or whatever to supply<br />
a skip <strong>and</strong> someone’s going to clear it for £50 <strong>and</strong> load it up then<br />
something’s not right”<br />
“I think public awareness needs to be improved, because obviously it<br />
is the public that employ these rogue tradesmen.”<br />
Penalties for fly-<strong>tipping</strong><br />
There were mixed views on the most effective deterrents for fly-<strong>tipping</strong>. Some<br />
thought that fines should be harsher. The combination of low fines <strong>and</strong> small<br />
risk of capture meant that currently it was cheaper to fly-tip than to pay the tip<br />
fees all the time.<br />
“They’ve [council] gotta make it so that people think if I get fined for<br />
<strong>tipping</strong> this – for fly-<strong>tipping</strong> – it will cost me more than it would if I go to<br />
the tip <strong>and</strong> tip it.”<br />
Others had different ideas on how to deter fly-tippers:<br />
“What they really want to do is start confiscating peoples vehicles <strong>and</strong><br />
start crushing them or selling them.”<br />
“A fine is a very good deterrent, but not as good as public humiliation.”. This<br />
was based on experience when this offender’s face <strong>and</strong> name were published<br />
in two of his local papers, <strong>and</strong> on a local radio station. “The way to stop this<br />
[fly-<strong>tipping</strong>] is to get the people who are doing it <strong>and</strong> on the front of the daily<br />
paper <strong>and</strong> stick all their bloody faces on it…” .<br />
Community service was seen as ineffective. One offender who had been<br />
given a community sentence felt that this was no deterrent as all you are<br />
really required to do is turn up (although he actually worked). “Community<br />
service isn’t worth the paper it’s written on…It’s an absolute joke.”<br />
Sometimes its hard to do the right thing<br />
66
<strong>Fly</strong>-<strong>tipping</strong>: <strong>Causes</strong>, <strong>Incentives</strong> <strong>and</strong> <strong>Solutions</strong><br />
There were a number of examples where interviewees appeared to have been<br />
trying to do the right thing, but were nevertheless prosecuted <strong>and</strong> fined by the<br />
local authority.<br />
In one instance an individual was charged with fly-<strong>tipping</strong> because the council<br />
believed he had left bulky waste outside his property. In fact the individual had<br />
employed a legitimate waste disposal company to remove it but they had<br />
failed to do so as agreed. This individual was prosecuted but acquitted by the<br />
judge who told the council that the case should have never gone to court.<br />
However, he still got a conditional discharge, which meant his name was put<br />
on record for 12 months. The individual also had to pay court costs of £800 as<br />
the judge said he had to get costs from someone. He also had to take time off<br />
work to attend four court appearances during his prosecution. The individual<br />
said his prosecution was just prior to a blitz on fly-<strong>tipping</strong> by the council – he<br />
believes this is part of the reason why his case went to prosecution in the first<br />
place. He believes the case could have been easily h<strong>and</strong>led out of court which<br />
would have been less time consuming <strong>and</strong> less expensive.<br />
In another case an individual <strong>and</strong> his friend were both prosecuted for putting<br />
rubbish bags outside someone else’s house (on the evening before collection<br />
day). They put one bag in the rubbish bin – which already had some rubbish<br />
in it - <strong>and</strong> two beside the bin. The individuals couldn’t put it outside their own<br />
residence because of the councils ‘no side waste’ policy. They didn’t think<br />
they were doing anything wrong as they believed the waste was going to be<br />
picked up on the following day (collection day). The council then prosecuted<br />
the individuals <strong>and</strong> they received a fine of £175 each. The interviewee says<br />
they felt criminalised by the process. He felt that a £50 fine <strong>and</strong> an apology to<br />
the person whose house they put the rubbish outside would have been more<br />
appropriate.<br />
In this final example, an individual who was working on his own house took<br />
some brickwork to the tip in a trailer to dump as domestic waste. As the tip<br />
workers knew him as a trader, however, they said he had to pay. When the<br />
individual said it was waste from his own house, the tip workers said they<br />
needed someone from the council to verify this. The council were unable to<br />
send anyone to make the check for at least one week, which left the individual<br />
with a trailer full of bricks. As the trailer was rented, he couldn’t afford to keep<br />
it for longer than a week. After making every effort to get the council <strong>and</strong> even<br />
the police to help, he decided to dump the bricks on the steps of Town Hall in<br />
protest. He neatly stacked the bricks <strong>and</strong> contacted the local paper. He was<br />
charged <strong>and</strong> prosecuted for fly-<strong>tipping</strong>. The individual believed he had done<br />
everything possible to get rid of the waste legally.<br />
Thinking strategically<br />
Policing <strong>and</strong> enforcement was generally thought not to be the way forward in<br />
controlling fly-<strong>tipping</strong>. Rather, a more strategic approach should be taken that<br />
deals with some cross-cutting issues. For example, while increasing prices at<br />
tip sites might reduce usage <strong>and</strong> therefore reflect well on the council’s use of<br />
67
<strong>Fly</strong>-<strong>tipping</strong>: <strong>Causes</strong>, <strong>Incentives</strong> <strong>and</strong> <strong>Solutions</strong><br />
l<strong>and</strong>fill, it won’t actually help control fly-<strong>tipping</strong>. As one offender put it “The<br />
government wants us to reduce the amount of waste we are disposing of, but<br />
all we are doing is we are responding to customer requirement. You don’t get<br />
fewer leaves fall from the trees just because waste is more expensive.” The<br />
same interviewee went on “Waste is a product of growth at the end of the day<br />
<strong>and</strong> if the government want the economy to grow they have to underst<strong>and</strong> that<br />
waste is going to grow with it.”<br />
Another interviewee commented that the current regime did nothing to create<br />
any incentives for disposing of waste legitimately. “There is no incentive to<br />
dispose of your waste in a more responsible way.” Another commented on his<br />
friend’s fly-<strong>tipping</strong> “It was a case of laziness <strong>and</strong> ease really”, i.e. the default<br />
was to fly-<strong>tipping</strong> rather than proper disposal. The advice was summed up by<br />
one offender thus:<br />
“Basically what they’ve gotta do is sit down <strong>and</strong> say alright we need to<br />
make it more convenient, more accessible financially for small business<br />
people to start dumping their rubbish [at a legitimate site] rather than<br />
[fly-] <strong>tipping</strong> it…”<br />
68
<strong>Fly</strong>-<strong>tipping</strong>: <strong>Causes</strong>, <strong>Incentives</strong> <strong>and</strong> <strong>Solutions</strong><br />
6 Conclusions<br />
The principal aim of this study was to underst<strong>and</strong> better the incentives for, <strong>and</strong><br />
‘causes’ of fly-<strong>tipping</strong>, to enable more effective preventive policies <strong>and</strong><br />
practices to be developed. While it is possible to theorise about ‘drivers’ of fly<strong>tipping</strong>,<br />
this study sought to get an insight into the problem from the offender’s<br />
perspective, as it is their perceptions <strong>and</strong> experiences that have to be<br />
changed if any reduction strategy is to be effective.<br />
The strong view of waste authorities is that there are two key drivers of fly<strong>tipping</strong>:<br />
• The costs of legitimate disposal; <strong>and</strong><br />
• the availability of civic amenity <strong>and</strong> other waste disposal sites.<br />
These drivers also emerged strongly from interviews with fly-tippers<br />
themselves, although there were some differences between two main groups<br />
– traders <strong>and</strong> householders<br />
Traders<br />
Avoiding the costs of legitimate waste disposal facilities emerged as a very<br />
strong motive for fly-<strong>tipping</strong> amongst traders. The analysis by Oxfordshire<br />
waste disposal authority clearly shows what happens when it becomes more<br />
costly to dispose of waste, in this case tyres, legitimately.<br />
It is not, however, simply the fact that they are charged that is the issue for<br />
these small businesses but how pricing practices affect their competitiveness<br />
locally. They listed a range of what they saw as unfair practices. These<br />
tempted them into fly-<strong>tipping</strong> either because they saw them as inherently<br />
unfair (for example minimum charges) or because they felt that these<br />
disadvantaged them in relation to their competitors who may be charged less.<br />
The availability of tip sites was an issue for traders insofar as this could impact<br />
also on their business. A number of issues were raised in this respect.<br />
Although one was distance to travel, another more prevalent one appeared to<br />
be the way that the tip site opening times fitted into their working day. Traders<br />
frequently wanted to clear their vans <strong>and</strong> lorries of waste at the end of the day,<br />
in readiness for an early start the next. The opening times of tip sites for<br />
commercial waste often did not accommodate this schedule, particularly in<br />
winter months when daylight hours meant that they closed early. There were<br />
tales of corrupt tip site workers also taking advantage of this need, <strong>and</strong><br />
holding vans who turned up close to closing time almost to ransom.<br />
Another issue which emerged strongly in relation to tip sites was information<br />
about where they were. Traders often complained about the lack of<br />
information, <strong>and</strong> how hard it was to find out where to go to tip waste. This was<br />
a particular problem for those traders working in unfamiliar locations. The<br />
69
<strong>Fly</strong>-<strong>tipping</strong>: <strong>Causes</strong>, <strong>Incentives</strong> <strong>and</strong> <strong>Solutions</strong><br />
experience of the researchers also was that such information was not easily<br />
obtained, even from the local authority or civic amenity site workers.<br />
Finally, the duty of care system seemed to have fallen into disrepute. These<br />
businesses saw no incentive, for example, for buying a waste carrier licence.<br />
Some felt that the system disadvantaged small businesses as the cost per<br />
vehicle was much higher for them than their larger competitors. Some were<br />
unaware of the recent duty of care legislation, <strong>and</strong> those that were couldn’t<br />
see how it would make much difference to fly-<strong>tipping</strong>.<br />
Overall, the picture painted here was of a system which actually at times<br />
made it quite hard to behave honestly <strong>and</strong> legally. There seemed few<br />
incentives to comply with the duty of care regulations, <strong>and</strong> those that did felt<br />
disadvantaged competitively. This issue of a system that defaults to<br />
dishonesty, i.e. where the costs of honesty outweigh the costs of dishonesty,<br />
emerged throughout the study.<br />
Householders<br />
Black bin bags or household rubbish consistently emerge as the main fly-tip<br />
problem, at least in terms of volume. It was, therefore, somewhat surprising<br />
that just 1% of householders in the survey admitted to having fly-tipped in the<br />
last twelve months. This can be partially explained by the fact that some local<br />
authorities include side waste, or waste put out at the wrong time, as fly<strong>tipping</strong><br />
whereas a householder might not.<br />
Nevertheless, <strong>Fly</strong>capture data suggests that there are about one million<br />
incidents of fly-<strong>tipping</strong> each year in Engl<strong>and</strong>. The household survey found that<br />
1% of households had fly-tipped in the last twelve months. On the basis that<br />
this amounts to around 250,000 fly-tips nationally by householders each year,<br />
this suggests that householders are responsible for around a quarter of all flytips<br />
nationally.<br />
Interestingly, the same survey reveals that around 3% of households had<br />
been tempted to fly-tip but had not. Given the generally very positive views<br />
about the availability <strong>and</strong> ease of using civic amenity sites, this suggests that<br />
the current waste collection <strong>and</strong> disposal arrangements <strong>and</strong> enforcement<br />
regime are preventing around at least 750,000 fly-tips per year, i.e. the<br />
problem could be much worse. The question is what more to do.<br />
As might be expected for this group, costs of legitimate disposal emerge as<br />
less of driver for fly-<strong>tipping</strong> than being able to use a civic amenity site. People<br />
fly-tipped because the site was closed or they didn’t have transport to get to it.<br />
Loading up a car only to find that the site is closed when you get to it seems a<br />
not unusual experience, leading to the waste being dumped at a convenient<br />
location. Equally, many people living in areas of multiple deprivation do not<br />
have access to a vehicle to get to a civic amenity site.<br />
Areas of multiple deprivation suffer particularly from fly-<strong>tipping</strong>. As well as less<br />
availability of transport to get to civic amenity sites, the higher density housing<br />
70
<strong>Fly</strong>-<strong>tipping</strong>: <strong>Causes</strong>, <strong>Incentives</strong> <strong>and</strong> <strong>Solutions</strong><br />
may mean that there is less storage available to householders for their waste<br />
so they have a greater need to dispose of it more regularly. This can lead to<br />
more black bags appearing on the street before the timed collection, <strong>and</strong> more<br />
side waste.<br />
Even in these circumstances, however, there are examples of people trying to<br />
do the right thing. For example, waste is often dumped outside the gates of<br />
civic amenity sites, <strong>and</strong> householders will dump their side waste next to their<br />
neighbours waste, in the expectation that the waste will be easily collected.<br />
Some even think that this is what you are supposed to do in these<br />
circumstances.<br />
Although these problems are defined in <strong>Fly</strong>capture terms as fly-<strong>tipping</strong>, local<br />
authorities need to make the distinction between low-level fly-<strong>tipping</strong> <strong>and</strong><br />
waste crime. Indeed, in some cases these problems may be better conceived<br />
of as the consequence of inadequate waste collection arrangements that do<br />
not quite meet the needs of residents.<br />
Serial <strong>and</strong> opportunistic offenders<br />
In general crime control work it is well recognised that there are two kinds of<br />
offender:<br />
• opportunistic offenders, who take advantage of an opportunity to make<br />
some money or show off or whatever. These offenders are generally less<br />
motivated to break the law <strong>and</strong> therefore easily deterred. There are a lot of<br />
them.<br />
• persistent <strong>and</strong> prolific offenders, who account for a great deal of crime.<br />
There are not many of them, but they are highly motivated <strong>and</strong> therefore<br />
less easily deterred.<br />
The data examined here on convicted offenders suggests that the same two<br />
types of fly-tipper exist. 39% of offenders had only been convicted once while<br />
6% of offenders accounted for 22% of all offences. The one-off offenders<br />
seem to be generally more petty <strong>and</strong> opportunistic offenders, having<br />
convictions for other offences. The prolific fly-tippers appear to be specialists.<br />
This is important information. It means that two kinds of response are required<br />
for each group of offender. Measures that make it harder or less rewarding to<br />
fly-tip are more likely to deter the opportunistic group. The more committed<br />
group are the ones where enforcement resources need to be focused.<br />
Strategic thinking<br />
One of the big challenges in organising a strategic response to fly-<strong>tipping</strong><br />
locally is the poor capacity by local authorities for problem oriented work <strong>and</strong><br />
strategic thinking aimed at prevention. Enforcement dominates thinking, even<br />
when it is not seen as terribly effective <strong>and</strong> penetrates the fly-<strong>tipping</strong><br />
community very little.<br />
71
<strong>Fly</strong>-<strong>tipping</strong>: <strong>Causes</strong>, <strong>Incentives</strong> <strong>and</strong> <strong>Solutions</strong><br />
The incentives <strong>and</strong> drivers identified above show that a more strategic<br />
response from local authorities will require:<br />
• collection <strong>and</strong> disposal services to work together as well as other<br />
organisations such as planning authorities<br />
• neighbouring authorities to work together to ensure their strategies align<br />
• better data collection <strong>and</strong> analysis, aimed at better underst<strong>and</strong>ing<br />
problems <strong>and</strong> local patterns<br />
• more evaluation <strong>and</strong> the development of a knowledge base of what works<br />
or what might work (the accompanying good practice guide provides<br />
guidance here)<br />
• ability to recognise <strong>and</strong> pass upwards higher level problems for action, for<br />
example recycling or l<strong>and</strong>fill targets set by national government might be<br />
having perverse local effects which result in more fly-<strong>tipping</strong><br />
This study shows they are weak on all these.<br />
There is also action here for the Environment Agency <strong>and</strong> Defra, for example<br />
to deal with the weaknesses in the duty of care system <strong>and</strong> to ensure a<br />
national waste strategy which thinks through impact on fly-<strong>tipping</strong>, <strong>and</strong> which<br />
recognises the contribution of other organisations such as the ODPM <strong>and</strong> its<br />
responsibilities for planning guidance. In a period of major house building<br />
programmes, whenever higher housing densities are encouraged, there is<br />
more need than ever to think through the planning requirements that would<br />
minimise fly-<strong>tipping</strong> risk.<br />
72
<strong>Fly</strong>-<strong>tipping</strong>: <strong>Causes</strong>, <strong>Incentives</strong> <strong>and</strong> <strong>Solutions</strong><br />
REFERENCES<br />
Austin, C. (1988). The prevention of robbery at building society branches.<br />
Crime Prevention Unit: Paper 14. London: Home Office<br />
BBC. Dumping on <strong>Britain</strong>. BBC One, 19.00hrs, Wednesday 4 May 2005.<br />
Better Regulation Executive (2005). Regulatory Justice: Sanctioning in a post-<br />
Hampton World. Cabinet Office: Penalties Review Discussion Paper<br />
Bowers, K. J. & Johnson, S. D. (2003). The role of publicity in crime<br />
prevention: findings from the Reducing Burglary Initiative. Home Office<br />
Research Study, 272. London: Home Office.<br />
Brown, R. & Clarke, R.V. (2004). Police intelligence <strong>and</strong> theft of vehicles for<br />
export: Recent U.K. experience. In M.G. Maxfield <strong>and</strong> R. V. Clarke<br />
(Eds.). Underst<strong>and</strong>ing <strong>and</strong> Preventing Car Theft: Crime Prevention<br />
Studies, 17. Devon, UK: Willan Publishing<br />
Choe, C. & Fraser, I. (1999). An economic analysis of household waste<br />
management. Journal of Environmental Economics <strong>and</strong> Management,<br />
38, 234-246.<br />
Clarke, R. V. & Eck, J. (2003). Become a Problem-Solving Crime Analyst: In<br />
55 small steps. Jill D<strong>and</strong>o Institute of Crime Science: London.<br />
Clean Neighbourhoods <strong>and</strong> Environment Act (2005). Her Majesty’s Stationary<br />
Office. Available: www.opsi.gov.uk<br />
Cole, I., Hickman, P. & Green, S. (2003). Cleaning up the neighbourhood:<br />
Dealing with ab<strong>and</strong>oned cars <strong>and</strong> fly-<strong>tipping</strong>. Research report one.<br />
Centre for Regional Economic <strong>and</strong> Social Research. Available:<br />
http://ndcevaluation.adc.shu.ac.uk/ndcevaluation/Documents/Research<br />
%20Reports/RR1.pdf<br />
Crime <strong>and</strong> Disorder Act (1998). Her Majesty’s Stationery Office. Available:<br />
www.opsi.gov.uk<br />
Defra. (2002). Waste not, Want not: A strategy for tackling the waste problem<br />
in Engl<strong>and</strong>. Defra.<br />
Defra. (2004). <strong>Fly</strong>-Tipping Strategy: February 2004. Defra.<br />
Defra, EA & LGA. (2005). <strong>Fly</strong>capture – Initial Data June-November 2004.<br />
Available: http://www.Defra.gov.uk/environment/<br />
localenv/fly<strong>tipping</strong>/pdf/june- nov2004data.pdf<br />
Dupont, C. & Zakkour, P. (2003). Trends in Environmental Sentencing in<br />
Engl<strong>and</strong> <strong>and</strong> Wales. Defra.<br />
EnCams. (1998). The <strong>Tidy</strong> <strong>Britain</strong> Group Survey 1998. Available:<br />
www.encams.org/publications/research/fly<strong>tipping</strong>1998.pdf<br />
73
<strong>Fly</strong>-<strong>tipping</strong>: <strong>Causes</strong>, <strong>Incentives</strong> <strong>and</strong> <strong>Solutions</strong><br />
EnCams. (2003). <strong>Fly</strong>-<strong>tipping</strong> study 2003. Available:<br />
www.encams.org/information/publications/research/fly_<strong>tipping</strong>_study20<br />
03.pdf<br />
EnCams. (2005). Available:<br />
www.encams.org/aboutus/main.asp?pageid=9&sub=1<br />
Environment Agency (Online). Available: www.environment-agency.gov.uk<br />
Environmental Protection Act (1990). Her Majesty’s Stationery Office.<br />
Available: www.opsi.gov.uk<br />
Environmental Protection Agency (1998). Illegal Dumping Prevention<br />
Guidebook. U.S. EPA: Illinois.<br />
Ferrara, I. (2003). Differential provision of solid waste collection services in the<br />
presence of heterogeneous households. Environmental <strong>and</strong> Resource<br />
Economics, 20, 211-226.<br />
Fullerton, D. & Kinnaman, T. C. (1995). Garbage, recycling <strong>and</strong> illicit burning<br />
or dumping. Journal of Environmental Economics <strong>and</strong> Management, 29,<br />
78-91.<br />
Gill, M. & Spriggs, A. (2005). Assessing the impact of CCTV. Home Office<br />
Research Study 292. London: Home Office.<br />
Hansmann, R. & Scholz, R. W. (2003). A two-step informational strategy for<br />
reducing littering behavior in a cinema. Environment <strong>and</strong> Behavior, 35,<br />
752-762.<br />
Huffman, K. T., Grossnickle, W. F., Cope, J. G. & Huffman, K. P. (1995). Litter<br />
reduction: A review <strong>and</strong> integration of the literature. Environment <strong>and</strong><br />
Behavior, 27, 153-183.<br />
Innes, M. (2004 a). Reinventing tradition? Reassurance, neighbourhood<br />
security <strong>and</strong> policing. Criminal Justice, 4, 151-171.<br />
Innes, M. (2004 b). Signal crimes <strong>and</strong> signal disorders: notes on deviance as<br />
communicative action. The British Journal of Sociology, 55, 335-355.<br />
Johnson, S.D & Loxley, C. (2001), Installing alley-gates: practical lessons<br />
from burglary prevention projects. Home Office Briefing Note 2/01<br />
Johnson, S. D. & Bowers, K. J. (2003). Opportunity is in the eye of the<br />
beholder: The role of publicity in crime prevention. Criminology <strong>and</strong><br />
Public Policy, 2, 497-524.<br />
Linderhof, V., Kooreman, P., Allers, M. & Wiersma, D. (2001). Weight-based<br />
pricing in the collection of household waste: the Oostzaan case.<br />
Resource <strong>and</strong> Energy Economics, 23, 359-371.<br />
74
<strong>Fly</strong>-<strong>tipping</strong>: <strong>Causes</strong>, <strong>Incentives</strong> <strong>and</strong> <strong>Solutions</strong><br />
Local Government Association & The Environment Agency. (2005). <strong>Fly</strong>-<strong>tipping</strong><br />
<strong>and</strong> illegal waste activities. Working Better Together, Protocol 6. The<br />
Environment Agency<br />
Maidstone Borough Council. (2002). Health, Environment, Community Safety<br />
<strong>and</strong> Social Inclusion Overview <strong>and</strong> Scrutiny Committee: Second Report,<br />
Municipal Year 2001-02: <strong>Fly</strong><strong>tipping</strong>. Maidstone Borough Council.<br />
Marcus Hodges Environment Limited <strong>and</strong> BDB Associates. (2002). <strong>Fly</strong>-<strong>tipping</strong><br />
on agricultural l<strong>and</strong> in Engl<strong>and</strong> <strong>and</strong> Wales. Unpublished.<br />
Martin, A. & Scott, I. (2003). The effectiveness of the UK l<strong>and</strong>fill tax. Journal of<br />
Environmental Planning <strong>and</strong> Management, 46, 673-689.<br />
M.E.L Research. (2003). Using Surveillance Equipment to Tackle <strong>Fly</strong>-Tipping:<br />
A Good Practice Guide. EnCams.<br />
National Audit Office (2002). Protecting the Public From Waste. London: The<br />
Stationery Office.<br />
National Reassurance Policing Programme. Available:<br />
www.reassurancepolicingco.uk<br />
NetRegs (2002). How green are small businesses. Available:<br />
www.environment-agency.gov.uk/netregs<br />
Niner, P. (2003). Local authority Gypsy/Traveller sites in Engl<strong>and</strong>. London:<br />
Office of the Deputy Prime Minister.<br />
Office of the Deputy Prime Minister. (2005). Best Value Performance<br />
Indicators 2005/06: Guidance Document. London: ODPM Available:<br />
www.odpm.gov.uk<br />
Old, E. (2003). A critical analysis of the factors underlying the trends<br />
associated with fly-<strong>tipping</strong> in Northamptonshire: Implications for local<br />
authorities. MSc Dissertation for Master of Science in Environmental<br />
Management: University College Northampton.<br />
Park, P. (2000). An evaluation of the l<strong>and</strong>fill tax two years on. Journal of<br />
Planning <strong>and</strong> Environmental Law, January, 3-13.<br />
Phillips, C. (1999). A review of CCTV evaluations: Crime reduction effects <strong>and</strong><br />
attitudes towards its use. In K. Painter & N. Tilley (Eds.). Surveillance<br />
of Public Space: CCTV, Street Lighting <strong>and</strong> Crime Prevention. Monsey:<br />
New York.<br />
Prime, J., White, S., Liriano, S., <strong>and</strong> Patel, K. (2001) 'Criminal careers of<br />
those born between 1953 <strong>and</strong> 1978.' Home Office Statistical Bulletin<br />
4/01. London: Home Office<br />
75
<strong>Fly</strong>-<strong>tipping</strong>: <strong>Causes</strong>, <strong>Incentives</strong> <strong>and</strong> <strong>Solutions</strong><br />
Public Accounts Committee, 22 January 2003. Available: http://www.<br />
publications. parliament.uk/pa/cm200203/cmselect/cmpubacc/uc352-<br />
i/uc35202.htm<br />
Riley, D. & Mayhew, P. (1980). Crime prevention publicity: An assessment.<br />
Home Office Research Study, 63. London: Her Majesty’s Stationery<br />
Office.<br />
Skumatz, L. A., Van Dusen, H. & Carton, J. (2001). Illegal dumping: Incidence,<br />
drivers, <strong>and</strong> strategies. Skumatz Economic Research Associates, Inc.<br />
(SERA). Available: www.serainc.com<br />
Smith, M., Jacobson, J. & Webb, B. (2004). Ab<strong>and</strong>oned vehicles in Engl<strong>and</strong>:<br />
Impact of the end of life directive <strong>and</strong> new initiatives, on likely <strong>and</strong><br />
future trends. Resources, Conservation <strong>and</strong> Recycling, 41, 177-189.<br />
The ENDS Report. (1998). Poor monitoring dogs research on fly-<strong>tipping</strong> since<br />
the l<strong>and</strong>fill tax. The ENDS report, 278, 11.<br />
Tilley, N. (1993). Underst<strong>and</strong>ing car parks, crime <strong>and</strong> CCTV: Evaluation<br />
lessons from safer cities. Crime Prevention Unit: Paper 42. London:<br />
Home Office.<br />
Turner, R. K., Salmons, R., Powell, J. & Craighill, A. (1998). Green taxes,<br />
waste management <strong>and</strong> political economy. Journal of Environmental<br />
Management, 5, 121-136.<br />
Webb, B. & Laycock, G. (1991), Reducing crime on the London Underground.<br />
London: Home Office.<br />
Webb, B. & Marshall, B. C. (2004). A problem orientated approach to fly<strong>tipping</strong>.<br />
Jill D<strong>and</strong>o Institute of Crime Science, UCL. Available:<br />
http://www.ucl.ac.uk/jdi/publications/adhoc_publications/fly_<strong>tipping</strong>_rep<br />
ort.php<br />
Welsh, B. C. & Farrington, D.P. (2002). Crime prevention effects of closed<br />
circuit television: a systematic review. Home Office Research,<br />
Development <strong>and</strong> Statistics Directorate. Study 252.<br />
West Midl<strong>and</strong>s Police. (2004). Safer, Cleaner, Greener: Reassurance <strong>and</strong><br />
Liveability Through Civic Renewal. West Midl<strong>and</strong>s Police.<br />
Williams, A. T. & Simmons, S. L. (1999). Sources of riverine litter: The river<br />
Taff, South Wales, UK. Water, Air <strong>and</strong> Soil Pollution, 112, 197-216.<br />
Wilson, J. Q., & Kelling, G. (1982). Broken windows: The police <strong>and</strong><br />
neighbourhood safety. Atlantic Monthly, March, 29-38.<br />
76