Ethanol Can Contribute to Energy and ... - The FIRE Place
Ethanol Can Contribute to Energy and ... - The FIRE Place
Ethanol Can Contribute to Energy and ... - The FIRE Place

You also want an ePaper? Increase the reach of your titles
YUMPU automatically turns print PDFs into web optimized ePapers that Google loves.
REPORTS<br />
<strong>Ethanol</strong> <strong>Can</strong> <strong>Contribute</strong> <strong>to</strong> <strong>Energy</strong><br />
<strong>and</strong> Environmental Goals<br />
Alex<strong>and</strong>er E. Farrell, 1 * Richard J. Plevin, 1 Brian T. Turner, 1,2 Andrew D. Jones, 1 Michael O’Hare, 2<br />
Daniel M. Kammen 1,2,3<br />
To study the potential effects of increased biofuel use, we evaluated six representative analyses<br />
of fuel ethanol. Studies that reported negative net energy incorrectly ignored coproducts <strong>and</strong> used<br />
some obsolete data. All studies indicated that current corn ethanol technologies are much less<br />
petroleum-intensive than gasoline but have greenhouse gas emissions similar <strong>to</strong> those of gasoline.<br />
However, many important environmental effects of biofuel production are poorly unders<strong>to</strong>od.<br />
New metrics that measure specific resource inputs are developed, but further research in<strong>to</strong><br />
environmental metrics is needed. Nonetheless, it is already clear that large-scale use of ethanol<br />
for fuel will almost certainly require cellulosic technology.<br />
<strong>Energy</strong> security <strong>and</strong> climate change imperatives<br />
require large-scale substitution<br />
of petroleum-based fuels as well as<br />
improved vehicle efficiency (1, 2). Although<br />
biofuels offer a diverse range of promising<br />
alternatives, ethanol constitutes 99% of all<br />
biofuels in the United States. <strong>The</strong> 3.4 billion<br />
gallons of ethanol blended in<strong>to</strong> gasoline in<br />
2004 amounted <strong>to</strong> about 2% of all gasoline<br />
sold by volume <strong>and</strong> 1.3% (2.5 10 17 J) of its<br />
energy content (3). Greater quantities of ethanol<br />
are expected <strong>to</strong> be used as a mo<strong>to</strong>r fuel in<br />
the future because of two federal policies: a<br />
/0.51 tax credit per gallon of ethanol used as<br />
mo<strong>to</strong>r fuel <strong>and</strong> a new m<strong>and</strong>ate for up <strong>to</strong> 7.5<br />
billion gallons of Brenewable fuel[ <strong>to</strong> be used<br />
in gasoline by 2012, which was included in the<br />
recently passed <strong>Energy</strong> Policy Act (EPACT<br />
2005) (4, 5).<br />
Thus, the energy <strong>and</strong> environmental implications<br />
of ethanol production are more important<br />
than ever. Much of the analysis <strong>and</strong> public<br />
debate about ethanol has focused on the sign<br />
of the net energy of ethanol: whether manufacturing<br />
ethanol takes more nonrenewable<br />
energy than the resulting fuel provides (6, 7).<br />
It has long been recognized that calculations<br />
of net energy are highly sensitive <strong>to</strong> assumptions<br />
about both system boundaries <strong>and</strong> key<br />
parameter values (8). In addition, net energy<br />
calculations ignore vast differences between<br />
different types of fossil energy (9). Moreover,<br />
net energy ratios are extremely sensitive <strong>to</strong><br />
specification <strong>and</strong> assumptions <strong>and</strong> can produce<br />
uninterpretable values in some important cases<br />
(10). However, comparing across published<br />
studies <strong>to</strong> evaluate how these assumptions affect<br />
outcomes is difficult owing <strong>to</strong> the use of<br />
different units <strong>and</strong> system boundaries across<br />
studies. Finding intuitive <strong>and</strong> meaningful replacements<br />
for net energy as a performance<br />
metric would be an advance in our ability <strong>to</strong><br />
1 <strong>Energy</strong> <strong>and</strong> Resources Group, 2 Goldman School of Public<br />
Policy,<br />
3 Renewable <strong>and</strong> Appropriate <strong>Energy</strong> Labora<strong>to</strong>ry,<br />
University of California, Berkeley, CA 94720–3050, USA.<br />
*To whom correspondence should be addressed. E-mail:<br />
aef@berkeley.edu<br />
evaluate <strong>and</strong> set energy policy in this important<br />
arena.<br />
To better underst<strong>and</strong> the energy <strong>and</strong> environmental<br />
implications of ethanol, we surveyed the<br />
published <strong>and</strong> gray literature <strong>and</strong> present a<br />
comparison of six studies illustrating the range<br />
of assumptions <strong>and</strong> data found for the case<br />
of corn-based (Zea mays, or maize) ethanol<br />
(11–16). To permit a direct <strong>and</strong> meaningful<br />
comparison of the data <strong>and</strong> assumptions across<br />
the studies, we developed the <strong>Energy</strong> <strong>and</strong><br />
Resources Group (ERG) Biofuel Analysis Meta-<br />
Model (EBAMM) (10). For each study, we<br />
compared data sources <strong>and</strong> methods <strong>and</strong> parameterized<br />
EBAMM <strong>to</strong> replicate the published<br />
net energy results <strong>to</strong> within half a percent. In<br />
addition <strong>to</strong> net energy, we also calculated<br />
metrics for greenhouse gas (GHG) emissions<br />
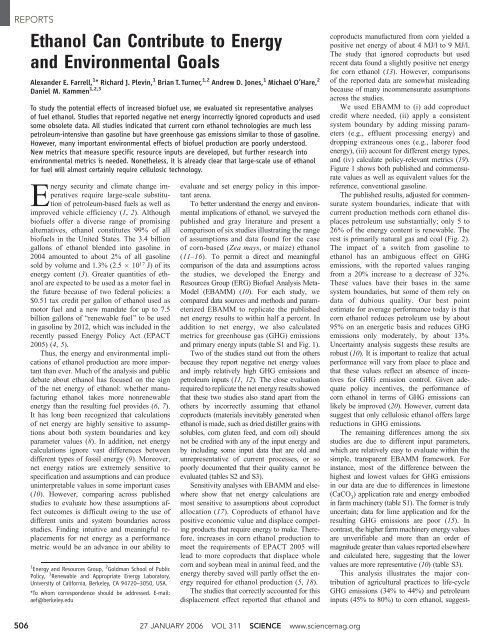
<strong>and</strong> primary energy inputs (table S1 <strong>and</strong> Fig. 1).<br />
Two of the studies st<strong>and</strong> out from the others<br />
because they report negative net energy values<br />
<strong>and</strong> imply relatively high GHG emissions <strong>and</strong><br />
petroleum inputs (11, 12). <strong>The</strong> close evaluation<br />
required <strong>to</strong> replicate the net energy results showed<br />
that these two studies also st<strong>and</strong> apart from the<br />
others by incorrectly assuming that ethanol<br />
coproducts (materials inevitably generated when<br />
ethanol is made, such as dried distiller grains with<br />
solubles, corn gluten feed, <strong>and</strong> corn oil) should<br />
not be credited with any of the input energy <strong>and</strong><br />
by including some input data that are old <strong>and</strong><br />
unrepresentative of current processes, or so<br />
poorly documented that their quality cannot be<br />
evaluated (tables S2 <strong>and</strong> S3).<br />
Sensitivity analyses with EBAMM <strong>and</strong> elsewhere<br />
show that net energy calculations are<br />
most sensitive <strong>to</strong> assumptions about coproduct<br />
allocation (17). Coproducts of ethanol have<br />
positive economic value <strong>and</strong> displace competing<br />
products that require energy <strong>to</strong> make. <strong>The</strong>refore,<br />
increases in corn ethanol production <strong>to</strong><br />
meet the requirements of EPACT 2005 will<br />
lead <strong>to</strong> more coproducts that displace whole<br />
corn <strong>and</strong> soybean meal in animal feed, <strong>and</strong> the<br />
energy thereby saved will partly offset the energy<br />
required for ethanol production (5, 18).<br />
<strong>The</strong> studies that correctly accounted for this<br />
displacement effect reported that ethanol <strong>and</strong><br />
coproducts manufactured from corn yielded a<br />
positive net energy of about 4 MJ/l <strong>to</strong> 9 MJ/l.<br />
<strong>The</strong> study that ignored coproducts but used<br />
recent data found a slightly positive net energy<br />
for corn ethanol (13). However, comparisons<br />
of the reported data are somewhat misleading<br />
because of many incommensurate assumptions<br />
across the studies.<br />
We used EBAMM <strong>to</strong> (i) add coproduct<br />
credit where needed, (ii) apply a consistent<br />
system boundary by adding missing parameters<br />
(e.g., effluent processing energy) <strong>and</strong><br />
dropping extraneous ones (e.g., laborer food<br />
energy), (iii) account for different energy types,<br />
<strong>and</strong> (iv) calculate policy-relevant metrics (19).<br />
Figure 1 shows both published <strong>and</strong> commensurate<br />
values as well as equivalent values for the<br />
reference, conventional gasoline.<br />
<strong>The</strong> published results, adjusted for commensurate<br />
system boundaries, indicate that with<br />
current production methods corn ethanol displaces<br />
petroleum use substantially; only 5 <strong>to</strong><br />
26% of the energy content is renewable. <strong>The</strong><br />
rest is primarily natural gas <strong>and</strong> coal (Fig. 2).<br />
<strong>The</strong> impact of a switch from gasoline <strong>to</strong><br />
ethanol has an ambiguous effect on GHG<br />
emissions, with the reported values ranging<br />
from a 20% increase <strong>to</strong> a decrease of 32%.<br />
<strong>The</strong>se values have their bases in the same<br />
system boundaries, but some of them rely on<br />
data of dubious quality. Our best point<br />
estimate for average performance <strong>to</strong>day is that<br />
corn ethanol reduces petroleum use by about<br />
95% on an energetic basis <strong>and</strong> reduces GHG<br />
emissions only moderately, by about 13%.<br />
Uncertainty analysis suggests these results are<br />
robust (10). It is important <strong>to</strong> realize that actual<br />
performance will vary from place <strong>to</strong> place <strong>and</strong><br />
that these values reflect an absence of incentives<br />
for GHG emission control. Given adequate<br />
policy incentives, the performance of<br />
corn ethanol in terms of GHG emissions can<br />
likelybeimproved(20). However, current data<br />
suggest that only cellulosic ethanol offers large<br />
reductions in GHG emissions.<br />
<strong>The</strong> remaining differences among the six<br />
studies are due <strong>to</strong> different input parameters,<br />
which are relatively easy <strong>to</strong> evaluate within the<br />
simple, transparent EBAMM framework. For<br />
instance, most of the difference between the<br />
highest <strong>and</strong> lowest values for GHG emissions<br />
in our data are due <strong>to</strong> differences in limes<strong>to</strong>ne<br />
(CaCO 3<br />
) application rate <strong>and</strong> energy embodied<br />
in farm machinery (table S1). <strong>The</strong> former is truly<br />
uncertain; data for lime application <strong>and</strong> for the<br />
resulting GHG emissions are poor (15). In<br />
contrast, the higher farm machinery energy values<br />
are unverifiable <strong>and</strong> more than an order of<br />
magnitude greater than values reported elsewhere<br />
<strong>and</strong> calculated here, suggesting that the lower<br />
values are more representative (10) (table S3).<br />
This analysis illustrates the major contribution<br />
of agricultural practices <strong>to</strong> life-cycle<br />
GHG emissions (34% <strong>to</strong> 44%) <strong>and</strong> petroleum<br />
inputs (45% <strong>to</strong> 80%) <strong>to</strong> corn ethanol, suggest-<br />
506<br />
27 JANUARY 2006 VOL 311 SCIENCE www.sciencemag.org
ing that policies aimed at reducing environmental<br />
externalities in the agricultural sec<strong>to</strong>r<br />
may result in significantly improved environmental<br />
performance of this fuel. For example,<br />
conservation tillage reduces petroleum consumption<strong>and</strong>GHGemissionsaswellassoil<br />
erosion <strong>and</strong> agrichemical runoff (20, 21).<br />
We use the best data from the six studies <strong>to</strong><br />
create three cases in EBAMM: <strong>Ethanol</strong> Today,<br />
which includes typical values for the current<br />
U.S. corn ethanol industry <strong>and</strong> requires the<br />
fewest assumptions; CO 2<br />
Intensive, which has<br />
its basis in current plans <strong>to</strong> ship Nebraska corn<br />
<strong>to</strong> a lignite-powered ethanol plant in North<br />
Dakota (22); <strong>and</strong> Cellulosic, which assumes that<br />
production of cellulosic ethanol from switchgrass<br />
becomes economic as represented in one<br />
of the studies (16).<br />
<strong>The</strong> Cellulosic case presented here is a preliminary<br />
estimate of a rapidly evolving technology<br />
<strong>and</strong> is designed <strong>to</strong> highlight the dramatic<br />
reductions in GHG emissions that could be<br />
achieved. In addition, other biofuel technologies<br />
<strong>and</strong> production processes are in active development<br />
<strong>and</strong>, as the data become available, should<br />
be the subject of similar energy <strong>and</strong> environmental<br />
impact assessments.<br />
For all three cases, producing one MJ of<br />
ethanol requires far less petroleum than is required<br />
<strong>to</strong> produce one MJ of gasoline (Fig. 2).<br />
However, the GHG metric illustrates that the<br />
environmental performance of ethanol varies<br />
greatly depending on production processes. On<br />
the other h<strong>and</strong>, single-fac<strong>to</strong>r metrics may be<br />
poor guides for policy. With the use of the<br />
petroleum intensity metric, the <strong>Ethanol</strong> Today<br />
case would be slightly preferred over the Cellulosic<br />
case (a petroleum input ratio of 0.06<br />
compared with 0.08); however, on the GHG<br />
metric, the <strong>Ethanol</strong> Today case is far worse<br />
than Cellulosic (83 compared <strong>to</strong> 11). Additional<br />
environmental metrics are now being developed<br />
for biofuels, <strong>and</strong> a few have been applied<br />
<strong>to</strong> ethanol production, but several key issues<br />
REPORTS<br />
remain unquantified, such as soil erosion <strong>and</strong><br />
the conversion of forest <strong>to</strong> agriculture (18, 20).<br />
Looking <strong>to</strong> the future, the environmental<br />
implications of ethanol production are likely <strong>to</strong><br />
grow more important, <strong>and</strong> there is a need for a<br />
more complete set of policy-relevant metrics.<br />
In addition, future analysis of fuel ethanol<br />
should more carefully evaluate ethanol production<br />
from cellulosic feeds<strong>to</strong>cks, not least<br />
because cellulosic ethanol production is undergoing<br />
major technological development <strong>and</strong><br />
because the cultivation of cellulosic feeds<strong>to</strong>cks<br />
is not as far advanced as corn agriculture,<br />
suggesting more potential for improvement.<br />
Such advances may enable biomass energy <strong>to</strong><br />
contribute a sizeable fraction of the nation_s<br />
transportation energy, as some studies have<br />
suggested (23, 24).<br />
Our study yields both research <strong>and</strong> policy<br />
recommendations. Evaluations of biofuel policy<br />
should use realistic assumptions (e.g., the<br />
inclusion of coproduct credits calculated by a<br />
Fig. 1. (A) Net energy <strong>and</strong> net greenhouse gases for gasoline, six studies, <strong>and</strong><br />
three cases. (B) Net energy <strong>and</strong> petroleum inputs for the same. In these figures,<br />
small light blue circles are reported data that include incommensurate<br />
assumptions, whereas the large dark blue circles are adjusted values that use<br />
identical system boundaries. Conventional gasoline is shown with red stars, <strong>and</strong><br />
EBAMM scenarios are shown with green squares. Adjusting system boundaries<br />
reduces the scatter in the reported results. Moreover, despite large differences in<br />
net energy, all studies show similar results in terms of more policy-relevant<br />
metrics: GHG emissions from ethanol made from conventionally grown corn can<br />
be slightly more or slightly less than from gasoline per unit of energy, but<br />
ethanol requires much less petroleum inputs. <strong>Ethanol</strong> produced from cellulosic<br />
material (switchgrass) reduces both GHGs <strong>and</strong> petroleum inputs substantially.<br />
Fig. 2. Alternative metrics for<br />
evaluating ethanol based on<br />
the intensity of primary energy<br />
inputs (MJ) per MJ of fuel<br />
<strong>and</strong> of net greenhouse gas<br />
emissions (kg CO 2<br />
-equivalent)<br />
per MJ of fuel. For gasoline,<br />
both petroleum feeds<strong>to</strong>ck <strong>and</strong><br />
petroleum energy inputs are<br />
included. ‘‘Other’’ includes nuclear<br />
<strong>and</strong> hydrological electricity<br />
generation. Relative <strong>to</strong><br />
gasoline, ethanol produced <strong>to</strong>day<br />
is much less petroleumintensive<br />
but much more natural<br />
gas– <strong>and</strong> coal-intensive. Production<br />
of ethanol from lignitefired<br />
biorefineries located far<br />
from where the corn is grown<br />
results in ethanol with a high coal intensity <strong>and</strong> a moderate petroleum intensity. Cellulosic ethanol is expected <strong>to</strong> have an extremely low intensity for<br />
all fossil fuels <strong>and</strong> a very slightly negative coal intensity due <strong>to</strong> electricity sales that would displace coal.<br />
www.sciencemag.org SCIENCE VOL 311 27 JANUARY 2006 507
REPORTS<br />
displacement method), accurate data, clearly defined<br />
future scenarios, <strong>and</strong> performance metrics<br />
relevant <strong>to</strong> policy goals like reducing greenhouse<br />
gas emissions, petroleum inputs, <strong>and</strong> soil erosion.<br />
Progress <strong>to</strong>ward attaining these goals will<br />
require new technologies <strong>and</strong> practices, such as<br />
sustainable agriculture <strong>and</strong> cellulosic ethanol<br />
production. Such an approach could lead <strong>to</strong> a<br />
biofuels industry much larger than <strong>to</strong>day_s that,<br />
in conjunction with greater vehicle efficiency,<br />
could play a key role in meeting the nation_s<br />
energy <strong>and</strong> environmental goals.<br />
References <strong>and</strong> Notes<br />
1. T. E. Wirth, C. B. Gray, J. D. Podesta, Foreign Aff. 82, 132<br />
(2003).<br />
2. R. A. Kerr, R. F. Service, Science 309, 101 (2005).<br />
3. S. C. Davis, S. W. Diegel, Transportation <strong>Energy</strong> Data<br />
Book (Technical Report No. ORNL-6973, Oak Ridge<br />
National Labora<strong>to</strong>ry, Oak Ridge, TN, 2004).<br />
4. If only cellulosic ethanol production capacity is added,<br />
only 4.8 billion gallons will be required because of<br />
preferential credit provisions.<br />
5. ‘‘Implications of Increased <strong>Ethanol</strong> Production for U.S.<br />
Agriculture’’ (Report No. 10-05, Food <strong>and</strong> Agricultural<br />
Policy Research Institute, Univ. of Missouri, Columbia, MO,<br />
2005). Also available at www.fapri.missouri.edu/outreach/<br />
publications/2005/FAPRI_UMC_Report_10_05.pdf.<br />
6. By convention, pho<strong>to</strong>synthetic energy is ignored in this<br />
calculation.<br />
7. H. Shapouri, J. A. Duffield, M. Wang, Trans. ASAE 46, 959<br />
(2003).<br />
8. R. S. Chambers, R. A. Herendeen, J. J. Joyce, P. S. Penner,<br />
Science 206, 789 (1979).<br />
9. C. J. Clevel<strong>and</strong>, <strong>Energy</strong> 30, 769 (2005).<br />
10. Materials <strong>and</strong> methods are available as supporting<br />
material on Science Online. Additional information is<br />
available, including the working EBAMM model, at http://<br />
socrates.berkeley.edu/Èrael/EBAMM.<br />
11. T. Patzek, Crit. Rev. Plant Sci. 23, 519 (2004).<br />
12. D. Pimentel, T. Patzek, Nat. Resour. Res. 14, 65 (2005).<br />
13. M. E. D. De Oliveira, B. E. Vaughan, E. J. Rykiel,<br />
Bioscience 55, 593 (2005).<br />
14. H. Shapouri, A. McAloon, ‘‘<strong>The</strong> 2001 net energy balance<br />
of corn ethanol’’ (U.S. Department of Agriculture,<br />
Washing<strong>to</strong>n, DC, 2004). Also available at www.usda.<br />
gov/oce/oepnu.<br />
15. M. Graboski, ‘‘Fossil energy use in the manufacture of<br />
corn ethanol’’ (National Corn Growers Association,<br />
Washing<strong>to</strong>n, DC, 2002). Also available at www.ncga.<br />
com/ethanol/main.<br />
16. M. Wang, ‘‘Development <strong>and</strong> use of GREET 1.6 fuel-cycle<br />
model for transportation fuels <strong>and</strong> vehicle technologies’’<br />
(Tech. Rep. ANL/ESD/TM-163, Argonne National<br />
Labora<strong>to</strong>ry, Argonne, IL, 2001). Also available at<br />
www.transportation.anl.gov/pdfs/TA/153.pdf.<br />
17. S. Kim, B. E. Dale, Int. J. Life Cycle Assess. 7, 237 (2002).<br />
18. M. A. Delucchi, ‘‘Conceptual <strong>and</strong> methodological issues in<br />
lifecycle analyses of transportation fuels’’ (Tech. Rep.<br />
UCD-ITS-RR-04-45, Univ. of California, Davis, 2004).<br />
Also available at www.its.ucdavis.edu/publications/<br />
2004/UCD-ITS-RR-04-45.pdf.<br />
19. Fac<strong>to</strong>rs eliminated were labor transportation, labor food<br />
energy, <strong>and</strong> process water energy. <strong>The</strong> first two were<br />
deemed outside the system boundaries. Process water<br />
energy was included in one study but was insufficiently<br />
documented. Fac<strong>to</strong>rs added were farm machinery energy,<br />
inputs packaging, <strong>and</strong> effluent processing energy. <strong>The</strong><br />
metric for petroleum use included crude oil used as a<br />
feeds<strong>to</strong>ck for gasoline, <strong>and</strong> the metric for GHGs<br />
included end-use (tailpipe) fossil emissions (10).<br />
20. S. Kim, B. E. Dale, Biomass Bioenergy 29, 426 (2005).<br />
21. E. Tegtmeier, M. Duffy, Int. J. Agric. Sustainability 2, 1<br />
(2004).<br />
22. More information is available at www.redtrailenergyllc.com.<br />
23. R. D. Perlack, L. L. Wright, A. Turhollow, R. Graham,<br />
B. S<strong>to</strong>kes, D. Erbach, ‘‘Biomass as feeds<strong>to</strong>ck for a<br />
bioenergy <strong>and</strong> bioproducts industry: <strong>The</strong> technical<br />
feasibility of a billion-<strong>to</strong>n annual supply’’ (Tech. Rep.<br />
ORNL/TM-2006/66, Oak Ridge National Labora<strong>to</strong>ry,<br />
Oak Ridge, TN, 2005). Also available at http://<br />
feeds<strong>to</strong>ckreview.ornl.gov/pdf/billion_<strong>to</strong>n_vision.pdf.<br />
24. L. B. Lave, W. Griffin, H. McLean, Issues Sci. Technol. 18,<br />
73 (2001).<br />
25. This research was made possible through support from<br />
the <strong>Energy</strong> Foundation <strong>and</strong> the Karsten Family<br />
Foundation (both <strong>to</strong> D.M.K.) <strong>and</strong> NSF’s Climate Decision<br />
Making Center at Carnegie Mellon University (SES-034578)<br />
(<strong>to</strong> A.E.F.) <strong>and</strong> Graduate Research Fellowship program<br />
(<strong>to</strong> A.D.J.). <strong>The</strong> authors thank J. Thompson, D. Greene,<br />
M. DeLucchi, M. Wang, <strong>and</strong> an anonymous reviewer for<br />
assistance <strong>and</strong> valuable comments.<br />
Supporting Online Material<br />
www.sciencemag.org/cgi/content/full/311/5760/506/DC1<br />
Materials <strong>and</strong> Methods<br />
SOM Text<br />
Figs. S1 <strong>and</strong> S2<br />
Tables S1 <strong>to</strong> S3<br />
References<br />
17 Oc<strong>to</strong>ber 2005; accepted 9 January 2006<br />
10.1126/science.1121416<br />
Optical Detection of DNA<br />
Conformational Polymorphism on<br />
Single-Walled Carbon Nanotubes<br />
Daniel A. Heller, 1 Esther S. Jeng, 2 Tsun-Kwan Yeung, 2 Brittany M. Martinez, 2<br />
Anthonie E. Moll, 2 Joseph B. Gastala, 2 Michael S. Strano 2 *<br />
<strong>The</strong> transition of DNA secondary structure from an analogous B <strong>to</strong> Z conformation modulates the<br />
dielectric environment of the single-walled carbon nanotube (SWNT) around which it is adsorbed.<br />
<strong>The</strong> SWNT b<strong>and</strong>-gap fluorescence undergoes a red shift when an encapsulating 30-nucleotide<br />
oligomer is exposed <strong>to</strong> counter ions that screen the charged backbone. <strong>The</strong> transition is<br />
thermodynamically identical for DNA on <strong>and</strong> off the nanotube, except that the propagation length<br />
of the former is shorter by five-sixths. <strong>The</strong> magnitude of the energy shift is described by using an<br />
effective medium model <strong>and</strong> the DNA geometry on the nanotube sidewall. We demonstrate the<br />
detection of the B-Z change in whole blood, tissue, <strong>and</strong> from within living mammalian cells.<br />
Single-walled carbon nanotubes (1) are<br />
rolled sheets of graphene with nanometersized<br />
diameters that possess remarkable<br />
pho<strong>to</strong>stablity (2). <strong>The</strong> semiconducting forms of<br />
SWNTs, when dispersed by surfactants in aqueous<br />
solution, can display distinctive near-infrared<br />
(IR) pho<strong>to</strong>luminescence (3) arising from their<br />
electronic b<strong>and</strong> gap. <strong>The</strong> b<strong>and</strong>-gap energy is<br />
sensitive <strong>to</strong> the local dielectric environment<br />
1 Department of Chemistry, 2 Department of Chemical <strong>and</strong><br />
Biomolecular Engineering, University of Illinois at Urbana-<br />
Champaign, Urbana, IL 61801, USA.<br />
*To whom correspondence should be addressed. E-mail:<br />
strano@uiuc.edu<br />
around the SWNT, <strong>and</strong> this property can be exploited<br />
in chemical sensing, which was recently<br />
demonstrated for the detection of b-D-glucose (4).<br />
Among the molecules that can bind <strong>to</strong> the<br />
surfaceofSWNTsisDNA,whichadsorbsasa<br />
double-str<strong>and</strong>ed (ds) complex (5). Certain DNA<br />
oligonucleotides will transition from the native,<br />
right-h<strong>and</strong>ed B form <strong>to</strong> the left-h<strong>and</strong>ed Z form<br />
as cations adsorb on<strong>to</strong> <strong>and</strong> screen the negatively<br />
charged backbone (6–9). We now show<br />
that an analogous B-<strong>to</strong>-Z transition for a 30-<br />
nucleotide dsDNA modulates the dielectric<br />
environment of SWNTs <strong>and</strong> decreases their<br />
near-IR emission energy up <strong>to</strong> 15 meV. We<br />
have used this fluorescence signal <strong>to</strong> detect<br />
divalent metal cations that bind <strong>to</strong> DNA <strong>and</strong><br />
stabilize the Z form. <strong>The</strong> thermodynamics of the<br />
conformational change for DNA both on <strong>and</strong> off<br />
the SWNT are nearly identical. <strong>The</strong>se near-IR<br />
ion sensors can operate in strongly scattering or<br />
absorbing media, which we demonstrate by detecting<br />
mercuric ions in whole blood, black ink,<br />
<strong>and</strong> living mammalian cells <strong>and</strong> tissues.<br />
Near-IR spectrofluorometry was performed<br />
on colloidally stable complexes of DNAencapsulated<br />
SWNTs (DNA-SWNTs) buffered<br />
at a pH of 7.4 <strong>and</strong> synthesized by the noncovalent<br />
binding <strong>to</strong> the nanotube sidewall (10)<br />
of a 30–base pair single-str<strong>and</strong>ed DNA (ssDNA)<br />
oligonucleotide with a repeating G-T sequence.<br />
This ssDNA can hydrogen bond with itself <strong>to</strong><br />
form dsDNA. Several types of semiconducting<br />
SWNTs are present, but as we show below,<br />
they can be identified by their characteristic<br />
b<strong>and</strong> gaps. <strong>The</strong> shift in b<strong>and</strong> gap is similar for<br />
each type of SWNT, although there is a diameter<br />
dependence. After the addition of divalent<br />
cations, we observed an energy shift in the<br />
SWNT emission with a relative ion sensitivity<br />
of Hg 2þ 9 Co 2þ 9 Ca 2þ 9 Mg 2þ ,whichis<br />
identical for free DNA (Fig. 1A) (11). <strong>The</strong> shift<br />
can also be observed by moni<strong>to</strong>ring SWNT<br />
pho<strong>to</strong>absorption b<strong>and</strong>s (fig. S1). <strong>The</strong> fluorescence<br />
peak energy traces a mono<strong>to</strong>nic, twostate<br />
equilibrium profile with increasing ionic<br />
strength for each case (12).<br />
<strong>The</strong> removal of ions from the system via<br />
dialysis returns the emission energy <strong>to</strong> its initial<br />
value, which is indicative of a completely reversible<br />
thermodynamic transition (Fig. 1B <strong>and</strong><br />
508<br />
27 JANUARY 2006 VOL 311 SCIENCE www.sciencemag.org