Track Record - Public Transport Victoria
Track Record - Public Transport Victoria
Track Record - Public Transport Victoria

You also want an ePaper? Increase the reach of your titles
YUMPU automatically turns print PDFs into web optimized ePapers that Google loves.
<strong>Track</strong> <strong>Record</strong><br />
<strong>Victoria</strong>’s Train, Tram and Bus Services<br />
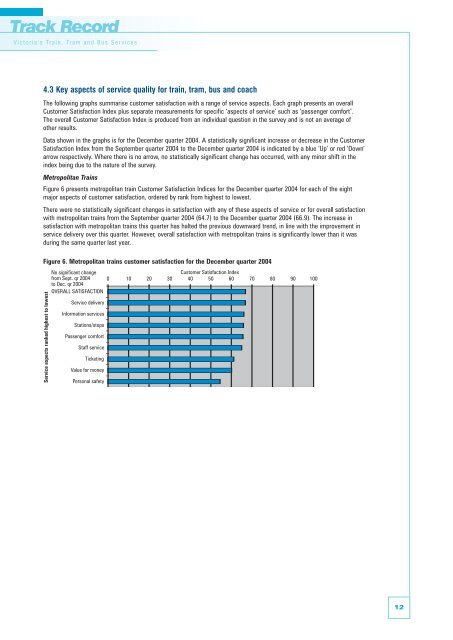
4.3 Key aspects of service quality for train, tram, bus and coach<br />
The following graphs summarise customer satisfaction with a range of service aspects. Each graph presents an overall<br />
Customer Satisfaction Index plus separate measurements for specific ‘aspects of service’ such as ‘passenger comfort’.<br />
The overall Customer Satisfaction Index is produced from an individual question in the survey and is not an average of<br />
other results.<br />
Data shown in the graphs is for the December quarter 2004. A statistically significant increase or decrease in the Customer<br />
Satisfaction Index from the September quarter 2004 to the December quarter 2004 is indicated by a blue ‘Up’ or red ‘Down’<br />
arrow respectively. Where there is no arrow, no statistically significant change has occurred, with any minor shift in the<br />
index being due to the nature of the survey.<br />
Metropolitan Trains<br />
Figure 6 presents metropolitan train Customer Satisfaction Indices for the December quarter 2004 for each of the eight<br />
major aspects of customer satisfaction, ordered by rank from highest to lowest.<br />
There were no statistically significant changes in satisfaction with any of these aspects of service or for overall satisfaction<br />
with metropolitan trains from the September quarter 2004 (64.7) to the December quarter 2004 (66.9). The increase in<br />
satisfaction with metropolitan trains this quarter has halted the previous downward trend, in line with the improvement in<br />
service delivery over this quarter. However, overall satisfaction with metropolitan trains is significantly lower than it was<br />
during the same quarter last year.<br />
Figure 6. Metropolitan trains customer satisfaction for the December quarter 2004<br />
Service aspects ranked highest to lowest<br />
No significant change<br />
from Sept. qr 2004<br />
to Dec. qr 2004<br />
OVERALL SATISFACTION<br />
Service delivery<br />
Information services<br />
Stations/stops<br />
Passenger comfort<br />
Staff service<br />
Ticketing<br />
Value for money<br />
Personal safety<br />
Customer Satisfaction Index<br />
0 10 20 30 40 50 60 70 80 90 100<br />
12