Create successful ePaper yourself
Turn your PDF publications into a flip-book with our unique Google optimized e-Paper software.
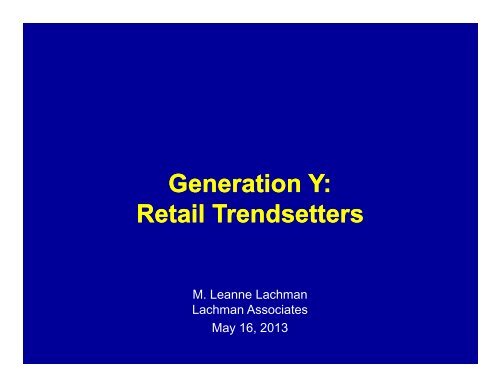
Generation Y:<br />
Retail Trendsetters<br />
M. <strong>Leanne</strong> <strong>Lachman</strong><br />
<strong>Lachman</strong> Associates<br />
May 16, 2013
Great Retail News<br />
37% of Gen Y loves to shop<br />
48% enjoys shopping<br />
12% say it’s a chore they can handle<br />
4% hates shopping<br />
Totals may not add to 100% because of rounding<br />
Source: <strong>ULI</strong>/<strong>Lachman</strong> Associates Survey, January 2013
Challenging Corollaries<br />
• 18- to 35-year-olds are easily bored<br />
• Sensory experiences need to evolve frequently<br />
• 45% spend >1 hour/day on retail web sites<br />
• Comfortable with multi-channel shopping
Who is Gen Y?<br />
Silent Generation<br />
Depression & War Babies<br />
Baby Boom<br />
Gen X<br />
Gen Y<br />
Gen Next<br />
Source: U.S. Census Bureau, 2010
<strong>ULI</strong>’s Gen Y Retail Survey<br />
• Nationally representative sample:<br />
– By age – 18- to 35-year-olds<br />
– By race/ethnicity<br />
– By four U.S. regions<br />
• Confidence level of + 3%<br />
n=1251 responses<br />
Conducted by Harris Interactive Service Bureau/<strong>Lachman</strong> Associates
Gen Y Profile<br />
Age<br />
Marital Status<br />
18-25 45% Single 64%<br />
26-30 27% Divorced/Widowed 2%<br />
31-35 28% Married/Partnered 34%<br />
Race Living w/Children
Gen Y’s Pets<br />
Pet Owners 71.5%<br />
Dog(s) 53%<br />
Cat(s) 35%<br />
No Pets 28.5%<br />
n=1251<br />
Source: <strong>ULI</strong>/<strong>Lachman</strong> Associates Survey, January 2013
Gen-Yers’ Household Income<br />
12%<br />
22%<br />
12%<br />
23%<br />
14%<br />
Under $25,000<br />
$25,000‐$34,999<br />
$35,000‐$49,999<br />
$50,000‐$74,999<br />
$75,000‐$99,999<br />
$100,000+<br />
17%<br />
n=1166<br />
Source: <strong>ULI</strong>/<strong>Lachman</strong> Associates Survey, January 2013
Current Gen Y Housing<br />
5%<br />
Owners<br />
37%<br />
32%<br />
Live with<br />
Parents/Relatives<br />
Student Housing<br />
Renters<br />
2%<br />
24%<br />
Other<br />
Source: <strong>ULI</strong>/<strong>Lachman</strong> Associates Survey, January 2013, n= 1251
Gen Y Employment<br />
Source: <strong>ULI</strong>/<strong>Lachman</strong> Associates Survey, January 2013
Gen Y’s Self Characterization<br />
I consider myself:<br />
0% 10% 20% 30% 40% 50%<br />
City Person<br />
Suburbanite<br />
Small Town/Rural Person<br />
n=1251<br />
Source: <strong>ULI</strong>/<strong>Lachman</strong> Associates Survey, January 2013.
Gen Y “Downtowners”<br />
• Only 14% of sample:<br />
– 24% of Northeasterners vs. 16% for rest<br />
– 28% of Southerners vs. 39% for rest<br />
• 64% male vs. 47% for rest<br />
• 51% age 18-25 vs. 44% for rest<br />
• 34% Hispanic vs. 18% for rest<br />
• 23% Black vs. 15% for rest<br />
Gen Y’s fashionistas
“How can we know who we are when<br />
the best marketing consultants<br />
of our time don’t know.”
Shopping Center Patronage<br />
At Least<br />
Weekly<br />
Few Times/<br />
Monthly<br />
Rarely/<br />
Never<br />
Neighborhood/Community SCs<br />
Enclosed Malls<br />
21% 53% 26%<br />
14% 50% 36%<br />
Power Centers 12% 51% 38%<br />
Neighborhood Bus. District 13% 41% 46%<br />
Central Business District 12% 36% 53%<br />
Totals may not add to 100% because of rounding<br />
Source: <strong>ULI</strong>/<strong>Lachman</strong> Associates Survey, January 2013
Store Patronage<br />
At Least<br />
Weekly<br />
Few Times/<br />
Monthly<br />
Rarely/<br />
Never<br />
Discount Dept.<br />
Store/Warehouse Club 31% 60% 10%<br />
Full-Line Dept. Store<br />
Apparel-Oriented Dept.<br />
Store<br />
12% 52% 35%<br />
5% 32% 62%<br />
Chain Apparel Store 9% 49% 43%<br />
Totals may not add to 100% because of rounding<br />
Source: <strong>ULI</strong>/<strong>Lachman</strong> Associates Survey, January 2013
Typical Way to Shop for Clothes<br />
With Family Members 37%<br />
With Friends 28%<br />
Alone 35%<br />
Source: <strong>ULI</strong>/<strong>Lachman</strong> Associates Survey, January 2013
Non-Perishable Grocery Shopping<br />
Discount Dept. Store w/Food Section 63%<br />
Supermarket 56%<br />
Warehouse Club 23%<br />
Discount Supermarket 20%<br />
Small Grocer 17%<br />
Drug Store 5%<br />
Online 1%<br />
Respondents could identify up to 3 venues<br />
Source: <strong>ULI</strong>/<strong>Lachman</strong> Associates Survey, January 2013
“Next time we’re shopping at Wal-Mart.”
Fresh Grocery Shopping<br />
Supermarket 61%<br />
Discount Dept. Store w/Food Section 49%<br />
Specialty Grocer 18%<br />
Small Grocer 17%<br />
Warehouse Club 16%<br />
Green Grocer/Farmer’s Market 16%<br />
Respondents could identify up to 3 venues<br />
Source: <strong>ULI</strong>/<strong>Lachman</strong> Associates Survey, January 2013
Daily Time on Retail-Oriented Web Sites<br />
Men Women Total<br />
3 Hours 8% 4% 6%<br />
100% 100% 100%<br />
Source: <strong>ULI</strong>/<strong>Lachman</strong> Associates Survey, January 2013
Gen Y’s Online Shopping<br />
Electronics/Computer Equipment 44%<br />
Women 34%<br />
Men 54%<br />
Gifts 43%<br />
Personal Clothing 41%<br />
Women 47%<br />
Men 36%<br />
Books 39%<br />
CDs/DVDs 33%<br />
Items purchased online in prior six months; multiple responses permitted<br />
Source: <strong>ULI</strong>/<strong>Lachman</strong> Associates Survey, January 2013
Logistics/Warehouse Demand<br />
• Fed Ex, UPS, USPS = big winners<br />
• On-going need for cross-docked warehouses<br />
• New demand for pick-and-pack facilities<br />
• Retailers/malls encourage pick up/returns<br />
• Promised delivery times are shrinking
Frequency of Dining Out<br />
At Least<br />
Weekly<br />
Few Times<br />
a Month<br />
Rarely/<br />
Never<br />
Breakfast 22% 16% 62%<br />
Lunch 36% 35% 29%<br />
Dinner 38% 42% 20%<br />
Weekend Brunch 16% 17% 67%<br />
Source: <strong>ULI</strong>/<strong>Lachman</strong> Associates Survey, January 2013
Favorite Gathering Places with Friends<br />
Home: Mine or Theirs 66%<br />
Restaurant 59%<br />
Bar 30%<br />
Shopping Center 28%<br />
Coffee Shop 22%<br />
Park/Beach 20%<br />
Respondents could identify up to 3 venues<br />
Source: <strong>ULI</strong>/<strong>Lachman</strong> Associates Survey, January 2013
Real Estate Implications<br />
• Huge logistics/warehouse demand<br />
• Discount department stores/warehouse clubs<br />
popular<br />
• Strong enclosed mall appeal<br />
– Encourage social gathering<br />
– Keep shopping experience fresh<br />
• Restaurants are hot – but Gen Y is fickle<br />
• Online sales eroding brick-and-mortar need<br />
• Underserved communities deserve attention<br />
• Density and walkability attract Gen Y
“And I think I speak for an entire generation<br />
when I remind my opponent that that was<br />
then and this is now.”
Generation Y:<br />
Retail Trendsetters<br />
M. <strong>Leanne</strong> <strong>Lachman</strong><br />
<strong>Lachman</strong> Associates<br />
May 16, 2013


