Karnataka - Ministry of Environment and Forests
Karnataka - Ministry of Environment and Forests
Karnataka - Ministry of Environment and Forests

Create successful ePaper yourself
Turn your PDF publications into a flip-book with our unique Google optimized e-Paper software.
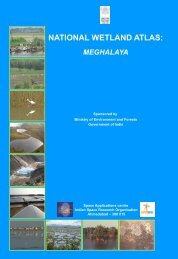
This publication deals with the updated database <strong>and</strong><br />
status <strong>of</strong> wetl<strong>and</strong>s, compiled in Atlas format. Increasing<br />
concern about how our wetl<strong>and</strong>s are being influenced has<br />
led to formulation <strong>of</strong> a project entitled “National Wetl<strong>and</strong><br />
Inventory <strong>and</strong> Assessment (NWIA)” to create an updated<br />
database <strong>of</strong> the wetl<strong>and</strong>s <strong>of</strong> India. The wetl<strong>and</strong>s are<br />
categorised under 19 classes <strong>and</strong> mapped using satellite<br />
remote sensing data from Indian Remote Sensing<br />
Satellite: IRS P6- LISS III sensor. The results are<br />
organised at 1: 50, 000 scales at district, state <strong>and</strong><br />
topographic map sheet (Survey <strong>of</strong> India reference) level<br />
using Geographic Information System (GIS). This<br />
publication is a part <strong>of</strong> this national work <strong>and</strong> deals with<br />
the wetl<strong>and</strong> status <strong>of</strong> a particular State/Union Territory <strong>of</strong><br />
India, through text, statistical tables, satellite images,<br />
maps <strong>and</strong> ground photographs.<br />
The atlas comprises wetl<strong>and</strong> information arranged into<br />
nine sections. How the NWIA project work has been<br />
executed highlighted in the first six sections viz:<br />
Introduction, NWIA project, Study area, Data used,<br />
Methodology, <strong>and</strong> Accuracy. This is the first time that high<br />
resolution digital remote sensing data has been used to<br />
map <strong>and</strong> decipher the status <strong>of</strong> the wetl<strong>and</strong>s at national<br />
scale. The methodology highlights how the four spectral<br />
b<strong>and</strong>s <strong>of</strong> LISS III data (green, red, near infra red <strong>and</strong> short<br />
wave infra red) have been used to derive various indices<br />
<strong>and</strong> decipher information regarding water spread,<br />
turbidity <strong>and</strong> aquatic vegetation. Since, the aim was to<br />
generate a GIS compatible database, details <strong>of</strong> the<br />
st<strong>and</strong>ards <strong>of</strong> database are also highlighted in the<br />
methodology.<br />
The results <strong>and</strong> finding are organised in three sections;<br />
viz: Maps <strong>and</strong> Statistics, Major wetl<strong>and</strong> types, <strong>and</strong><br />
Important Wetl<strong>and</strong>s <strong>of</strong> the area. The Maps <strong>and</strong> Statistics<br />
are shown for state <strong>and</strong> district level. It gives details <strong>of</strong><br />
what type <strong>of</strong> wetl<strong>and</strong>s exists in the area, how many<br />
numbers in each type, their area estimates in hectare.<br />
Since, the hydrology <strong>of</strong> wetl<strong>and</strong>s are influenced by<br />
monsoon performance, extent <strong>of</strong> water spread <strong>and</strong> their<br />
turbidity (qualitative) in wet <strong>and</strong> dry season (postmonsoon<br />
<strong>and</strong> pre-monsoon period) are also given.<br />
Similarly the status <strong>of</strong> aquatic vegetation (mainly floating<br />
<strong>and</strong> emergent types) in two seasons is also accounted for.<br />
Status <strong>of</strong> small wetl<strong>and</strong>s are also accounted as numbers<br />
<strong>and</strong> depicted in maps as points. Wetl<strong>and</strong> map also show<br />
important ancillary information like roads/rail, relevant<br />
habitations. False Colour Composite (FCC) <strong>of</strong> the satellite<br />
image used (any one season) is shown along with the<br />
derived wetl<strong>and</strong> map to give a feeling <strong>of</strong> manifestation <strong>of</strong><br />
wetl<strong>and</strong>s in remote sensing data <strong>and</strong> synoptic view <strong>of</strong> the<br />
area. The status <strong>of</strong> some <strong>of</strong> the important wetl<strong>and</strong>s like<br />
Ramsar sites, National Parks are shown with recent field<br />
photographs.<br />
For further details contact:<br />
Director,<br />
Space Applications Centre, ISRO,<br />
Ambawadi Vistar (P.O.)<br />
Ahmedabad – 380 015<br />
director@sac.isro.gov.in