Annual Report 2007 - Severstal
Annual Report 2007 - Severstal
Annual Report 2007 - Severstal

You also want an ePaper? Increase the reach of your titles
YUMPU automatically turns print PDFs into web optimized ePapers that Google loves.
<strong>Annual</strong> <strong>Report</strong> <strong>2007</strong>
Overview 1<br />
Mi<br />
Business review 6<br />
Ts St<br />
Mi<br />
St M<br />
St<br />
M<br />
M<br />
St<br />
M<br />
St<br />
Corporate social responsibility 61<br />
Board of Directors 64<br />
Overview<br />
1 Introduction<br />
2 Performance in brief<br />
4 <strong>Severstal</strong> in brief<br />
Business review<br />
6 Chairman’s statement<br />
8 Chief Executive’s statement<br />
11 Principal events of <strong>2007</strong><br />
12 The world of <strong>Severstal</strong><br />
26 Steel and mining industry overview<br />
30 Risk management<br />
32 <strong>Severstal</strong> performance review<br />
35 – Mining<br />
41 – Russian Steel<br />
46 – <strong>Severstal</strong> North America<br />
50 – Lucchini<br />
53 – Metalware<br />
55 – Izhora Pipe Mill<br />
57 <strong>Severstal</strong> on the capital markets<br />
61 Corporate social responsibility<br />
Governance<br />
64 Board of Directors<br />
66 Board of Directors’ report<br />
Financial statements<br />
69 Consolidated financial statements<br />
117 Shareholder information<br />
and financial calendar
We are a leading international steel<br />
producer with vertically integrat ed<br />
and geographically diversified<br />
metallurgical and mining assets.<br />
We aim to be one of the largest and<br />
most profitable business of our kind<br />
in the world.<br />
This year we achieved more by<br />
building on the solid foundations<br />
we prepared during <strong>2007</strong>.<br />
<strong>Severstal</strong> <strong>Annual</strong> <strong>Report</strong> <strong>2007</strong> 1
Overview<br />
Performance in brief<br />
<strong>2007</strong> was a year of strong financial<br />
performance with EBITDA up 24.5%.<br />
Revenues<br />
US$15.25 billion (+22.5%*)<br />
EBITDA<br />
US$3.68 billion (+24.5%*)<br />
20<br />
4<br />
3.68<br />
15<br />
10<br />
10.45<br />
12.45<br />
15.25<br />
3<br />
2<br />
2.84<br />
2.96<br />
5<br />
1<br />
0<br />
2005<br />
2006<br />
<strong>2007</strong><br />
0<br />
2005<br />
2006<br />
<strong>2007</strong><br />
Net Profit attributable to shareholders<br />
US$1.94 billion (+33.8%*)<br />
Earnings per share (EPS)<br />
US$1.92 (+22.3%*)<br />
2.0<br />
1.5<br />
1.56<br />
1.45<br />
1.94<br />
2.0<br />
1.5<br />
1.71<br />
1.57<br />
1.92<br />
1.0<br />
1.0<br />
0.5<br />
0.5<br />
0<br />
2005<br />
2006<br />
<strong>2007</strong><br />
0<br />
2005<br />
2006<br />
<strong>2007</strong><br />
Capital expenditure<br />
US$1.63 billion (+30.4%*)<br />
2.0<br />
1.5<br />
1.25<br />
1.25<br />
1.63<br />
1.0<br />
0.5<br />
0<br />
2005<br />
2006<br />
<strong>2007</strong><br />
*compared to 2006 and rounded-off value.<br />
2 <strong>Severstal</strong> <strong>Annual</strong> <strong>Report</strong> <strong>2007</strong>
Sales by delivery destination <strong>2007</strong><br />
Russian Federation 6,744,113<br />
Europe 5,308,680<br />
North America 1,889,280<br />
The Middle East 450,360<br />
China and Central Asia 353,550<br />
South East Asia 291,052<br />
Central & South America 151,281<br />
Africa 56,595<br />
15,244,911<br />
Steel production volumes (tonnes)<br />
17.46m<br />
(17.44 million tonnes in 2006)<br />
World ranking<br />
15th<br />
in crude steel production,<br />
according to the International<br />
Steel Statistics Bureau<br />
Non-executive Directors<br />
5 out of10<br />
Independent Non-executive<br />
Directors of the company’s<br />
10 member Board of Directors<br />
<strong>Severstal</strong>’s market capitalisation<br />
US$23.38bn<br />
at the start of 2008 more than<br />
doubled in <strong>2007</strong><br />
Share price<br />
US$23.20<br />
increased from US$11.15 as at<br />
29 December 2006 to US$23.20<br />
as at 31 December <strong>2007</strong><br />
<strong>Severstal</strong> <strong>Annual</strong> <strong>Report</strong> <strong>2007</strong> 3
Overview<br />
<strong>Severstal</strong> in brief<br />
We are already a bigger company than many people know.<br />
We have 100,000+ employees, produced over 17.5 million<br />
tonnes of steel last year and increased revenues by 22.5%<br />
to US$15,245m.<br />
Mi<br />
Mi<br />
Mi<br />
Ts St<br />
Mi<br />
St M<br />
St<br />
Mi<br />
M<br />
M<br />
Mi<br />
St<br />
M<br />
M<br />
Mi<br />
St<br />
St<br />
St<br />
St<br />
St<br />
St<br />
M<br />
Mi<br />
Ts<br />
Steel and rolled products<br />
Metalware<br />
Mining<br />
Trade and services<br />
4 <strong>Severstal</strong> <strong>Annual</strong> <strong>Report</strong> <strong>2007</strong>
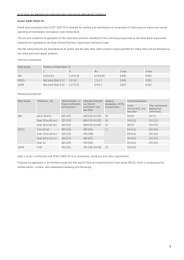
Corporate structure<br />
In April 2008, <strong>Severstal</strong> reorganised its business segments into<br />
three principal divisions: <strong>Severstal</strong> Russian Steel, <strong>Severstal</strong><br />
Resources and <strong>Severstal</strong> International.<br />
In this report we will be using the <strong>2007</strong> segmental structure<br />
shown below.<br />
<strong>Severstal</strong> Russian Steel <strong>Severstal</strong> Resources <strong>Severstal</strong> International<br />
<strong>2007</strong> Segments<br />
Russian Steel<br />
Russian Steel is <strong>Severstal</strong>’s largest segment<br />
by revenue. In <strong>2007</strong>, it was the third largest<br />
company in Russia by volume of crude steel<br />
production (16.4%) and third in terms of<br />
rolled products (17.9%).<br />
Assets<br />
– Cherepovets Steel Mill, Cherepovets, Russia<br />
– Severgal, Cherepovets, Russia<br />
– Neva-MetallTrans, St. Petersburg, Russia<br />
Metalware<br />
M<br />
St<br />
Has a leading position (25% of the market<br />
share) in the Russian metalware industry, an<br />
18% share in the Ukrainian market, and a<br />
23% share in the UK market.<br />
Assets<br />
– <strong>Severstal</strong>-metiz companies: Cherepovets,<br />
Russia, Orel, Russia, Volgograd, Russia<br />
– Dneprometiz, Dnepropetrovsk, Ukraine<br />
– Carrington Wire, Elland, UK<br />
Ts<br />
Mining<br />
Mi<br />
<strong>Severstal</strong>’s Mining segment is one of Russia’s<br />
three largest producers of iron ore concentrate<br />
(with a market share of 9.1%), pellets (30%)<br />
and coking coal (14.7%).<br />
Assets<br />
– Vorkutaugol, Vorkuta, Russia<br />
– Karelsky Okatysh, Kostomuksha, Russia<br />
– Olkon, Olenegorsk, Russia<br />
– Vtorchermet, St. Petersburg, Russia<br />
– Gold-producing companies:<br />
Chita, Russia, Nerungri, Russia,<br />
Semipalatinsk, Kazakhstan<br />
<strong>Severstal</strong> North America<br />
<strong>Severstal</strong> North America (SNA) is the fourth<br />
largest integrated steelmaking company in<br />
the United States, and produces high-quality<br />
flat-rolled products.<br />
Assets<br />
– SNA, Dearborn, USA<br />
– SeverCorr, Columbus, USA*<br />
– Sparrows Point, Baltimore, USA**<br />
– WCI, Warren, USA***<br />
Lucchini<br />
St<br />
St<br />
Lucchini is the second largest steel group<br />
in Italy and one of the largest European<br />
producers of special quality steel long products<br />
by volume of production, with 15 plants and<br />
service centres throughout Europe.<br />
Assets<br />
– Lucchini Piombino, Piombino, Italy<br />
– Lucchini Ascometal, Les Dunes, France<br />
Izhora Pipe Mill<br />
Izhora Pipe Mill is 100% owned by <strong>Severstal</strong><br />
and from <strong>2007</strong> has been considered a<br />
separate business segment. The mill has an<br />
annual production capacity of 600,000<br />
tonnes of large-diameter pipes.<br />
Assets<br />
Izhora Pipe Mill, St. Petersburg, Russia<br />
St<br />
* Consolidated beginning Q1 2008<br />
** Consolidated beginning Q2 2008<br />
*** Consolidated beginning Q3 2008<br />
<strong>Severstal</strong> <strong>Annual</strong> <strong>Report</strong> <strong>2007</strong> 5
Business review<br />
Chairman’s statement<br />
“Our priority remains to continue to build<br />
on our position as a major profitable player<br />
in the global steel industry.”<br />
6 <strong>Severstal</strong> <strong>Annual</strong> <strong>Report</strong> <strong>2007</strong>
Dividend payments were<br />
40.1%<br />
of <strong>2007</strong> net profit<br />
Revenue for <strong>2007</strong><br />
+22.5%<br />
<strong>2007</strong> was a strong year for the global steel and mining industry<br />
with steel production increasing 7.5% to over 1.34 billion tonnes.<br />
The continuing rapid growth of the BRIC economies and their<br />
growing need for infrastructure improvements led to an increased<br />
demand for steel. Steel intensive industries in Europe and North<br />
America also remained healthy.<br />
Cost inflation was a major industry theme across the world<br />
in <strong>2007</strong>. This was in response to dramatic increases in prices for<br />
coking coal and iron ore. However, as a vertically integrated<br />
steelmaker with its own sources of raw materials, <strong>Severstal</strong> enjoys<br />
distinct advantages in the current high-priced market<br />
environment.<br />
The industry consolidation that characterised 2006 continued<br />
in <strong>2007</strong> – particularly in North America – as steel companies<br />
aimed to expand, consolidate supply and gain access to new<br />
markets and customers. We believe this trend will continue.<br />
<strong>Severstal</strong> had a good year in <strong>2007</strong>. EBITDA and profit numbers<br />
were all up and we continued to grow our businesses well. The first<br />
half of the year, in particular, exceeded our expectations as we<br />
demonstrated improving trends in all the key areas. Impressive<br />
growth in the Russian economy and stable prices and markets in<br />
Europe led to significant improvements over the year.<br />
Our priority remains to continue to build on our position as<br />
a major profitable player in the global steel industry. The boom<br />
in infrastructure activity in Russia is great for our business there.<br />
In the US, the market is proving surprisingly resilient. We believe<br />
that there is room to grow our US operations in a disciplined<br />
way, achieving synergies and realising untapped potential.<br />
Our European businesses continue to perform well and we<br />
are also committed to growth in Europe.<br />
Our strategy remains to grow our business both through a<br />
disciplined approach to M&A, and through organic investment.<br />
During the year we announced plans for significant capital<br />
investment in our company. We believe growing our business<br />
organically is one of the best ways to create value for our<br />
shareholders, given the robust demand for steel around the<br />
world and our strong balance sheet. There is no shortage of<br />
opportunities to invest in our businesses; our challenge is to<br />
ensure the money is invested in a disciplined way that delivers<br />
outstanding shareholder returns.<br />
We made good progress in improving our health and safety<br />
standards during the year. I believe there is now much greater<br />
focus on this important part of our business at Board level, and<br />
that we are more transparent regarding our plans and the way in<br />
which we measure safety. We recognise that more remains to be<br />
done and we are resolved to improve our performance in this area.<br />
<strong>Severstal</strong>’s Board of Directors is working well. At the end of<br />
2006 we started a journey together. At the end of the first year I<br />
continue to be impressed by our speed and direction of travel, by<br />
the Board’s level of cohesion and by the depth and scope of our<br />
discussions. Together we have fully embraced high standards of<br />
corporate governance and accountability, and our Independent<br />
Directors contribute a wealth of relevant international and<br />
industry expertise.<br />
I would like to thank the Board and the Executive Team for<br />
their work in <strong>2007</strong> and our shareholders for their support. We have<br />
a lot of very good people working for <strong>Severstal</strong> and it is our<br />
employees who made the company the success it was last year.<br />
On behalf of the Board, I would like to thank them for all their hard<br />
work, in the certain knowledge that this year, and in the future, we<br />
will all continue to achieve more together.<br />
Christopher Clark<br />
Independent Chairman of the Board of Directors<br />
<strong>Severstal</strong> <strong>Annual</strong> <strong>Report</strong> <strong>2007</strong> 7
Business review<br />
Chief Executive’s<br />
statement<br />
8 <strong>Severstal</strong> <strong>Annual</strong> <strong>Report</strong> <strong>2007</strong>
Our strategy for growth is to:<br />
– Retain our position as one of the top global steel<br />
companies by profit<br />
– Pursue organic growth coupled with a disciplined<br />
approach to M&A<br />
– Increase international diversification and vertical integration<br />
– Focus on high-value-added and niche steel products<br />
– Build a strong global platform for profitable growth<br />
I am pleased to report that <strong>Severstal</strong> achieved a strong financial<br />
performance for the year ended 31 December <strong>2007</strong>. The company<br />
made good progress, posting record revenues for the year and<br />
growing net profit by over 33% compared with the previous year.<br />
We also increased EPS by over 22% year-on-year.<br />
EBITDA for <strong>2007</strong> increased by 24.5% compared with the<br />
same period last year. This was due to positive price trends, a<br />
booming Russian economy prompting healthy domestic demand<br />
for steel, and stability in European steel markets. Our increasing<br />
focus on operational efficiency also enabled us to improve the<br />
quality of our operations and pass cost inflation on to our<br />
customers.<br />
Based on our strong earnings and cash flow, the <strong>Severstal</strong><br />
Board decided to increase the dividend payout to 40.1% of net<br />
profit, in line with our stated dividend policy of paying at least<br />
25% of consolidated net profit.<br />
With the exception of <strong>Severstal</strong> North America, all of our<br />
businesses performed well during the year.<br />
<strong>Severstal</strong> Russian Steel<br />
Russian Steel continued to lead our growth, achieving a 26.8%<br />
increase in EBITDA year-on-year to US$2,530 million, with an<br />
EBITDA margin of 31.8% in <strong>2007</strong> compared with 31.6% in 2006.<br />
In Metalware, our unit which manufactures steel wire and other<br />
downstream products from wire rod, our new strategy of moving<br />
to high-value-added products paid off. We achieved <strong>2007</strong> EBITDA<br />
of US$87 million, an increase of 77.6% compared with 2006.<br />
In April <strong>2007</strong>, we announced plans to invest US$77 million at<br />
our Cherepovets Steel Mill to improve one of our galvanising lines.<br />
The investment is in response to growing customer demand for<br />
improved galvanised steel – particularly from the Russian<br />
construction industry – and will double the line’s capacity.<br />
In June <strong>2007</strong>, we announced construction of the second<br />
polymer coating line in Cherepovets. Capable of manufacturing<br />
up to 200,000 tonnes of coated products a year, the line will supply<br />
the domestic construction industry.<br />
Izhora Pipe Mill, our large diameter pipe manufacturer,<br />
performed well, building on the strong foundations set in 2006.<br />
Sales volumes rose to 301,000 tonnes in <strong>2007</strong> as this new business<br />
ramped up to its full production capacity; it reported EBITDA of<br />
US$150.6 million and a <strong>2007</strong> EBITDA margin of 27.3%.<br />
<strong>Severstal</strong> Resources<br />
In our Resources division, <strong>2007</strong> EBITDA was up 13.3% to<br />
US$501 million partly due to higher prices compared with 2006.<br />
Iron ore concentrate production was up by 4.0% year-on-year.<br />
During the year <strong>Severstal</strong> Resources acquired two gold mines<br />
in Russia and extraction and exploitation licences in Russia and in<br />
Kazakhstan. <strong>Severstal</strong> Resources also acquired the entire share<br />
capital of Celtic Resources, a gold mining company, for a total<br />
consideration of US$308.6 million during <strong>2007</strong> and the first<br />
quarter of 2008.<br />
Our strategy for the gold market is based on making relatively<br />
small, opportunistic investments to exploit the synergies and<br />
expertise in our existing core mining business. <strong>Severstal</strong> aims to<br />
invest in gold mining businesses at attractive valuations and to<br />
supplement these with new licence grants.<br />
<strong>Severstal</strong> International<br />
In our International division, <strong>Severstal</strong> North America’s (SNA)<br />
results for the year were impacted by weaker market conditions<br />
in North America and a planned outage related to the relining<br />
of C-Blast Furnace. As a result, EBITDA declined to $21.5 million.<br />
The relining of SNA’s C-Blast Furnace from July to October<br />
<strong>2007</strong> cut production volumes, which were partially compensated<br />
by purchased slabs. Demonstrating of our focus on operational<br />
performance improvements, the newly built furnace was<br />
commissioned three days ahead of schedule and production<br />
resumed immediately afterwards. Over time we expect to reduce<br />
operating costs by introducing new technologies.<br />
Also in the US, we announced plans to accelerate the<br />
expansion of our SeverCorr steel mill in Mississippi. SeverCorr is a<br />
unique combination of the mini-mill steelmaking technology with<br />
an integrated finishing process. It produces high-quality steel<br />
from steel scrap, instead of iron ore, by melting it in an electric arc<br />
furnace feeding a thin-slab caster coupled with a high-powered<br />
hot strip mill. Further processing of steel is accomplished at a<br />
highly sophisticated cold rolling mill and galvanising line. We are<br />
currently investing in a second production line to increase capacity<br />
to 3.0 million tonnes of high-quality steel. We consolidated our<br />
holding in SeverCorr in January 2008 when we acquired 74.2%<br />
of this promising new business.<br />
At our European business, Lucchini, we increased EBITDA by<br />
23.8% to US$416 million compared with the previous year. This<br />
was due to higher prices and a favourable dollar-euro exchange<br />
rate. Revenues rose by 11.9% year-on-year, resulting in an increase<br />
in EBITDA margin to 11.1% in <strong>2007</strong> compared to 10.0% in 2006.<br />
<strong>Severstal</strong> <strong>Annual</strong> <strong>Report</strong> <strong>2007</strong> 9
Business review<br />
“As an integrated metals and mining<br />
company we enjoy a good degree of<br />
self-sufficiency of raw material supplies<br />
and thus significant cost advantages<br />
over other steel companies which buy<br />
raw materials on the open market.”<br />
Investment for growth<br />
At the half year <strong>2007</strong>, we announced plans for significant<br />
investment in the future to grow our business organically. In light<br />
of the strong outlook for the global steel market, we believe there is<br />
the potential to invest significant capital between <strong>2007</strong> and 2011,<br />
particularly in Russia. We plan to invest some US$6 billion in<br />
Russian Steel over this period. The investments will be used to<br />
expand the capacity of Cherepovets Steel Mill and to build two<br />
new mini-mills, with a capacity of one million tonnes each. This<br />
strategy will allow us to grow our long product business and further<br />
develop our value-added product line in Russia.<br />
In the course of <strong>2007</strong> the market experienced large increases<br />
in the price of raw materials around the world. As an integrated<br />
metals and mining company we enjoy a good degree of selfsufficiency<br />
of raw material supplies and thus significant cost<br />
advantages over other steel companies which buy raw materials<br />
on the open market. Vertical integration also ensures security<br />
of supply.<br />
In order to further strengthen our position, we will invest<br />
US$2 billion in our Mining segment between now and 2011.<br />
We aim to grow coal and iron ore production and increase<br />
efficiency of the business.<br />
Plans in North America include improving the performance of<br />
the existing plants with the potential for further investment there,<br />
and the construction of the second phase at SeverCorr. At Lucchini<br />
we plan to build a new thin slab caster in Piombino to start<br />
production of hot-rolled bands from 2011. This investment will<br />
help us to protect our margins better in European operations.<br />
Another notable <strong>2007</strong> milestone was the Board’s articulation<br />
of <strong>Severstal</strong> strategy and a new structure for <strong>Severstal</strong>.<br />
Clear strategy and structure<br />
Our strategy for growth is to:<br />
– Retain our position as one of the top global steel companies<br />
by profit<br />
– Pursue organic growth coupled with a disciplined approach<br />
to M&A<br />
– Increase international diversification and vertical integration<br />
– Focus on high-value-added and niche steel products<br />
– Build a strong global platform for profitable growth.<br />
We have also outlined a new structure for <strong>Severstal</strong> aimed at giving<br />
the Board and investors clear lines of sight to our three key areas of<br />
operations. From April 2008 the company is organised into:<br />
<strong>Severstal</strong> Russian Steel, <strong>Severstal</strong> Resources and <strong>Severstal</strong><br />
International. We believe that this will help us control costs and<br />
improve efficiency, and simplify the reporting lines within the<br />
company; it also acknowledges the growing importance of our<br />
international operations.<br />
Corporate governance and corporate responsibility<br />
<strong>2007</strong> also saw good progress in the areas of corporate governance<br />
and corporate responsibility. <strong>Severstal</strong> was named as the company<br />
that had made the best progress in corporate governance by the<br />
Investors Protection Association of Russia as part of its Russian<br />
Corporate Governance Leaders league table in December <strong>2007</strong>.<br />
<strong>Severstal</strong> was also granted a Euro 600 million loan by the<br />
European Bank for Reconstruction and Development in<br />
recognition of our major drive to cut energy consumption in our<br />
Russian steelmaking operations. The EBRD loan, the largest energy<br />
efficiency transaction yet undertaken in Russia, has the added<br />
environmental benefit of reducing our CO 2 emissions.<br />
Outlook<br />
Our outlook for the future is positive. Demand and steel prices<br />
remain robust and <strong>Severstal</strong> is well positioned as an international<br />
player with a strong balance sheet. We see a number of major<br />
opportunities for metals and mining businesses in Russia, the<br />
US and in Europe. The year ahead will be a busy one, with the<br />
integration of Sparrows Point in North America and numerous<br />
investment projects across our businesses.<br />
Given the current favourable pricing environment in all<br />
our markets, our vertically integrated business model, focused<br />
management and the underlying strength of our business, we are<br />
confident that 2008 will be another year of progress for <strong>Severstal</strong>.<br />
Sincerely yours,<br />
Alexei Mordashov<br />
Chief Executive Officer<br />
10 <strong>Severstal</strong> <strong>Annual</strong> <strong>Report</strong> <strong>2007</strong>
Principal events of <strong>2007</strong><br />
January<br />
Chairman Chris Clark and other Independent Directors – Ronald Freeman,<br />
Martin Angle and Peter Kraljic – became <strong>Severstal</strong> shareholders.<br />
February<br />
Investor Day in London.<br />
April<br />
Two billion rouble investment programme launched at Cherepovets Steel Mill<br />
to improve hot-dip galvanising line.<br />
Karelsky Okatysh began extraction and processing of iron ore at the new<br />
Korpangsky deposit.<br />
Senior Independent Director – Rolf Stomberg – became <strong>Severstal</strong> shareholder.<br />
May<br />
<strong>Severstal</strong> acquired stevedore company Neva-Metall and shipping agent<br />
Neva-Metall Trans for US$100 million.<br />
<strong>Severstal</strong> increased its stake in Lucchini to 79.8%.<br />
<strong>Severstal</strong> purchased the 25% stake in Severgal from ArcelorMittal.<br />
June<br />
Lucchini sold railroad wheel production business Lucchini Sidermeccanica<br />
to SINPAR for Euro 127.8 million.<br />
Karelsky Okatysh signed a three-year contract to deliver iron ore pellets to Corus.<br />
<strong>Severstal</strong> started the construction of Sheksna pipe and section mill.<br />
The production facility will come online in H2 2009.<br />
July<br />
<strong>Severstal</strong> signed an agreement with the Government of the Saratov Region for<br />
the construction of a mini-mill. US$500 million will be invested in the project.<br />
August<br />
Bluecone Limited, owned by <strong>Severstal</strong>, acquired 22% of gold miner Celtic<br />
Resources Holdings Plc.<br />
Vorkutaugol received the “Environmental Standard” certificate at the first<br />
“Russia’s Environmental Support” competition.<br />
September<br />
<strong>Severstal</strong> reported a record US$7,711 million in first half revenues, up 31.1%<br />
year-on-year. EBITDA was up 60.7% at US$2,094 million.<br />
Severnaya Zolotorudnaya Kompaniya (owned by <strong>Severstal</strong>) won the rights<br />
for geological exploration and production of gold ore at the Uryakhskoye ore<br />
deposit in the Republic of Buryatia.<br />
October<br />
Karelsky Okatysh acquired rights for exploration and production of iron ore<br />
at the South Korpangsky iron ore deposit.<br />
Severgal was awarded two quality management certificates for the production<br />
of hot-dip galvanised cold-rolled steel by Lloyd’s Register.<br />
SeverCorr steel mill, located in Columbus, Mississippi, began production.<br />
<strong>Severstal</strong> acquired two gold-mining businesses: Neryungri Metallic and Rudnik<br />
Aprelkovo for a total consideration of US$105 million and US$153 million,<br />
respectively.<br />
<strong>Severstal</strong> North America blast furnace “C” began production after 98-day<br />
modernisation outage.<br />
November<br />
Cherepovets Steel Mill was awarded Lloyd’s Register certificates for the<br />
production of normal and high strength steel.<br />
Izhora Pipe Mill successfully achieved certification of compliance with the<br />
DNV offshore pipeline quality standard.<br />
<strong>Severstal</strong> sold 73.1% of Metallurgic Commercial Bank to Kapital LLC for a total<br />
consideration of US$43 million.<br />
December<br />
During August–December <strong>2007</strong>, <strong>Severstal</strong> acquired an 86.3% stake in Celtic<br />
Resources Holdings Plc. for a total consideration of US$264.6 million.<br />
<strong>Severstal</strong> awarded the prize for “The best progress in corporate governance”<br />
by the Investor Protection Association.<br />
2008 events<br />
January<br />
<strong>Severstal</strong> acquired a 100% stake in Baracom Limited from its majority<br />
shareholder for US$84.4 million. Baracom owns 79.9% of the voting stock of<br />
the holding structure, which controls 74.2% of SeverCorr. Accordingly, starting<br />
from January 2008 SeverCorr will be included in the <strong>Severstal</strong>’s consolidated<br />
financial statements.<br />
<strong>Severstal</strong> acquired the remaining 13.7% stake in Celtic Resources Holdings Plc<br />
for US$44 million.<br />
March<br />
<strong>Severstal</strong> reported a 22.5% increase in full year revenues to US$15.25 billion<br />
and a 33.8% rise in net profit to US$1.94 billion.<br />
April<br />
<strong>Severstal</strong> sold its stakes in OAO Mine Berezovskaya, OAO Mine Pervomaiskaya and<br />
ZAO Zhernovskaya-3 to ArcelorMittal for a total consideration of US$652 million.<br />
May<br />
<strong>Severstal</strong> acquired the Sparrows Point plant in Baltimore, Maryland for<br />
US$810 million.<br />
June<br />
<strong>Severstal</strong> signed merger agreement to acquire 100% shares of Esmark Inc.<br />
for US$775 million.<br />
July<br />
<strong>Severstal</strong> acquired the WCI Steel plant in Warren, Ohio for an enterprise<br />
value of approximately US$370 million.<br />
<strong>Severstal</strong> <strong>Annual</strong> <strong>Report</strong> <strong>2007</strong> 11
Business review<br />
The world of <strong>Severstal</strong><br />
From our beginnings in Russia, our reach now<br />
extends internationally and our operations stretch<br />
across Europe and to North America where we are<br />
now the fourth largest steel producer.<br />
We have a clear strategy for creating value, as<br />
demonstrated by this year’s strong financial<br />
performance and we are building a solid platform<br />
for delivering superior and sustainable returns.<br />
We are clear on what sets us apart and where we<br />
are going. Our vertically integrated model ensures<br />
security of our supply of raw materials, and affords<br />
us significant cost advantages, by cushioning us from<br />
rising prices. We aim to continue to grow organically,<br />
and will combine this with a disciplined approach<br />
to M&A. We will also continue our growing focus on<br />
high-value-added and niche products.<br />
The following pages provide an insight into the<br />
world of <strong>Severstal</strong>.<br />
12 <strong>Severstal</strong> <strong>Annual</strong> <strong>Report</strong> <strong>2007</strong>
Reconstructed in 1996 using steel produced<br />
by <strong>Severstal</strong>, Luzhniki Stadium in Moscow<br />
is the biggest sports stadium in Russia.<br />
With a seating capacity of nearly 80,000<br />
it is the home of FC Spartak Moscow and<br />
on 21 May 2008 was the venue for the<br />
2008 UEFA Champions League Final.<br />
<strong>Severstal</strong> <strong>Annual</strong> <strong>Report</strong> <strong>2007</strong> 13
Business review<br />
Mining<br />
With high-quality mining complexes in northwest Russia<br />
producing iron ore and coking coal, <strong>Severstal</strong> Mining<br />
segment is the second largest producer of pellets and<br />
coking coal in Russia.<br />
With iron ore reserves estimated at more than 23 years*<br />
and coal reserves estimated at 38 years*, <strong>Severstal</strong><br />
Mining segment forms the basis of <strong>Severstal</strong>’s<br />
balanced and vertically integrated business model.<br />
* JORC estimate increased by expected reserves extension.<br />
14 <strong>Severstal</strong> <strong>Annual</strong> <strong>Report</strong> <strong>2007</strong>
The mining area of Vorkutaugol consists<br />
of five underground mines, three washing<br />
plants and one open pit which is the only<br />
hard coking coal open mine outside of the<br />
Arctic circle.<br />
<strong>Severstal</strong> <strong>Annual</strong> <strong>Report</strong> <strong>2007</strong> 15
Business review<br />
Russian Steel<br />
Russian Steel is the third largest producer of<br />
domestic crude steel and the third largest<br />
producer of metal products in Russia.<br />
Russian Steel is focused on high-margin, highvalue-added<br />
products, such as cold-rolled and<br />
galvanised sheet, including automotive grades<br />
and heavy plate, tubular and drawn products.<br />
16 <strong>Severstal</strong> <strong>Annual</strong> <strong>Report</strong> <strong>2007</strong>
Severgal, Cherepovets is equipped with<br />
state-of-the-art facilities with a focus on<br />
production of high quality, high value-added<br />
sheet steel for exposed and unexposed<br />
automotive parts.<br />
<strong>Severstal</strong> <strong>Annual</strong> <strong>Report</strong> <strong>2007</strong> 17
Business review<br />
<strong>Severstal</strong> North America<br />
<strong>Severstal</strong> North America’s total steel production in<br />
<strong>2007</strong> was approximately 2 million tonnes of crude<br />
steel and 2.3 million tonnes of rolled steel products.<br />
With a large customer base and extensive product<br />
mix, <strong>Severstal</strong> North America is focused on growth<br />
both organically and through targeted acquisitions<br />
that would allow for synergies across the segment.<br />
18 <strong>Severstal</strong> <strong>Annual</strong> <strong>Report</strong> <strong>2007</strong>
A process technician at Spartan Steel<br />
Coating performs final inspection for<br />
one of <strong>Severstal</strong>’s automotive customers.<br />
Spartan’s dedicated workforce is a key<br />
component in the efficient, low-cost<br />
production of hot-dipped galvanised<br />
products for demanding applications.<br />
<strong>Severstal</strong> <strong>Annual</strong> <strong>Report</strong> <strong>2007</strong> 19
Business review<br />
Lucchini<br />
Lucchini is the second largest steel group in Italy<br />
and one of the largest European producers of<br />
special quality long steel products. With more<br />
than 600 customers in niche markets, including<br />
automotive, rails, bearings, springs and wire rod,<br />
Lucchini’s total steel production in <strong>2007</strong> was<br />
3.6 million tonnes of crude steel and 3.6 million<br />
tonnes of finished products.<br />
In the railway sector, Lucchini produces rails<br />
and products for railway applications in the<br />
Piombino plant and cast manganese<br />
crossings for railway points in the BFM<br />
plant in Bari.<br />
20 <strong>Severstal</strong> <strong>Annual</strong> <strong>Report</strong> <strong>2007</strong>
<strong>Severstal</strong> <strong>Annual</strong> <strong>Report</strong> <strong>2007</strong> 21
Business review<br />
Metalware<br />
The Metalware segment produces metal products<br />
from cold-drawn high-carbon and low-carbon steel<br />
for retail consumers, and also for the automobile,<br />
construction and engineering industries. In <strong>2007</strong>,<br />
the segment turned out a total of 1,048 thousand<br />
tonnes of metal products with sales of US$1 billion.<br />
<strong>Severstal</strong>-metiz’ Cherepovets plant, was the<br />
first Russian producer of prestressed concrete<br />
stabilised strands.<br />
22 <strong>Severstal</strong> <strong>Annual</strong> <strong>Report</strong> <strong>2007</strong>
<strong>Severstal</strong> <strong>Annual</strong> <strong>Report</strong> <strong>2007</strong> 23
Business review<br />
Izhora Pipe Mill<br />
Commissioned in July 2006, the Izhora Pipe Mill<br />
manufactures large diameter pipes for the oil and<br />
gas industry and has seen strong growth fuelled by<br />
the ambitions of customers in this sector. In less<br />
than two years IPM products have achieved the<br />
highest quality standards and have attracted clients<br />
including OAO Gazprom, Transneft and NOVATEK.<br />
24 <strong>Severstal</strong> <strong>Annual</strong> <strong>Report</strong> <strong>2007</strong>
In <strong>2007</strong>, Izhora Pipe Mill produced more<br />
than 38,000 large diameter pipes. It is the<br />
only 18.3 metre length large diameter pipe<br />
manufacturer in Russia.<br />
<strong>Severstal</strong> <strong>Annual</strong> <strong>Report</strong> <strong>2007</strong> 25
Business review<br />
Steel and mining<br />
industry overview<br />
World crude steel production<br />
2001–<strong>2007</strong>, million tonnes<br />
1,500<br />
1,200<br />
900<br />
852<br />
904 970<br />
1,069<br />
1,146<br />
1,250<br />
1,344<br />
600<br />
300<br />
0<br />
2001<br />
2002<br />
2003 2004 2005 2006 <strong>2007</strong><br />
Source: International Steel Statistics Bureau.<br />
International markets<br />
Supply and demand<br />
<strong>2007</strong> was a successful year for the global steel and mining<br />
industries. The global economy was strong, recording robust<br />
5.2% growth in real terms. This was to a large extent led by the<br />
continuing strength of the emerging economies: China, India,<br />
Brazil and, <strong>Severstal</strong>’s key local market, Russia.<br />
A substantial increase in steel-intensive infrastructure and<br />
construction spending was driven by three key factors: strong<br />
macroeconomic fundamentals, rising foreign and domestic<br />
investments, and a long-standing need to upgrade infrastructure<br />
in emerging markets. The global economy was also sustained by<br />
high demand for automotive and machine goods.<br />
In Europe, steel-intensive industries enjoyed a good year,<br />
while in the US the mortgage and real estate crisis did not have<br />
an immediate adverse effect on steel consumption. Despite a<br />
decline in residential construction, steel-intensive non-residential<br />
construction remained relatively strong, while American<br />
manufacturers benefited from a weaker US dollar. However,<br />
Steel output and demand in North America was relatively weak<br />
throughout the first half of <strong>2007</strong>, starting to recover by the end<br />
of the year.<br />
Overall, <strong>2007</strong> global steel production increased by 7.5% to<br />
over 1.34 billion tonnes. While steel production grew in absolute<br />
terms, actual growth rates decreased: in 2006 the rate of steel<br />
production growth was 9.1%.<br />
Some analysts are forecasting a shortage of finished steel in<br />
2008 due to a slowdown in Chinese exports and an increase in US<br />
imports at a time when global demand will remain strong. Global<br />
steel production, excluding China, was up by 3.3%, in line with<br />
the expectations of the industrial monitoring agency World Steel<br />
Dynamic, which said that the global steel demand will grow by<br />
3.5% annually up to 2015.<br />
The rapid rise in freight costs led to further regionalisation of<br />
steel demand and supply, effectively limiting the competitiveness<br />
of export sales. This has benefited companies from importing<br />
regions such as North America. At the same time, it has not had<br />
a significantly negative effect on the profitability of traditional<br />
exporters from the CIS and Latin America, due to the sharp<br />
increase in domestic demand.<br />
In <strong>2007</strong>, for the second consecutive year, China was the<br />
world’s leading steel-producer. This was due to Chinese capacity<br />
and production rising by 66 million tonnes, or 16%, in <strong>2007</strong><br />
compared to 2006. Russia remained the world’s fifth largest steel<br />
producer in <strong>2007</strong>, with 72.2 million tonnes of steel (2% growth).<br />
Rates of capital outlay in the global steel industry remained<br />
high in <strong>2007</strong>, reflecting a strong demand outlook and improved<br />
steel industry economics. Overall levels of investments per tonne<br />
were almost twice the average level attained in 2000–2003.<br />
However, a significant proportion of these capital investments<br />
went into reducing costs rather than into increasing capacity.<br />
With the exception of China, global capacity increases are not<br />
expected to outstrip demand until at least 2010.<br />
Costs and prices<br />
Cost inflation became a material issue for the global steel and<br />
mining industry during <strong>2007</strong>. The commodity pricing boom and<br />
an improved investment climate over the last few years has<br />
facilitated a series of sharp rises in the financial inflows into the<br />
world’s emerging economies. This has in turn put pressure on<br />
domestic inflation and led to a substantial appreciation of<br />
local currencies.<br />
The growing deficit of skilled labour was particularly acute<br />
in the mining industry given its huge greenfield and brownfield<br />
capacity expansions. Steel and mining equipment and spare parts<br />
prices also increased, reflecting rising global demand and limited<br />
production capacity.<br />
26 <strong>Severstal</strong> <strong>Annual</strong> <strong>Report</strong> <strong>2007</strong>
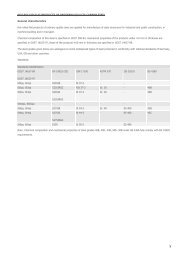
Crude steel production<br />
Million tonnes<br />
<strong>2007</strong> 2006 Change Share in <strong>2007</strong><br />
year-on-year % %<br />
China 489.0 422.7 16 36<br />
EU27 210.3 206.8 2 16<br />
Japan 120.2 116.2 3 9<br />
USA 97.2 98.6 –1 7<br />
Russia 72.2 70.8 2 5<br />
India 53.1 49.5 7 4<br />
South Korea 51.4 48.5 6 4<br />
Ukraine 42.8 40.9 5 3<br />
Brazil 33.8 30.9 9 3<br />
Turkey 25.8 23.3 11 2<br />
Taiwan, China 20.5 20.0 2 2<br />
Mexico 17.2 16.3 6 1<br />
Canada 16.4 15.5 6 1<br />
Iran 10.1 9.8 3 1<br />
South Africa 9.1 9.7 –6 1<br />
Other 74.5 70.7 5 6<br />
Total 1,343.6 1,250.2 7 100<br />
Total, excluding China 854.6 827.5 3 64<br />
Source: International Iron and Steel Institute.<br />
Although raw materials contract prices increased only<br />
marginally around the world in <strong>2007</strong>, the supply of raw materials<br />
was unable to catch up with surging demand in the second half<br />
of the year. As a result, spot raw materials prices increased<br />
substantially – in certain cases by as much as 70%–150% –<br />
compared with 2006 levels. Price increases were acute for all the<br />
major raw materials costs of steelmaking, including coking coal,<br />
coke, iron ore and steel scrap.<br />
These price upgrades will be reflected in 2008 contract prices<br />
for iron ore and coal, contributing to a substantial increase in<br />
steelmaking costs in 2008. Price pressure from the raw materials<br />
market has highlighted the benefits of vertical integration and<br />
increased the level of strategic interest from steelmakers in<br />
upstream markets. Vertically integrated steelmakers like <strong>Severstal</strong><br />
are therefore in a stronger position regarding raw materials prices<br />
than those buying their iron ore and coal on the open market.<br />
Prices of hot-rolled flat metal products rose most steeply in<br />
Europe and Asia – growth of 15% in <strong>2007</strong>. In Russia, prices grew<br />
by 7%, while in the US they fell by 9%.<br />
Significant global price increases for long-rolled steel in <strong>2007</strong><br />
were due both to increased demand, and the growth in prices for<br />
scrap metal. The rates of price increases were particularly steep in<br />
Russia where beams were up by 51%, fixtures by 29%, and rolled<br />
wire by 33%.<br />
M&A and valuations<br />
Global consolidation in the steel industry continued in <strong>2007</strong> as<br />
steel companies aimed to expand their geographic presence,<br />
consolidate supply, and gain access to new markets and<br />
customers.<br />
M&A activity was particularly strong in North America where<br />
many of the remaining mid-sized companies were acquired by<br />
international majors from Europe and emerging markets. There<br />
was also a new trend: steel companies became increasingly<br />
interested in acquiring raw materials suppliers, including scrap<br />
collectors. For example, Nucor and Steel Dynamics, the two<br />
leading mini-mill steelmakers in North America, made substantial<br />
acquisitions of scrap companies operating in the US market.<br />
As further evidence of this trend, <strong>Severstal</strong> acquired Vtorchermet,<br />
a 1.1 million tonnes scrap collector in Russia.<br />
Increases in iron ore, coking coal and other bulk materials<br />
prices have prompted more M&A activity in the mining sector.<br />
Many leading steel companies made self-sufficiency in raw<br />
materials a key strategic priority.<br />
In this climate of continued consolidation, disciplined<br />
production behaviour and strong global demand for steel, the steel<br />
industry has benefited from increased attention from investors.<br />
The average EV/EBITDA multiple for the major publicly-traded<br />
steel companies has increased from less than five in 2006 to just<br />
over six in <strong>2007</strong>, reflecting increased investor confidence in the<br />
long-term sustainability of steelmakers’ earnings.<br />
This increase in multiples was particularly strong for Russian,<br />
Latin American and Asian companies as historical discounts were<br />
eliminated and higher long-term demand growth rates justified<br />
higher valuation. For markets like Russia, with relatively few<br />
opportunities to invest directly in infrastructure growth,<br />
investments in steel companies were seen as the gateway<br />
to the infrastructure and construction boom.<br />
Despite the recent consolidation activity, the steel<br />
industry remains much more fragmented than that of its<br />
suppliers (particularly iron ore), or its largest customers (such as<br />
automotive), or other metallurgic industries, such as Aluminium.<br />
Further takeovers, mergers and alliances are inevitable as<br />
producers look to integrate horizontally with other mills, and<br />
vertically with raw material suppliers and steel distributors, to<br />
secure their futures.<br />
<strong>Severstal</strong> <strong>Annual</strong> <strong>Report</strong> <strong>2007</strong> 27
Business review<br />
Global steel<br />
Million tonnes<br />
16<br />
1<br />
2<br />
3<br />
4<br />
5<br />
6<br />
7<br />
8<br />
9<br />
10<br />
11<br />
12<br />
13<br />
14<br />
15<br />
Clockwise from the top:<br />
1 ArcelorMittal 116<br />
2 Nippon 36<br />
3 JFE 34<br />
4 Posco 33<br />
5 Baosteel 29<br />
6 Tata/Corus 27<br />
7 US Steel/Stelco 24<br />
8 Jiangsu Shagang 23<br />
9 Tangshan 23<br />
10 Wuhan 20<br />
11 Nucor 20<br />
12 Riva 18<br />
13 Gerdau 18<br />
14 Thyssen Krupp 17<br />
15 <strong>Severstal</strong> 17<br />
16 Others 889<br />
Total <strong>2007</strong> 1,344<br />
<strong>Severstal</strong>'s position in the global industry<br />
In <strong>2007</strong>, according to the International Steel Statistics Bureau,<br />
<strong>Severstal</strong> became the world’s 15th largest steel producer by<br />
production volumes. <strong>Severstal</strong>’s Russian Steel division is Russia’s<br />
third largest steel company by volume of crude steel production<br />
(16.4%), and second in steel products distribution (17.9%).<br />
On the Russian market, which remains the most important<br />
to us, we traditionally compete against NLMK and MMK in<br />
production and distribution of flat-rolled products.<br />
In the construction, metalware and engineering industries,<br />
we compete with Evraz, Oskol Steel Mill and Mechel Steel Group<br />
in production and sales of long products. These companies, as<br />
well as Ukrainian enterprises, are our principal competitors on the<br />
export markets.<br />
<strong>Severstal</strong>’s competitive advantages<br />
<strong>Severstal</strong> preserved a leadership position in the domestic market<br />
due, principally, to our high production quality, wide product<br />
range, reliable deliveries and our flexible payment conditions.<br />
A constant drive to reduce costs helps us improve our financial<br />
results and allows us to enter new markets. We also successfully<br />
satisfy growing customer demands for more technical support<br />
and maintenance.<br />
In export markets, we sell basic-quality products where the key<br />
competing factor is price. With sales of innovative products such<br />
as automobile body sheets and strips, quality ranks in equal<br />
importance to price.<br />
Russian market<br />
Steel market<br />
In <strong>2007</strong>, Russian steel production grew at rates ahead of global<br />
production. Consumption of finished steel grew by 14% and<br />
reached 40 million tonnes.<br />
In <strong>2007</strong>, volumes of rolled product deliveries to the Russian<br />
domestic markets increased by 8.6%. Export of metal products<br />
from Russia decreased by 6% compared to 2006, from<br />
31.4 million tonnes to 29.5 million tonnes. Imports of rolled<br />
metal products into Russia grew by 46% compared with 2006,<br />
amounting to 6.3 million tonnes. Imports of steel pipes increased<br />
by 21% and amounted to 1.6 million tonnes. Growth in domestic<br />
consumption was driven by construction companies and the oil<br />
and gas industry.<br />
The Russian coal and iron ore markets<br />
Coking coal<br />
Total volumes of Russian coal concentrate production were<br />
48.5 million tonnes. In <strong>2007</strong> Vorkutaugol’s share of overall coking<br />
coal production volumes was 11.4%, 0.6% less than the previous<br />
year. Vorkutaugol’s share in overall coal concentrate production<br />
volumes was 8.4%, 2.1% less than in 2006.<br />
Total volumes of coking coal concentrate consumption<br />
in Russia were 42.4 million tonnes in <strong>2007</strong>, 4 million tonnes<br />
more than in 2006. The volume of export deliveries was<br />
9.9 million tonnes, which is 120,000 tonnes more than in 2006.<br />
86% of deliveries went to integrated steel mills and 14% to<br />
chemical plants.<br />
Iron ore<br />
There are 13 Russian companies producing iron ore, the majority<br />
of which are a part of the metallurgic business. Russian companies<br />
produced 97.9 million tonnes of iron ore in <strong>2007</strong>, up 0.6% on<br />
2006. In <strong>2007</strong> volumes of iron ore consumption in Russia were<br />
84.8 million tonnes, 0.5% more than in the previous year.<br />
In <strong>2007</strong>, <strong>Severstal</strong>’s Mining share of Russian production of<br />
iron ore was 14.6%, a decrease of 0.3% on the previous year.<br />
The market for metal-intensive industries<br />
Automotive industry<br />
In <strong>2007</strong>, the market size was 2.3 million tonnes, down 2%<br />
from 2006 levels. The market saw a decline in the production of<br />
domestic cars and exponential growth in foreign car production<br />
at Russian joint venture automotive companies. Future prospects<br />
for this market are linked to both production volumes at the<br />
joint venture companies and to the increasing level of localisation<br />
of production.<br />
28 <strong>Severstal</strong> <strong>Annual</strong> <strong>Report</strong> <strong>2007</strong>
Pipe industry<br />
In <strong>2007</strong>, the steel consumption in the pipe market was some<br />
5.6 million tonnes – without seamless pipes – which is 15–18%<br />
larger than it was in 2006.<br />
The pipe industry is divided into two segments: producers<br />
of pipes for the oil and gas industry and producers of pipes for<br />
the public utilities and housing sector.<br />
The oil and gas industry pipe market saw strong demand,<br />
with a large number of announced projects for construction of<br />
oil and gas pipelines, and by growing competition among the<br />
pipe producers.<br />
The public utilities and housing sector pipe market shows<br />
demand growth tied to more residential construction. The<br />
principal risk for the steel producers is in the growing consumption<br />
of plastic pipes.<br />
Machinery building<br />
In <strong>2007</strong> the size of the market for metal products for machinery<br />
building was approximately 6.7 million tonnes, which is 7–9%<br />
larger than in 2006. The market is characterised by stable<br />
consumption growth, especially in railway machinery, handling<br />
machinery, agricultural equipment, extracting and metallurgical<br />
equipment.<br />
Construction and Steel Service Centres<br />
In <strong>2007</strong>, this segment consumed almost 18 million tonnes.<br />
The segment grew by 13–14% in comparison with 2006, while<br />
construction industry growth was just over 10%. One important<br />
growth factor was the implementation of a top priority national<br />
project called “Accessible and Comfortable Housing for the<br />
Citizens of Russia”.<br />
Outlook for 2008<br />
The outlook for 2008 is positive for the steel and mining<br />
industries, particularly for the emerging markets and integrated<br />
steel producers.<br />
The global steel market is expected to be robust in most<br />
regions. Despite recent problems in the financial sector, the US<br />
market will benefit from reduced steel inventories, the weaker<br />
US dollar and increased ocean freight rates causing reduction<br />
of imports, while rising infrastructure spending and demand for<br />
durable goods from the emerging economies will sustain global<br />
steel demand growth.<br />
It is likely that European economic expansion will decelerate<br />
compared to <strong>2007</strong> given the higher euro exchange rate and the<br />
overall slowdown in the global financial sector.<br />
The global steel supply-demand balance is likely to<br />
remain tight given the few capacity additions planned for 2008<br />
outside China.<br />
A significant increase in raw materials prices will lead to a<br />
sharp rise in steel costs for non-integrated steelmakers. We expect<br />
these to rise by more than US$100/tonne compared to 2006.<br />
In this environment, global steel prices are expected to rise<br />
substantially in 2008.<br />
The key question is whether steel companies will be able to<br />
pass all the cost increases on to customers and sustain their own<br />
margins. Upstream-integrated steel producers from emerging<br />
regions are particularly well placed for 2008 given higher raw<br />
materials prices and strong demand from domestic economies.<br />
<strong>Severstal</strong> <strong>Annual</strong> <strong>Report</strong> <strong>2007</strong> 29
Business review<br />
Risk management<br />
<strong>Severstal</strong>’s business activities are subject to a number of risks, the<br />
most significant of which are listed below.<br />
The company consistently takes steps to establish an effective<br />
system of risk management, aimed at guaranteeing a sufficient<br />
level of confidence in achieving our strategic and operational goals,<br />
and providing a reasonable guarantee against losses. The policies,<br />
standards and procedures of our risk management system are<br />
applied right across <strong>Severstal</strong>.<br />
Management and employees at all levels of the company<br />
are responsible for establishing and implementing our risk<br />
management system.<br />
To co-ordinate the implementation of the risk management<br />
system, <strong>Severstal</strong> has established a Risk Management Committee.<br />
Members include the key managers of <strong>Severstal</strong>’s various businesses.<br />
<strong>Severstal</strong>’s Directors and senior management oversee the risk<br />
management system, constantly measuring its effectiveness.<br />
Risks<br />
Market risks<br />
Changes in supply and demand<br />
Changes in the prices of<br />
manufactured products<br />
Changes in the prices of raw<br />
materials, fuel and services<br />
Description of risks<br />
Demand for steel depends on economic development and demand<br />
from metal-intensive industries. <strong>Severstal</strong> is sensitive to changes in<br />
demand from the automotive, construction and the oil and gas<br />
industries, because these are the largest consumers of our products.<br />
Metal products and mining sources are subject to price cycles. In<br />
recent years the market has been characterised by favourable steel<br />
prices, which are likely to remain in 2008. However, the potential<br />
risks of cyclical price reduction remain.<br />
<strong>Severstal</strong> consumes significant volumes of raw materials, mostly<br />
coking coal, iron ore, ferroalloys and non-ferrous metals, as well as<br />
electricity, natural gas and oxygen. There are risks of changing<br />
prices and tariffs for these resources.<br />
Measures to reduce the risks<br />
Investments in research and development, improving the quality<br />
and production of new types of hi-tech products.<br />
Creation of a geographically-balanced product offer.<br />
Increases in the production of niche products and high-addedvalue<br />
products, the price of which is less likely to oscillate with<br />
the market.<br />
Entering into long-term contracts with customers.<br />
Maintaining a high level of vertical integration between the<br />
segments, increasing the extraction of iron ore and coal.<br />
Entering into long-term contracts with vendors of raw materials<br />
and services.<br />
Financial risks<br />
Credit risks<br />
Changes in interest rates<br />
Changes in exchange rates<br />
Credit risks a possible failure to pay or delay in payments for<br />
supplied products on the part of customers or a delay or refusal of<br />
the guaranteeing bank to pay <strong>Severstal</strong> on behalf of a customer.<br />
There are risks that banks may be unable to return <strong>Severstal</strong>’s<br />
deposits in case of unfavourable developments in their credit quality.<br />
Changes in interest rates mainly influence contracted loans or<br />
other types of loan financing by way of changing their fair value<br />
(in the case of fixed interest rates) or future cash flows (in the<br />
case of floating interest rates).<br />
Considering the international nature of its business, the company<br />
conducts its deals as well as holds assets and obligations<br />
nominated in several currencies – Russian roubles, US dollars,<br />
Euros, British pounds, Latvian lats, Canadian dollars and several<br />
others. The company’s activities are subject to the influence of<br />
exchange rate risks.<br />
The company has developed and is using policies and procedures<br />
for managing credit risks, such as:<br />
– Delivery of products on the conditions of pre-payment<br />
– Receipt of banking guarantees for payment from the<br />
counteragents<br />
– Insuring non-payment risks<br />
– Payment through banking letters of credit<br />
– Diversification in placement of funds<br />
– Constant monitoring of customers’ credit profiles.<br />
The company monitors situations on the capital markets and<br />
reacts quickly to changes in market indicators.<br />
When raising loan financing the management makes a decision<br />
as to whether fixed or floating interest rates will be more<br />
favourable, based on the length of financing terms.<br />
Use of financial hedges.<br />
The company constantly evaluates the dynamics of exchange<br />
rates and makes the necessary corrections to its own<br />
currency position.<br />
Use of financial hedges.<br />
30 <strong>Severstal</strong> <strong>Annual</strong> <strong>Report</strong> <strong>2007</strong>
Risks<br />
Operational risks<br />
Investment effectiveness<br />
Personnel<br />
Industrial safety and<br />
environmental protection<br />
Description of risks<br />
Technological and technical risks<br />
The risk of errors in implementing design works and manufacturing<br />
operations.<br />
Risk of delays with starting up equipment. These risks may lead to<br />
lost time and an increase in the overall cost of the project. This may<br />
ultimately have a negative influence on the financial results.<br />
There is also a risk of personnel error while working with unfamiliar<br />
equipment, which may lead to breakdowns, downtime,<br />
manufacturing of low-quality products and the subsequent<br />
loss of profits.<br />
Risks tied to the acquisition of new assets<br />
The risk of investments with low effectiveness.<br />
The growth in average labour costs as well as a shortage of<br />
personnel, especially among qualified workers, is a significant risk<br />
for the metallurgic industry.<br />
The metallurgic and mining industries are potentially dangerous for<br />
people and for the environment. In recognition of this, companies<br />
in these industries are obliged to meet strict labour safety<br />
requirements, the provision of industrial and fire safety precautions,<br />
and environmental protection.<br />
The consequences of accidents or fires may lead to additional<br />
expenditure to restore damaged buildings and equipment, as<br />
well as the additional expenditure needed to observe contract<br />
obligations for the delivery of products or services to customers.<br />
Risks involving a potential threat of labour disruption or illness<br />
among the workforce may lead to increased costs for additional<br />
measures to guarantee the safety of production processes,<br />
technologies or equipment.<br />
Measures to reduce the risks<br />
<strong>Severstal</strong> exercises a well-developed and economically-grounded<br />
investment programme for the modernisation of equipment and<br />
construction of new production facilities. All of the work is done in<br />
accordance with our investment plan.<br />
To neutralise the technological and technical risks, <strong>Severstal</strong> is very<br />
careful in choosing contractors for construction, installation and<br />
launch of equipment. The company also has a complex<br />
programme of personnel training.<br />
We acquire new companies only after very careful analysis,<br />
including a discussion of the Board of Directors, half of whom<br />
are Independent Directors.<br />
<strong>Severstal</strong> is working to increase labour productivity as well as<br />
carrying out personnel optimisation and implementing various<br />
motivation programmes.<br />
Each of <strong>Severstal</strong>’s businesses develops and implements a plan<br />
aimed at excluding or minimising risks that present potential<br />
danger to people and to the environment.<br />
These measures include:<br />
– Investments in modernisation and re-equipping existing<br />
production facilities aimed at guaranteeing safe production<br />
and a reduction in its negative effects on the environment<br />
– Creation of complex systems of industrial safety, especially<br />
for our mining businesses<br />
– Constant personnel training in production safety<br />
– Strict internal controls to ensure the necessary regulations<br />
and operational procedures are followed<br />
– Timely fulfilment of certification procedures for the<br />
company’s equipment<br />
– Insuring buildings and equipment from damage in case<br />
of accidents<br />
– Insurance of losses from suspension of operations in form<br />
of the compensation for certain fixed expenses<br />
– Insurance of obligations to third parties pertaining to materials<br />
damages or environmental damages<br />
– Obligatory personnel insurance against accidents and illnesses<br />
in the workplace.<br />
<strong>Severstal</strong> <strong>Annual</strong> <strong>Report</strong> <strong>2007</strong> 31
Business review<br />
<strong>Severstal</strong> performance review<br />
<strong>Severstal</strong> revenue<br />
US$ million<br />
<strong>Severstal</strong> EBITDA<br />
US$ million<br />
20,000<br />
4,000<br />
3,680<br />
15,000<br />
10,000<br />
10,452<br />
12,449<br />
15,245<br />
3,000<br />
2,000<br />
2,839<br />
2,957<br />
5,000<br />
1,000<br />
0<br />
2005<br />
2006<br />
<strong>2007</strong><br />
0<br />
2005<br />
2006<br />
<strong>2007</strong><br />
<strong>Severstal</strong> is an international, vertically-integrated metals<br />
and mining company that sells high-quality metal and<br />
mining products to customers all over the world.<br />
In <strong>2007</strong>, we became the world’s 15th largest steel producer.<br />
We are a full production cycle company comprising ore mining<br />
enterprises, steel mills and rolled product plants as well as<br />
downstream production businesses. Our production facilities are<br />
geographically diversified, with locations in Russia, the United<br />
States, Italy, France, Great Britain, Ukraine and elsewhere.<br />
Following a corporate restructuring in April 2008, our company<br />
is made up of three divisions: <strong>Severstal</strong> Russian Steel, <strong>Severstal</strong><br />
Resources and <strong>Severstal</strong> International. <strong>Severstal</strong> Russian Steel<br />
division includes Russian Steel, Izhora Pipe Mill, and Metalware.<br />
Resources comprises <strong>Severstal</strong>’s assets relating to iron ore,<br />
coal and gold mining. International includes North America<br />
operations and Lucchini.<br />
Key production figures<br />
In <strong>2007</strong>, <strong>Severstal</strong> reported record revenues of US$15,245 million,<br />
22.5% more than in 2006. The volume of crude steel production<br />
remained at the same level – 17.5 million tonnes. EBITDA was<br />
US$3,680 million, 24.5% more than in the previous year. This<br />
strong performance was due to favourable market conditions and<br />
growing demand for our products in Russia and internationally<br />
as well as management efforts to improve efficiency and control<br />
costs. EBITDA margin grew from 23.8% to 24.1%.<br />
Russian Steel remained the most important business by share<br />
of total revenue, which grew from 45.4% in 2006 to 46.4% in<br />
<strong>2007</strong>. Izhora Pipe Plant contributed 3.2% to the company’s total<br />
revenues, or US$551 million. Metalware’s share remained almost<br />
unchanged, while its sales grew by US$173 million. Mining’s share<br />
of consolidated revenues increased to 12.8% in <strong>2007</strong> compared<br />
with 10.7% a year earlier. <strong>Severstal</strong> North America contributed<br />
9.8% to total revenues in <strong>2007</strong>, a decrease from 13.5% in 2006.<br />
This is due to lower sales during the planned repair of the C blast<br />
furnace, which took place in the third quarter. The share of<br />
Lucchini was 21.9% in <strong>2007</strong>, while in 2006 it was 24.2%.<br />
Russian Steel also remained the most profitable segment of<br />
the company. In <strong>2007</strong> its EBITDA margin amounted to 31.8%,<br />
compared with 31.6% in 2006. In its first year of operations<br />
Izhora Pipe Plant also demonstrated a high EBITDA margin of<br />
27.3%, illustrating the effectiveness of our focus on high-valueadded<br />
products. Mining’s EBITDA margin was down to 22.8%<br />
due to lower production volumes at the Vorkutaugol mines.<br />
Lucchini increased its EBITDA margin to 11.1% in <strong>2007</strong> from<br />
10.0% in 2006 following a programme to reduce expenses.<br />
<strong>Severstal</strong> North America’s EBITDA margin fell to 1.2% in <strong>2007</strong><br />
due to weaker market conditions and reduced production due<br />
to the aforementioned furnace repair.<br />
In <strong>2007</strong>, the principal products we manufactured were<br />
hot-rolled strip and plate (24.1%), long products (20.3%),<br />
galvanised and other metallic coated sheet (8.6%). In <strong>2007</strong><br />
our sales of long products grew by 34.6%, metalware products<br />
by 20.2%, galvanised and other metallic coated sheet by 18.3%<br />
and semi-finished products by 17.3%.<br />
Strategy<br />
Following a number of successful acquisitions made in 2006, our<br />
main strategic focus in <strong>2007</strong> was organic growth in production,<br />
both by modernising existing equipment and by building new<br />
production facilities.<br />
Our strategic goal is to increase our value through stable growth,<br />
and resilience to the cyclical nature of the metallurgic market.<br />
The principal elements of the strategy:<br />
– Retain our position as one of the top global steel companies<br />
by profit<br />
– Pursue organic growth coupled with a disciplined approach<br />
to M&A<br />
– Increase international diversification and vertical integration<br />
– Focus on high-value-added and niche steel products<br />
– Build a strong global platform for profitable growth.<br />
32 <strong>Severstal</strong> <strong>Annual</strong> <strong>Report</strong> <strong>2007</strong>
<strong>Severstal</strong> revenue by segments,* <strong>2007</strong><br />
<strong>Severstal</strong> EBITDA by segments,* <strong>2007</strong><br />
Russian Steel 46.4%<br />
Lucchini 21.9%<br />
Mining 12.8%<br />
North America 9.8%<br />
Metalware 5.9%<br />
IPM 3.2%<br />
Russian Steel 68.3%<br />
Mining 13.5%<br />
Lucchini 11.2%<br />
IPM 4.0%<br />
Metalware 2.4%<br />
North America 0.6%<br />
*Excludes intersegment adjustments of US$1,932 million decrease in revenue.<br />
*Excludes intersegment adjustments of US$26 million decrease in EBITDA.<br />
To achieve these goals we plan to:<br />
– Strengthen the vertically integrated business model to secure<br />
our supply of raw materials, by modernising our mining<br />
equipment and collecting more scrap metal.<br />
– Increase our manufacturing of high value added and niche<br />
products such as:<br />
– sheet with metallic and polymer coating for the construction<br />
and automotive industries<br />
– high-quality long products and customised products for the<br />
construction industry<br />
– large-diameter pipes for infrastructure projects and the<br />
construction of oil and gas pipelines.<br />
– Control expenditure and preserve competitive advantages<br />
in profitability.<br />
Capital investments<br />
In <strong>2007</strong>, we invested US$1.625 billion, 29.8% more than in the<br />
previous year, mainly in Russian Steel, Mining and <strong>Severstal</strong> North<br />
America equipment modernisation programmes. You will find<br />
more detailed information in the description of each business.<br />
In <strong>2007</strong>–2011, we will invest approximately US$10 billion, both in<br />
modernising existing assets and in constructing new mini-mills to<br />
manufacture long products for the construction industry.<br />
<strong>Severstal</strong> capital investments (US$ million)<br />
<strong>2007</strong> 2006 Change<br />
year-onyear<br />
%<br />
Mining 394 351 12.3<br />
Russian Steel 495 554 (10.7)<br />
North America 483 83 481.9<br />
Lucchini 199 127 56.7<br />
Metalware 30 10 200.0<br />
IPM 23 127 (81.9)<br />
Total capex 1,625 1,252 29.8<br />
<strong>Severstal</strong> capex by segments, <strong>2007</strong><br />
Russian Steel 30.5%<br />
North America 29.7%<br />
Mining 24.3%<br />
Lucchini 12.3%<br />
Metalware 1.8%<br />
IPM 1.4%<br />
Implementing new technologies in SeverCorr (USA)<br />
SeverCorr is a unique combination of mini-mill steelmaking<br />
technology and integrated finishing process. It produces highquality<br />
steel by melting scrap in an electric arc furnace, feeding<br />
a thin-slab caster coupled with a high-powered hot strip mill.<br />
Steel is further processed in a highly sophisticated cold-rolling<br />
mill and galvanising line. Flexible production system allows us<br />
to quickly react to changes in consumer tastes and seasonal<br />
market demands.<br />
Our experience at SeverCorr will help us implement similar<br />
technology at low cost across our operations. We plan to build the<br />
mini-mill unit at Cherepovets Steel Mill and thin slab caster unit at<br />
Lucchini Piombino, and will build two new mini-mills in Russia.<br />
Developing promising steel grades<br />
To gain competitive advantages in plate production for pipe<br />
production, we have started to develop new grades of steel that<br />
will meet the highest demands of international strip consumers.<br />
The development programme includes scientific research to<br />
improve existing strip production steel and analysing the needs of<br />
clients in the oil and gas sector. To implement the programme, we<br />
have established the Competence Centre for Plate, where activities<br />
include research, intellectual property, and co-ordination of work<br />
with experts, customers and research institutes.<br />
<strong>Severstal</strong> <strong>Annual</strong> <strong>Report</strong> <strong>2007</strong> 33
Business review<br />
<strong>Severstal</strong> sales by products<br />
US$ million<br />
<strong>2007</strong> 2006 Change Share in <strong>2007</strong><br />
year-on-year % %<br />
Hot-rolled strip and plate 3,682 3,436 7.2 24.1<br />
Long products 3,098 2,302 34.6 20.3<br />
Galvanised and other metallic coated sheet 1,307 1,106 18.2 8.6<br />
Cold-rolled sheet 1,259 1,328 (5.2) 8.3<br />
Semi-finished products 1,102 939 17.4 7.2<br />
Metalware products 1,002 834 20.2 6.6<br />
Shipping and handling costs billed to customers 644 537 19.9 4.2<br />
Large diameter pipes 531 – n.a. 3.5<br />
Others tubes and pipes, formed shapes 392 320 22.5 2.6<br />
Rails, wheels and axles 322 375 (14.1) 2.1<br />
Pellets and iron ore 305 243 25.5 2.0<br />
Scrap 302 27 1018.5 2.0<br />
Colour coated sheet 281 149 88.6 1.8<br />
Coal and coking coal concentrate 265 249 6.4 1.7<br />
Others 753 604 24.7 5.0<br />
Total 15,245 12,449 22.5 100.0<br />
Manufacturing high-quality, more durable rails<br />
The aim is to satisfy potential demand from Russian Railways,<br />
which announced large-scale plans for building new high-speed<br />
railroads and renovating existing routes. To satisfy this new market<br />
niche, we plan to deliver high-quality rails made at the Lucchini<br />
Piombino plant to Russia.<br />
Transferring know-how from <strong>Severstal</strong> North America<br />
to Russian Steel<br />
The construction of western car-makers’ assembly plants in<br />
Russia opens up new markets for sales of automobile body sheet.<br />
To satisfy these markets, Russian producers need to improve<br />
their quality significantly and bring it in line with international<br />
standards. We are working on improving our system of quality<br />
control and transferring the appropriate methodology and knowhow<br />
from <strong>Severstal</strong> North America to Russian Steel to help it meet<br />
these standards.<br />
Creating a corporate system of quality management<br />
Strong competition in the markets dictates a need for reducing<br />
product costs at the same time as improving their quality, and<br />
creating a common philosophy and system of quality management<br />
across our businesses. To create a corporate system of quality control,<br />
we analysed our current methods, before developing a unified<br />
system of quality management, which we are now implementing.<br />
Decreasing environmental damage<br />
In line with our drive to limit environmental damage, we formed a<br />
new subdivision – Administration – for labour protection, industrial<br />
safety and environmental protection which has already started<br />
working with our businesses and with international professional<br />
organisations. We have also introduced a system for monitoring<br />
industrial safety figures at all of our businesses, in accordance with<br />
international standards.<br />
Cost-saving programmes<br />
One of our strategic priorities is to maintain profit leadership in<br />
the steel industry, which is why all of our businesses constantly<br />
work on systematic cost saving and efficiency improvements.<br />
Management continually monitors costs and efficiency and<br />
has formed a group which aims to find further ways of rapidly<br />
reducing costs.<br />
Implementing our projects to a high standard, quickly and<br />
cost-effectively is very important, and transferring findings from<br />
one area of operations to another can significantly reduce costs.<br />
We have reduced our energy consumption by detailed analysis<br />
of energy use and product cost. In particular, the Cherepovets<br />
Steel Mill is already using secondary emission gas, which will help<br />
reduce the amount of energy we buy, increasing the plant’s<br />
independence from external energy suppliers.<br />
New technologies in the blast-furnace process allow a reduction<br />
in the consumption of coke and natural gas. In particular, we<br />
developed a programme for stage-by-stage transferring of blast<br />
furnaces to pulverised coal injection (PCI) technology, which has<br />
been already used at Lucchini. We will implement PCI at <strong>Severstal</strong><br />
North America in 2008 and Cherepovets Steel Mill (Russian Steel)<br />
in 2009–2011.<br />
34 <strong>Severstal</strong> <strong>Annual</strong> <strong>Report</strong> <strong>2007</strong>
Mining<br />
<strong>Severstal</strong>’s Mining segment is one of Russia’s three largest<br />
producers of iron ore concentrate (with a market share<br />
of 9.1%), pellets (30%) and coking coal (14.7%).<br />
In <strong>2007</strong>, after diversifying into other metals and minerals,<br />
we moved into the promising areas of gold production and scrap<br />
metal collection. By acquiring various assets, as outlined below,<br />
<strong>Severstal</strong> has become Russia’s fourth largest gold producer and<br />
the leading scrap metal collection company in the north-western<br />
region of Russia.<br />
In <strong>2007</strong>, we extracted 1.847 million tonnes of coking coal, and<br />
also produced 5.789 million tonnes of coking coal concentrate,<br />
4.651 million tonnes of iron ore concentrate, and 10.045 million<br />
tonnes of pellets. Revenues from our Mining business amounted<br />
to US$2,197 million in <strong>2007</strong>, while EBITDA was US$501 million.<br />
Structure<br />
Our Mining businesses are grouped around four main areas:<br />
– Iron ore<br />
– Coal extraction<br />
– Gold production<br />
– Scrap collection and processing.<br />
Iron ore<br />
Karelsky Okatysh extracts iron ore and produces pellets. Located in<br />
Kostomuksha, a town in the Republic of Karelia, in the north-west<br />
of Russia, the business operates four major deposits that have an<br />
estimated life of 33 years based on the segment’s estimates of<br />
JORC reserves plus expected reserves extension.<br />
Olkon also extracts iron ore and produces iron ore concentrate.<br />
Located in Olenegorsk, in the Murmansk region in north-west Russia,<br />
the deposit has an estimated life of 23 years based on the segment’s<br />
estimates of JORC reserves plus expected reserves extension.<br />
Coal extraction<br />
Vorkutaugol is Russia’s largest producer of coking coal, and<br />
comprises five mines (Vorkutinskaya, Severnaya, Zapolyarnaya,<br />
Komsomolskaya and Vorgashorskaya), the Yunyaginsky quarry<br />
and various beneficiation plants. Vorkutaugol extracts both coking<br />
and steam coal. Located in Russia’s European North, in the city of<br />
Vorkuta in the Komi Republic, with an estimated life of 38 years<br />
based on the segment’s estimates of JORC reserves plus expected<br />
reserves extension, and one open pit located within the<br />
Vorkutinskoye deposit.<br />
Kuzbassugol operated two mines, Berezovskaya and<br />
Pervomayskaya, located in the northern part of the Kuzbass coal<br />
basin (in the Kemerovo region), as well as a modern beneficiation<br />
plant, in the Berezovskaya mine complex. The mines specialise in<br />
extracting semi-solid concentrate and raw coking coal with an<br />
estimated life of 34 years. Based on the 2006 JORC evaluation,<br />
Kuzbassugol has reserves of 276 million tonnes. In April 2008,<br />
we sold the business to ArcelorMittal for US$652 million.<br />
The principal reason for selling Kuzbassugol was that it was<br />
no longer a strategic asset (its revenues amounted to less than<br />
9.7% of our total Mining revenue) and, after the acquisition of<br />
Vorkutaugol, it was less crucial to the operations of the Cherepovets<br />
Steel Mill. In addition, the temporary deficit of coking coal on the<br />
Russian and global markets enabled us to sell the company at a<br />
good price. We will spend the proceeds on developing Vorkutaugol<br />
and our other mining businesses.<br />
Gold production<br />
We also own a number of companies that extract and refine gold<br />
ore, and also develop new gold ore fields:<br />
– Nerungri-Metallic (the Tabornoye field) is located in the Republic<br />
of Sakha-Yakutia. Its balanced gold reserves in the C1+C2<br />
category amount to approximately 15 tonnes, while its P1+P2<br />
resources exceed 70 tonnes<br />
– Aprelkovo Mine (the Pogromnoye field) is located in the Chita<br />
region. The field’s reserves in the C1+C2 category are estimated<br />
at 25 tonnes. We extract the gold ore at both fields using an<br />
open-quarry method and the gold using a heap leaching<br />
method. In <strong>2007</strong>, production at the two mines amounted to<br />
approximately 2.4 tonnes (about 75,000 ounces)<br />
– Celtic Resources Holdings (the Suzdal and Zherek fields) is based<br />
in Kazakhstan. The company’s gold resources, evaluated by<br />
JORC, amount to approximately 60 tonnes. In <strong>2007</strong>, it produced<br />
about 2.9 tonnes (about 95,000 ounces)<br />
– Severnaya Zolotorudnaya Kompaniya (the Northern Gold-ore<br />
company) acquires and develops gold fields. In the second half<br />
of <strong>2007</strong>, the company won the rights to geological exploration<br />
and subsequent gold production at:<br />
– the Uryakhskoye gold ore field, located in the Irkutsk region<br />
(which has P2+P3 category resources of 100 tonnes)<br />
– Sagan-Golsky (which has P1+P2 category resources estimated<br />
at 60 tonnes), and<br />
– the Vitimkansky plots (which have estimated resources of<br />
15 tonnes) in the Republic of Buryatia.<br />
Scrap collection<br />
This year, we acquired the following businesses, which carry out<br />
the collection, refining, stocking and sales of scrap metal:<br />
– Vtorchermet and Rospromresursy, in St. Petersburg<br />
– Arkhangelsky Vtormet, in Archangelsk (north Russia)<br />
– Vtorchermet SPb-Rostov, in Rostov-na-Donu (south Russia) and<br />
– Vtormet SPb, in Tula (central Russia).<br />
<strong>Severstal</strong> <strong>Annual</strong> <strong>Report</strong> <strong>2007</strong> 35
Business review<br />
Key performance indicators<br />
<strong>2007</strong> 2006 Change<br />
year-on-year %<br />
Revenue (US$ million) 2,197 1,491 47.4<br />
Gross profit (US$ million) 699 525 33.1<br />
Profit from operations (US$ million) 282 238 18.5<br />
Operating margin (%) 12.8 16.0<br />
EBITDA (US$ million) 501 442 13.3<br />
EBITDA per tonne (US$/tonne) 20 18 11.1<br />
EBITDA margin (%) 22.8 29.6<br />
Average product prices (FCA) (US$/tonne)<br />
Coal 60 53 13.2<br />
Iron ore concentrate 59 52 13.5<br />
Pellets 75 61 23.0<br />
EBITDA margin (%)<br />
Coal 8 20<br />
Iron ore concentrate 41 44<br />
Pellets 40 35<br />
Scrap metal 1 –<br />
Changes in the structure of our Mining businesses<br />
During <strong>2007</strong>, the principal changes were as follows:<br />
1. A number of our subsidiaries, which were holding companies<br />
for our investments into the Mining entities, merged with OOO<br />
Holding Gornaya Company, owned by <strong>Severstal</strong>. OOO Holding<br />
Gornaya Company became the principal holding company in<br />
the Mining segment. This merger has significantly simplified the<br />
structure of our Mining businesses.<br />
2. We incorporated various gold-producing companies into our<br />
business. Acquiring these new assets has been an important<br />
step, allowing us to create additional value for our shareholders<br />
through diversification.<br />
3. We consolidated and incorporated numerous scrap collection<br />
businesses. In 2008, the decision to move scrap operators to the<br />
<strong>Severstal</strong> Russian Steel division was taken.<br />
4. We sold off our non-core assets.<br />
Strategy<br />
As the principal supplier of raw materials for the <strong>Severstal</strong> Russian<br />
Steel division, the Mining segment forms the foundation of our<br />
vertically integrated business model. The key strategic priorities are:<br />
– Improving the quality of industrial safety, labour and<br />
environmental protection<br />
– Further strengthening its position in the coal and iron ore markets.<br />
In addition, the Mining segment is making good use of its mining<br />
expertise by diversifying its ferrous metals production business and<br />
expanding its presence in the non-ferrous metals market, gold in<br />
particular.<br />
Our aim is to ensure the sustainable development of our<br />
existing mining assets and to enable growth into new minerals<br />
and geographies.<br />
Key performance indicators<br />
In <strong>2007</strong>, revenue from our Mining businesses increased by 47.4%,<br />
to US$2.197 billion. This was primarily due to higher raw material<br />
prices and us acquiring the scrap collection and processing<br />
businesses. EBITDA was US$501 million, 13.3% higher than the<br />
previous year.<br />
The lower EBITDA margin (which fell from 29.6% in 2006<br />
to 22.8% in <strong>2007</strong>) was a result of lower production volumes<br />
and higher costs following the accident at the Komsomolskaya<br />
Mine (Vorkutaugol), as well as deteriorating mining-geological<br />
conditions (methane outbursts) and higher salaries. To improve<br />
our financial position, we will be carrying out a programme of<br />
investments in Vorkutaugol aimed at productivity improvements<br />
and reductions in personnel numbers. Another factor affecting the<br />
segment’s profitability was consolidating the financial results of<br />
the low-profit scrap collection and processing businesses (their<br />
share in total revenues in <strong>2007</strong> was 16%, but in EBITDA terms<br />
only 1%).<br />
At the end of <strong>2007</strong>, we employed 27,955 people across our<br />
Mining businesses, 2,739 people fewer than at the end of 2006.<br />
Production results<br />
<strong>2007</strong> 2006 Change<br />
year-on-<br />
Production volumes, thousand tonnes year %<br />
Coking coal 1,847 2,034 (9.2)<br />
Coking coal concentrate 5,789 5,636 2.7<br />
Steam coal 1,827 1,992 (8.3)<br />
Iron ore concentrate 4,651 4,474 4.0<br />
Pellets 10,045 9,444 6.4<br />
Scrap metal* 822 – n.a.<br />
*Only processed and assorted scrap.<br />
The 9.2% decrease in coking coal production was due to the<br />
accident at the Komsomolskaya Mine (OAO Vorkutaugol), which<br />
resulted in less coal extraction. Despite this, coking coal concentrate<br />
production increased by 2.7%.<br />
The 6.4% growth in pellet production was due to development<br />
of the Korpangskoye field (Karelsky Okatysh), as well as higher<br />
productivity<br />
The 4.0% growth in production of iron ore concentrate at Olkon<br />
was a result of more productive excavation, drilling and blasting.<br />
36 <strong>Severstal</strong> <strong>Annual</strong> <strong>Report</strong> <strong>2007</strong>
Mining segment, sales by products, FCA based with discounts/price premium<br />
<strong>2007</strong> 2006 Change year-on-year %<br />
Thousand US$ Thousand US$ Thousand US$<br />
tonnes million tonnes million tonnes million<br />
Coking coal 2,167 69.9 1,166 46.5 85.8 50.3<br />
Coking coal concentrate 5,795 486.6 5,377 390.5 7.8 24.6<br />
Steam coal 2,328 60.3 3,510 97.5 (33.7) (38.2)<br />
Pellets 9,927 745.8 9,482 578.6 4.7 28.9<br />
Iron ore concentrate 4,562 267.7 4,471 231.7 2.0 15.5<br />
Scrap metal – 301.5 – 26.5 n.a. 1,037.7<br />
Total products – 1,931.8 – 1,371.3 n.a. 40.9<br />
Shipping and Other – 265.1 – 119.7 n.a. 121.5<br />
Total sales by products – 2,196.9 – 1,491.0 n.a. 47.3<br />
Inter-segment<br />
transactions (15,363.0) (1,142.7) (15,081.0) (853.0) n.a. n.a.<br />
Total amount is rounded.<br />
Sales and marketing<br />
The Russian raw material market<br />
The coal businesses in our Mining segment are among Russia’s<br />
top three coking coal producers.<br />
Our iron ore businesses, which produce iron ore concentrate<br />
and pellets, are leaders in terms of extraction volumes in their<br />
respective markets. Our share of the overall Russian iron ore<br />
concentrate production remained unchanged in <strong>2007</strong> at 9.1%.<br />
Our share of Russian pellet production increased from 28.2% to<br />
30.0%, due to less production at other Russian iron ore mines.<br />
Our share of scrap metal deliveries increased to 4.8% after we<br />
acquired our scrap collection and processing businesses. The market<br />
is characterised by the growth of key players and the consolidation<br />
of scrap iron collection businesses by steel producers.<br />
We can guarantee our stable market position since we have<br />
the following competitive advantages:<br />
– We are the only mining business in Russia capable of offering<br />
the whole range of principal iron sources: iron ore pellets, iron ore<br />
concentrate, coking coal and scrap. In 2008, we also plan to start<br />
selling ferroniobium<br />
– We have a quality resource base in Russia, allowing us to<br />
produce valuable grades of coal and high-quality iron ore<br />
products<br />
– We offer a high level of client service, including flexible price<br />
policies<br />
– We have an advantageous geographic location near to our<br />
principal consumers, as well as optimal logistics and developed<br />
infrastructure near our main assets<br />
– Our Mining businesses are part of our vertically-integrated<br />
metallurgic holding, which means we have greater access to<br />
financial, intellectual and professional resources.<br />
Sales by products<br />
High-value-added products accounted for the largest part of our<br />
sales in <strong>2007</strong>: pellets accounted for 33.9% of total sales, coking<br />
coal concentrate 22.1%, and iron ore concentrate 12.2%. Scrap<br />
sales amounted to 13.7% of total revenue, showing the high<br />
growth potential for this type of product. Coking and steam coal<br />
accounted for 3.2% and 2.7% of revenue respectively.<br />
The positive market environment in <strong>2007</strong> resulted in the<br />
increase in sales compared to the previous year, both in revenue<br />
and volume terms, for all our Mining products, except steam coal:<br />
– Coking coal sales increased by 85.8% in volume and 50.3%<br />
in revenue from 2006 to <strong>2007</strong><br />
– Coal concentrate sales increased by 7.8% in volume and 24.6%<br />
in revenue, validating our strategy of concentrating on<br />
producing high-value-added products<br />
– Sales of steam coal decreased from 2006 to <strong>2007</strong>, by 33.7%<br />
in volume and 38.2% in revenue, due to lower coal production<br />
– Pellet sales increased by 4.7% in volume and 28.9% in revenue<br />
– Iron ore concentrate sales increased by 2.0% in volume and<br />
15.5% in revenue<br />
– Scrap metal revenue grew more than 10-fold, after we acquired<br />
a number of companies, including ZAO Vtorchermet, which<br />
specialises in the scrap collection and exports.<br />
<strong>Severstal</strong> <strong>Annual</strong> <strong>Report</strong> <strong>2007</strong> 37
Business review<br />
Mining segment, domestic sales, FCA based with discounts/price premium<br />
<strong>2007</strong> 2006 Change year-on-year %<br />
Thousand US$ Thousand US$ Thousand US$<br />
tonnes million tonnes million tonnes million<br />
Coking coal 2,086 66.8 1,126 44.5 85.3 50.1<br />
Coking coal concentrate 4,981 424.1 4,889 344.8 1.9 23.0<br />
Steam coal 1,727 45.3 3,081 80.5 (43.9) (43.7)<br />
Pellets 7,740 621.1 6,197 367.6 24.9 69.0<br />
Iron ore concentrate 4,562 267.7 4,471 231.7 2.0 15.5<br />
Scrap metal – 51.5 – 8.9 n.a. 478.7<br />
Total products – 1,476.5 – 1,078.0 n.a. 37.0<br />
Shipping and Other – 165.6 – 103.4 n.a. 60.2<br />
Total domestic sales – 1,642.1 – 1,181.4 n.a. 39.0<br />
Inter-segment transactions – (1,089.5) – (760.9) n.a. n.a.<br />
Principal markets<br />
Russian market<br />
Russia is the principal market for our Mining businesses. Our main<br />
customer is <strong>Severstal</strong>’s Russian Steel division.<br />
The share of sales in the domestic market in <strong>2007</strong> was 74.7%<br />
in revenue. The largest portion of revenues in the domestic market<br />
came from sales of pellets (37.8%), coking coal concentrate<br />
(25.8%) and iron ore concentrate (16.3%).<br />
In <strong>2007</strong>, our domestic pellet sales increased by 24.9% in<br />
volume and 69.0% in revenue compared to 2006, after we<br />
delivered this product to a number of external customers, and also<br />
exported less because of higher domestic pellet prices (+US$23<br />
per tonne over export price).<br />
Export<br />
Export accounted for 25.3% of our total sales by revenue in <strong>2007</strong>.<br />
The principal types of export products were scrap metal (45%<br />
of the total export revenue), pellets (22.5%) and coking coal<br />
concentrate (11.3%). The share of other products was negligible.<br />
The main destinations for these products were in Europe<br />
(Netherlands, Italy and Finland) and the CIS (Ukraine and Belarus).<br />
Exports of coking coal concentrate increased by 66.8% in<br />
volume and 36.8% in revenue. This was due to increased sales to<br />
Ukraine. A substantial share of scrap metal deliveries was directed<br />
to Belarus.<br />
Capital expenditure<br />
We invested a total of US$394 million in our Mining business in<br />
<strong>2007</strong>, 12.3% more than in 2006. Of this, we spent US$293 million<br />
on maintaining and modernising our production equipment, and<br />
US$101 million on new projects. We also spent US$135 million<br />
on modernising and developing the Vorkutaugol mines and<br />
US$80 million on new equipment at Karelsky Okatysh.<br />
As part of our development strategy, we made the following<br />
investments in <strong>2007</strong>.<br />
Investment in coal-producing projects: US$194 million in <strong>2007</strong><br />
– We restructured Vorkutaugol’s mining complex to reduce the<br />
cost of extracting coal and increase our production capacity and<br />
mine productivity<br />
– We overcame difficult geological conditions and the rational use<br />
of the existing coal resource base, and improved the security of<br />
our operations (ventilation and excess methane)<br />
– We added new equipment and modernised production facilities<br />
used to develop new coal fields.<br />
Investment in projects to increase our extraction and refining<br />
of iron ore: US$168 million in <strong>2007</strong><br />
– We built facilities to develop new ore sections and increase ore<br />
extraction, including developing the Korpangsky field project.<br />
This will help us increase our run of mine ore extraction<br />
capacities at Karelsky Okatysh by 10 million tonnes a year<br />
– We used new mining technologies to build the Olenegorsky<br />
underground mine. This will support the resource base at Olkon<br />
and guarantee stable annual production volumes of iron ore<br />
concentrate<br />
– We developed new refining technologies to increase productivity<br />
at our ore-dressing plant<br />
– We added new equipment and modernised production facilities<br />
used to refine and clean ore.<br />
Investment in environmental protection measures<br />
– We spent money on new technologies to reduce harmful<br />
emissions and improve environmental conditions.<br />
38 <strong>Severstal</strong> <strong>Annual</strong> <strong>Report</strong> <strong>2007</strong>
Mining segment, export sales, FCA based with discounts/price premium<br />
<strong>2007</strong> 2006 Change year-on-year %<br />
Thousand US$ Thousand US$ Thousand US$<br />
tonnes million tonnes million tonnes million<br />
Coking coal 81 3.1 40 2.0 102.5 55.0<br />
Coking coal concentrate 814 62.5 488 45.7 66.8 36.8<br />
Steam coal 601 15.0 429 17.0 40.1 (11.8)<br />
Pellets 2,187 124.7 3,285 211.0 (33.4) (40.9)<br />
Iron ore concentrate – – – – n.a. n.a.<br />
Scrap metal – 250.0 – 17.6 n.a. 1,320.5<br />
Total products – 455.3 – 293.3 n.a. 55.2<br />
Shipping and other – 99.5 – 16.3 n.a. 506.7<br />
Total export sales – 554.8 – 309.6 n.a. 79.2<br />
Inter-segment transactions – (53.2) – (92.1) n.a. n.a.<br />
Main coal production projects<br />
Development of the Vorkutaugol mine<br />
In this project, we are linking the four existing mines<br />
(Komsomolskaya, Severnaya, Vorkutinskaya, Zapolyarnaya)<br />
with a single trunk conveyer line, and providing the necessary<br />
infrastructure, both above and below ground, so we can increase<br />
lift productivity. We have currently suspended work on this project<br />
while we review and improve the safety measures. The aim of the<br />
project, ultimately, is to reduce our fixed costs.<br />
Development of the Vorgashorskaya mine<br />
With this project, we are aiming to increase extraction at the mine,<br />
to 4.0 million tonnes of steam coal a year (run of mine).<br />
Main projects for extracting and refining iron ore<br />
Development of the Korpangsky field<br />
The aim of this project is to open up new sections of the field. We<br />
plan to extract 83 million tonnes of ore. Of this, 40 million tonnes<br />
will come from the Severny-2 section and 43 million tonnes from<br />
the Zapadny section. We will have finished the project by 2013.<br />
Construction of the Olenegorsky underground mine<br />
The aim of this project is to support Olkon’s resource base so<br />
we can guarantee production of 5 million tonnes of iron ore<br />
concentrate a year. We started the project in 2003 and began<br />
extracting in 2004. We plan to reach our target capacity by 2009,<br />
and to have developed our reserves by 2024.<br />
Increasing the production capacity of the Karelsky Okatysh<br />
ore-dressing plant<br />
This project will increase the plant’s annual production of<br />
processed ore to 33 million tonnes. Production volumes of iron ore<br />
concentrate will amount to 11.7 million tonnes. We will improve<br />
productivity by modernising our equipment. The project began<br />
in 2006 and is due to be completed in 2009.<br />
Projects for 2008<br />
Geological exploration at the Tabornoye gold field<br />
We will be evaluating the possibility of expanding gold production<br />
and developing explored gold reserves. The project is estimated<br />
to cost US$74.8 million.<br />
Optimising the decontamination and methane utilisation<br />
system at Vorkutaugol<br />
We will be working with Steag Saar Energie to build vacuumpumping<br />
stations that will pump methane away from the mines<br />
and convert it into electricity. The project is estimated to cost<br />
US$156.8 million.<br />
Organising the process for flotation upgrading of metal<br />
content at Karelsky Okatysh<br />
We will be aiming to reduce alloy content and increase iron content.<br />
The project is estimated to cost US$24.7 million.<br />
<strong>Severstal</strong> <strong>Annual</strong> <strong>Report</strong> <strong>2007</strong> 39
Business review<br />
Key investment projects<br />
US$ million<br />
Total Spent to Capex Spent to Spent after<br />
capex 31.12.<strong>2007</strong> <strong>2007</strong> 31.12.2006 01.01.2008<br />
Coal production<br />
Development of the Vorkutaugol mine 36 36 12 24 –<br />
Equipment for the long wall of the<br />
Vorgashorskaya mine 10 10 10 – –<br />
Other investments in Vorkutaugol 34 34 34<br />
Total investments in coal production 80 80 56 24 –<br />
Production and refining of iron ore concentrate<br />
Development of the Korpangsky field,<br />
Karelsky Okatysh 133 91 31 60 42<br />
Construction of the Olenegorsky underground<br />
mine for 2.5 million tonnes of ore, Olkon 47 32 6 26 15<br />
Increasing production capacity of the<br />
ore-dressing plant, Karelsky Okatysh 53 24 15 9 29<br />
Other investments in Karelsky Okatysh 26 24 24 – 2<br />
Total investments in production and<br />
refining of iron ore concentrate 259 171 76 95 88<br />
Other investments 1,029 516 262 254 513<br />
Total investments 1,368 767 394 373 601<br />
Costs<br />
<strong>2007</strong> 2006<br />
US$ % of US$ % of<br />
Cost of sales structure million Total million Total<br />
Materials<br />
Scrap metal 298.9 20.0 – 0.0<br />
Technological coals 20.8 1.4 19.0 2.0<br />
Explosives 32.0 2.1 25.9 2.7<br />
Grinding balls & rods 28.6 1.9 20.7 2.1<br />
Other materials 144.7 9.7 136.6 14.1<br />
Total materials 524.9 35.1 202.2 20.9<br />
Energy<br />
Electric power 125.9 8.4 107.8 11.2<br />
Other energy resources 88.8 5.9 90.0 9.3<br />
Total energy 214.7 14.3 197.8 20.5<br />
Staff costs 328.3 21.9 248.6 25.7<br />
Depreciation and<br />
amortisation 201.0 13.4 190.5 19.7<br />
Services 187.6 12.5 106.5 11.0<br />
Other 41.0 2.8 20.2 2.2<br />
Total 1,497.5 100.0 965.8 100.0<br />
Costs in our Mining businesses increased in <strong>2007</strong> by<br />
US$531.7 million, or 55.1%. This was due to a 159.6% increase<br />
in the cost of raw materials, a 32% increase in labour costs and a<br />
76.2% increase in the cost of third-party services. We spent more<br />
on materials after consolidating our scrap metal collection and<br />
processing businesses, which led to us buying more scrap metal.<br />
Costs also rose due to the price of various materials going up:<br />
the price of explosives went up by 13%, grinding balls and rods<br />
by 22%, electricity by 10%, fuel by 13.5% on average, and metal<br />
products by 16%. The growth of services costs in <strong>2007</strong> by<br />
US$81.1 million was caused mainly by outsourcing the mine<br />
transportation, equipment maintenance and other services,<br />
mostly in Karelsky Okatysh.<br />
We carried out the following cost-cutting initiatives:<br />
– We replaced equipment (to reduce our consumption of fuel oil<br />
and grinding balls); and used new types of explosives<br />
– We acquired materials and equipment from a single source<br />
– We outsourced some of our primary and secondary processes<br />
– We introduced modular software to control the work of our mine<br />
engineering equipment.<br />
40 <strong>Severstal</strong> <strong>Annual</strong> <strong>Report</strong> <strong>2007</strong>
Russian Steel<br />
Crude steel production in Russia, <strong>2007</strong><br />
Metal products production in Russia, <strong>2007</strong><br />
Evraz 19.4%<br />
MMK 18.3%<br />
<strong>Severstal</strong> 16.4%<br />
NLMK 12.5%<br />
Metallinvest 9.0%<br />
Mechel 7.7%<br />
Other 16.7%<br />
MMK 20.6%<br />
Evraz 20.1%<br />
<strong>Severstal</strong> 17.9%<br />
NLMK 14.5%<br />
Metallinvest 9.0%<br />
Mechel 7.5%<br />
ESTAR 1.7%<br />
Other 8.7%<br />
Source: Chermet.<br />
Source: Chermet.<br />
Russian Steel is <strong>Severstal</strong>’s largest segment by revenue.<br />
In <strong>2007</strong> it was the third largest steel company in Russia by<br />
volume of crude steel production (16.4%) and third in terms<br />
of rolled products (17.9%).<br />
Russian Steel benefits from a good geographical location,<br />
which gives us favourable access to the raw materials we need, to<br />
our transportation networks and our markets.<br />
We produce a wide range of products through this part of our<br />
business, including hot-rolled sheets, profiles, and cold-rolled coated<br />
sheets – encompassing special-grade sheets for the automotive<br />
industry, hot-rolled plates and long products. We mainly sell our<br />
steel products in our domestic market, serving the needs of the<br />
Russian automotive, construction, shipbuilding, engineering and<br />
other industries.<br />
We produced 11.9 million tonnes of crude steel and 10.8 million<br />
tonnes of semi-finished rolled and downstream products in <strong>2007</strong>.<br />
Revenue from our steel businesses was US$7.969 billion, an increase<br />
of 26.1% on 2006. EBITDA was US$2.53 billion, up 26.7% on the<br />
previous year.<br />
Russian Steel comprises:<br />
Cherepovets Steel Mill<br />
Located in Cherepovets, this mill specialises in steel production<br />
(with the total steelmaking capacity of 13.2 million tonnes a year).<br />
It also produces a wide assortment of flat and long-rolled<br />
products, including hot and cold-rolled flat products, galvanised<br />
and colour coated products and long-steel applications. Rolling mill<br />
5000, situated in Kolpino, produces hot-rolled plates and strips.<br />
Severgal<br />
Also located in Cherepovets, Severgal produces high-quality<br />
galvanised steel for the automotive and other industries.<br />
Trading and service companies<br />
You can read about these companies in our consolidated<br />
financial statements.<br />
Changes in the structure of our steel business<br />
We acquired Neva-Metall and Neva-MetallTrans, companies<br />
specialising in the trans-shipment of containers and other cargo, to<br />
guarantee the export of all our rolled metal products through the<br />
port of St. Petersburg. Acquiring these companies was strategically<br />
important for the security of our transportation and logistics.<br />
We established the Armeta Centras UAB (Lithuania) and<br />
<strong>Severstal</strong>-Ukraine LLC sales companies to expand our sales’<br />
geography.<br />
We also sold OOO Uralmash MO as a part of a restructuring<br />
process, in line with our policy to sell our non-core assets. We<br />
reorganised SIA Steel Invest (Latvia) as part of a merger with<br />
<strong>Severstal</strong> Lat.<br />
Strategy<br />
The principal objectives of Russian Steel are to:<br />
– Increase the output of high-margin products<br />
– Increase our share in the most profitable market segments,<br />
namely:<br />
– plate for pipes and shipbuilding industries<br />
– constructing mini-mills to manufacture rolled products for the<br />
construction industry<br />
– high-quality products for engineering.<br />
– Improve cost control and efficiency.<br />
Key performance indicators<br />
In <strong>2007</strong>, Russian Steel’s revenue grew by US$1.65 billion. This was<br />
26.1% up on the previous year due to a sales increase of 795,700<br />
tonnes (7.9%) of steel products, a growth in sales prices and a<br />
weakening dollar. Taken together, this resulted in an average price<br />
increase for steel products of US$101 per tonne. Production costs<br />
grew significantly in <strong>2007</strong> due to the rise in cost of raw materials,<br />
as well as higher average wages, but were offset by increased<br />
prices for rolled products. As a result, our <strong>2007</strong> operating margin<br />
remained at 27.2%, the same level as in 2006.<br />
<strong>2007</strong> EBITDA grew by 26.7%. EBITDA per tonne of<br />
production grew by 17.2% to a healthy US$232. Our EBITDA<br />
margin remained stable at 31.8%.<br />
<strong>Severstal</strong> <strong>Annual</strong> <strong>Report</strong> <strong>2007</strong> 41
Business review<br />
Key performance indicators<br />
<strong>2007</strong> 2006 Change<br />
year-on-year %<br />
Revenue (US$ million) 7,969.0 6,317.5 26.1<br />
Gross profit (US$ million) 3,131.7 2,512.7 24.6<br />
Profit from operations (US$ million) 2,165.1 1,720.1 25.9<br />
Operating margin (%) 27.2 27.2<br />
EBITDA (US$ million) 2,530.2 1,996.4 26.7<br />
EBITDA per tonne (US$/tonne) 232 198 17.2<br />
EBITDA margin (%) 31.8 31.6<br />
Average steel product price (US$/tonne) 662 561 18.0<br />
Semi-finished products (US$/tonne) 430 336 28.0<br />
Hot-rolled flat products (US$/tonne) 646 554 16.6<br />
Cold-rolled flat products (US$/tonne) 666 585 13.9<br />
Galvanised and other metallic coated flat products (US$/tonne) 920 833 10.4<br />
Colour coated flat products (US$/tonne) 1,230 1,038 18.5<br />
Long products (US$/tonne) 604 459 31.6<br />
Tubes and pipes, formed shapes (US$/tonne) 792 680 16.5<br />
Metalware products (US$/tonne) 812 734 10.6<br />
At the end of <strong>2007</strong>, Russian Steel employed 47,737 people<br />
(full-time equivalent), an increase of 1.5% on 2006. Despite various<br />
acquisitions, employee numbers remained stable due to a deliberate<br />
policy of downsizing. At Cherepovets Steel Mill, for example,<br />
employee numbers were cut by 2,898 people or 8.1%, making a<br />
workforce of 32,747 average people during the reporting period.<br />
Production results<br />
In <strong>2007</strong>, Russian Steel produced 8.759 million tonnes of hot metal<br />
(up 6.8% on 2006), 11.899 million tonnes of crude steel (up 5.3%<br />
on 2006) and 10.811 million tonnes of steel products (up 8%).<br />
<strong>2007</strong> 2006 Change<br />
year-on-<br />
Production volumes, thousand tonnes year %<br />
Hot metal 8,759 8,200 6.8<br />
Crude steel<br />
Basic oxygen furnaces 8,323 8,041 3.5<br />
Electric arc furnaces 2,076 1,958 6.0<br />
Open hearth furnaces 1,500 1,297 15.7<br />
Total crude steel 11,899 11,296 5.3<br />
Commodity output<br />
Semi-finished products 872 581 50.1<br />
Rolled products<br />
Hot-rolled flat products 5,004 4,628 8.1<br />
Cold-rolled flat products 1,435 1,572 (8.7)<br />
Galvanised and other metallic<br />
coated flat products 735 699 5.2<br />
Colour coated flat products 230 148 55.4<br />
Long products 2,022 1,899 6.5<br />
Total rolled products 9,426 8,946 5.4<br />
Tubes and pipes, formed shapes 470 428 9.8<br />
Metalware products 43 53 (18.9)<br />
Total output of finished goods 10,811 10,008 8.0<br />
The growth in hot metal smelting was principally due to<br />
the reopening of blast furnace No. 5 following planned repairs.<br />
Crude steel and rolled production increased due to greater<br />
efficiency and productivity of individual units. In particular, we<br />
have been able to reduce repair and other outages, improve<br />
smelting technology in EAF and improve heating technology<br />
in rolling shops.<br />
Sales and marketing<br />
The volume of Russian Steel’s shipments increased by 7.9% in<br />
<strong>2007</strong>, while sales grew by 26.1%. The main reason for the big<br />
difference between these growth rates was the price increases<br />
in almost all steel-consuming segments.<br />
Russian Steel’s sales by product<br />
In <strong>2007</strong>, sales of hot-rolled flat products accounted for 46.1% of<br />
overall sales volume (40.7% of revenue), long products for 18.8%<br />
of volume (15.5% of revenue), cold-rolled products for 13.0% of<br />
volume (11.9% of revenue), semi-finished products for 8.1% of<br />
volume (4.8% of revenue) and galvanised and other metallic<br />
coated sheet for 6.9% of volume (8.7% of revenue).<br />
Compared with 2006, hot-rolled flat products sales increased<br />
by 7.8% in volume (25.6% in revenue), long products by 6.7% in<br />
volume (40.4% in revenue), semi-finished products by 52.7% in<br />
volume (95.2% in revenue), galvanised and other metallic coated<br />
sheet by 8.2% in volume (19.5% in revenue), and colour coated<br />
sheet by 59.4% in volume (89.3% in revenue).<br />
The major increases in sales were in long products, galvanised<br />
and other metallic coated sheet and colour coated sheet. This was<br />
a result of higher demand for these products from the construction<br />
industry. A growth in export demand for semi-finished products<br />
also contributed to this gain. At the same time, the revenue growth<br />
significantly exceeded shipment growth by volume due to the<br />
global price increases.<br />
Sales of cold-rolled products decreased in volume by 9.7%,<br />
while revenue was up 2.9%. This was largely the result of reduced<br />
demand from the Russian automotive industry.<br />
42 <strong>Severstal</strong> <strong>Annual</strong> <strong>Report</strong> <strong>2007</strong>
Sales by products<br />
<strong>2007</strong> 2006 Change year-on-year %<br />
Thousand US$ Thousand US$ Thousand US$<br />
tonnes million tonnes million tonnes million<br />
Semi-finished products 881 378.8 577 194.1 52.7 95.2<br />
Hot-rolled flat products 5,020 3,242.9 4,658 2,582.6 7.8 25.6<br />
Cold-rolled flat products 1,418 944.7 1,570 917.8 (9.7) 2.9<br />
Galvanised and other<br />
metallic coated sheet 751 690.7 694 577.8 8.2 19.5<br />
Colour coated flat products 228 281.1 143 148.5 59.4 89.3<br />
Long products 2,051 1,237.9 1,922 881.9 6.7 40.4<br />
Others tubes and pipes,<br />
formed shapes 494 391.7 471 320.4 4.9 22.3<br />
Metalware products 47 37.4 59 42.6 (20.3) (12.2)<br />
Total steel products 10,890 7,205.2 10,094 5,665.7 7.9 27.2<br />
Other and shipping 763.8 651.8 17.2<br />
Total sales by products 10,890 7,969.0 10,094 6,317.5 7.9 26.1<br />
Inter-segment transactions (880) (647.9) (848) (392.7) n.a. n.a.<br />
Principal markets<br />
Russian market<br />
The Russian market is the most important one for Russian Steel.<br />
The share of the Russian market amounted to 71.4% of Russian<br />
Steel revenues, compared to 69.1% in 2006. Besides low logistics<br />
costs, the Russian market has one of the highest growth rates in<br />
the world and allows for long-term relationships with customers.<br />
In <strong>2007</strong>, sales of rolled products to the Russian market rose<br />
by 11.3% in volume terms, while rolled products revenues grew<br />
by 31.4%. Hot-rolled products accounted for 40.4% of sales,<br />
while long products accounted for 20.4%, cold-rolled products for<br />
10.7%, galvanised sheet and colour coated sheet for 13.5%.<br />
Russian Steel’s main domestic customers include pipe mills<br />
and the automotive, machinery, construction and shipbuilding<br />
companies.<br />
We sold 21.7% more hot-rolled sheet in <strong>2007</strong> by volume<br />
and 39.6% by revenue compared with 2006. For long products,<br />
a 7.2% increase in shipments by volume in <strong>2007</strong> and increase in<br />
average price by 34.0% led to a 43.7% growth in revenues.<br />
Revenues from colour coated sheet increased by 78.9%, whereas<br />
sales volumes were 52.3% higher than in 2006. This strong<br />
growth was fuelled by booming demand for plate from pipe<br />
makers and machinery, and long products for the construction<br />
industry, resulting in higher average prices.<br />
Shipment volumes of galvanised sheet fell by 8.4%, but this<br />
had almost no negative impact on revenue due to higher prices.<br />
Drop in volumes was due to the substantial growth in production<br />
of polymer coated steel, where galvanised sheet is used as<br />
a substrate.<br />
Export markets<br />
Export sales volumes remained virtually unchanged (up 1%), while<br />
rolled products revenues grew significantly (by 17.7% in <strong>2007</strong><br />
from 2006 due to the increase in prices for rolled steel products).<br />
The main contributors to export revenues were hot-rolled products<br />
(41.2%), semi-finished products (15.8%), cold-rolled products<br />
(14.8%) and galvanised sheet (7.4%).<br />
In <strong>2007</strong>, we enjoyed strong prices for galvanised sheet in global<br />
markets. With sales volumes growing by 124.1%, this led to an<br />
increase in revenue for this product by 158.9% compared to 2006.<br />
Another export leader was colour coated sheet, with revenues<br />
217.8% higher than in 2006 as a result of sales volumes growing<br />
by 145.5% and positive price dynamics. Good pricing for semifinished<br />
products as well as sales volumes growth (48.2%) resulted<br />
in an 89.6% increase in revenues for this product.<br />
We are building long-term relationships in the CIS and the EU.<br />
Deliveries to other regions are primarily carried out on a spot basis.<br />
Sales by industry<br />
Russian Steel focuses on selling to the pipe production, automotive,<br />
machinery building and construction industries and steel service<br />
centres (further referred to as regional distribution). In <strong>2007</strong> in<br />
volume terms, regional distribution accounted for 52.4% of all<br />
sales, pipe production for 23.0%, the automotive industry for<br />
8.5%, and construction for 3.3%. A substantial share of regional<br />
distribution’s customers at the end of <strong>2007</strong> was in construction.<br />
We sold more products to our priority industries in <strong>2007</strong>, with<br />
significant sales growth registered by construction (39.1%), pipe<br />
manufacturers (21.7%) and regional distribution (9.8%).<br />
Sales growth in the pipe-making industry was principally<br />
due to higher demand for pipes used in oil and gas pipelines,<br />
water pipelines and public utilities. The higher sales to regional<br />
distribution companies were due to the strong development of<br />
the construction industry.<br />
Revenues from sales to automotive companies were 6.2%<br />
higher due to higher prices for hot and cold-rolled sheet. In physical<br />
terms, the shipments decreased by 4.5% because of falling<br />
competitiveness among Russian car manufacturers and insufficient<br />
local operations by the foreign producers.<br />
Revenue from sales to machinery building companies rose by<br />
14.9% and to the railroad machinery industry by 41.3%. This was<br />
due to Russia’s booming transportation industry and infrastructure.<br />
<strong>Severstal</strong> <strong>Annual</strong> <strong>Report</strong> <strong>2007</strong> 43
Business review<br />
Revenues by region, <strong>2007</strong><br />
Revenues by industry, <strong>2007</strong><br />
Russian Federation 71.4%<br />
Eastern Europe 6.7%<br />
Western Europe 6.7%<br />
CIS 5.5%<br />
The Middle East 4.0%<br />
Americas 2.7%<br />
Asia 2.3%<br />
Africa 0.7%<br />
Trading and<br />
regional distribution 50.0%<br />
Pipemaking 24.2%<br />
Automotive 8.7%<br />
Steel industry 5.8%<br />
Machine building 4.5%<br />
Construction 3.8%<br />
Railway industry 1.3%<br />
Other 1.7%<br />
Capital investments<br />
We invested US$494.8 million in our steel business in <strong>2007</strong>.<br />
Of this, we spent US$405.7 million on new projects and<br />
US$89.1 million on repairing and modernising equipment.<br />
By 2011, we will have invested around US$6 billion in this<br />
part of our business, guaranteeing an increase in our production<br />
volumes. By 2011, we plan to have increased rolled product<br />
production by 25%.<br />
How we will invest our money:<br />
– We will build two long product mini-mills, to produce rebar<br />
and light sections, as well as a weld profiles line and a<br />
processing centre<br />
– We will develop new galvanising and coating production lines,<br />
and a new heavy beams production line<br />
– We will increase the output of our electric furnace steel.<br />
Ongoing projects<br />
We are rebuilding our coke furnace battery No. 7<br />
We invested US$0.6 million in this project in <strong>2007</strong>, out of a total<br />
investment of US$126.6 million. The planned productivity of the<br />
coke battery is 750,000 tonnes of coke a year. We are carrying out<br />
this project as part of a bigger programme which will enable us<br />
to produce 9.1 million tonnes of hot metal a year. We started this<br />
project in the first quarter of <strong>2007</strong> and will be finishing it in the<br />
fourth quarter of 2011.<br />
We are modernising our continuous-casting machines<br />
We invested US$45.1 million in this project in <strong>2007</strong>, out of a total<br />
investment of US$143.2 million. At the end of the project, we<br />
expect production of converter steel to increase to 9.5 million<br />
tonnes a year.<br />
We are modernising our blast furnace No. 3<br />
This is a part of a US$430.5 million investment programme, of<br />
which we have already spent US$8 million. We started capital<br />
repairs in December 2006 and plan to complete the work by 2010.<br />
We are modernising our hot-rolling mill<br />
This is a part of a US$253.4 million investment programme,<br />
of which we have already spent US$133.6 million. We invested<br />
US$17.1 million in <strong>2007</strong>.<br />
We are building the Sheksna weld pipe mill<br />
This is part of a US$138.7 million investment programme, of which<br />
we spent US$3.4 million in <strong>2007</strong>. The rolling mill will produce up to<br />
250,000 tonnes of pipe a year. We plan to open the mill by the end<br />
of 2009. It will primarily produce electric-welded pipes of various<br />
diameters, thickness and length, as well as square and rectangular<br />
sections with different cross-sections.<br />
We are building a processing service centre in Kolpino<br />
This is a part of a US$47.8 million investment programme, of which<br />
we invested US$14.8 million in <strong>2007</strong>. We plan to open the centre<br />
in August 2008 and it will have an annual production output of<br />
80,000 tonnes of finished products. It will specialise in the deep<br />
processing of plates for the shipbuilding, engineering and<br />
construction industries.<br />
We are building a mini-mill in the Saratov region<br />
This is a part of a US$571.4 million investment programme that<br />
starts in 2008. The mill will produce long products for the construction<br />
industry and will have an output capacity of 1 million tonnes of<br />
rolled products a year. The mill is set to open at the end of 2010.<br />
We are identifying a site for a mini-mill in one of the<br />
central regions<br />
This is a part of a US$537 million investment programme that<br />
starts in 2008. The mill will produce long products for the construction<br />
industry and will have an output capacity of 1 million tonnes of<br />
rolled products a year. The mill is set to open by the end of 2010.<br />
44 <strong>Severstal</strong> <strong>Annual</strong> <strong>Report</strong> <strong>2007</strong>
Costs<br />
<strong>2007</strong> 2006<br />
US$ % of US$ % of<br />
Cost of sales structure million Total million Total<br />
Materials<br />
Coal 606 12.5 489 12.9<br />
Coke 34 0.7 49 1.3<br />
Iron ore 508 10.5 442 11.6<br />
Pellets 465 9.6 287 7.5<br />
Scrap metal 798 16.5 616 16.2<br />
Ferroalloys and<br />
non-ferrous metals 463 9.6 343 9.0<br />
Other materials 433 9.0 352 9.3<br />
Total materials 3,307 68.4 2,578 67.8<br />
Energy<br />
Natural gas 150 3.1 119 3.1<br />
Electric power 181 3.7 149 3.9<br />
Other energy resources 75 1.6 58 1.5<br />
Total energy 406 8.4 326 8.6<br />
Staff costs 554 11.4 416 10.9<br />
Depreciation and amortisation 317 6.6 226 5.9<br />
Other 253 5.2 259 6.8<br />
Total 4,837 100.0 3,805 100.0<br />
Costs of sales rose in <strong>2007</strong> by US$1.032 billion, due to the<br />
US$269 million growth in production volumes, a US$286 million<br />
benefit from exchange rate movements, a US$362 million growth<br />
in prices of materials, a US$49 million increase in energy prices<br />
and a US$137 million increase in labour costs. A number of factors<br />
had a decreasing effect of US$70 million on costs of sales. These<br />
included a US$27 million reduction in raw materials consumption<br />
rates and a US$43 million effect of change in the structure of used<br />
raw materials.<br />
Principal cost-cutting initiatives<br />
– Consistent outsourcing of services<br />
– Improving industrial efficiency through energy and raw<br />
material savings<br />
– Scrap capacities expansion<br />
– Using modern technological materials and decisions<br />
– Optimisation of purchasing costs.<br />
<strong>Severstal</strong> <strong>Annual</strong> <strong>Report</strong> <strong>2007</strong> 45
Business review<br />
<strong>Severstal</strong> North America<br />
<strong>Severstal</strong> North America (SNA) is the fourth largest<br />
integrated steelmaking company in the United States,<br />
and produces high-quality flat-rolled products.<br />
We have 3.2 million tonnes of annual crude steel making<br />
capacity, 3.3 million tonnes of hot-rolled sheet, 1.4 million tonnes<br />
of cold-rolled sheet, and 0.8 million tonnes of galvanised sheet<br />
capacity. Our manufacturing facilities and corporate headquarters<br />
are located in Dearborn, Michigan, strategically close to major<br />
North American automotive customers.<br />
We produce high-quality flat-rolled products, including hotrolled,<br />
cold-rolled, electrogalvanised and hot-dip galvanised steel,<br />
for customers in the automotive, converter, service centre and<br />
other markets. We also produce high-strength steel and other<br />
specialised products primarily used in the automotive industry,<br />
and we concentrate on manufacturing high-value-added products<br />
to maximise profitability. In <strong>2007</strong>, value-added products<br />
accounted for 51% of our total sales.<br />
In <strong>2007</strong>, SNA produced 1,980,000 tonnes of crude steel,<br />
and shipped 2,327,000 tonnes of steel products. The sales<br />
revenue in <strong>2007</strong> amounted to US$1,692 million, with EBITDA<br />
of US$21.5 million.<br />
We were also involved in four joint ventures, established<br />
together with US companies in order to expand our product line.<br />
The joint ventures produce metallurgical coke and galvanised<br />
steel, and provide steel processing services.<br />
Double Eagle<br />
SNA owns 50% of Double Eagle Steel Coating Company, a joint<br />
venture with United States Steel Corporation. Double Eagle is the<br />
world’s largest electrogalvanising line, and produces premiumquality<br />
galvanised sheet steel – primarily for automotive customers.<br />
The plant, located in Dearborn, Michigan, has a production capacity<br />
of 789,000 tonnes per year, approximately one half of which is<br />
dedicated to SNA.<br />
Spartan Steel<br />
SNA owns 48% of Spartan Steel Coating, L.L.C. – a joint venture<br />
with Worthington Steel of Michigan. Spartan Steel produces hotdip<br />
galvanised sheet steel primarily for automotive and service<br />
centre customers. The plant is located in Monroe, Michigan, and<br />
has a production capacity of 544,000 tonnes per year, about 80%<br />
of which is dedicated to SNA. SNA supplies nearly 100% of the<br />
steel sheet used as substrate for Spartan Steel.<br />
Mountain State Carbon<br />
SNA owns 50% of Mountain State Carbon LLC, located in<br />
Follansbee, West Virginia. Mountain State Carbon is a metallurgical<br />
coke-making joint venture between SNA Carbon, LLC (a whollyowned<br />
subsidiary of SNA) and Wheeling-Pittsburgh Steel<br />
Corporation. Mountain State Carbon was formed to provide its<br />
owners with a reliable supply of high-quality, competitively-priced<br />
domestic coke. The annual production of Mountain State Carbon<br />
is 1 million tonnes. Our ownership in Mountain State Carbon allows<br />
us to receive approximately 500,000 tonnes of coke every year, at<br />
a substantially lower cost than delivered imported coke.<br />
Delaco Processing<br />
SNA owns 49% of Delaco Processing LLC, Delaco Supreme Tool<br />
and Gear Co. owns 51% of Delaco Processing LLC, located in<br />
Dearborn, Michigan. Delaco Processing specialises in slitting steel<br />
strip and sheet up to 1,829 mm in width.<br />
SeverCorr LLC is a brand-new steel company with a nextgeneration<br />
steel plant located in Columbus, Mississippi – in<br />
the heart of America’s new industrial region. In October 2005,<br />
SeverCorr began construction of the steel plant, which was<br />
commissioned into operation in October <strong>2007</strong>.<br />
SeverCorr is a unique combination of mini-mill steelmaking<br />
technology and integrated finishing process. It produces highquality<br />
steel by melting scrap in an electric arc furnace, feeding<br />
a thin-slab caster coupled with a high-powered hot-strip mill.<br />
Steel is further processed in a highly sophisticated cold-rolling<br />
mill and galvanising line.<br />
SeverCorr focuses on the production of high-quality flat-rolled<br />
steel with an initial annual production capacity of 1.5 million<br />
tonnes of steel. The facility provides products for use in the<br />
automotive, building, agricultural, pipe and tube, and appliance<br />
industries. SeverCorr is the first EAF-based steel mill in the world,<br />
and is poised to produce exposed automotive steel. Our company’s<br />
investment plans include a second phase of construction, to<br />
increase capacity to 3.0 million tonnes of high-quality steel.<br />
Another unique feature of the company is its 1,400-acre site,<br />
which is being developed into an industrial park to accommodate<br />
production partners and related manufacturers onsite.<br />
The plant is located near a number of large steel customers,<br />
making the distribution channels more efficient. SeverCorr<br />
complements SNA’s business: its major market is the Southeastern<br />
US, within 400 miles of the manufacturing location. SeverCorr’s<br />
ambition is to become a leading supplier of a wide-range, highquality<br />
flat-rolled steel products, including exposed automotive<br />
applications, for the Southern US customers.<br />
In May 2008, <strong>Severstal</strong> acquired Sparrows Point, located<br />
in Baltimore, Maryland for an all cash purchase price of<br />
US$810 million. The transaction reflects a significant strategic<br />
opportunity to add complementary assets and scale to <strong>Severstal</strong>’s<br />
existing US business. Sparrows Point has a capacity of 3.6 million<br />
metric tons of crude steel and shipped 2.3 million metric tons of<br />
finished steel products in <strong>2007</strong>; it is the only integrated producer<br />
of flat-rolled steel on the US East Coast and is a major North<br />
American supplier of tin mill products.<br />
In June 2008, <strong>Severstal</strong> signed a merger agreement to acquire<br />
100% of the shares of Esmark Inc. for US$775 million. By utilising<br />
its management expertise and experience to successfully unlock<br />
Esmark’s potential, <strong>Severstal</strong> expects this acquisition to play<br />
a critical role in its North American industrial strategy. The<br />
combined company creates one of North America’s leading<br />
producers of flat-rolled steel and expands <strong>Severstal</strong>’s product<br />
offerings to its customers.<br />
In July 2008, <strong>Severstal</strong> completed acquisition of WCI Steel,<br />
a market leader in the production of value-added steel products<br />
based in Warren, Ohio. <strong>Severstal</strong> acquired all of the outstanding<br />
equity of WCI for a total cash consideration of US$140 million,<br />
implying an enterprise value of approximately US$370 million<br />
based on outstanding net debt as of 30 April 2008. WCI’s total<br />
annual steel-making capacity of 1.22 million metric tons is focused<br />
on high-quality, custom flat-rolled steel for use in demanding<br />
applications. Together with <strong>Severstal</strong>’s current US operations,<br />
WCI will solidify the company’s position as one of North America’s<br />
leading producers of high-quality flat-rolled steel for the<br />
automotive, appliance, furniture, construction and energy markets.<br />
46 <strong>Severstal</strong> <strong>Annual</strong> <strong>Report</strong> <strong>2007</strong>
Key performance indicators<br />
<strong>2007</strong> 2006 Change<br />
year-on-year %<br />
Production of crude steel (Thousand tonnes) 1,980 2,548 (22.3)<br />
Sales of steel products (Thousand tonnes) 2,327 2,649 (12.2)<br />
Revenue (US$ million) 1,691.9 1,868.4 (9.4)<br />
Gross profit (US$ million) 27.8 156.5 (82.2)<br />
Profit from operations (US$ million) 1.6 134.2 (98.8)<br />
Operating margin (%) 0.1 7.2<br />
EBITDA (US$ million) 21.5 142.1 (84.9)<br />
EBITDA per tonne (US$/tonne) 9 54 (83.3)<br />
EBITDA margin (%) 1.3 7.6<br />
Average steel product price (US$/tonne) 707 692 2.2<br />
Hot-rolled flat products (US$/tonne) 605 629 (3.8)<br />
Cold-rolled flat products (US$/tonne) 721 705 2.3<br />
Galvanised and other metallic coated sheet (US$/tonne) 865 820 5.5<br />
The company expects to realise substantial synergies between<br />
the new additions and existing US operations in Dearborn,<br />
Michigan and Columbus, Mississippi. The addition of Esmark to<br />
<strong>Severstal</strong>’s US portfolio also offers significant operational and<br />
financial synergy potential with recently acquired Sparrows Point<br />
in Baltimore, Maryland and the Warren, Ohio based WCI Steel. In<br />
addition, full ownership of Mountain State Carbon will increase the<br />
company’s domestic coke making capacities and further solidify<br />
its raw material supply base.<br />
Strategy<br />
Strategic objectives of <strong>Severstal</strong> North America are:<br />
– To become a low-cost supplier of high-value steel products.<br />
This is being accomplished with significant investments at SNA<br />
and SeverCorr<br />
– To secure a raw material supply which assures low cost<br />
– To improve margins and acquire downstream outlets for steel.<br />
The sales revenue in <strong>2007</strong> amounted to US$1,692 million,<br />
which is 9.4% lower than in 2006. EBITDA in <strong>2007</strong> amounted to<br />
US$21.5 million, which is 84.9% lower than in 2006. Profitability<br />
decrease in <strong>2007</strong> compared with 2006 is primarily related to the<br />
production shortfalls in steel making operations, which resulted<br />
from the planned reline and modernisation of the C-Blast Furnace.<br />
This was completed in October <strong>2007</strong> and was successfully<br />
restarted.<br />
At the end of the year <strong>2007</strong>, 2,165 employees worked at SNA,<br />
compared to 2,171 in 2006.<br />
Operational results<br />
In <strong>2007</strong>, C-Blast Furnace was fully rebuilt to increase its capacity<br />
up to 5,900 tonnes of hot metal per day. It was under renovation<br />
for 97 days, from July to October <strong>2007</strong>. Additionally, repairs and<br />
maintenance work implemented at B-Blast Furnace required a<br />
temporary outage of the furnace. These outages resulted in the<br />
reduction of total hot metal production by 21.8% compared to<br />
2006, down from 2,119,000 tonnes to 1,656,000 tonnes.<br />
As a result of the reduction in steel production, slab production<br />
decreased by 22.3% compared to 2006 – from 2,548,000 tonnes<br />
to 1,980,000 tonnes.<br />
Even with the blast furnace outage, we were able to use<br />
inventory and purchase slabs, so that production of hot-rolled steel<br />
only decreased by 8.2% compared to 2006, from 2,747,000<br />
tonnes to 2,522,000 tonnes. Production of cold-rolled steel also<br />
decreased, from 1,213,000 tonnes in 2006 to 1,191,000 tonnes<br />
in <strong>2007</strong>.<br />
In November 2006, we increased line furnace capacity in Hot-<br />
Dip Galvanising (HDG) at Spartan Steel, to allow for approximately<br />
100,000 more tonnes of production annually. As a result, total<br />
production of galvanised products increased in <strong>2007</strong> by 12.7%<br />
compared to 2006, replacing products with lower margins.<br />
The B-Blast Furnace, which was scheduled for a complete<br />
reline in 2010, experienced a production incident on 5 January<br />
2008 which resulted in an outage of its production that will last<br />
until late 2009. Our primary C-Blast Furnace was completely<br />
unaffected by this incident.<br />
When B-Blast Furnace resumes production, the crude steel<br />
capacity of the Dearborn production facilities will be restored to<br />
3.1 million tonnes per year.<br />
<strong>Severstal</strong> <strong>Annual</strong> <strong>Report</strong> <strong>2007</strong> 47
Sales by product<br />
Business review<br />
<strong>2007</strong> 2006 Change year-on-year %<br />
Thousand US$ Thousand US$ Thousand US$<br />
tonnes million tonnes million tonnes million<br />
Hot-rolled flat products 1,178 713.3 1,424 896.1 (17.3) (20.4)<br />
Cold-rolled flat products 436 313.9 582 410.2 (25.1) (23.5)<br />
Galvanised and other<br />
metallic coated sheet 713 616.6 643 527.7 10.9 16.8<br />
Total steel products 2,327 1,643.8 2,649 1,834.0 (12.2) (10.4)<br />
Other – 48.1 – 34.4 39.8<br />
Total sales 2,327 1,691.9 2,649 1,868.4 (12.2) (9.4)<br />
US sales<br />
Hot-rolled flat products 1,04 635.7 1,139 717.8 (8.1) (11.4)<br />
Cold-rolled flat products 405 293.0 556 391.9 (27.2) (25.2)<br />
Galvanised and other<br />
metallic coated sheet 662 571.4 612 502.3 8.2 13.8<br />
Total steel products 2,114 1,500.1 2,307 1,612.0 (8.4) (6.9)<br />
Other – 48.1 – 34.4 39.8<br />
Total US sales 2,114 1,548.2 2,307 1,646.4 (8.4) (6.0)<br />
Export sales<br />
Hot-rolled flat products 131 77.6 285 178.3 (54.0) (56.5)<br />
Cold-rolled flat products 31 20.9 26 18.3 19.2 14.1<br />
Galvanised and other<br />
metallic coated sheet 51 45.2 31 25.4 64.5 78.0<br />
Total steel products 213 143.7 342 222.0 (37.7) (35.3)<br />
Other<br />
Total export sales 213 143.7 342 222.0 (37.7) (35.3)<br />
Production results<br />
<strong>2007</strong> 2006 Change<br />
year-on-<br />
Production volumes, thousand tonnes year %<br />
Total output<br />
Hot metal 1,656 2,119 (21.8)<br />
Crude steel 1,980 2,548 (22.3)<br />
Hot-rolled flat products 2,522 2,747 (8.2)<br />
Cold-rolled flat products 1,191 1,213 (1.8)<br />
Galvanised and other<br />
metallic coated sheet 676 600 12.7<br />
Production for sale<br />
(excl. intra-company transactions)<br />
Hot-rolled flat products 1,185 1,400 (15.4)<br />
Cold-rolled flat products 468 573 (18.3)<br />
Galvanised and other<br />
metallic coated sheet 733 646 13.5<br />
Total rolled products 2,386 2,619 (8.9)<br />
Sales and marketing<br />
From 2006 to <strong>2007</strong>, total sales volume and domestic sales volume<br />
decreased by 12% and 8% respectively, due primarily to the<br />
C-Blast Furnace modernisation project. Our sales of galvanised<br />
flat products increased in <strong>2007</strong>, thanks to the expansion of HDG<br />
production capacity at the Spartan Steel joint venture, and the<br />
continued shift to value-added products.<br />
Key markets<br />
91% of <strong>2007</strong> total sales volumes were shipped to the US<br />
domestic market.<br />
Direct sales to automotive manufacturers in <strong>2007</strong> accounted<br />
for 51% of total revenue. The majority of customers are located<br />
within 550 kilometres of our facilities. In <strong>2007</strong>, our sales volumes<br />
in the automotive industry were 10% higher than in 2006, as we<br />
increased sales to the “new domestic manufacturers” (foreign<br />
auto makers with production facilities in the US) who are a target<br />
growth market. In total, our 10 largest customers accounted for<br />
more than 60% of our <strong>2007</strong> sales.<br />
Our automotive revenue (US$868 million) was US$135 million<br />
higher in <strong>2007</strong> than in 2006, due to an increase in sales volumes,<br />
as well as positive prices on contract, value-added products. Nonautomotive<br />
revenue (US$824 million) was US$311 million lower<br />
than in 2006, due to a decrease in sales volumes and weaker<br />
pricing in the service centre and converter markets.<br />
Export sales accounted for 9% of <strong>2007</strong> total sales volumes, and<br />
all export sales were shipped to the NAFTA region. The Canadian<br />
market accounted for approximately 98% of SNA’s exports.<br />
Capital expenditure<br />
<strong>2007</strong> was a very capital-intensive year for SNA. Total capital<br />
expenditures in <strong>2007</strong> were US$483 million, or 5.8 times higher<br />
than in 2006. The majority of the capital expenditures relate to<br />
modernising C-Blast Furnace, and the resulting downstream<br />
production improvements, while the remaining part of spending<br />
relates to IT, safety and ecology – and non-production projects.<br />
SNA’s largest and newly-rebuilt C-Blast Furnace is the<br />
cornerstone of the company’s modernisation programme.<br />
The furnace utilises state-of-the-art technologies that will make it<br />
among the most efficient, productive and environmentally friendly<br />
blast furnaces in the world. We installed the secondary Emissions<br />
Fume Collection system in the BOF shop to reduce environmental<br />
pollution. To improve slab quality, the curved mould of continuous<br />
casting machine No. 1 was upgraded to straight mould. To improve<br />
the quality of hot-rolled products, and the performance of the<br />
hot-strip mill, we increased fuel efficiency and modernised the<br />
mill’s reheat furnaces. To expand SNA’s cold-rolling capacity and<br />
product range, we began construction of a new, modern Pickle<br />
Line, coupled with the Tandem Cold Mill, in <strong>2007</strong>, and ordered<br />
necessary equipment. Other construction projects included a new<br />
on-site Hot Dip Coating Line for exposed automotive applications,<br />
which is set to enhance SNA’s galvanising capacity.<br />
The total costs of SNA’s current key capital projects exceeds<br />
US$1 billion, of which US$435 million was spent to the end<br />
of <strong>2007</strong>.<br />
48 <strong>Severstal</strong> <strong>Annual</strong> <strong>Report</strong> <strong>2007</strong>
SNA revenues by industries<br />
Automotive 51.3%<br />
Service centres 22.3%<br />
Converters 17.3%<br />
Other customers 9.1%<br />
Costs<br />
Our major costs are raw materials (including iron ore pellets),<br />
coke, coal and steel scrap. SNA annually consumes about 3 million<br />
tonnes of iron ore pellets, 1 million tonnes of coke, and 0.6 million<br />
tonnes of steel scrap. Other consumables include electricity,<br />
natural gas, oxygen, zinc, ferroalloys and fluxes.<br />
SNA’s purchasing strategy is focused on cost reduction,<br />
through the use of long-term contracts where possible. Long-term<br />
contracts are in place for iron ore pellets, coke, industrial gases,<br />
pulverised coal and critical mill services.<br />
Cost of sales structure<br />
<strong>2007</strong> 2006<br />
US$ % of US$ % of<br />
million Total million Total<br />
Materials<br />
Coal 3.5 0.2 6.3 0.4<br />
Coke 211.2 12.7 286.7 16.7<br />
Pellets 137.8 8.3 173.2 10.1<br />
Scrap metal 121.2 7.3 147.9 8.6<br />
Ferroalloys and<br />
non ferrous metals 43.1 2.6 41.7 2.4<br />
Other materials 438.6 26.3 368.8 21.7<br />
Total materials 955.4 57.4 1,024.6 59.9<br />
Energy<br />
Natural gas 114.3 6.9 163.5 9.6<br />
Electric power 20.4 1.2 21.6 1.3<br />
Other energy resources 26.8 1.6 30.9 1.7<br />
Total energy 161.5 9.7 216.0 12.6<br />
Staff costs 193.1 11.6 184.9 10.8<br />
Depreciation and<br />
amortisation 16.4 1.0 8.3 0.5<br />
Services 227.3 13.7 193.1 11.3<br />
Other 110.4 6.6 85.0 4.9<br />
Total cost of sales 1,664.1 100.0 1,711.9 100.0<br />
Although total cost of sales for <strong>2007</strong> showed a 2.8%<br />
(US$47.8 million) decrease on 2006, the average cost of goods<br />
per tonne increased by 10.7% (from US$646 per tonne in 2006<br />
to US$715 in <strong>2007</strong>). This can be partially explained by increased<br />
prices of raw materials, but the cost increase was mainly due to<br />
inefficiencies caused by the modernisation and reline work at<br />
primary operational facilities.<br />
In January 2008, an energy company with which we had<br />
a long-term contract, terminated it – and made a one-time<br />
payment to compensate for the difference between the contract<br />
price for electricity and the market price we will now have to pay.<br />
The payment was US$177 million, paid in February 2008.<br />
We introduced Total Operating Performance (TOP) and Total<br />
Cost of Ownership (TCO) initiatives to help eliminate the waste<br />
that results when we acquire and use materials. This in turn helps<br />
to reduce costs.<br />
<strong>Severstal</strong> <strong>Annual</strong> <strong>Report</strong> <strong>2007</strong> 49
Business review<br />
Lucchini<br />
Key performance indicators<br />
<strong>2007</strong> 2006 Change<br />
year-on-year %<br />
Production of crude steel (Thousand tonnes) 3,585 3,567 0.5<br />
Sales of iron and steel products (Thousand tonnes) 3,843 3,998 (3.9)<br />
Revenue (US$ million) 3,757 3,357 11.9<br />
Gross profit (US$ million) 562 550 2.2<br />
Profit from operations (US$ million) 216 208 (3.8)<br />
Operating margin (%) 5.7 6.2<br />
EBITDA (US$ million) 416 336 23.8<br />
EBITDA per tonne (US$/tonne) 108 84 28.6<br />
EBITDA margin (%) 11.1 10.0<br />
Lucchini is the second largest steel group in Italy and<br />
one of the largest European producers of special quality<br />
steel long products by volume of production, according<br />
to KWR International, with 15 plants and service centres<br />
throughout Europe.<br />
With more than 1,000 customers in niche markets such<br />
as automotive, rails, bearings, springs and wire rod, we have<br />
a steelmaking capacity of 4 million tonnes of crude steel a year.<br />
In <strong>2007</strong>, we produced 3.6 million tonnes of crude steel and<br />
3.6 million tonnes of finished products, including 2.3 million<br />
tonnes of rolled steel, 0.8 million tonnes of semi-finished products<br />
and 0.4 million tonnes of pig iron. Sales revenues in <strong>2007</strong> were<br />
US$3,757 million and EBITDA was US$416 million. Our two<br />
principal businesses are Piombino in Italy and Ascometal in France.<br />
Piombino<br />
We believe Piombino is one of the European leaders of long<br />
speciality steel products, including round bars, rolled blooms<br />
and billet and flat products, and a leading Italian producer of<br />
high-quality wire rod, including drawing wire rod, cold heading<br />
steel and welding steel.<br />
Piombino estimates that it has approximately 20% of<br />
European market share and 80% of domestic market share<br />
for rails and rail stocks based on Eurofer data.<br />
Main production facilities comprise of plants in Piombino,<br />
Trieste, Bari, Condove and Lecco (all in Italy). The headquarters is<br />
located in Brescia, Italy. At the end of the year <strong>2007</strong>, Piombino had<br />
3,204 employees (full-time equivalent).<br />
Ascometal<br />
Ascometal is a European leader in long special steels and operates<br />
four integrated EAF-based mills, two cold finishing centres and a<br />
distribution centre in France. Ascometal’s facilities are strategically<br />
located near scrap collection and processing centres.<br />
The headquarters is in Paris, France. At the end of the year<br />
<strong>2007</strong>, the company employed 3,391 people (full-time equivalent).<br />
Strategy<br />
Lucchini’s business strategies include the following:<br />
– Continue emphasis on diversified customer base<br />
– Focus on customised, high-quality products (automotive,<br />
machinery, appliances and rail)<br />
– Identify and capitalise on synergies with <strong>Severstal</strong>.<br />
The main objectives of Piombino’s long-term strategy are:<br />
– Enhance product mix for long products<br />
– Shift from producing semi-finished products and low-addedvalue<br />
long products, to producing high-added-value flat products<br />
– Participate in the consolidation of the Italian steel industry<br />
– Increase internal efficiency.<br />
The key objectives of Ascometal’s strategy are:<br />
– Achieve significant growth in profitability<br />
– Maintain and widen the product offer<br />
– Increase sales volume to 1,250,000 tonnes by 2011.<br />
50 <strong>Severstal</strong> <strong>Annual</strong> <strong>Report</strong> <strong>2007</strong>
Sales by products<br />
<strong>2007</strong> 2006 Change year-on-year %<br />
Thousand US$ Thousand US$ Thousand US$<br />
tonnes million tonnes million tonnes million<br />
Pig iron and Hot metal<br />
(PI&HM) 417 156 430 120 (3.0) 30.0<br />
Steel products<br />
Semi-finished products<br />
(excl. PI&HM) 983 687 999 795 (1.6) (13.6)<br />
Long products 2,130 2,207 2,201 1,736 (3.2) 27.1<br />
Rails 313 322 368 375 (14.9) (14.1)<br />
Total steel products 3,426 3,216 3,568 2,906 (4.0) 10.7<br />
Total net sales by products 3,843 3,372 3,998 3,026 (3.9) 11.4<br />
Others and shipping – 385 – 331 – 16.3<br />
Total sales revenue 3,843 3,757 3,998 3,357 (3.9) 11.9<br />
Key performance indicators<br />
Increased steel prices confirmed the general positive trend for<br />
finished goods and helped make Lucchini US$3,757 million in<br />
revenue in <strong>2007</strong>, 11.9% higher than in 2006. EBITDA in <strong>2007</strong> was<br />
US$416 million with a positive performance of 23.8% compared<br />
to the previous year.<br />
Operations<br />
In <strong>2007</strong>, Lucchini produced 3,585,000 tonnes of crude steel, a<br />
0.5% increase on the previous year. Production of finished rolled<br />
steel (long products and rails) was a record 2,329,000 tonnes.<br />
Production of semi-finished products decreased by 7.2% from<br />
1,318,000 tonnes in 2006 to 1,223,000 tonnes in <strong>2007</strong>. Production<br />
of long products increased by 4.6% from 1,927,000 tonnes in<br />
2006 to 2,016,000 tonnes in <strong>2007</strong>.<br />
Lucchini production volumes<br />
<strong>2007</strong> 2006 Change<br />
year-onthousand<br />
tonnes year %<br />
Total output<br />
Hot metal 2,534 2,426 4.5<br />
Crude steel 3,585 3,567 0.5<br />
Production for sale<br />
(excl. inter-company transfers)<br />
Semi-finished products 1,223 1,318 (7.2)<br />
Long products 2,016 1,927 4.6<br />
Rails 313 311 0.6<br />
Downstream products 73 110 (33.6)<br />
Total products for sale 3,625 3,666 (1.1)<br />
Sales and marketing<br />
European economic growth led to a 5.3% increase in steel<br />
consumption in Europe in <strong>2007</strong>. However, European producers,<br />
and Italian in particular, are affected by the import of Chinese<br />
products and a decline in export sales.<br />
Wire rod demand and prices increased during <strong>2007</strong>, with<br />
a second half of the year influenced by the increase in Chinese<br />
imports; the bars market was favourable due to an increase in<br />
mechanical engineering and automotive businesses; the rails<br />
market saw internal demand marginally down although this was<br />
compensated for by an increase in export sales.<br />
Lucchini total sales volume of 3,843,000 tonnes was 3.9%<br />
lower than in 2006. Increase in revenues by 11.9% was mainly<br />
due to positive price trends in <strong>2007</strong>.<br />
Sales revenues of long products has increased by 27.1%, while<br />
volumes decreased by 3.2%. Sales revenues of long products<br />
account for 58.7% of total Lucchini Group’s revenue in <strong>2007</strong>.<br />
Sales volumes of semi-finished products (excl. Hot Metal and<br />
Pig Iron) were 1.6% lower in <strong>2007</strong> compared to 2006, partially<br />
due to the strategic decision to reduce slab sales in Q4 <strong>2007</strong> as a<br />
result of the unfavourable exchange rate dynamics. At the same<br />
time, sales revenues of semi-finished products decreased by<br />
13.6% and currently account for 18.3% of the total Lucchini<br />
Group’s revenue in <strong>2007</strong>.<br />
Sales volumes of rails decreased by 14.9% while revenues<br />
decreased by 14.1%. Rails accounted for 8.6% of total Lucchini<br />
Group’s revenues in <strong>2007</strong>.<br />
<strong>Severstal</strong> <strong>Annual</strong> <strong>Report</strong> <strong>2007</strong> 51
Business review<br />
Piombino sales by industry<br />
Ascometal sales by industry<br />
Railway industry 25.4%<br />
Steel industry 20.4%<br />
Trading and<br />
regional distribution 10.3%<br />
Bearings 5.6%<br />
Machine building 4.8%<br />
Automotive 3.5%<br />
Construction 3.5%<br />
Other 26.5%<br />
Automotive 34.5%<br />
Machine building 24.1%<br />
Bearings 16.2%<br />
Railway industry 3.7%<br />
Other 21.5%<br />
Sales by industry<br />
Most of Piombino’s deliveries were to the steel processing,<br />
machine building and railway industries. Other important<br />
customers are bearing manufacturers, and the construction and<br />
automotive industries. Shipments to the automotive industry were<br />
48% higher in volume, and 76% higher in revenue, compared<br />
with 2006.<br />
Ascometal sales of long products to the automotive industry<br />
were 6% higher in volume and 18% in revenues in <strong>2007</strong><br />
compared with 2006. Other important sectors include the bearing<br />
and springs market, and machine building and railway industries.<br />
Key markets<br />
Lucchini has more than 1,000 customers in its main markets in<br />
Italy, France and Germany. Lucchini sells its Piombino products<br />
primarily in the Italian domestic market, and nearly half of its<br />
Ascometal products in the French domestic market. Lucchini’s<br />
main objectives include maintaining and strengthening its cost<br />
leadership position in Italy and Western Europe and pursuing<br />
development in new, high-growth markets such as Eastern Europe<br />
and the Far East. Lucchini has commercial offices in Zurich,<br />
Barcelona, New York, Singapore, Dusseldorf and Manchester<br />
(UK) and exports its products to more than 60 countries.<br />
Lucchini has centralised sales and marketing departments.<br />
Sales by Market, Lucchini<br />
<strong>2007</strong> 2006 Change<br />
US$ US$ year-onmillion<br />
% million % year %<br />
Market<br />
Europe 3,220 85.7 2,851 85.0 12.9<br />
Americas 244 6.5 344 10.2 (29.1)<br />
Asia 290 7.7 162 4.8 79.0<br />
Russian Federation 3 0.1 – – –<br />
Total 3,757 100.0 3,357 100.0 11.9<br />
Capital expenditure<br />
Neither Piombino nor Ascometal implemented any big capital<br />
projects in <strong>2007</strong>.<br />
Lucchini Group’s total capital expenditure was 57% higher<br />
than in <strong>2007</strong> compared to 2006. It amounted to US$199.3 million<br />
in <strong>2007</strong> compared to US$126.7 million in 2006. The growth was<br />
related mainly to development projects (aimed at improving<br />
quality and performance and reducing cost) which made up 52%<br />
of total <strong>2007</strong> capex. The remainder was maintenance capex aimed<br />
primarily at maintaining existing facilities. Some 80.7% of capital<br />
expenditure relates to industrial projects. The remaining 19.3%<br />
relates to IT, safety, environmental and non-production projects.<br />
52 <strong>Severstal</strong> <strong>Annual</strong> <strong>Report</strong> <strong>2007</strong>
Metalware<br />
Sales by industry<br />
in Russia and the Belarus Republic<br />
Construction 24.1%<br />
Mass-scale<br />
retail market 22.9%<br />
Russian railway 12.3%<br />
Automotive industry 8.1%<br />
Engineering<br />
industry 8.1%<br />
Metalware<br />
production 7.3%<br />
Other 17.2%<br />
Our Metalware segment includes <strong>Severstal</strong>-metiz –<br />
Cherepovets plant, Volgograd plant, Orel plant (Russia),<br />
Dneprometiz (Ukraine), Carrington Wire (Great Britain)<br />
and four other subsidiaries (Russia): Steellace, UniFence,<br />
UniSpring, Orelcord. It has a leading position (25% of the<br />
market share) in the Russian metalware industry, an 18 %<br />
share in the Ukrainian market, and a 23% share in the UK<br />
market. The segment manufactures cold-drawn products<br />
(cold-drawn steel, railway fasteners, steel shapes), highcarbon<br />
products (wire, wire ropes), low-carbon products (wire,<br />
nails, fibre), welding materials (flux cored wire, solid welding<br />
wire, electrodes), mesh (chain-link mesh, woven mesh, welded<br />
mesh, gabions), fasteners for common applications, and<br />
other products including spring blocks, consumer goods and<br />
steel cord.<br />
The Metalware segment’s annual production capacity is<br />
1.5 million tonnes of wire and wire products, with a range including<br />
over 55,000 types of goods. The segment has a diversified<br />
portfolio of suppliers, including almost all large manufacturers of<br />
raw materials in CIS and Europe – such as Cherepovets Steel Mill,<br />
OEMK, MMK, MMZ, ArcelorMittal, Corus, Lucchini and OVAKO.<br />
About 55% of required volume of raw materials used in<br />
metalware production comes from Cherepovets Steel Mill.<br />
In <strong>2007</strong>, the segment’s plants manufactured 1,048 thousand<br />
tonnes of metalware. Sales revenues were US$1.01 billion, while<br />
EBITDA was US$87.3 million.<br />
Structure<br />
<strong>Severstal</strong>-metiz comprises plants in Cherepovets, Volgograd<br />
and Orel:<br />
– The Cherepovets plant focuses on high-value-added products<br />
(cold-drawn, high-carbon, low-carbon segments)<br />
– The Volgograd plant specialises in high-carbon products,<br />
including steel wire and wire ropes<br />
– The Orel plant focuses on welding materials and fasteners.<br />
<strong>Severstal</strong>’s stake in <strong>Severstal</strong>-metiz is 97%.<br />
Dneprometiz is located in Dnepropetrovsk, Ukraine. It specialises<br />
in low-carbon products, manufacturing high-value-added products.<br />
In terms of production volumes, Dneprometiz is Ukraine’s largest<br />
manufacturer of metalware. In <strong>2007</strong>, <strong>Severstal</strong>-metiz held 60%+1<br />
of the shares in Dneprometiz, which corresponded to 58.2% of the<br />
Group effective ownership interest at 31 December <strong>2007</strong>.<br />
Carrington Wire operates in Elland, Great Britain. The plant<br />
occupies a leading position within the UK steel wire products<br />
market. Its total production capacity, approximately 150,000<br />
tonnes a year, is derived from high-carbon, low-carbon and coldheading<br />
wire. In <strong>2007</strong>, <strong>Severstal</strong>-metiz held all shares in Carrington,<br />
which corresponded to 97% of the Group effective ownership<br />
interest at 31 December <strong>2007</strong>.<br />
Metalware segment also includes a number of specialised<br />
subsidiary interests in Russia:<br />
– UniFence (formerly known as Policher)<br />
is located in Orel and Cherepovets, manufactures mesh<br />
– UniSpring (formerly known as ChSPZ-MKR)<br />
is located in Orel and Cherepovets, manufactures spring blocks<br />
– Orelcord (formerly known as TrefilArbed Rus)<br />
is located in Orel, produces steel cord, technical cord for conveyer<br />
belt, brass plated bead wire and hose wire<br />
– Steellace<br />
is located in Orel and Volgograd, manufactures consumer goods.<br />
In <strong>2007</strong>, <strong>Severstal</strong>-metiz increased its shareholding in UniSpring<br />
and Orelcord to 100%, which resulted in the Group having an<br />
effective shareholding of 97% at 31 December <strong>2007</strong>, in<br />
accordance with <strong>Severstal</strong>-metiz’s strategy of increasing highvalue-added<br />
production aimed at the domestic markets.<br />
Strategy<br />
The company’s strategic goals are:<br />
– Concentrating on high-margin products<br />
– Creating additional client services<br />
– Product specialisation and optimising the infrastructure.<br />
<strong>Severstal</strong> <strong>Annual</strong> <strong>Report</strong> <strong>2007</strong> 53
Business review<br />
Key performance indicators<br />
<strong>2007</strong> 2006 Change<br />
year-on-year %<br />
Sales of metalware products (Thousand tonnes) 1,047.6 1,095.2 (4.3)<br />
Revenues (US$ million) 1,011.7 838.9 20.6<br />
Gross profit (US$ million) 139.9 102.4 36.6<br />
Profit from operations (US$ million) 75.9 23.2 227.2<br />
Operating margin (%) 7.5 2.8<br />
EBITDA (US$ million) 87.3 48.6 79.6<br />
EBITDA margin (%) 8.6 5.8<br />
EBITDA per tonne (US$/tonnes) 83 44 88.6<br />
Average sales price (US$/tonnes) 934 738 26.6<br />
Operations and key performance indicators<br />
Based on the <strong>2007</strong> results, the segment’s revenues amounted to<br />
US$1.01 billion, exceeding 2006 figures by 20.6%. EBITDA<br />
was US$87.3 million, exceeding the 2006 figure by 79.6%<br />
(2006: US$48.6 million). The EBITDA margin was 8.6%,<br />
2.8% higher than the 2006 margin.<br />
We improved our financial performance against a backdrop<br />
of a 4.3% decrease in sales volume. This decrease was the result<br />
of a cutback in the production of goods with low profitability and<br />
concentration of the segment’s efforts on more processed<br />
products. The average price of the segment’s products in <strong>2007</strong><br />
was US$934 per tonne, up some 26.6% on 2006.<br />
Over the year, we reduced personnel by 15.5%, to 11,735<br />
people at the end of <strong>2007</strong>. The average salary grew from US$536<br />
to US$672 a month.<br />
Sales and marketing<br />
Key markets and industries<br />
Our Metalware segment sells its products in Russia (accounting for<br />
63% of revenues), Ukraine, Great Britain and other European and<br />
CIS countries. In <strong>2007</strong>, our Russian sales grew 26% on 2006, while<br />
growth of export sales was 13%. The growth in Russian sales is due<br />
to the substantial growth of prices, improvements to our product<br />
portfolio and increased consumption in the construction sector.<br />
Sales of the Metalware segment are diversified, guaranteeing<br />
stable demand for its products. In the Russian market, the bulk of<br />
sales were made to the construction industry (24.1%), the largescale<br />
retail market (22.9%), Russian railway (12.3%), automotive<br />
industry (8.1%) and engineering industry (8.1%).<br />
Increasing imports of metalware products from Ukraine, as well<br />
as from South East Asia and China, presents us with a significant<br />
challenge. The Metalware segment is taking an active part in<br />
initiating protective anti-dumping measures to mitigate this.<br />
Carrington Wire, which occupies a leading position (23% of<br />
the market share) in the UK’s metalware market, is the Metalware<br />
segment’s key player on the European market.<br />
Capital expenditures<br />
In <strong>2007</strong>, our Metalware segment investment programme’s main<br />
objective was to increase high-value-added products volumes,<br />
develop the new range of products, and reduce costs. Aggregate<br />
investments were US$30.0 million, almost three times as high<br />
as in 2006 (US$10.1 million), and we used approximately<br />
US$27 million to modernise production facilities.<br />
Costs<br />
Cost of sales was US$871.8 million in <strong>2007</strong>, an increase of 18.4%.<br />
This was mainly due to the increase of raw material prices<br />
primarily wire rod, which meant raw material share of costs was up<br />
2.6%. Measures to optimise and modernise production led to a<br />
15.5% decrease in personnel numbers, and a 10.3% increase in<br />
labour productivity.<br />
Costs of sales structure<br />
<strong>2007</strong> 2006<br />
% %<br />
Raw materials, semi-finished products,<br />
purchased components 77.4 74.8<br />
Fuel and energy 3.6 4.1<br />
Labour compensation fund 8.4 8.2<br />
Depreciation 2.6 3.3<br />
Other expenses 8.0 9.6<br />
Total 100.0 100.0<br />
54 <strong>Severstal</strong> <strong>Annual</strong> <strong>Report</strong> <strong>2007</strong>
Izhora Pipe Mill<br />
Production of large-diameter pipes in Russia<br />
Vyksa Steel Mill 43%<br />
Chelyabinsk Pipe Mill 27%<br />
Volzhsky Pipe Mill 17%<br />
Izhora Pipe Mill 13%<br />
Source: <strong>Severstal</strong>.<br />
Izhora Pipe Mill is 100% owned by <strong>Severstal</strong> and since <strong>2007</strong><br />
has been considered a separate business segment. The mill<br />
has an annual production capacity of 600,000 tonnes of<br />
large-diameter pipes. In its first year, the mill sold 300,800<br />
tonnes of large-diameter pipes, accounting for 13% of the<br />
Russian market. Based on <strong>2007</strong> results, Izhora was Russia’s<br />
fourth largest large-diameter pipe producer.<br />
In <strong>2007</strong> its revenue was US$550.7 million. EBITDA was<br />
US$150.6 million, while EBITDA margin was about 27%.<br />
Description of business<br />
Izhora Pipe Mill produces pipes with a diameter of 610-1,420 mm,<br />
and a thickness of 14-40 mm. The pipes are covered with a threelayer<br />
polymer coating on the outside, and smooth or anti-corrosion<br />
coating on the inside. The mill is capable of producing pipes of<br />
up to 18.3 metres length, which are unique by Russian standards<br />
(the standard length being 12 metres). Extended-length pipes<br />
help reduce construction costs, because the number of welded<br />
joints decreases by 1.5 times, accelerating the speed of construction<br />
and improving reliability.<br />
Today, Izhora Pipe Mill manufactures the X70 strength<br />
class pipes, which attract the highest demand. It is capable of<br />
manufacturing large-diameter pipes with a strength class of up to<br />
X100. These products are designed for the construction of trunkoil<br />
and gas pipelines for both onshore and offshore applications.<br />
The mill is located in Kolpino, the industrial zone of St. Petersburg.<br />
It has a well-developed transportation infrastructure (railroad<br />
stations, river and sea ports) and a highly qualified workforce.<br />
It also has a unique competitive advantage – a continuous<br />
production line, which significantly reduces costs. Slabs are<br />
manufactured at <strong>Severstal</strong>’s Cherepovets Steel Mill, and<br />
subsequently rolled into plate on the wide plate mill-5000. The plate<br />
is then delivered to the pipe mill (located in the same site), to be<br />
made into large-diameter pipes. Other Russian pipe producers<br />
have to buy slabs in Russia or abroad, thus increasing their costs<br />
and their dependency on the growing prices of pipe plate.<br />
Izhora Pipe Mill’s other competitive advantages include the<br />
production of extended-length pipes, proximity to the St. Petersburg<br />
transportation hub, and the construction route of the North-<br />
European gas pipeline (Nord Stream project). Nord Stream is one<br />
of the main consumers of the plant’s production.<br />
Strategy<br />
The principal goal of Izhora Pipe Mill is to increase the company’s<br />
market share of large-diameter pipes for the oil and gas industry.<br />
Market conditions<br />
In the next five years, a deficit of large-diameter pipes is forecasted<br />
in Russia, due to the construction of several major pipeline systems.<br />
Main projects:<br />
In 2008, Gazprom begins construction of a new gas pipeline,<br />
Bovanenkovo-Ukhta, as well as continuing construction of the<br />
Nord Stream gas pipeline system. The gas monopoly also plans<br />
construction of a gas pipeline from the Shtokman gas field in the<br />
Barents Sea, as well as construction of the Altai pipeline, to deliver<br />
Russian gas to China.<br />
In 2008, Transneft will continue construction of the first stage<br />
of the East Siberia-Pacific Ocean oil pipeline system, and will begin<br />
supplying the second stage of the project.<br />
In January <strong>2007</strong>, the mill started full-scale production for its<br />
first orders from Gazprom. In the second half of the year, the plant<br />
reached its design capacity of up to 11 pipes per hour, and the<br />
total volume of product shipments for the year amounted to<br />
299,000 tonnes. The mill employed a total of 1,046 people in<br />
<strong>2007</strong>, an increase of some 70% from 2006 due to successfully<br />
increasing production.<br />
<strong>Severstal</strong> <strong>Annual</strong> <strong>Report</strong> <strong>2007</strong> 55
Business review<br />
Key performance indicators<br />
<strong>2007</strong><br />
Production of pipes (Thousand tonnes) 299<br />
Revenue (US$ million) 550.7<br />
Gross profit (US$ million) 170.9<br />
Profit from operations (US$ million) 127.1<br />
Operating margin (%) 23.1<br />
EBITDA (US$ million) 150.6<br />
EBITDA per tonne (US$/tonne) 501<br />
EBITDA margin (%) 27.3<br />
Average product price (US$/tonne) 1,764<br />
Sales and marketing<br />
Izhora Pipe Mill’s priority sales target is the Russian domestic<br />
market. In <strong>2007</strong>, the plant sold 95.4% of its total output in Russia.<br />
Export accounted for 4.6% of sales, with deliveries going to<br />
Uzbekistan. The principal consumers of the plant’s products are<br />
Russia’s gas and oil industries.<br />
Gazprom is the principal client, accounting for almost 65%<br />
of shipments, or 195,231 tonnes. The mill also delivered 60,000<br />
tonnes of pipes for the construction of a trunk gas pipeline from<br />
Novatek’s Yurkharovsky field, and another 15,000 tonnes of pipes<br />
for the construction of East Siberia-Pacific Ocean oil pipeline<br />
system (which Transneft is building). 16,000 tonnes of pipes<br />
were exported to Uzbekistan.<br />
The mill has all the necessary certificates confirming the<br />
quality of the plant’s products. At the end of <strong>2007</strong>, the enterprise<br />
successfully completed a certification procedure for its products’<br />
compliance with the Det Norske Veritas (DNV) offshore pipeline<br />
quality standard.<br />
Capital investments<br />
In <strong>2007</strong>, capital investments totalled US$23 million – 82% less<br />
than in 2006. The reduction was mainly because we finished<br />
constructing the plant’s principal facilities.<br />
Costs<br />
Total <strong>2007</strong> costs amounted to US$379.8 million, 87.4% of which<br />
was raw materials. Depreciation costs were 6% of the total, and<br />
labour costs were 4.7%.<br />
Cost of sale structure<br />
<strong>2007</strong><br />
US$ % of<br />
million Total<br />
Materials<br />
Plate 296.1 78.0<br />
Other materials 35.9 9.4<br />
Total materials 332.0 87.4<br />
Energy<br />
Natural gas 0.1 0.0<br />
Electric power 1.8 0.5<br />
Other energy resources 0.3 0.1<br />
Total energy 2.2 0.6<br />
Staff costs 17.8 4.7<br />
Depreciation and amortisation 22.8 6.0<br />
Services 2.3 0.6<br />
Other 2.7 0.7<br />
Total 379.8 100<br />
56 <strong>Severstal</strong> <strong>Annual</strong> <strong>Report</strong> <strong>2007</strong>
<strong>Severstal</strong> on the<br />
capital markets<br />
Share capital structure<br />
GDR holders by geography<br />
A.Mordashov 82.37%<br />
Institutional<br />
investors and<br />
employees 17.63%<br />
UK & Ireland 43%<br />
Continental Europe 20%<br />
North America 17%<br />
Russia 4%<br />
Other 16%<br />
Share capital<br />
Our share capital consists of 1,007,701,355 shares, with a nominal<br />
value of 0.01 roubles each, which equals 10,077,013.55 roubles.<br />
No additional shares were issued in <strong>2007</strong>.<br />
As of 1 January 2008, 82.37% of our share capital<br />
was directly or indirectly controlled by CEO Alexey Mordashov.<br />
<strong>Severstal</strong>’s institutional investors and employees own the<br />
remaining 17.63%.<br />
Global Depositary Receipts<br />
Sponsored Global Depositary Receipts (GDRs) were issued under<br />
the Reg S and 144A rules. One receipt corresponds to the rights<br />
provided by one regular share. Deutsche Bank Trust Company,<br />
Americas, is the depositary bank, while Deutsche Bank, Moscow,<br />
LLC performs custodian banking functions.<br />
As of 31 December <strong>2007</strong>, 89,220,129 shares, or 8.85% of<br />
the charter capital, were converted into GDRs.<br />
GDR and share price<br />
<strong>Severstal</strong>’s shares and GDRs demonstrated impressive growth<br />
in <strong>2007</strong>, exceeding the benchmark rates of RTS index growth.<br />
GDR and share prices more than doubled over the course of the<br />
year, and our capitalisation grew by 108% – amounting to<br />
US$23.38 billion as of 31 December <strong>2007</strong> (share price of US$23.20<br />
at LSE).<br />
In Russia, our underlying shares are traded on the RTS and on<br />
MICEX stock exchanges. Overseas, they’re traded in the form of<br />
depositary receipts, on the London Stock Exchange and via the<br />
PORTAL trading system in the US.<br />
In March <strong>2007</strong>, <strong>Severstal</strong> shares were included in the<br />
authoritative MSCI Emerging Markets and MSCI Russia indices.<br />
This serves as independent confirmation of the high level of<br />
liquidity of <strong>Severstal</strong>’s stock, and underlines the company’s place<br />
in the aggregate capitalisation of the Russian market.<br />
GDR characteristics<br />
International<br />
Aggregate figures for exchange-traded <strong>Severstal</strong> shares<br />
Type of identification Trading<br />
and GDR turnover for <strong>2007</strong><br />
receipt number, ISIN CUSIP bourses Trading Trading code Turnover, Turnover,<br />
Reg S/<br />
London Stock bourse of the share US$ million millions of shares<br />
sponsored US8181501045 818150302 Exchange (LSE) MICEX CHMF 1,871* 109<br />
144A/<br />
sponsored US8181503025 818150104 PORTAL<br />
RTS<br />
LSE<br />
CHMF<br />
SVST<br />
144<br />
2,937<br />
9<br />
168<br />
Total 4,952 286<br />
*<strong>2007</strong> average nominal exchange rate: 25.58 roubles/one US dollar, Bank of Russia.<br />
<strong>Severstal</strong> <strong>Annual</strong> <strong>Report</strong> <strong>2007</strong> 57
Business review<br />
Dividends, <strong>2007</strong><br />
Dividends<br />
Starting<br />
Record Ex- dividend per share date for<br />
Period date date (roubles) payments<br />
Interim dividends 18 May 18 May 5 July<br />
for 3 months <strong>2007</strong> <strong>2007</strong> <strong>2007</strong> 2.6 <strong>2007</strong><br />
Interim dividends 20 August 20 August 3 October<br />
for 6 months <strong>2007</strong> <strong>2007</strong> <strong>2007</strong> 10.0 <strong>2007</strong><br />
Interim dividends 14 November 14 November 20 December<br />
for 9 months <strong>2007</strong> <strong>2007</strong> <strong>2007</strong> 2.5 <strong>2007</strong><br />
Dividends 15 May 15 May 3 July<br />
for 12 months <strong>2007</strong> 2008 2008 4.0 2008<br />
Dividend policy:<br />
– Dividend payments are made on a quarterly basis<br />
– Satisfactory annual profits are the preliminary condition for<br />
dividend payment<br />
– In determining the size of annual dividends we take into account<br />
the cyclical characteristics of the industry. The size of dividends<br />
can change depending on the volume of net profits and the<br />
company’s cash flow<br />
– In the medium term, the company foresees dividend payments<br />
of no less than 25% of net profits received at the end of the<br />
reporting period, calculated under IFRS<br />
– In the long term, the company has the right to increase the size<br />
of the dividend payments provided that the condition that<br />
capital expenditure requirements are met<br />
– The company has the right to decide to pay out interim dividends,<br />
provided that it is in a financially stable condition at the time.<br />
Bonds<br />
In <strong>2007</strong>, <strong>Severstal</strong> fully redeemed its first rouble-denominated bond<br />
issue, worth 3 billion roubles, which was placed in 2003. There are<br />
currently two 2004 Eurobond issues on the market, and the<br />
Eurobonds profitability tracks the market. In the first half of <strong>2007</strong>,<br />
yield to maturity declined slightly, reflecting the growth of the<br />
issuer’s reliability. In the second half of the year, the trend<br />
reversed, as the capital markets in general (and the debt<br />
markets in particular) became more unstable.<br />
Eurobond credit ratings<br />
During <strong>2007</strong>, the principal rating agencies upgraded the credit<br />
ratings of <strong>Severstal</strong> bonds, confirming the company’s high level of<br />
reliability. Standard & Poor’s upgraded <strong>Severstal</strong> Eurobonds to BB<br />
(with a stable forecast), while Moody’s upgraded the bonds to Ba2<br />
(stable forecast). Fitch did not review ratings in <strong>2007</strong>.<br />
Standard Fitch Moody’s<br />
& Poor’s<br />
<strong>Severstal</strong>-2009 BB – Ba2<br />
<strong>Severstal</strong>-2014 BB BB– Ba2<br />
58 <strong>Severstal</strong> <strong>Annual</strong> <strong>Report</strong> <strong>2007</strong>
Eurobond issues<br />
Interest Date Date of Sum of issue, Lead Form<br />
Issue rate of issue redemption US$ manager of issue<br />
Citigroup<br />
Loan<br />
24 February 24 February Global Markets Participation<br />
<strong>Severstal</strong>-2009 8.625% 2004 2009 325 million Limited Notes<br />
Citigroup<br />
Loan<br />
19 April 19 April Global Markets Participation<br />
<strong>Severstal</strong>-2014 9.25% 2004 2014 375 million Limited Notes<br />
<strong>Severstal</strong> versus RTS Index %<br />
25<br />
20<br />
SVST<br />
RTS Index<br />
US$23.2<br />
US$22.65<br />
US$<br />
15<br />
10<br />
US$11.05<br />
2,291<br />
RTS Index<br />
2,064<br />
RTS Index<br />
5<br />
1,779<br />
RTS Index<br />
0<br />
02.01.07<br />
01.02.07<br />
01.03.07<br />
02.04.07<br />
01.05.07<br />
01.06.07<br />
02.07.07<br />
01.08.07<br />
03.09.07<br />
01.10.07<br />
01.11.07<br />
03.12.07<br />
02.01.08<br />
01.02.08<br />
03.03.08<br />
01.04.08<br />
Share price and turnover on MICEX<br />
700<br />
<strong>Severstal</strong> (CHMF), roubles<br />
Turnover, roubles mln<br />
1,200<br />
600<br />
1,000<br />
500<br />
400<br />
300<br />
200<br />
800<br />
600<br />
400<br />
100<br />
200<br />
0<br />
0<br />
09.01.07<br />
01.02.07<br />
01.03.07<br />
02.04.07<br />
02.05.07<br />
01.06.07<br />
02.07.07<br />
01.08.07<br />
03.09.07<br />
01.10.07<br />
01.11.07<br />
03.12.07<br />
09.01.08<br />
01.02.08<br />
03.03.08<br />
01.04.08<br />
roubles<br />
roubles millions<br />
<strong>Severstal</strong> <strong>Annual</strong> <strong>Report</strong> <strong>2007</strong> 59
Business review<br />
GDR price and stock turnover on the London Stock Exchange<br />
30<br />
<strong>Severstal</strong> (SVST), US$<br />
Turnover, US$ mln<br />
100<br />
25<br />
80<br />
20<br />
15<br />
10<br />
5<br />
0<br />
60<br />
40<br />
20<br />
0<br />
02.01.07<br />
01.02.07<br />
01.03.07<br />
02.04.07<br />
01.05.07<br />
01.06.07<br />
02.07.07<br />
01.08.07<br />
03.09.07<br />
01.10.07<br />
01.11.07<br />
03.12.07<br />
US$<br />
02.01.08<br />
01.02.08<br />
03.03.08<br />
01.04.08<br />
US$ millions<br />
YTM %<br />
9.0<br />
7.5<br />
6.0<br />
4.5<br />
3.0<br />
1.5<br />
0<br />
<strong>Severstal</strong>-2009<br />
<strong>Severstal</strong>-2014<br />
02.01.07<br />
01.02.07<br />
01.03.07<br />
01.04.07<br />
01.05.07<br />
01.06.07<br />
01.07.07<br />
01.08.07<br />
01.09.07<br />
01.10.07<br />
01.11.07<br />
01.12.07<br />
0101.08<br />
01.02.08<br />
01.03.08<br />
01.04.08<br />
60 <strong>Severstal</strong> <strong>Annual</strong> <strong>Report</strong> <strong>2007</strong>
Corporate social<br />
responsibility<br />
Our corporate social responsibility<br />
objectives are built on open dialogue<br />
with all our stakeholders: our investors,<br />
employees, people living in the regions<br />
where we operate, and society as a whole.<br />
We work with people and local communities and we<br />
understand that long-term economic and financial success<br />
is only possible under conditions of social stability and<br />
partnership. Our social and charity projects are intended<br />
to achieve these goals.<br />
In <strong>2007</strong>, our corporate social responsibility (“CSR”) activities<br />
covered the following areas:<br />
– Health and safety<br />
– Environmental protection<br />
– Social programmes<br />
– Charity.<br />
Last year we paid special attention to health and safety across all<br />
of our operations, especially in our Mining segment.<br />
Our environmental protection initiative focused on the Clean<br />
City environmental initiative at our Cherepovets Steel Mill.<br />
We introduced various new charity initiatives in <strong>2007</strong>, including<br />
competitive technologies in the distribution of charity funds.<br />
The grant competition within our Museums of the Russian North<br />
charity programme is just one example of this approach. In <strong>2007</strong>,<br />
for the first time we presented integrated data on our social and<br />
charity investments – a step on the way to forming a single system<br />
of CSR management. It helped to objectively evaluate the results of<br />
our activities, define our priorities clearly and develop suggestions<br />
for managing social projects more effectively. The total of our<br />
social and charity investments in <strong>2007</strong> was US$83.8 million,<br />
which is 64.4% more than in 2006.<br />
Health and safety<br />
Health and safety are of utmost importance at all stages of our<br />
production activities: from the extraction of coal and ore, the<br />
production of coke and smelting of cast iron and steel to the<br />
manufacturing of hi-tech metal products and metalware.<br />
Each year we organise a professional evaluation of<br />
approximately 1,000 engineering devices, buildings and structures<br />
in order to determine their technical conditions and to take into<br />
account specific conditions of operation. In <strong>2007</strong>, 1,115 objects<br />
were evaluated. When organising and planning these repairs,<br />
we use the recommendations of independent experts from<br />
Cherepovets, Moscow, St. Petersburg and other Russian regions.<br />
Lucchini Group and SNA follow the same process with local<br />
experts.<br />
In 2006, the administration and the trade union of Cherepovets<br />
Steel Mill created the Safety Committee. In <strong>2007</strong>, the committee,<br />
acting alongside divisional heads, developed special task<br />
programmes, taking into account specific conditions and root<br />
causes of work-related incidents. Starting from 1 January <strong>2007</strong>,<br />
Cherepovets Steel Mill introduced a new standard of Safe<br />
maintenance, which has helped to decrease the number of injuries<br />
on the way to and from work sites from 23% in 2006 to 12% in<br />
<strong>2007</strong> of the total injuries.<br />
In <strong>2007</strong>, our Mining segment continued to implement its Safety<br />
for All programme, unique in its scale and number of participants.<br />
A good measure of its effectiveness is the stable reduction of the<br />
overall numbers of accidents at the segment. In <strong>2007</strong>, the Lost<br />
Time Incident Frequency Rate has decreased by 42% from the<br />
previous year. The same indicator for Russian Steel saw a 17%<br />
reduction, while Metalware achieved an 11% decrease.<br />
Environmental protection<br />
OAO <strong>Severstal</strong> is focused on implementing the international and<br />
Russian environment standards and legal requirements, and<br />
employs various environmental protection programmes. Each of<br />
our businesses develops their own plans to mitigate environmental<br />
risks by using modern technologies and modernising equipment.<br />
In <strong>2007</strong>, Cherepovets Steel Mill modernised dust collection<br />
systems in its sintering production. In 2008 this project will reduce<br />
annual dust emissions by 700 tonnes.<br />
Cherepovets has also been successful in energy saving.<br />
The Complex energy-saving programme has conserved<br />
326 million kilowatt-hours of electricity and 12,400 tonnes<br />
of fuel equivalent for the year. Additionally, Cherepovets Steel<br />
Mill has achieved the highest index of water re-use among all<br />
Russian steel companies through the in-plant recycling system:<br />
in <strong>2007</strong> this indicator amounted to 98%.<br />
Cherepovets Steel Mill also initiated the Clear City programme.<br />
Its goal is to improve the environment in Cherepovets through<br />
activities based on local community initiatives, and was supported<br />
by dozens of the city’s businesses. Last year the programme’s<br />
participants included the plant’s employees and local community<br />
<strong>Severstal</strong> <strong>Annual</strong> <strong>Report</strong> <strong>2007</strong> 61
Business review<br />
Lost Time Incident Frequency Rate<br />
42%<br />
decrease based on 2006 figures<br />
Investment in environmental<br />
protection<br />
U$111.5 m<br />
representatives, children, educational institutions and honorary<br />
guests of the city.<br />
Olkon, part of the Mining segment, developed a project for<br />
restoring lands disturbed during the production technological<br />
cycle. The project is expected to be complete by 2015. In the<br />
next two years the plant plans to anchor dust-forming surfaces<br />
with an area of 180 hectares, thereby significantly reducing gross<br />
dust emissions.<br />
In <strong>2007</strong>, Vorkutaugol continued its unique project for using<br />
mine gas. It will result in safer coal mining and in reduced<br />
output of greenhouse gases, as well as having a significant<br />
energy-saving effect.<br />
The principal project at <strong>Severstal</strong> North America was<br />
modernising the C-Blast Furnace. Thanks to the ultramodern<br />
technologies that were used for its construction, C-Blast Furnace is<br />
one of the most efficient, productive and environmentally friendly<br />
furnaces in the world. The new cast house will catch dispersion<br />
particles more effectively, thus significantly improving environmental<br />
conditions in the vicinity of the business’s operations.<br />
In <strong>2007</strong>, the Progetto Ambiente programme was introduced<br />
at Lucchini’s Piombino plant. The programme is intended to<br />
improve environmental conditions at the plant and in its<br />
surrounding area.<br />
In <strong>2007</strong>, <strong>Severstal</strong> invested a total of US$111.5 million on<br />
environmental protection.<br />
Social programmes<br />
We believe we have a duty to contribute to the development of<br />
communities and regions where we have a presence. The majority<br />
of our businesses are local economic mainstays, forming a<br />
significant part of the regional budgets, providing work for a large<br />
share of the local population and playing an important role in the<br />
socio-economic life of their regions.<br />
In <strong>2007</strong>, as in previous years, our social activity was<br />
concentrated in areas that are important for the local<br />
communities and the workforces of our businesses: training<br />
and personnel development, investments in social infrastructure,<br />
creation of a favourable environment in the towns and regions<br />
of the company’s presence, medical services, support of<br />
families, pensioners and people with low incomes as well<br />
as residential development.<br />
In the course of <strong>2007</strong>, Russian Steel implemented a number<br />
of programmes to improve the quality of medical services and<br />
strengthen employees’ health. A complex approach to the<br />
occupational illnesses and diseases together with the early<br />
diagnosis and treatment for Cherepovets Steel Mill employees<br />
allowed us to reduce the number of diseases by 3.9% in<br />
comparison with 2006.<br />
In 2006, <strong>Severstal</strong> introduced the Corporate housing<br />
programme. Cherepovets Steel Mill continued to build houses for<br />
its employees. We have already built nine residential buildings<br />
with 778 apartments (a total floorspace of 43,617 square metres).<br />
The project involves the phase-by-phase construction of 24<br />
residential buildings, and should be complete by 2009.<br />
In <strong>2007</strong>, Lucchini became a partner of the Casa Famiglia<br />
social project that engages in housing development and support<br />
for people with disabilities.<br />
Education<br />
Our development as an international integrated company is<br />
placing new demands on the preparation of staff – there is a<br />
need to work in a multicultural environment, correspond to high<br />
international standards and form a unified culture of business<br />
management. We therefore aim to unite our personnel’s talents<br />
and initiatives with progressive technologies and the ambitious<br />
aspirations of a global company.<br />
In <strong>2007</strong>, our priority for education and development was<br />
to introduce management training programmes aimed to help<br />
prepare managers for working in an international company.<br />
The result was the introduction of the Global Leadership<br />
Programme. The second area of key managers’ development<br />
was the continuing education through an MBA programme.<br />
In addition to this, we continue to run various training<br />
programmes. These include the “Top 100 Programme” for the<br />
preparation of medium-level managers, and “Talent Pool”, for<br />
the discovery and development of young employees with great<br />
leadership potential. We also have inter-segmental programmes<br />
for the managers and young employees, which help to promote<br />
horizontal links for joint projects and foster a common business<br />
language. They also instil the ability to take our corporate interests<br />
into account, whether for projects and management decisions or<br />
co-operation with partners, clients and suppliers.<br />
62 <strong>Severstal</strong> <strong>Annual</strong> <strong>Report</strong> <strong>2007</strong>
Clockwise from above:<br />
We have sponsored the Mariisky Theatre since<br />
2003 and joined its charity board in 2005.<br />
We have forged close links with Newcastle<br />
Business School and sponsored many <strong>Severstal</strong><br />
employees through MBAs.<br />
Our sponsorship of the Detroit Institute of Arts<br />
continues our tradition of supporting art and<br />
culture in the regions where we operate.<br />
Recently modernised, <strong>Severstal</strong> Dearborn’s<br />
“C” Blast Furnace utilises state-of-the-art<br />
technologies that make it among the most<br />
environmentally friendly blast furnaces in<br />
the world.<br />
The health and safety of our employees<br />
remains one of our fundamental priorities.<br />
Personnel training expenditures in <strong>Severstal</strong> segments<br />
Number of<br />
people who Educational Educational<br />
participated expenses, expenses per<br />
in training US$ million person, US$<br />
Russian Steel 33,971 6.70 196.1<br />
Mining 13,087 2.10 163.5<br />
Metalware* 4,196 0.38 90.4<br />
Lucchini Group 7,167 3.30 454.9<br />
<strong>Severstal</strong><br />
North America 2,153 2.70 1,254.1<br />
*Does not include educational expenses at Dneprometiz JSC and Carrington Wire Ltd.<br />
Charity<br />
We continued our traditional charity work throughout <strong>2007</strong>.<br />
Highlights included the preservation of historical and cultural<br />
heritage, support for modern culture and children’s organisations,<br />
and promotion of sports.<br />
Over the course of the last several years, we have co-operated<br />
with Russia’s leading theatres and museums. In <strong>2007</strong>, for<br />
example, we helped to implement several exciting artistic projects<br />
in the Tretyakov Gallery and Bolshoi Theatre, and participated in a<br />
new charity project in the US.<br />
The eight-year co-operation between <strong>Severstal</strong> and the<br />
Bolshoi Theatre continued in <strong>2007</strong>, with the staging of the<br />
‘Corsair’ ballet. This performance became a hallmark, both for<br />
Russia’s cultural life and for global theatre arts.<br />
In October <strong>2007</strong>, we served as the partner for the concert<br />
in the memory of Mstislav Rostropovich, which took place in<br />
Frankfurt am Main. The cash funds contributed by the patrons and<br />
sponsors of the concert went to the Rostropovich Cello Fund, which<br />
was founded by the musician to support young cello players.<br />
Two months later, we announced our sponsorship of the<br />
Detroit Institute of Arts – the next chapter in our continuing<br />
tradition of supporting culture and the arts throughout the<br />
regions we work in, and promoting Russia’s historical and<br />
cultural heritage abroad.<br />
<strong>2007</strong> also saw us decide to undertake a more professional<br />
approach to the management of charity projects. For example, we<br />
introduced competition mechanisms for grants, and developed<br />
co-operation with experts and professional charity organisations.<br />
The successful launch of the “Museums of the Russian North”<br />
programme – a continuation of our co-operation with the Russian<br />
branch of the British charity fund “Charities Aid Foundation”<br />
(CAF Russia) – was a result of this. In June <strong>2007</strong>, as part of this<br />
programme, we announced a grant competition between the<br />
museums of the 12 regions of the Russian north west, with a total<br />
budget of around 9 million roubles. This competition has been<br />
recognised as the country’s largest charity project in support of<br />
provincial art museums.<br />
In the course of <strong>2007</strong>, we also continued to implement the<br />
“Road Back Home” programme in the city of Cherepovets, aimed<br />
at offering a comprehensive solution to the issues of children’s<br />
homelessness and neglect.<br />
Support of sports also occupies an important place in our<br />
charitable activities. We aim to encourage healthy living among<br />
our employees (and members of their families), and support the<br />
development of various athletic activities.<br />
Cherepovets Steel Mill annually funds the maintenance of the<br />
city’s athletic facilities. These include Almaz athletic complex –<br />
with an ice rink, two football fields, tennis courts, volleyball and<br />
basketball courts, and track-and-field facilities. About 170 health<br />
groups are active at these facilities. In <strong>2007</strong>, they were regularly<br />
attended by more than 4,700 employees (a growth of 7.6% on<br />
2006), and more than 20,000 people took part in various athletic<br />
competitions throughout the year.<br />
We also traditionally sponsor the <strong>Severstal</strong> hockey team, and<br />
support the Dynamo women’s volleyball club and the Russian<br />
Chess Federation.<br />
<strong>Severstal</strong>’s commitment to Corporate Social Responsibility<br />
will continue in 2008. We plan to fully take into account the interests<br />
of all stakeholders, to use the most effective and competitive<br />
management technologies, proven by the best global practices,<br />
and to guarantee the openness and availability of information<br />
about our social investments.<br />
<strong>Severstal</strong> <strong>Annual</strong> <strong>Report</strong> <strong>2007</strong> 63
Governance<br />
Board of Directors<br />
Top left to right:<br />
Christopher Clark<br />
Alexey Mordashov<br />
Martin Angle<br />
Ronald Freeman<br />
Anatoly Kruchinin<br />
Peter Kraljic<br />
Vadim Makhov<br />
Mikhail Noskov<br />
Rolf Stomberg<br />
Vadim Shvetsov<br />
64 <strong>Severstal</strong> <strong>Annual</strong> <strong>Report</strong> <strong>2007</strong>
Christopher Clark<br />
Independent Chairman of the Board of<br />
Directors, Member of the Nomination<br />
and Remuneration Committee<br />
Chris Clark, 66, is a leading industrialist<br />
and brings extensive business knowledge<br />
to the Board. Chris’s career spans 40 years<br />
at Johnson Matthey plc, the specialty<br />
chemicals and precious metals Group,<br />
where he became Chief Executive in 1998.<br />
He led the Group into the FTSE 100 in<br />
2002. Since his retirement in 2004, Chris<br />
has taken a number of non-executive<br />
positions. He currently chairs: Associated<br />
British Ports; Urenco Limited, the leading<br />
international supplier of enriched<br />
uranium to the power generating<br />
industry; and Wagon plc, the European<br />
manufacturer of metal components<br />
for the automobile industry. Chris is a<br />
graduate in metallurgy; he studied at<br />
Trinity College, Cambridge and Brunel<br />
University, London.<br />
Alexey Mordashov<br />
CEO, <strong>Severstal</strong>,<br />
Member of Nomination and<br />
Remuneration Committee<br />
Alexey Mordashov, 42 , has worked for<br />
<strong>Severstal</strong> since 1988. He started his career<br />
as a senior shop economist, becoming<br />
Chief Financial Officer in 1992. In<br />
December 1996, he was appointed as<br />
<strong>Severstal</strong>’s Chief Executive Officer. In<br />
June 2002, he was also elected Chairman<br />
of <strong>Severstal</strong>’s Board of Directors. Alexey is<br />
a graduate of the Leningrad Engineering<br />
and Economics Institute and holds an<br />
MBA degree from Newcastle Business<br />
School of Northumbria University<br />
(Newcastle, UK).<br />
Martin Angle<br />
Independent Director,<br />
Chairman of the Audit Committee<br />
Martin Angle, 57, holds a number of<br />
non-executive directorships in addition<br />
to JSC <strong>Severstal</strong>, including Savills plc, a<br />
leading international property adviser;<br />
Dubai International Capital LLC; the<br />
Chairmanship of The National Exhibition<br />
Group in the UK; and the Chairmanship<br />
of Celerant Consulting, a leading<br />
international, operational management<br />
consultancy. He also sits on the Board<br />
of the Warwick Business School and the<br />
Governing Council of the University of<br />
Warwick. During his career, Martin has<br />
held senior executive positions in<br />
investment banking, industry and most<br />
recently private equity, where he was an<br />
Operational Managing Director of Terra<br />
Firma Capital Partners and a director of<br />
various of its portfolio companies. This<br />
includes the Waste Recycling Group, the<br />
largest end disposer of waste in the UK<br />
where he was Executive Chairman;<br />
and Le Méridien hotel group, where he<br />
was Deputy Chairman. Prior to that,<br />
Martin was for a number of years the<br />
Group Finance Director of TI Group plc,<br />
a specialised engineering company in<br />
the UK FTSE 100 with activities in over<br />
50 countries. Before that, he spent<br />
20 years working in investment banking,<br />
where he held a number of senior<br />
positions with SG Warburg & Co Ltd,<br />
Morgan Stanley and Dresdner Kleinwort<br />
Benson. Martin is a graduate in physics,<br />
a Chartered Accountant, a Member of<br />
the Securities Institute and a Fellow of<br />
the Royal Society of Arts.<br />
Ronald Freeman<br />
Independent Director,<br />
Member of the Audit Committee<br />
Ronald Freeman, 68, is a member of the<br />
Board of Directors, a Consulting Partner<br />
and stockholder of the Moscow-based<br />
Troika Dialog investment bank. He is also<br />
a member of the Supervisory Board and<br />
the Human Resources Committee of<br />
truck manufacturer, KAMAZ, a member<br />
of the board of directors of Volga Gas,<br />
a member of the Executive Committee<br />
of the Atlantic Council, and a member of<br />
the board of directors of Polish Telecom.<br />
He is a member of the International<br />
Advisory Committee of Columbia Law<br />
School and the Development Committee<br />
of Mansfield College (Oxford, UK).<br />
Between 1991 and 1997, Ronald was<br />
Head of the Banking Department of<br />
the European Bank for Reconstruction<br />
and Development (EBRD). He was<br />
responsible for debt and equity financing<br />
in the private sector in 23 countries of the<br />
former Soviet Union, with a total annual<br />
funds commitment of Euro 2 billion. Prior<br />
to that, Ronald was vice-chairman of<br />
Citigroup European investment banking<br />
and a general partner of Salomon<br />
Brothers. Ronald holds a BA degree<br />
from Lehigh University, and an LLB<br />
from the Law School of Columbia<br />
University. He was admitted to the<br />
New York Bar.<br />
Anatoly Kruchinin<br />
CEO, Cherepovets Steel Mill<br />
Anatoly Kruchinin, 47, began his career<br />
at <strong>Severstal</strong> in 1982. In 1993, he became<br />
Chief Power Engineer and in March<br />
1999, he was made Commercial Director.<br />
From 2002, Anatoly worked as Executive<br />
Director of <strong>Severstal</strong>, becoming the<br />
company’s CEO later in 2002. Since 2006,<br />
he has been Chief Executive<br />
Officer of Cherepovets Steel Mill. Anatoly<br />
is a graduate of the Ivanovo Power<br />
Engineering Institute and holds an MBA<br />
degree from National Economic Academy<br />
under the Government of Russia.<br />
Peter Kraljic<br />
Independent Director,<br />
Member of the Audit Committee<br />
Peter Kraljic, 68, is a Director Emeritus at<br />
McKinsey, where he spent 32 years and<br />
held a number of senior positions until<br />
his retirement in 2002. Focused mainly<br />
on industrial clients in the chemicals,<br />
pharmaceuticals, automotive assembly,<br />
and steel and aluminium sectors, he was<br />
also a member of McKinsey’s Personnel<br />
Development Committee and has<br />
managed the company’s activities in<br />
France as a General Director. Peter has<br />
also written a number of scientific and<br />
business articles for publications such<br />
as the Harvard Business Review and<br />
Le Figaro Economic. He has also recently<br />
led special projects aimed at economic<br />
growth and job creation in Germany and<br />
Brazil. Peter graduated from the University<br />
of Ljubljana, Slovenia (Faculty of<br />
Metallurgy), and Polytechnic University<br />
in Hannover, Germany. He also holds a<br />
Masters degree in business management<br />
from the INSEAD business school, France.<br />
Vadim Makhov<br />
Chairman, <strong>Severstal</strong> North America,<br />
Vice Chairman, Lucchini<br />
Vadim Makhov, 35, has worked at<br />
<strong>Severstal</strong> since 1994 as Deputy Head<br />
of the Economic Research Laboratory<br />
and Head of <strong>Severstal</strong>’s Strategic<br />
Department. From June 2002, Vadim<br />
served as Deputy Chief Executive Officer<br />
of the <strong>Severstal</strong> Group. Since 2004,<br />
he has been Chairman of the Board<br />
of Directors of <strong>Severstal</strong> North America,<br />
and Deputy Chief Executive Officer of<br />
<strong>Severstal</strong> Group for Strategy and<br />
Business Development. In <strong>2007</strong>, he<br />
was also appointed as Deputy Chief<br />
Executive Officer of <strong>Severstal</strong> for Strategy<br />
and Business Development. Vadim is<br />
a graduate of the State Management<br />
Academy named after Sergo<br />
Ordzhonikidze, and holds an MBA<br />
degree from Newcastle Business<br />
School of Northumbria University<br />
(Newcastle, UK).<br />
Mikhail Noskov<br />
CFO, <strong>Severstal</strong><br />
Mikhail Noskov, 44, worked at the<br />
International Moscow Bank between<br />
1989 and 1993. From 1994, he was<br />
Trade Finance Director of Credit Suisse<br />
(Moscow). He has worked for <strong>Severstal</strong><br />
since February 1997 as Head of Corporate<br />
Finance and from 1998 as Finance and<br />
Economics Director. In June 2002, he<br />
was made Deputy CEO for Finance and<br />
Economics of the <strong>Severstal</strong> Group, and<br />
in January <strong>2007</strong>, he was appointed<br />
Deputy CEO for Finance and Economics<br />
of <strong>Severstal</strong>. Mikhail graduated from<br />
the Moscow Institute of Finance.<br />
Rolf Stomberg<br />
Senior Independent Director,<br />
Chairman of the Nomination and<br />
Remuneration Committee<br />
Rolf Stomberg, 67, is Chairman of the<br />
Supervisory Board of LANXESS AG, a<br />
global chemical company which was<br />
formed after reorganisation of Bayer<br />
AG. He is Senior Independent Director<br />
of the UK-Netherlands Publishing and<br />
information group Reed Elsevier Plc,<br />
and of medical equipment producer<br />
Smith & Nephew Plc. He is also a member<br />
of the Supervisory Board of TNT NV,<br />
and Chairman of the Management<br />
Consulting Group Plc. His executive<br />
career was with BP (British Petroleum)<br />
where he held the position of Managing<br />
Director and CEO of BP’s downstream<br />
business on the main Board of the<br />
company. Rolf is an economics<br />
graduate from Hamburg University.<br />
Vadim Shvetsov<br />
Executive Director<br />
Vadim Shvetsov, 40, has worked at<br />
the Cherepovets Steel Mill since 1986.<br />
Between 1993 and 1996, he worked for<br />
<strong>Severstal</strong>-Invest as Commercial Director<br />
and, later, as Chief Executive Officer.<br />
From 1996 to 2000, Vadim served as<br />
deputy of the Cherepovets City Council.<br />
In 1997, he became Head of <strong>Severstal</strong>’s<br />
Sales Department. From 2002, he<br />
combined the positions of First Deputy<br />
CEO of <strong>Severstal</strong> Group and CEO of<br />
<strong>Severstal</strong>-Auto. In March 2002, he<br />
became CEO of <strong>Severstal</strong>-Auto, and<br />
in January <strong>2007</strong>, he was appointed<br />
Deputy Director of the Metalware<br />
segment. Vadim is a graduate of the<br />
Cherepovets Wood Processing Technical<br />
School, and the Moscow Institute of Steel<br />
and Alloys. He also holds an MBA degree<br />
from Newcastle Business School of<br />
Northumbria University (Newcastle, UK).<br />
<strong>Severstal</strong> <strong>Annual</strong> <strong>Report</strong> <strong>2007</strong> 65
Governance<br />
Board of Directors’ report<br />
Introduction<br />
<strong>Severstal</strong> closely monitors corporate governance best practice.<br />
In October 2006, the company published its Corporate<br />
Governance Code. This has been approved by the Board,<br />
demonstrating its active participation in the corporate<br />
governance of the company.<br />
The Board<br />
The Board has 10 members, comprising a Non-executive<br />
Chairman, four other Non-executive Directors and five Executive<br />
Directors. The proportion of Independent Directors is<br />
unprecedented for Russian companies, as are the special rules<br />
for voting on strategically important issues, which guarantee<br />
equal concern for the interests of all the company shareholders.<br />
The Board considers all the Non-executive Directors to be<br />
independent for the purposes of the Combined Code.<br />
Board meetings and attendance<br />
The attendance by individual Directors at meetings of the Board<br />
and its committees in <strong>2007</strong> was as follows:<br />
Members of<br />
Nomination and<br />
the Board Board Audit Remuneration<br />
of Directors <strong>Severstal</strong> Committee Committee<br />
No. <strong>Severstal</strong> (8 meetings)** (5 meetings) (3 meetings)<br />
1 Christopher Clark 8 5* 3<br />
2 Ronald Freeman 8 5 3*<br />
3 Peter Kraljic 8 5 3*<br />
4 Martin Angle 8 5 3*<br />
5 Rolf Stomberg 8 5* 3<br />
6 Alexey Mordashov 8 5* 3<br />
7 Vadim Shvetsov 6 – –<br />
8 Mikhail Noskov 8 5* –<br />
9 Vadim Makhov 8 1* –<br />
10 Anatoly Kruchinin 8 2* –<br />
*Means that the specified Director is not a member of that Committee, although<br />
he attended the meetings at the invitation of the Chairman of the Committee.<br />
**Two of the meetings were held via conference call with circulation of voting ballots<br />
to express the written opinion of the Board members<br />
Role of the <strong>Severstal</strong> Board<br />
<strong>Severstal</strong>’s Board of Directors is responsible for general<br />
management and performance of the company’s operations,<br />
including approving its development strategy and monitoring its<br />
financial and business operations. Our Board’s principal objective<br />
is to run the company in such a manner as to ensure an increase<br />
in value for shareholders in the medium and long term. The Board<br />
bases its decisions on the need to act in the best interests of the<br />
entire company and to be fair to all shareholders. It may not give<br />
preference to the interests of any individual shareholder or group<br />
of shareholders. The Board is also responsible for the proper<br />
functioning of the system for disclosure and dissemination<br />
of information about the company’s operations and for<br />
implementing the company’s information policy.<br />
The Board is authorised to take decisions concerning every<br />
aspect of <strong>Severstal</strong>’s activity, with the exception of matters<br />
referring to the jurisdiction of the General Shareholders’ Meeting.<br />
Key duties:<br />
1. Responsibility for the strategic direction of the company.<br />
2. Review of the consolidated budget and providing appropriate<br />
recommendations.<br />
3. Reviewing the appointment and compensation policy<br />
applicable to the company’s senior executives, including the<br />
CEO, and making recommendations regarding such policy.<br />
4. Dividend policy.<br />
5. Approval of interested parties transactions (as this term is<br />
defined in accordance with Russian Law) with value for each<br />
such transaction not to exceed 2% of the book value of the<br />
company assets at the date of decision to enter into such<br />
transaction.<br />
6. Approval of a transaction if its value exceeds 10% of the book<br />
value of the company assets at the date of decision to enter into<br />
such transaction.<br />
7. Approval of a transaction to acquire (i) shares or participation<br />
interests or rights to manage such shares or participation<br />
interests or (ii) fixed or intangible assets if the amount of the<br />
transaction specified in sub-clauses (i) or (ii) above exceeds the<br />
equivalent of US$500 million.<br />
A resolution on the matters set out in clauses 5 and 6 requires a 2/3<br />
majority vote of the elected members of the Board of Directors.<br />
Corporate Secretary<br />
Oleg Tsvetkov<br />
Oleg, 34, joined <strong>Severstal</strong> in 2000 and in 2004 he was appointed<br />
Senior Manager of Legal Department, responsible for relations<br />
with foreign subsidiaries of <strong>Severstal</strong>, international commercial<br />
projects, joint ventures projects and project financing. In 2006<br />
Oleg was appointed the Corporate Secretary of <strong>Severstal</strong>.<br />
Graduated from the Moscow State Law Academy, holds a PhD<br />
in linguistics and holds an MBA degree from Newcastle Business<br />
School of Northumbria University (Newcastle, UK).<br />
The scope of activities of the Company Secretary Office<br />
includes: Board of Directors activities, preparation and holding of<br />
General Shareholders Meetings and meetings of the Board of<br />
Directors, disclosure of information, corporate governance<br />
advising, shareholders and GDR holders communications as<br />
well as Russian and foreign stock market regulators relations.<br />
The Company Secretary is responsible for ensuring the<br />
company, its management and officers comply with the<br />
applicable law, the Company’s Charter and internal documents.<br />
Board effectiveness<br />
The roles of Chairman and Chief Executive Officer are separate<br />
and their responsibilities are clearly defined in writing and<br />
approved by the Board. The role of the Chairman is to organise,<br />
lead and manage the Board and to convene and preside over<br />
Board meetings. The Chief Executive Officer carries out the<br />
day-to-day management of the company and ensures its efficient<br />
operation by carrying out the tasks set by the Board of Directors.<br />
The Chief Executive co-operates with trade unions to protect the<br />
interests of company employees and deals with government and<br />
municipal authorities. The Chief Executive is also responsible for<br />
the organisation, status and accuracy of the company’s<br />
accounting practices, timely provision of financial reports to<br />
appropriate authorities, and timely provision of information<br />
regarding the company’s operations to shareholders, creditors<br />
and the media.<br />
66 <strong>Severstal</strong> <strong>Annual</strong> <strong>Report</strong> <strong>2007</strong>
When joining the Board, Directors are given background<br />
information on the company and its operations and procedures, as<br />
well as information on what is required from them in their role.<br />
Non-executive Directors<br />
The Board reviews the independence of all Non-executive<br />
Directors on an annual basis and has determined that all such<br />
Directors are independent and have no cross-directorships or<br />
significant links which could materially interfere with them<br />
exercising their independent judgement. The Non-executive<br />
Directors play a leading role in corporate accountability and<br />
governance through their membership of the Remuneration<br />
Committee and the Audit Committee.<br />
– Senior Independent Director<br />
Rolf Stomberg is <strong>Severstal</strong>’s Senior Independent Director<br />
and is also Chairman of the Remuneration Committee. His<br />
responsibilities include meeting major shareholders and chairing<br />
meetings of the Non-executive Directors when the Chairman is<br />
not present.<br />
– Terms of appointment<br />
Members of the company’s Board of Directors are elected by<br />
the shareholders in an <strong>Annual</strong> General Meeting and remain<br />
members for the period until the next AGM. The persons elected<br />
to the company’s Board of Directors may be re-elected an<br />
unlimited number of times.<br />
– Meetings of Non-executive Directors<br />
The Non-executive Directors meet separately during the year.<br />
In <strong>2007</strong>, they held two such meetings.<br />
Key committees<br />
– Audit Committee<br />
The Audit Committee prepares its own evaluation of the<br />
auditor’s opinion on financial statements and provides this<br />
evaluation to the Board of Directors and to the AGM.<br />
The Audit Committee currently comprises Martin Angle<br />
(Chairman of the Audit Committee), Ronald Freeman<br />
and Peter Kraljic.<br />
The functions of the Audit Committee include:<br />
– Reviewing the provision and scope of audit and non-audit work<br />
by the company’s external auditor and the fees charged<br />
– Reviewing the company’s financial statements, changes in the<br />
company’s policy and accounting practices, and monitoring the<br />
internal audit system<br />
– Reviewing the effectiveness of the company’s risk<br />
management, internal control and corporate governance<br />
systems.<br />
The Audit Committee is composed exclusively of Independent<br />
Directors, which guarantees absolute independence of the<br />
Committee’s judgements with respect to the company’s<br />
financial affairs.<br />
During <strong>2007</strong>, the Audit Committee met five times.<br />
In order that the company’s financial and business operations<br />
are monitored efficiently, it employs external auditors that have<br />
no interests in the company for annual verification and approval of<br />
the accounts.<br />
The company’s books and records are audited in compliance<br />
with the requirements of Russian law and International Standards<br />
on Auditing. These are issued by the International Federation of<br />
Accountants (IFAC) with respect to financial statements prepared<br />
under the International Financial <strong>Report</strong>ing Standards (IFRS).<br />
Such an audit takes place annually and, as of the first quarter<br />
of <strong>2007</strong>, our quarterly reports are also reviewed under the IFRS, in<br />
accordance with the International Standard on Review<br />
Engagements 2410.<br />
– Nomination and Remuneration Committee<br />
The Nomination and Remuneration Committee focuses on<br />
appointing our Board Directors, the CEO and other top executives.<br />
The Nomination and Remuneration Committee comprises: Rolf<br />
Stomberg (Chairman of the Committee), Christopher Clark and<br />
Alexey Mordashov.<br />
Functions of the Nomination and Remuneration committee<br />
include:<br />
– Reviewing the work of the Board, making general<br />
recommendations on the selection of candidates for the<br />
Board and preliminary evaluation of potential candidates<br />
– Ascertaining whether Board nominees comply with the status<br />
of an Independent Director, analysing information to detect<br />
possible bias on the part of the Board in making decisions,<br />
as well as circumstances precluding efficient work and<br />
circumstances leading to loss of independence by a<br />
member of the Board<br />
– Developing a remuneration system for Board members based<br />
on the personal contribution of each Director in implementing<br />
the company’s strategic objectives<br />
– Preparing and submitting to the Board the policy for appointing<br />
and remunerating the company’s senior executives, including<br />
the CEO, as well as providing recommendations on the terms of<br />
the contract signed with the company’s CEO.<br />
The committee strives to maintain the optimum balance,<br />
recruiting the best-qualified professionals to manage the<br />
company, and offering sufficiently attractive levels of<br />
remuneration to interest these professionals in working for<br />
the company.<br />
Most of the committee members, including the Chairman,<br />
should be Independent Directors.<br />
The Nomination and Remuneration Committee met three<br />
times in <strong>2007</strong>.<br />
<strong>Severstal</strong> <strong>Annual</strong> <strong>Report</strong> <strong>2007</strong> 67
Governance<br />
Corporate structure of <strong>Severstal</strong> in <strong>2007</strong><br />
General<br />
Shareholders’<br />
Meeting<br />
Audit Committee<br />
Chairman – Martin Angle<br />
Corporate Secretary<br />
Oleg Tsvetkov<br />
Board of Directors<br />
Chairman – Chris Clark<br />
Nomination and<br />
Remuneration<br />
Committee<br />
Chairman – Rolf Stomberg<br />
Chief Executive Officer<br />
Alexey Mordashov<br />
Strategy Committee<br />
Chairman – Vadim Makhov<br />
Mining<br />
Russian Steel<br />
<strong>Severstal</strong><br />
North America<br />
Lucchini<br />
Metalware<br />
Izhora Pipe Mill<br />
Finance*<br />
*Sold in November <strong>2007</strong>.<br />
The restructuring of our <strong>Severstal</strong> businesses in 2008<br />
<strong>Severstal</strong> Russian Steel<br />
Anatoly Kruchinin<br />
<strong>Severstal</strong> Resources<br />
Roman Deniskin<br />
<strong>Severstal</strong> International<br />
Gregory Mason<br />
Business heads 2008<br />
Anatoly Kruchinin<br />
CEO, <strong>Severstal</strong> Russian Steel<br />
Anatoly Kruchinin, 47, began his career at<br />
<strong>Severstal</strong> in 1982. In 1993, he became Chief<br />
Power Engineer and in March 1999, he was<br />
made Commercial Director. From January<br />
2002, Anatoly worked as Executive<br />
Director of <strong>Severstal</strong>, becoming the<br />
company’s CEO in July 2002. Since<br />
December 2006, he has been Chief<br />
Executive Officer of Cherepovets Steel<br />
Mill. Anatoly is a graduate of the Ivanovo<br />
Power Engineering Institute and holds<br />
an MBA degree from National Economic<br />
Academy under the Government<br />
of Russia.<br />
Roman Deniskin<br />
CEO, <strong>Severstal</strong> Resources<br />
Roman Deniskin, 40, has been Director<br />
General of <strong>Severstal</strong> Resources since<br />
2002. From 1995 to 2002, Roman worked<br />
in the Moscow office of McKinsey &<br />
Company, advising steel, mining and<br />
smelting companies in Russia, the US and<br />
the UK. Roman has a mathematics and<br />
mechanics degree from Moscow State<br />
University, from where he graduated<br />
magna cum laude, and also an MA in<br />
economics from Ann Arbor University<br />
(Michigan).<br />
Gregory Mason<br />
COO, OAO <strong>Severstal</strong> and<br />
CEO, <strong>Severstal</strong> International<br />
Gregory Mason, 56, joined <strong>Severstal</strong><br />
in 2004 having previously been a<br />
managing partner in Metal Strategies,<br />
an international metals industry<br />
management-consulting firm. In 2006,<br />
he was appointed as Chief Operating<br />
Officer of <strong>Severstal</strong> and in 2008 as CEO<br />
of <strong>Severstal</strong> International. Previous roles<br />
include Vice President of the Detroit Steel<br />
Company, Technical Director of Caparo<br />
Steel, Director of Steelmaking Technology<br />
at Davy International and Chief Engineer<br />
at KRUPP Industries (a division of KRUPP<br />
Stahl). Gregory is a registered professional<br />
engineer in the USA. He received his<br />
Masters degree from the Naval University<br />
of St. Petersburg.<br />
68 <strong>Severstal</strong> <strong>Annual</strong> <strong>Report</strong> <strong>2007</strong>
OAO <strong>Severstal</strong> and subsidiaries<br />
Consolidated financial statements<br />
for the year ended December 31, <strong>2007</strong><br />
<strong>Severstal</strong> <strong>Annual</strong> <strong>Report</strong> <strong>2007</strong> 69
Financial statements<br />
OAO <strong>Severstal</strong> and subsidiaries<br />
Consolidated financial statements<br />
for the year ended December 31, <strong>2007</strong><br />
Contents<br />
Page<br />
Independent Auditors’ <strong>Report</strong> 71<br />
Consolidated income statement 72<br />
Consolidated balance sheet 73<br />
Consolidated statement of cash flows 74<br />
Consolidated statement of changes in equity 75<br />
Notes to the consolidated financial statements 76-116<br />
1 Operations 76<br />
2 Presentation of the consolidated financial statements 76<br />
3 Summary of the principal accounting policies 78<br />
4 Sales 83<br />
5 Staff costs 83<br />
6 Net income from securities operations 84<br />
7 Net other non-operating expenses 84<br />
8 Financing 84<br />
9 Taxation 84<br />
10 Cash and cash equivalents 86<br />
11 Short-term bank deposits 86<br />
12 Short-term financial investments 86<br />
13 Trade accounts receivable 87<br />
14 Related party balances 87<br />
15 Related party transactions 88<br />
16 Inventories 88<br />
17 Other current assets 88<br />
18 Intangible assets 89<br />
19 Property, plant and equipment 90<br />
20 Investment in associates and joint ventures 91<br />
21 Long-term financial investments 92<br />
22 Bank customer accounts 92<br />
23 Debt finance 93<br />
24 Other current liabilities 93<br />
25 Retirement benefit liability 94<br />
26 Other non-current liabilities 96<br />
27 Share capital 97<br />
28 Subsidiaries, associates and joint ventures 98<br />
29 Discontinued operations and assets held for sale 103<br />
30 Subsequent events 104<br />
31 Segment information 105<br />
32 Commitments and contingencies 111<br />
33 Financial instruments 111<br />
70 <strong>Severstal</strong> <strong>Annual</strong> <strong>Report</strong> <strong>2007</strong>
Independent Auditors’ <strong>Report</strong><br />
Board of Directors<br />
OAO <strong>Severstal</strong><br />
KPMG Limited<br />
18 Krasnopresnenskaya Naberezhnaya,<br />
Block C<br />
Moscow 123317<br />
Russia<br />
Telephone +7 (495) 937 44 77<br />
Fax +7 (495) 937 44 00/99<br />
Internet www.kpmg.ru<br />
<strong>Report</strong> on the Consolidated Financial Statements<br />
We have audited the accompanying consolidated financial statements of OAO <strong>Severstal</strong> (the “Company”) and its subsidiaries (the “Group”), which<br />
comprise the consolidated balance sheet as at 31 December <strong>2007</strong>, and the consolidated income statement, consolidated statement of changes<br />
in equity and consolidated cash flow statement for the year then ended, and a summary of significant accounting policies and other explanatory notes.<br />
We have also previously audited the corresponding figures for 2006 and 2005 before the adjustments described in Note 3 c and our report thereon dated<br />
30 March <strong>2007</strong> expressed an unqualified opinion on those statements.<br />
Management’s Responsibility for the Financial Statements<br />
Management is responsible for the preparation and fair presentation of these consolidated financial statements in accordance with International<br />
Financial <strong>Report</strong>ing Standards. This responsibility includes: designing, implementing and maintaining internal control relevant to the preparation and<br />
fair presentation of financial statements that are free from material misstatements, whether due to fraud or error; selecting and applying appropriate<br />
accounting policies; and making accounting estimates that are reasonable in the circumstances.<br />
Auditors’ Responsibility<br />
Our responsibility is to express an opinion on these consolidated financial statements based on our audit. We conducted our audit in accordance<br />
with International Standards on Auditing. Those standards require that we comply with relevant ethical requirements and plan and perform the audit<br />
to obtain reasonable assurance whether the financial statements are free of material misstatement.<br />
An audit involves performing procedures to obtain audit evidence about the amounts and disclosures in the financial statements. The procedures<br />
selected depend on the auditor’s judgment, including the assessment of the risks of material misstatement of the financial statements, whether<br />
due to fraud or error. In making those risk assessments, the auditor considers internal control relevant to the entity’s preparation and fair presentation<br />
of the financial statements in order to design audit procedures that are appropriate in the circumstances, but not for the purpose of expressing an<br />
opinion on the effectiveness of the entity’s internal control. An audit also includes evaluating the appropriateness of accounting principles used and<br />
the reasonableness of accounting estimates made by management, as well as evaluating the overall presentation of the financial statements.<br />
We believe that the audit evidence we have obtained is sufficient and appropriate to provide a basis for our opinion.<br />
Opinion<br />
In our opinion, the consolidated financial statements present fairly, in all material respects, the consolidated financial position of the Group as at<br />
31 December <strong>2007</strong>, and its consolidated financial performance and its consolidated cash flows for the year then ended in accordance with International<br />
Financial <strong>Report</strong>ing Standards.<br />
Emphasis of Matter<br />
Without qualifying our opinion, we draw attention to the fact that during the year the Group changed its accounting policy for property, plant and<br />
equipment. The reason for and the effects of the change are described in Note 3 c to these consolidated financial statements. We have also audited the<br />
adjustments described in Note 3 c that were applied to restate the 2006 and 2005 financial statements. In our opinion, such adjustments are appropriate<br />
and have been properly applied.<br />
KPMG Limited<br />
14 March 2008<br />
KPMG Limited, a company incorporated under the Guernsey<br />
Companies Act and a member firm of the KPMG network of<br />
independent member firms affiliated with KPMG International, a<br />
Swiss cooperative.<br />
<strong>Severstal</strong> <strong>Annual</strong> <strong>Report</strong> <strong>2007</strong> 71
Financial statements<br />
OAO <strong>Severstal</strong> and subsidiaries<br />
Consolidated income statement<br />
Year ended December 31, <strong>2007</strong><br />
(Amounts expressed in thousands of US dollars, except as otherwise stated)<br />
Year ended December 31,<br />
<strong>2007</strong> 2006 2005<br />
Note (restated) (restated)<br />
Sales<br />
Sales – external 14,543,043 11,723,318 9,786,057<br />
Sales – to related parties 15 701,868 725,714 665,589<br />
4 15,244,911 12,449,032 10,451,646<br />
Cost of sales (10,541,571) (8,601,227) (6,831,138)<br />
Gross profit 4,703,340 3,847,805 3,620,508<br />
General and administrative expenses (691,210) (654,987) (524,662)<br />
Distribution expenses (909,510) (697,308) (657,684)<br />
Indirect taxes and contributions (153,614) (142,109) (95,343)<br />
Share of associates’ loss (89,397) (1,193) (4,190)<br />
Net income from securities operations 6 25,564 28,263 24,443<br />
Loss on disposal of property, plant and equipment (35,280) (39,292) (36,780)<br />
Net other operating expenses (7,520) (27,109) (20,344)<br />
Profit from operations 2,842,373 2,314,070 2,305,948<br />
Impairment of property, plant and equipment 19 (29,109) (57,736) (111,384)<br />
Net gain on restructuring of tax liabilities 26 – 14,669 174,178<br />
Negative goodwill, net 12,223 4,213 7,630<br />
Net other non-operating expenses 7 (58,576) (53,536) (52,753)<br />
Profit before financing and taxation 2,766,911 2,221,680 2,323,619<br />
Interest income 8 172,937 102,402 65,134<br />
Interest expense 8 (288,293) (244,977) (203,057)<br />
Foreign exchange difference 2,900 33,324 (60,231)<br />
Profit before income tax 2,654,455 2,112,429 2,125,465<br />
Income tax expense 9 (681,269) (635,298) (500,907)<br />
Profit from continuing operations 1,973,186 1,477,131 1,624,558<br />
Profit from discontinued operations 29 433 32,849 602<br />
Profit for the year 1,973,619 1,509,980 1,625,160<br />
Attributable to:<br />
shareholders of OAO <strong>Severstal</strong> 1,936,423 1,454,198 1,561,182<br />
minority interest 37,196 55,782 63,978<br />
Weighted average number of shares outstanding during the period (millions of shares) 1,007.7 928.4 912.2<br />
Basic and diluted earnings per share (US dollars) 1.92 1.57 1.71<br />
These consolidated financial statements were approved by the Board of Directors on March 14, 2008.<br />
The accompanying notes form an integral part of these consolidated financial statements.<br />
72 <strong>Severstal</strong> <strong>Annual</strong> <strong>Report</strong> <strong>2007</strong>
OAO <strong>Severstal</strong> and subsidiaries<br />
Consolidated balance sheet<br />
December 31, <strong>2007</strong><br />
(Amounts expressed in thousands of US dollars)<br />
December 31, December 31, December 31,<br />
<strong>2007</strong> 2006 2005<br />
Note (restated) (restated)<br />
Assets<br />
Current assets:<br />
Cash and cash equivalents 10 1,546,881 1,701,022 1,327,887<br />
Short-term bank deposits 11 665,977 1,147,270 674,512<br />
Short-term financial investments 12 267,633 321,842 267,851<br />
Trade accounts receivable 13 1,674,618 1,324,585 1,174,193<br />
Amounts receivable from related parties 14 162,719 127,703 173,808<br />
Inventories 16 2,537,470 2,222,372 1,725,528<br />
VAT recoverable 283,745 339,392 442,297<br />
Income tax recoverable 75,993 35,904 28,671<br />
Assets held for sale 29 461,196 – –<br />
Other current assets 17 321,362 259,208 181,685<br />
Total current assets 7,997,594 7,479,298 5,996,432<br />
Non-current assets:<br />
Long-term financial investments 21 152,866 199,940 89,541<br />
Investment in associates and joint ventures 20 589,092 354,906 210,652<br />
Property, plant and equipment 19 7,292,811 6,470,385 5,319,568<br />
Intangible assets 18 611,261 61,666 56,523<br />
Assets held for sale 29 – 113,516 66,117<br />
Deferred tax assets 9 52,324 30,150 35,076<br />
Amounts receivable from related parties 14 – – 35,095<br />
Other non-current assets 21,474 3,844 3,105<br />
Total non-current assets 8,719,828 7,234,407 5,815,677<br />
Total assets 16,717,422 14,713,705 11,812,109<br />
Liabilities and shareholders’ equity<br />
Current liabilities:<br />
Trade accounts payable 1,090,884 1,038,901 866,629<br />
Bank customer accounts 22 – 31,143 98,867<br />
Amounts payable to related parties 14 58,915 175,740 491,957<br />
Short-term debt finance 23 972,079 957,564 996,125<br />
Income taxes payable 41,381 44,348 86,001<br />
Other taxes and social security payable 200,424 199,963 257,678<br />
Dividends payable 107,485 23,243 12,275<br />
Liabilities related to assets held for sale 29 91,750 – –<br />
Other current liabilities 24 600,580 506,848 379,218<br />
Total current liabilities 3,163,498 2,977,750 3,188,750<br />
Non-current liabilities:<br />
Long-term debt finance 23 2,354,823 2,048,035 1,931,694<br />
Deferred tax liabilities 9 374,636 403,076 356,739<br />
Retirement benefit liability 25 387,398 442,954 338,486<br />
Liabilities related to assets held for sale 29 – 1,792 172<br />
Other non-current liabilities 26 226,388 286,090 281,075<br />
Total non-current liabilities 3,343,245 3,181,947 2,908,166<br />
Equity:<br />
Share capital 27 3,311,288 3,311,288 3,311,254<br />
Additional capital 1,165,530 1,165,530 60,367<br />
Foreign exchange differences 1,176,321 535,591 34,368<br />
Retained earnings 4,082,834 2,983,954 1,818,475<br />
Total equity attributable to shareholders of parent 9,735,973 7,996,363 5,224,464<br />
Minority interest 474,706 557,645 490,729<br />
Total equity 10,210,679 8,554,008 5,715,193<br />
Total equity and liabilities 16,717,422 14,713,705 11,812,109<br />
The accompanying notes form an integral part of these consolidated financial statements.<br />
<strong>Severstal</strong> <strong>Annual</strong> <strong>Report</strong> <strong>2007</strong> 73
Financial statements<br />
OAO <strong>Severstal</strong> and subsidiaries<br />
Consolidated statement of cash flows<br />
Year ended December 31, <strong>2007</strong><br />
(Amounts expressed in thousands of US dollars)<br />
74 <strong>Severstal</strong> <strong>Annual</strong> <strong>Report</strong> <strong>2007</strong><br />
Year ended December 31,<br />
<strong>2007</strong> 2006 2005<br />
(restated)<br />
(restated)<br />
Operating activities:<br />
Profit before financing and taxation 2,766,911 2,221,680 2,323,619<br />
Adjustments to reconcile profit to cash generated from operations:<br />
Depreciation and amortization (Notes 18 and 19) 802,695 603,740 496,597<br />
Impairment of property, plant and equipment 29,109 57,736 111,384<br />
Provision for inventories, receivables and other provisions 52,542 (11,641) 27,629<br />
Negative goodwill, net (12,223) (4,213) (7,630)<br />
Loss on disposal of property, plant and equipment 35,280 39,292 36,780<br />
Net gain on restructuring of tax liabilities (Note 26) – (14,669) (174,178)<br />
(Gain)/loss on disposal of subsidiaries and associates (31,507) (846) 9,759<br />
Gain on remeasurement and disposal of financial investments (25,564) (28,263) (24,443)<br />
Share of associates’ results less dividends from associates 89,397 1,193 17,413<br />
Changes in operating assets and liabilities:<br />
Trade accounts receivable (334,967) (16,474) 10,585<br />
Amounts receivable from related parties 25,083 92,387 43,006<br />
VAT recoverable 96,603 140,315 (222,739)<br />
Inventories (189,848) (291,466) (73,542)<br />
Trade accounts payable 58,704 57,562 16,323<br />
Bank customer accounts 36,500 (74,511) (28,322)<br />
Amounts payable to related parties 80,316 (101,337) 53,386<br />
Other taxes and social security payables (63,729) (111,604) 16,797<br />
Other non-current liabilities (107,185) 10,396 13,114<br />
Assets held for sale (1,856) – (14,512)<br />
Net other changes in operating assets and liabilities 42,490 52,044 60,245<br />
Cash generated from operations 3,348,751 2,621,321 2,691,271<br />
Interest paid (excluding banking operations) (230,791) (215,081) (199,177)<br />
Income tax paid (802,871) (676,582) (557,303)<br />
Net cash from operating activities 2,315,089 1,729,658 1,934,791<br />
Investing activities:<br />
Additions to property, plant and equipment (1,561,911) (1,243,831) (1,204,415)<br />
Additions to intangible assets (27,194) (8,808) (32,322)<br />
Net decrease/(increase) in short-term bank deposits 580,706 (431,142) (133,526)<br />
Additions to financial investments and associates (1,303,537) (1,203,824) (817,558)<br />
Acquisition of minority interests and entities under common control (232,447) (294,249) 108,466<br />
Net cash outflow on acquisitions of subsidiaries (644,094) (57,625) (4,223)<br />
Net cash inflow on disposals of subsidiaries 235,978 1,588 13,701<br />
Proceeds from disposal of property, plant and equipment 32,926 14,023 10,893<br />
Proceeds from disposal of assets held for sale – – 10,313<br />
Proceeds from disposal of financial investments 787,037 949,480 816,671<br />
Interest received (excluding banking operations) 150,569 105,251 53,911<br />
Cash from investing activities (1,981,967) (2,169,137) (1,178,089)<br />
Financing activities:<br />
Proceeds from debt finance 2,794,285 1,379,209 1,156,982<br />
Proceeds from share issue – 1,105,197 –<br />
Repayment of debt finance (2,623,463) (1,495,440) (1,357,997)<br />
Repayments under lease obligations (3,915) – –<br />
Dividends paid (736,156) (269,286) (277,605)<br />
Minority capital contributions – 6,685 37,734<br />
Net other cash flows from financing activities – – (7,742)<br />
Cash from financing activities (569,249) 726,365 (448,628)<br />
Effect of exchange rates on cash and cash equivalents 81,986 86,249 (70,551)<br />
Net increase/(decrease) in cash and cash equivalents (154,141) 373,135 237,523<br />
Cash and cash equivalents at beginning of the period 1,701,022 1,327,887 1,090,364<br />
Cash and cash equivalents at end of the period 1,546,881 1,701,022 1,327,887<br />
The accompanying notes form an integral part of these consolidated financial statements.
OAO <strong>Severstal</strong> and subsidiaries<br />
Consolidated statement of changes in equity<br />
Year ended December 31, <strong>2007</strong><br />
(Amounts expressed in thousands of US dollars)<br />
Minority<br />
Attributable to the shareholders of OAO <strong>Severstal</strong> interest Total<br />
Foreign<br />
Share Additional Revaluation exchange Retained<br />
capital capital reserve differences earnings Total<br />
Balances at December 31, 2004<br />
as previously reported 3,311,248 60,367 631,996 191,770 (75,938) 4,119,443 122,250 4,241,693<br />
Acquisition of entities under common control – – – 538 (3,385) (2,847) 1,409 (1,438)<br />
Change in accounting policy (Note 3c) – – (631,996) – 631,996 – – –<br />
Balances at December 31, 2004 as restated 3,311,248 60,367 – 192,308 552,673 4,116,596 123,659 4,240,255<br />
Profit for the year (restated) – – – – 1,561,182 1,561,182 63,978 1,625,160<br />
Foreign exchange differences – – – (151,293) – (151,293) (35,065) (186,358)<br />
Total recognized income and expenses 1,409,889 28,913 1,438,802<br />
Dividends – – – – (271,996) (271,996) (3,181) (275,177)<br />
Effect of acquisitions and disposals 6 – – (6,647) (23,384) (30,025) 341,338 311,313<br />
Balances at December 31, 2005 (restated) 3,311,254 60,367 – 34,368 1,818,475 5,224,464 490,729 5,715,193<br />
Profit for the year (restated) – – – – 1,454,198 1,454,198 55,782 1,509,980<br />
Foreign exchange differences – – – 501,223 – 501,223 49,210 550,433<br />
Total recognized income and expenses 1,955,421 104,992 2,060,413<br />
Dividends – – – – (278,798) (278,798) – (278,798)<br />
Share issues 34 1,105,163 – – – 1,105,197 – 1,105,197<br />
Effect of acquisitions and disposals – – – – (9,921) (9,921) (38,076) (47,997)<br />
Balances at December 31, 2006 (restated) 3,311,288 1,165,530 – 535,591 2,983,954 7,996,363 557,645 8,554,008<br />
Profit for the year – – – – 1,936,423 1,936,423 37,196 1,973,619<br />
Foreign exchange differences – – – 640,730 – 640,730 56,583 697,313<br />
Total recognized income and expenses 2,577,153 93,779 2,670,932<br />
Dividends – – – – (801,462) (801,462) (11,982) (813,444)<br />
Effect of acquisitions and disposals – – – – (36,081) (36,081) (164,736) (200,817)<br />
Balances at December 31, <strong>2007</strong> 3,311,288 1,165,530 – 1,176,321 4,082,834 9,735,973 474,706 10,210,679<br />
The accompanying notes form an integral part of these consolidated financial statements.<br />
<strong>Severstal</strong> <strong>Annual</strong> <strong>Report</strong> <strong>2007</strong> 75
Financial statements<br />
OAO <strong>Severstal</strong> and subsidiaries<br />
Notes to the consolidated financial statements<br />
for the year ended December 31, <strong>2007</strong><br />
(Amounts expressed in thousands of US dollars, except as otherwise stated)<br />
1. Operations<br />
These consolidated financial statements of OAO <strong>Severstal</strong> and subsidiaries<br />
comprise the parent company, OAO <strong>Severstal</strong> (‘<strong>Severstal</strong>’ or ‘the Parent<br />
Company’) and its subsidiaries (collectively ‘the Group’) as listed in note 28.<br />
<strong>Severstal</strong> began operations on August 24, 1955 and completed the<br />
development of an integrated iron and steel mill in Cherepovets during<br />
February 1959 when the first steel was rolled. On September 24, 1993,<br />
as part of the Russian privatization program, <strong>Severstal</strong> was registered as<br />
a Joint Stock Company (‘OAO’) and privatized. Through participating in<br />
<strong>Severstal</strong>’s privatization auctions and other purchases, Alexey Mordashov<br />
(the “Majority Shareholder”) has purchased shares in <strong>Severstal</strong> such that<br />
as at the balance sheet date he controlled, directly or indirectly, 82.37%<br />
(December 31, 2006 and 2005: 82.37% and 82.75%, respectively)<br />
of <strong>Severstal</strong>’s share capital.<br />
<strong>Severstal</strong>’s GDRs have been quoted on the London Stock Exchange since<br />
November 2006. <strong>Severstal</strong>’s shares are quoted on the Russian Trading<br />
System and on the Moscow Interbank Currency Exchange (‘MICEX’).<br />
<strong>Severstal</strong>’s registered office is located at Ul Mira 30, Cherepovets, Russia.<br />
The Group comprises the following segments:<br />
– Mining segment – this segment comprises gold mining in one location in<br />
Kazakhstan and the following operations in Russia: coking coal production<br />
in two locations, one location where iron ore is produced, one location<br />
where pellets are produced, gold mining in two locations and also coal<br />
refining facilities and other auxiliary businesses.<br />
– Russian Steel – this segment operates a full cycle integrated iron and steel<br />
mill, has supporting companies for the sale of products in the Russian<br />
and international markets and also includes service companies.<br />
– Lucchini – this segment produces special and high quality steels and<br />
quality and specialty long products. Production sites are located in<br />
Western Europe, primarily in Italy and France. This segment also includes<br />
its distribution network companies, which are located primarily in<br />
Western Europe.<br />
– <strong>Severstal</strong> North America – this segment operates a full cycle integrated<br />
iron and steel mill in USA and has joint control and non-controlling equity<br />
interests in US based steel galvanizing, steel slitting and coking coal<br />
production entities.<br />
– Izhora Pipe Mill (hereinafter – ‘IPM’, previously referred to as ‘ITZ’) – this<br />
segment operates a large pipe mill in Russia, which was reported together<br />
with Russian Steel segment prior to <strong>2007</strong>.<br />
– Metalware segment – this segment comprises three plants in Russia, two<br />
plants in Ukraine and one plant in the United Kingdom containing wire<br />
drawing equipment that takes long products (mainly wire) from the<br />
Russian Steel and Lucchini segments and external suppliers and turns<br />
them into products with a higher value added for the Russian and<br />
international markets.<br />
– Financing segment – this segment operated a retail bank until November<br />
<strong>2007</strong> when the bank was disposed off. This transaction was accounted<br />
for as a discontinued operation. The transaction is further discussed in<br />
Note 29 to these consolidated financial statements.<br />
A segmental analysis of the consolidated balance sheet and income<br />
statement is given in note 31.<br />
Acquisitions of controlling stakes from the Group’s Majority Shareholder<br />
In July <strong>2007</strong>, the Group acquired from the Group’s Majority Shareholder<br />
a 100% stake in each of the companies OOO Petrovtormet and OOO<br />
<strong>Severstal</strong>skrap-Komi, and a 75.01% and a 75.1% stake in OAO Arhangelskii<br />
vtormet and in OAO Murmanskvtormet, respectively.<br />
These transactions are further discussed in note 28 to these<br />
consolidated financial statements.<br />
Economic environment<br />
A large part of the Group is based in the Russian Federation and is<br />
consequently exposed to the economic and political effects of the policies<br />
adopted by the Russian government. These conditions and future policy<br />
changes could affect the operations of the Group and the realization and<br />
settlement of its assets and liabilities.<br />
International sales of rolled steel from the Group’s Russian operations<br />
have been the subject of several anti-dumping investigations. The Group has<br />
taken steps to address the concerns of such investigations and participates<br />
actively in their resolution. A brief description of protective measures<br />
effective at <strong>Severstal</strong>’s key export markets is given below:<br />
– Exports of hot-rolled coils and thin sheets from Russia to the USA are<br />
restricted by the minimum prices and quantities issued quarterly by the<br />
US Department of Commerce and quotas.<br />
– Exports of hot-rolled plates from Russia to the USA are restricted by the<br />
minimum prices established based on the producer’s actual cost and profit<br />
on the domestic market. <strong>Severstal</strong> is the first Russian company, for which<br />
since September 2005 the hot-rolled plates market is open.<br />
– The Canadian market of hot-rolled plate was restricted by minimum prices<br />
in <strong>2007</strong>. However from January 9, 2008 this restriction was cancelled.<br />
– The European Union (‘EU’) market is protected by quotas. During the last<br />
few years quotas have been raised consistently after adjusting for the<br />
effects of EU enlargements, equaling 2.272 mln. tons in <strong>2007</strong>. <strong>Severstal</strong><br />
traditionally gets approximately 35% of the total Russian quota and<br />
strives to utilize it fully because the EU market is a key market for <strong>Severstal</strong>.<br />
– The Chinese market is open to the Russian exporters. No antidumping or<br />
safeguard measures are in force.<br />
2. Presentation of the consolidated financial statements<br />
Statement of compliance<br />
These consolidated financial statements are prepared in accordance<br />
with International Financial <strong>Report</strong>ing Standards (‘IFRS’) as issued by<br />
the International Accounting Standards Board.<br />
Basis of measurement<br />
The consolidated financial statements are prepared under the historic cost<br />
convention except that investments designated at fair value through profit<br />
and loss and investments available-for-sale are stated at fair value.<br />
The Group’s statutory financial records are maintained in accordance<br />
with the legislative requirements of the countries in which the individual<br />
entities are located, which differ in certain respects from IFRS. The<br />
accounting policies applied in the preparation of these consolidated<br />
financial statements are set out in note 3.<br />
Going concern basis<br />
These consolidated financial statements have been prepared on a going<br />
concern basis, which contemplates the realization of assets and the<br />
settlement of liabilities in the normal course of business.<br />
Critical accounting judgments and estimates<br />
Preparation of the consolidated financial statements in accordance with<br />
IFRS requires the Group’s management to make estimates and<br />
assumptions that affect the reported amounts of assets and liabilities<br />
and disclosure of contingent assets and liabilities at the date of financial<br />
statements, and the reported amounts of revenues and expenses during<br />
the reporting period. The determination of estimates requires judgments<br />
which are based on historical experience, current and expected economic<br />
conditions, and other available information. Actual results could differ from<br />
those estimates.<br />
76 <strong>Severstal</strong> <strong>Annual</strong> <strong>Report</strong> <strong>2007</strong>
OAO <strong>Severstal</strong> and subsidiaries<br />
Notes to the consolidated financial statements<br />
for the year ended December 31, <strong>2007</strong><br />
(Amounts expressed in thousands of US dollars, except as otherwise stated)<br />
The most significant areas requiring the use of management estimates<br />
and assumptions relate to:<br />
– useful economic lives of property, plant and equipment;<br />
– impairment of assets;<br />
– allowances for doubtful debts, obsolete and slow-moving raw materials<br />
and spare parts;<br />
– decommissioning liabilities;<br />
– retirement benefit liabilities;<br />
– deferred income tax assets; and<br />
– contingencies.<br />
Useful economic lives of property, plant and equipment<br />
The Group assesses the remaining useful lives of items of property, plant<br />
and equipment at least at each financial year-end and, if expectations differ<br />
from previous estimates, the changes are accounted for as a change in an<br />
accounting estimate in accordance with IAS 8 “Accounting Policies, Changes<br />
in Accounting Estimates and Errors”. These estimates may have a material<br />
impact on the amount of the carrying values of property, plant and<br />
equipment and on depreciation expense for the period.<br />
Impairment of assets<br />
The Group reviews the carrying amount of its tangible and intangible assets<br />
to determine whether there is any indication that those assets are impaired.<br />
In making the assessments for impairment, assets that do not generate<br />
independent cash flows are allocated to an appropriate cash-generating<br />
unit. Management necessarily applies its judgment in allocating assets that<br />
do not generate independent cash flows to appropriate cash-generating<br />
units, and also in estimating the timing and value of underlying cash flows<br />
within the value in use calculation. Subsequent changes to the cash<br />
generating unit allocation or to the timing of cash flows could impact<br />
the carrying value of the respective assets.<br />
Allowances for doubtful accounts<br />
The Group makes allowances for doubtful receivables to account for<br />
estimated losses resulting from the inability of customers to make required<br />
payments. When evaluating the adequacy of an allowance for doubtful<br />
accounts, management bases its estimates on the current overall economic<br />
conditions, the ageing of accounts receivable balances, historical write-off<br />
experience, customer creditworthiness and changes in payment terms.<br />
Changes in the economy, industry or specific customer conditions may<br />
require adjustments to the allowance for doubtful accounts recorded in<br />
the consolidated financial statements.<br />
Provision for obsolete inventory<br />
The Group makes a provision for obsolete and slow-moving raw materials<br />
and spare parts. In addition, certain finished goods of the Group are carried<br />
at net realizable value. Estimates of net realizable value of finished goods<br />
are based on the most reliable evidence available at the time the estimates<br />
are made. These estimates take into consideration fluctuations of price or<br />
cost directly relating to events occurring subsequent to the balance sheet<br />
date to the extent that such events confirm conditions existing at the end<br />
of the period.<br />
Decommissioning Liability<br />
The Group reviews its decommissioning liability, representing site<br />
restoration provisions, at each balance sheet date and adjusts it to reflect<br />
the current best estimate in accordance with IFRIC 1 “Changes in Existing<br />
Decommissioning, Restoration and Similar Liabilities”. The amount<br />
recognized as a provision is the best estimate of the expenditures required<br />
to settle the present obligation at the balance sheet date based on the<br />
requirements of the current legislation of the country where the respective<br />
operating assets are located. The risks and uncertainties that inevitably<br />
surround many events and circumstances are taken into account in reaching<br />
the best estimate of a provision. Considerable judgment is required in<br />
forecasting future site restoration costs. Future events that may affect the<br />
amount required to settle an obligation are reflected in the amount of a<br />
provision when there is sufficient objective evidence that they will occur.<br />
Retirement Benefit Liability<br />
The Group uses an actuarial valuation method for measurement of the<br />
present value of post-employment benefit obligations and related current<br />
service cost. This involves the use of demographic assumptions about the<br />
future characteristics of the current and former employees who are eligible<br />
for benefits (mortality, both during and after employment, rates of<br />
employee turnover, disability and early retirement, etc.) as well as financial<br />
assumptions (discount rate, future salary and benefit levels, expected rate<br />
of return on plan assets, etc.).<br />
Deferred Income Tax Assets<br />
Deferred tax assets are reviewed at each balance sheet date and reduced<br />
to the extent that it is no longer probable that sufficient taxable profit will<br />
be available to allow all or part of the deferred tax asset to be utilized. The<br />
estimation of that probability includes judgments based on the expected<br />
performance. Various factors are considered to assess the probability of<br />
the future utilization of deferred tax assets, including past operating results,<br />
operational plans, expiration of tax losses carried forward, and tax planning<br />
strategies. If actual results differ from that estimates or if these estimates<br />
must be adjusted in future periods, the financial position, results of<br />
operations and cash flows may be negatively affected. In the event that<br />
the assessment of future utilization of deferred tax assets must be reduced,<br />
this reduction will be recognized in the income statement.<br />
Contingencies<br />
By their nature, contingencies will only be resolved when one or more<br />
future events occur or fail to occur. The assessment of such contingencies<br />
inherently involves the exercise of significant judgment and estimates of<br />
the outcome of future events.<br />
Functional and presentation currency<br />
The presentation currency of these consolidated financial statements is the<br />
US dollar.<br />
The functional currency is determined separately for each of the Group’s<br />
entities. For all Russian entities, the majority of costs and revenues are<br />
denominated in Russian roubles, and accordingly, their functional currency<br />
is the Russian rouble. The functional currency of the Group’s entities located<br />
in North America is the US dollar. The functional currency of the majority<br />
of the Group’s entities located in Western Europe is the Euro.<br />
<strong>Severstal</strong> <strong>Annual</strong> <strong>Report</strong> <strong>2007</strong> 77
Financial statements<br />
OAO <strong>Severstal</strong> and subsidiaries<br />
Notes to the consolidated financial statements<br />
for the year ended December 31, <strong>2007</strong><br />
(Amounts expressed in thousands of US dollars, except as otherwise stated)<br />
The translation into the presentation currency is made as follows:<br />
– all assets and liabilities, both monetary and non-monetary, are<br />
translated at the closing exchange rates at the dates of each balance<br />
sheet presented;<br />
– all income and expenses in each income statement are translated at<br />
the average exchange rates for the periods presented; and<br />
– all resulting exchange differences are recognized as a separate<br />
component in equity,<br />
Any conversion of amounts into US dollars should not be construed as<br />
a representation that such amounts have been, could be, or will be in the<br />
future, convertible into US dollars at the exchange rates used, or at any<br />
other exchange rate.<br />
Adoption of new and revised IFRS<br />
As of January 1, <strong>2007</strong>, the Group has adopted IFRS 7 “Financial<br />
Instruments: Disclosures” which is effective for annual reporting periods<br />
beginning on or after 1 January <strong>2007</strong>, and the consequential amendments<br />
to IAS 1 “Presentation of Financial Statements”.<br />
The impact of the adoption of IFRS 7 and the changes to IAS 1 has been<br />
to expand the disclosures provided in these financial statements regarding<br />
the Group’s financial instruments (see note 33) and management of capital<br />
(see note 27).<br />
Four Interpretations issued by the International Financial <strong>Report</strong>ing<br />
Interpretations Committee are effective for the current period. These are:<br />
IFRIC 7 “Applying the Restatement Approach under IAS 29, Financial<br />
<strong>Report</strong>ing in Hyperinflationary Economies”; IFRIC 8 “Scope of IFRS 2”; IFRIC<br />
9 “Reassessment of Embedded Derivatives”; and IFRIC 10 “Interim Financial<br />
<strong>Report</strong>ing and Impairment”. The adoption of these Interpretations did not<br />
affect the Group’s financial statements.<br />
New accounting pronouncements<br />
At the date of authorization of these financial statements, the following<br />
Interpretations were in issue but not yet effective:<br />
– IAS 1 (Revised) “Presentation of Financial Statements”;<br />
– IAS 23 (Revised) “Borrowing Costs”;<br />
– IAS 27 (Revised) “Consolidated and Separate Financial Statements”;<br />
– IFRS 2 “Share-based payments”;<br />
– IFRS 3 (Revised) “Business Combinations”;<br />
– IFRS 8 “Operating Segments”;<br />
– IFRIC 11 “IFRS 2: Group and Treasury Share Transactions”;<br />
– IFRIC 12 “Service Concession Arrangements”;<br />
– IFRIC 13 “Customer Loyalty Programmes”; and<br />
– IFRIC 14 “IAS 19 – The Limit on a Defined Benefit Asset, Minimum<br />
Funding Requirements and their Interaction”.<br />
The impact of adoption of these standards and interpretations in the<br />
preparation of consolidated financial statement in future periods is currently<br />
being assessed by management. No material effect on the Group’s financial<br />
statements is anticipated.<br />
Reclassifications<br />
In order to conform with the current year presentation the following<br />
reclassifications to the prior years were made:<br />
2006 2005<br />
Increase/ Increase/<br />
(decrease) (decrease)<br />
Cost of sales (22,192) (17,562)<br />
General and administrative expenses 4,812 5,294<br />
Distribution expenses 44,987 34,230<br />
Indirect taxes and contributions (27,184) (21,962)<br />
Net other operating expenses (423) –<br />
3. Summary of the principal accounting policies<br />
The following significant accounting policies have been consistently applied<br />
in the preparation of these consolidated financial statements.<br />
a. Basis of consolidation<br />
Subsidiaries<br />
Subsidiaries are those enterprises controlled, directly or indirectly, by the<br />
Parent Company. The financial statements of subsidiaries are included<br />
in these consolidated financial statements from the date that control<br />
effectively commences until the date that control effectively ceases.<br />
The minority interest represents the minorities’ proportion of the net<br />
identifiable assets of the subsidiaries, including the minorities’ share<br />
of fair value adjustments on acquisitions.<br />
Intra-group balances and transactions, and any unrealized gains<br />
arising from intra-group transactions, are eliminated in preparing these<br />
consolidated financial statements.<br />
Investments in associates<br />
Associates are those enterprises in which the Group has significant influence,<br />
but does not have control over the financial and operating policies. These<br />
consolidated financial statements include the Group's share of the total<br />
recognized gains and losses of associates accounted for on an equity<br />
accounting basis, from the date that significant influence effectively<br />
commences until the date that significant influence effectively ceases.<br />
When the Group’s share of losses exceeds the carrying amount of the<br />
associate, the carrying amount is reduced to nil and recognition of further<br />
losses is discontinued except to the extent that the Group has incurred<br />
obligations in respect of the associate.<br />
Where a group entity transacts with an associate of the Group, profits<br />
and losses are eliminated to the extent of the Group’s interest in the<br />
relevant associate.<br />
Interests in joint ventures<br />
A joint venture is a contractual arrangement whereby the Group and other<br />
parties undertake an economic activity that is subject to joint control that is<br />
when the strategic financial and operating policy decisions relating to the<br />
activities of the joint venture require the unanimous consent of the parties<br />
sharing control.<br />
78 <strong>Severstal</strong> <strong>Annual</strong> <strong>Report</strong> <strong>2007</strong>
OAO <strong>Severstal</strong> and subsidiaries<br />
Notes to the consolidated financial statements<br />
for the year ended December 31, <strong>2007</strong><br />
(Amounts expressed in thousands of US dollars, except as otherwise stated)<br />
Where a Group entity undertakes its activities under joint venture<br />
arrangements directly, the Group’s share of jointly controlled assets and any<br />
liabilities incurred jointly with other venturers are recognized in the financial<br />
statements of the relevant entity and classified according to their nature.<br />
Liabilities and expenses incurred directly in respect of interests in jointly<br />
controlled assets are accounted for on an accrual basis. Income from the<br />
sale or use of the Group’s share of the output of jointly controlled assets,<br />
and its share of joint venture expenses, are recognized when it is probable<br />
that the economic benefits associated with the transactions will flow<br />
to/from the Group and their amount can be measured reliably.<br />
Joint venture arrangements that involve the establishment of a<br />
separate entity in which each venturer has an interest are referred to as<br />
jointly controlled entities. The Group reports its interests in jointly controlled<br />
entities using the equity method.<br />
Where the Group transacts with its jointly controlled entities, profits and<br />
losses are eliminated to the extent of the Group’s interest in the joint venture.<br />
Accounting for business combinations of entities under common control<br />
IFRS provides no guidance on accounting for business combinations of<br />
entities under common control. Management adopted the accounting<br />
policy for such transactions based on the relevant guidance of accounting<br />
principles generally accepted in the United States (‘US GAAP’).<br />
Management believes that this approach and the accounting policy<br />
disclosed below are in compliance with IFRS.<br />
Acquisitions of controlling interests in companies that were previously<br />
under the control of the same controlling shareholder as the Group have<br />
been accounted for as if the acquisition had occurred at the beginning of<br />
the earliest comparative period presented or, if later, at the date on which<br />
control was obtained by the common controlling shareholder. The assets<br />
and liabilities acquired have been recognized at their book values. The<br />
components of equity of the acquired companies have been added to the<br />
same components within Group equity except that any share capital of the<br />
acquired companies has been recorded as part of additional paid in capital.<br />
Cash consideration for such acquisitions has been recognized as a liability<br />
to or a reduction of receivables from related parties, with a corresponding<br />
reduction in equity, from the date the acquired company is included in<br />
these consolidated financial statements until the cash consideration is paid.<br />
Parent Company shares issued in consideration for the acquired companies<br />
are recognized from the moment the acquired companies are included in<br />
these financial statements.<br />
Acquisitions by the Majority Shareholder of additional interests in the<br />
acquired companies, after control over those companies has been obtained<br />
by the Majority Shareholder, are treated as if those additional interests were<br />
acquired by the Group. No goodwill is recognized on these transactions.<br />
The difference between the share of net assets acquired and the cost of<br />
investment is recognized directly in equity.<br />
Goodwill<br />
Goodwill arising on the acquisition of a subsidiary, associate or a jointly<br />
controlled entity represents the excess of the cost of acquisition over the<br />
Group’s interest in the net fair value of the identifiable assets, liabilities and<br />
contingent liabilities of the subsidiary, associate or jointly controlled entity<br />
recognized at the date of acquisition. Goodwill is initially recognized as an<br />
asset at cost and is subsequently measured at cost less any accumulated<br />
impairment losses. Goodwill in respect of subsidiaries is disclosed as an<br />
intangible asset and goodwill relating to associates and jointly controlled<br />
entities is included within the carrying value of the investments in these entities.<br />
Where an investment in subsidiary, associate or jointly control entity is<br />
made, any excess of the Group’s share in the fair value acquiree’s of the<br />
identifiable assets, liabilities and contingent liabilities over the cost of<br />
acquisition is recognized in the income statement immediately.<br />
b. Foreign currency<br />
Foreign currency transactions<br />
Transactions in foreign currencies are translated to the functional currency<br />
of each entity at the foreign exchange rate ruling on the date of the<br />
transaction. Monetary assets and liabilities denominated in foreign<br />
currencies at the balance sheet date are translated to the functional<br />
currency of each entity at the foreign exchange rate ruling at that date.<br />
Non-monetary assets and liabilities denominated in foreign currencies are<br />
translated to the functional currency of the entity at the foreign exchange<br />
rate ruling at the date of the transaction. Foreign exchange gains and losses<br />
arising on translation are recognized in the income statement.<br />
c. Property, plant and equipment<br />
Change in accounting policy for property, plant and equipment<br />
In <strong>2007</strong>, management decided to change the accounting policy for<br />
property, plant and equipment from the revaluation model to the cost<br />
model. Management believes that the change to the cost model provides<br />
reliable financial information which is more relevant for the users of the<br />
financial statements primarily due to the fact that <strong>Severstal</strong>’s competitors<br />
use the cost model to account for property, plant and equipment.<br />
Accordingly, the change enhances comparability with competitors.<br />
In accordance with IAS 8 “Accounting Policies, Changes in Accounting<br />
Estimates and Errors” the change in accounting policy has been applied<br />
retrospectively and comparative figures have been restated. The effect<br />
of the change on the comparative figures is:<br />
December 31, December 31,<br />
2006 2005<br />
Decrease in inventory (19,582) –<br />
Decrease in property, plant and equipment (4,081,303) (3,528,892)<br />
Decrease in deferred tax liabilities 978,712 849,255<br />
Decrease in equity attributable to<br />
shareholders of parent 3,052,185 2,641,627<br />
Decrease in minority interest 69,988 38,010<br />
Year ended December 31,<br />
2006 2005<br />
Decrease in cost of sales 340,457 –<br />
Decrease in loss on disposal of property,<br />
plant and equipment 31,777 –<br />
Decrease/(increase) in impairment of property,<br />
plant and equipment 29 (176,543)<br />
(Increase)/decrease in income tax expense (93,918) 42,370<br />
Increase/(decrease) in profit for the year 278,345 (134,173)<br />
Increase/(decrease) in basic and diluted<br />
earnings per share (US dollars) 0.30 (0.15)<br />
<strong>Severstal</strong> <strong>Annual</strong> <strong>Report</strong> <strong>2007</strong> 79
Financial statements<br />
OAO <strong>Severstal</strong> and subsidiaries<br />
Notes to the consolidated financial statements<br />
for the year ended December 31, <strong>2007</strong><br />
(Amounts expressed in thousands of US dollars, except as otherwise stated)<br />
There were no changes in profit for the year or total equity relating to<br />
periods before 2005.<br />
The Group did not obtain the fair values of its property, plant and<br />
equipment as of December 31, <strong>2007</strong>. Accordingly, it was not practicable<br />
to determine the effects on the current and future years of the change in<br />
accounting policy.<br />
New accounting policy for property, plant and equipment<br />
Property, plant and equipment are carried at cost less accumulated<br />
depreciation and accumulated impairment losses. Cost includes expenditure<br />
that is directly attributable to the acquisition of the asset and, for qualifying<br />
assets, borrowing costs capitalized in accordance with the Group’s<br />
accounting policy. In the case of assets constructed by the Group, related<br />
works and direct project overheads are included in cost. Repair and<br />
maintenance expenses are charged to the income statement as incurred.<br />
Gains or losses on disposals of property, plant and equipment are recognized<br />
in the income statement.<br />
Depreciation is provided so as to write off property, plant and<br />
equipment over its expected useful life. Depreciation is calculated using<br />
the straight line basis, except for depreciation on vehicles and certain<br />
metal-rolling equipment, which is calculated on the basis of mileage and<br />
units of production, respectively. The estimated useful lives of assets are<br />
reviewed regularly and revised when necessary.<br />
The principal periods over which assets are depreciated are as follows:<br />
Buildings and constructions<br />
20 – 50 years<br />
Plant and machinery<br />
10 – 20 years<br />
Other productive assets<br />
5 – 20 years<br />
Community and infrastructure assets 5 – 50 years<br />
d. Lease<br />
Leases are classified as finance leases whenever the terms of the lease<br />
transfer substantially all the risks and rewards of ownership to the Group.<br />
All other leases are classified as operating leases.<br />
Assets held under finance leases are initially recognized as assets of<br />
the Group at their fair value at the inception of the lease or, if lower, at the<br />
present value of the minimum lease payments. The corresponding liability<br />
to the lessor is included in the balance sheet as a finance lease obligation.<br />
Lease payments are apportioned between finance charges and<br />
reduction of the lease obligation so as to achieve a constant rate of interest<br />
on the remaining balance of the liability. Finance charges are charged<br />
directly to the income statement as part of interest expense.<br />
Operating lease payments are recognized as an expense on a straightline<br />
basis over the lease term, except where another systematic basis is<br />
more representative of the time pattern in which economic benefits from<br />
the leased asset are consumed.<br />
e. Intangible assets (excluding goodwill)<br />
Intangible assets are reported at cost less accumulated amortisation and<br />
accumulated impairment losses. Amortisation is charged on a straight-line<br />
basis over their estimated useful lives. The estimated useful life and<br />
amortisation method are reviewed at the end of each annual reporting<br />
period, with the effect of any changes in estimate being accounted for<br />
on a prospective basis.<br />
f. Asset impairment<br />
The carrying amount of goodwill is tested for impairment annually.<br />
The carrying amounts of the Group’s other assets are reviewed at each<br />
balance sheet date to determine whether there is any indication of<br />
impairment. If any such indication exists, the asset’s recoverable amount is<br />
estimated. An impairment loss is recognized whenever the carrying amount<br />
of an asset or its cash-generating unit exceeds its recoverable amount.<br />
Calculation of recoverable amount<br />
The recoverable amount of the Group’s held-to-maturity investments and<br />
loans and receivables, is calculated as the present value of expected future<br />
cash flows, discounted at the effective interest rate inherent in the asset.<br />
For other assets the recoverable amount is the greater of the net selling price<br />
and value in use. In assessing value in use, the estimated future cash flows<br />
are discounted to their present value using a pre-tax discount rate that<br />
reflects current market assessments of the time value of money and the<br />
risks specific to the asset. For an asset that does not generate cash inflows<br />
largely independent of those from other assets, the recoverable amount<br />
is determined for the cash-generating unit to which the asset belongs.<br />
Reversals of impairment<br />
An impairment loss in respect of a held-to-maturity investment, loan or<br />
receivable is reversed if the subsequent increase in recoverable amount<br />
can be related objectively to an event occurring after the impairment loss<br />
was recognized. An impairment loss in respect of goodwill is not reversed.<br />
In respect of other assets, an impairment loss is reversed if there has been<br />
a change in the estimates used to determine the recoverable amount.<br />
An impairment loss is reversed only to the extent that the asset’s carrying<br />
amount does not exceed the carrying amount that would have been<br />
determined, net of depreciation or amortisation, if no impairment loss<br />
had been recognized.<br />
g. Inventories<br />
Inventories are stated at the lower of cost and net realizable value.<br />
Net realizable value is the estimated selling price in the ordinary course<br />
of business, less the estimated costs of completion and selling expenses.<br />
The cost of inventories is based on the weighted average principle and<br />
includes expenditure incurred in acquiring the inventories and bringing<br />
them to their existing location and condition. In the case of manufactured<br />
inventories and work in progress, cost includes an appropriate share of<br />
production overheads. Provisions are recorded against slow moving and<br />
obsolete inventories.<br />
h. Financial assets<br />
Financial assets include cash and cash equivalents, investments, and loans<br />
and receivables.<br />
Cash and cash equivalents comprise cash balances, cash deposits and<br />
highly liquid investments with original maturities of three months or less,<br />
that are readily convertible to known amounts of cash and are subject to<br />
an insignificant risk of changes in value.<br />
Financial assets are classified into the following specified categories:<br />
financial assets ‘at fair value through profit or loss’ (FVTPL), ‘held-tomaturity’<br />
investments, ‘available-for-sale’ (AFS) financial assets and ‘loans<br />
and receivables’. The classification depends on the nature and purpose of<br />
the financial assets and is determined at the time of initial recognition.<br />
80 <strong>Severstal</strong> <strong>Annual</strong> <strong>Report</strong> <strong>2007</strong>
OAO <strong>Severstal</strong> and subsidiaries<br />
Notes to the consolidated financial statements<br />
for the year ended December 31, <strong>2007</strong><br />
(Amounts expressed in thousands of US dollars, except as otherwise stated)<br />
Effective interest method<br />
The effective interest method is a method of calculating the carrying value<br />
of a financial asset held at amortized cost and of allocating interest income<br />
over the relevant period. The effective interest rate is the rate that exactly<br />
discounts estimated future cash receipts (including all fees on points paid or<br />
received that form an integral part of the effective interest rate, transaction<br />
costs and other premiums or discounts) through the expected life of the<br />
financial asset, or, where appropriate, a shorter period.<br />
Income is recognised on an effective interest basis for debt instruments<br />
other than those financial assets designated as at FVTPL.<br />
Financial assets at FVTPL<br />
Financial assets are classified as at FVTPL where the financial asset is either<br />
held for trading or it is designated as at FVTPL.<br />
A financial asset is classified as held for trading if:<br />
– it has been acquired principally for the purpose of selling in the near future;<br />
or<br />
– it is a part of an identified portfolio of financial instruments that the<br />
Group manages together and has a recent actual pattern of short-term<br />
profit-taking.<br />
A financial asset other than a financial asset held for trading may be<br />
designated as at FVTPL upon initial recognition if:<br />
– such designation eliminates or significantly reduces a measurement<br />
or recognition inconsistency that would otherwise arise; or<br />
– the financial asset forms part of a group of financial instruments,<br />
which are managed and performance is evaluated on a fair value basis,<br />
in accordance with the Group's documented risk management or<br />
investment strategy, and information about the grouping is provided<br />
internally on that basis.<br />
Financial assets at FVTPL are stated at fair value, with any resultant gain or<br />
loss recognised in profit or loss. The net gain or loss recognised in profit or<br />
loss incorporates any dividend or interest earned on the financial asset.<br />
Held-to-maturity investments<br />
Bills of exchange and debentures with fixed or determinable payments<br />
and fixed maturity dates that the Group has the positive intent and<br />
ability to hold to maturity are classified as held-to-maturity investments.<br />
Held-to-maturity investments are recorded at amortised cost using the<br />
effective interest method less any impairment.<br />
AFS financial assets<br />
Available for sale financial assets are those non-derivative financial assets<br />
that are not classified as financial assets at FVTPL or held-to-maturity and<br />
are stated at fair value. Gains and losses arising from changes in fair value<br />
are recognised directly in equity with the exception of impairment losses,<br />
which are recognised directly in the income statement. Where the<br />
investment is disposed of or is determined to be impaired, the cumulative<br />
gain or loss previously recognised in the equity is included in the income<br />
statement for the period.<br />
Dividends on AFS equity instruments are recognised in the income<br />
statement when the Group’s right to receive the dividends is established.<br />
Loans and receivables<br />
Trade receivables, loans, and other receivables that have fixed or determinable<br />
payments that are not quoted in an active market are classified as loans and<br />
receivables. Loans and receivables are measured at amortised cost using<br />
the effective interest method, less any impairment. Interest income is<br />
recognised by applying the effective interest rate, except for short-term<br />
receivables when the recognition of interest would be immaterial.<br />
Derecognition of financial assets<br />
The Group derecognises a financial asset only when the contractual rights<br />
to the cash flows from the asset expire; or it transfers the financial asset<br />
and substantially all the risks and rewards of ownership of the asset to<br />
another entity.<br />
i. Financial liabilities<br />
Financial liabilities are classified as either financial liabilities ‘at FVTPL’<br />
or ‘other financial liabilities’.<br />
Financial liabilities at FVTPL<br />
Financial liabilities are classified as at FVTPL where the financial liability<br />
is either held for trading or it is designated as at FVTPL.<br />
A financial liability is classified as held for trading if:<br />
– it has been incurred principally for the purpose of repurchasing in the<br />
near future; or<br />
– it is a part of an identified portfolio of financial instruments that the<br />
Group manages together and has a recent actual pattern of short-term<br />
profit-taking.<br />
A financial liability other than a financial liability held for trading may be<br />
designated as at FVTPL upon initial recognition if:<br />
– such designation eliminates or significantly reduces a measurement<br />
or recognition inconsistency that would otherwise arise; or<br />
– the financial liability forms part of a group of financial instruments,<br />
which are managed and performance is evaluated on a fair value<br />
basis, in accordance with the Group's documented risk management<br />
or investment strategy, and information about the grouping is provided<br />
internally on that basis; or<br />
Financial liabilities at FVTPL are stated at fair value, with any resultant gain<br />
or loss recognized in profit or loss. The net gain or loss recognized in profit<br />
or loss incorporates any interest paid on the financial liability.<br />
Other financial liabilities<br />
Other financial liabilities, including borrowings, are initially measured at fair<br />
value, net of transaction costs. Borrowing costs on loans specifically for the<br />
purchase or construction of a qualifying asset are capitalized as part of the<br />
cost of the asset they are financing.<br />
Other financial liabilities are subsequently measured at amortized cost<br />
using the effective interest method, with interest expense recognized in<br />
the income statement.<br />
Derecognition of financial liabilities<br />
The Group derecognizes financial liabilities when, and only when, the<br />
Group’s obligations are discharged, cancelled or they expire.<br />
j. Dividends payable<br />
Dividends are recognized as a liability in the period in which they are<br />
authorized by the shareholders.<br />
k. Indirect taxes and contributions<br />
Indirect taxes and contributions are taxes and mandatory contributions<br />
paid to the government, or government controlled agencies, that are<br />
calculated on a variety of bases, but exclude taxes calculated on profits,<br />
value added taxes calculated on revenues and purchases and social<br />
security costs calculated on wages and salaries. Social security costs are<br />
included in cost of sales, distribution expenses and selling, general and<br />
administrative expenses in accordance with the nature of related wages<br />
and salaries expenses.<br />
<strong>Severstal</strong> <strong>Annual</strong> <strong>Report</strong> <strong>2007</strong> 81
Financial statements<br />
OAO <strong>Severstal</strong> and subsidiaries<br />
Notes to the consolidated financial statements<br />
for the year ended December 31, <strong>2007</strong><br />
(Amounts expressed in thousands of US dollars, except as otherwise stated)<br />
l. Income tax<br />
Income tax on the profit for the year comprises current and deferred tax.<br />
Income tax is recognized in the income statement except to the extent that<br />
it relates to items recognized directly in equity, in which case it is recognized<br />
in equity.<br />
Current tax expense is calculated by each entity on the pretax income<br />
determined in accordance with the tax law of the country, in which the<br />
entity is incorporated, using tax rates enacted at the balance sheet date,<br />
and any adjustment to tax payable in respect of previous years.<br />
Deferred tax is calculated using the balance sheet liability method,<br />
providing for temporary differences between the carrying amounts of assets<br />
and liabilities for financial reporting and taxation purposes. The amount<br />
of deferred tax provided is based on the expected manner of realization or<br />
settlement of the carrying amount of assets and liabilities, using tax rates<br />
enacted or substantially enacted at the balance sheet date. Deferred tax<br />
assets are recognized only to the extent that it is probable that future<br />
taxable profits will be available against which these assets can be utilized.<br />
Deferred tax assets are reduced to the extent that it is no longer probable<br />
that the related tax benefit will be realized.<br />
Deferred tax is not recognized in respect of the following:<br />
– investments in subsidiaries where the Group is able to control the timing<br />
of the reversal of the temporary differences and it is probable that the<br />
temporary difference will not reverse in the foreseeable future;<br />
– if it arises from the initial recognition of an asset or liability that affect<br />
neither accounting nor taxable profit,<br />
– initial recognition of goodwill.<br />
m. Provisions<br />
Retirement benefit liability<br />
The Group pays retirement and post-employment medical benefits to<br />
former employees. The calculation of the Group’s net obligation in respect<br />
of defined retirement benefit plans is performed annually by management<br />
using the projected unit credit method. In accordance with this method, the<br />
Group’s net obligation is calculated separately for each defined benefit plan<br />
by estimating the amount of future benefit that employees have earned<br />
in return for their service in the current and prior periods; that benefit is<br />
discounted to its present value and the fair value of any plan assets is<br />
deducted. The discount rate used is the yield at the balance sheet date<br />
on high quality corporate bonds for UK, USA, France and Italy and on<br />
government bonds for Russia that have maturity dates approximating<br />
the terms of the Group’s obligations. Any actuarial gain or loss arising<br />
from the calculation of the retirement benefit obligation is fully recognized<br />
in the current year’s income statement.<br />
Decommissioning liability<br />
The Group has environmental liabilities related to restoration of soil and<br />
other related works, which are due upon the closures of certain of its<br />
production sites. The Group generally estimates provisions related to<br />
environmental issues on a case-by-case basis, taking into account applicable<br />
legal requirements. A best estimate, based on available information, is<br />
calculated, provided that the available information indicates that the loss<br />
is probable. Decommissioning liabilities are estimated using existing<br />
technology, at current prices, and discounted using a real discount rate.<br />
Other provisions<br />
Other provisions are recognized in the balance sheet when the Group has a<br />
legal or constructive obligation as a result of a past event, and it is probable<br />
that an outflow of economic benefits will be required to settle the obligation.<br />
n. Revenue recognition<br />
Revenue is measured at the fair value of the consideration received or<br />
receivable. Revenue is reduced for estimated customer returns, rebates<br />
and other similar allowances.<br />
Sale of goods<br />
Revenue from the sale of goods is recognized in the income statement when<br />
the significant risks and rewards of ownership have been transferred to the<br />
buyer; the Group retains neither continuing managerial involvement to the<br />
degree usually associated with ownership nor effective control over the<br />
goods sold; the amount of revenue can be measured reliably; it is probable<br />
that the economic benefits associated with the transaction will flow to the<br />
entity; and the costs incurred or to be incurred in respect of the transaction<br />
can be measured reliably.<br />
Rendering of services<br />
Revenue from a contract to provide services is recognized by reference to<br />
the stage of completion of the contract.<br />
o. Interest income<br />
Interest income is recognized in the income statement on a time basis,<br />
by reference to the principal outstanding and at the effective interest rate<br />
applicable, which is the rate that exactly discounts estimated future cash<br />
receipts through the expected life of the financial asset to that asset’s net<br />
carrying amount.<br />
p. Interest expense<br />
Interest expense is recognized in the income statement as it accrues,<br />
taking into account the effective yield on the liability.<br />
All interest costs incurred in connection with borrowings, which are<br />
not directly attributable to the acquisition, construction or production<br />
of qualifying assets, are expensed as incurred.<br />
q. Net income from securities operations<br />
Net income from securities operations comprises dividend income (except<br />
for dividends from equity associates), realized and unrealized gains on<br />
financial assets at fair value through profit or loss, realized gains and<br />
impairment losses on available for sale and held to maturity investments.<br />
r. Earnings per share<br />
Earnings per share is calculated by dividing the net profit by the weighted<br />
average number of shares outstanding during the year, assuming that<br />
shares issued in consideration for the companies acquired from the Majority<br />
Shareholder were issued from the moment these companies are included<br />
in these consolidated financial statements.<br />
s. Discontinued operations<br />
Discontinued operations are disclosed when a component of the Group<br />
either has been disposed of during the reporting period, or is classified<br />
as held for sale or other type of disposal at the balance sheet date. This<br />
condition is regarded as met only when the disposal is highly probable<br />
within one year from the date of classification.<br />
The comparative income statement is presented as if the operation<br />
had been discontinued from the beginning of the comparative period.<br />
Assets and liabilities of a disposal group are presented in the balance<br />
sheet separately from other assets and liabilities. Comparative information<br />
related to discontinued operations is not amended in the balance sheet.<br />
82 <strong>Severstal</strong> <strong>Annual</strong> <strong>Report</strong> <strong>2007</strong>
OAO <strong>Severstal</strong> and subsidiaries<br />
Notes to the consolidated financial statements<br />
for the year ended December 31, <strong>2007</strong><br />
(Amounts expressed in thousands of US dollars, except as otherwise stated)<br />
4. Sales<br />
Sales by product were as follows:<br />
Year ended December 31,<br />
<strong>2007</strong> 2006 2005<br />
Hot-rolled strip and plate 3,681,592 3,435,545 3,443,571<br />
Long products 3,097,933 2,301,550 1,436,830<br />
Galvanized and other metallic coated sheet 1,307,317 1,105,521 1,051,370<br />
Cold-rolled sheet 1,258,641 1,328,063 1,540,951<br />
Semifinished products 1,101,902 939,351 879,627<br />
Metalware products 1,002,180 833,877 574,458<br />
Shipping and handling costs billed to customers 644,000 537,411 174,156<br />
Large diameter pipes 530,726 – –<br />
Others tubes and pipes, formed shapes 391,708 320,413 210,590<br />
Rails, wheels and axles 321,751 375,270 149,121<br />
Pellets and iron ore 304,825 242,697 337,516<br />
Scrap 301,482 26,513 19,500<br />
Color coated sheet 281,071 148,458 –<br />
Coal and coking coal concentrate 264,753 249,280 143,140<br />
Others 755,030 605,083 490,816<br />
15,244,911 12,449,032 10,451,646<br />
Sales by delivery destination were as follows:<br />
Year ended December 31,<br />
<strong>2007</strong> 2006 2005<br />
Russian Federation 6,744,113 4,912,642 3,785,133<br />
Europe 5,308,680 4,390,786 2,751,196<br />
North America 1,889,280 2,406,090 2,198,248<br />
The Middle East 450,360 215,056 353,286<br />
China and Central Asia 353,550 138,016 569,898<br />
South-East Asia 291,052 143,553 408,228<br />
Central & South America 151,281 156,685 237,087<br />
Africa 56,595 86,204 148,570<br />
15,244,911 12,449,032 10,451,646<br />
5. Staff costs<br />
Employment costs were as follows:<br />
Year ended December 31,<br />
<strong>2007</strong> 2006 2005<br />
Wages and salaries (1,505,630) (1,262,613) (964,528)<br />
Social security costs (414,462) (301,407) (247,524)<br />
Retirement benefit costs (Note 25) (7,719) (2,385) (3,806)<br />
(1,927,811) (1,566,405) (1,215,858)<br />
Actuarial gains/(losses) recognized (Note 25) 37,056 (67,658) (62,380)<br />
Staff costs (1,890,755) (1,634,063) (1,278,238)<br />
For the year ended December 31, <strong>2007</strong>, key management’s remuneration totalled US$ 57.2 million (2006: US$ 44.5 million; 2005: US$ 39.0 million).<br />
As a part of the above amounts US$ 40.1 million and US$ 35.7 million were paid to the Group’s related party, ZAO <strong>Severstal</strong> Group that employed<br />
executive officers of <strong>Severstal</strong> and seconded them to <strong>Severstal</strong> during the years ended December 31, 2006 and 2005 respectively.<br />
<strong>Severstal</strong> <strong>Annual</strong> <strong>Report</strong> <strong>2007</strong> 83
Financial statements<br />
OAO <strong>Severstal</strong> and subsidiaries<br />
Notes to the consolidated financial statements<br />
for the year ended December 31, <strong>2007</strong><br />
(Amounts expressed in thousands of US dollars, except as otherwise stated)<br />
6. Net income from securities operations<br />
Year ended December 31,<br />
<strong>2007</strong> 2006 2005<br />
Held-for-trading securities<br />
Profit on disposal – 153 133<br />
Restatement to fair value 3,864 401 1,160<br />
Held-to-maturity securities and loans<br />
Restatement to fair value (discounting) 3,577 13,909 4,209<br />
Available-for-sale securities<br />
Profit on disposal 11,849 6,376 28,405<br />
Reversal of impairment/(impairment) 4,012 7,183 (13,076)<br />
Dividends received 2,262 241 3,612<br />
25,564 28,263 24,443<br />
7. Net other non-operating expenses<br />
Year ended December 31,<br />
<strong>2007</strong> 2006 2005<br />
Social expenditure (42,468) (33,857) (28,408)<br />
Charitable donations (41,276) (17,060) (13,283)<br />
Depreciation of community and infrastructure assets (6,339) (3,465) (1,303)<br />
Gain/(loss) on disposal of subsidiaries and associates 31,507 846 (9,759)<br />
(58,576) (53,536) (52,753)<br />
8. Financing<br />
Year ended December 31,<br />
<strong>2007</strong> 2006 2005<br />
Interest income:<br />
Third parties 148,752 70,835 52,150<br />
Related parties 24,185 31,567 12,984<br />
172,937 102,402 65,134<br />
Interest expense:<br />
Third parties (277,622) (236,950) (195,517)<br />
Related parties (1,663) (3,158) (2,963)<br />
Amortization of transaction costs (9,008) (4,869) (4,577)<br />
(288,293) (244,977) (203,057)<br />
9. Taxation<br />
The following is an analysis of the income tax expense:<br />
Year ended December 31,<br />
<strong>2007</strong> 2006 2005<br />
Current tax charge (783,070) (608,760) (586,708)<br />
Corrections to prior year’s current tax charge 15,416 (13,152) (7,176)<br />
Deferred tax benefit/(expense) 86,385 (13,386) 92,977<br />
Income tax expense (681,269) (635,298) (500,907)<br />
84 <strong>Severstal</strong> <strong>Annual</strong> <strong>Report</strong> <strong>2007</strong>
OAO <strong>Severstal</strong> and subsidiaries<br />
Notes to the consolidated financial statements<br />
for the year ended December 31, <strong>2007</strong><br />
(Amounts expressed in thousands of US dollars, except as otherwise stated)<br />
The following table is a reconciliation of the reported net income tax expense and the amount calculated by applying the Russian statutory tax rate of 24%<br />
to reported profit before income tax.<br />
Year ended December 31,<br />
<strong>2007</strong> 2006 2005<br />
Profit before income tax 2,654,455 2,112,429 2,125,465<br />
Tax charge at Russian statutory rate – 24% (637,069) (506,983) (510,112)<br />
Profits taxed at different rates (35,784) (36,247) 12,786<br />
Corrections to prior years’s current tax charge 15,416 (13,152) (7,176)<br />
Net gain on tax restructuring – 3,521 41,803<br />
Non-tax deductible expenses, net (37,843) (76,920) (55,171)<br />
Tax-loss carry forwards expired (18,494) (17,462) (67,629)<br />
Changes in non-recognized deferred tax assets 32,505 32,375 73,839<br />
Reassessment of deferred tax liabilities – (20,430) 10,753<br />
Income tax expense (681,269) (635,298) (500,907)<br />
Income tax charge for the year ended December 31, <strong>2007</strong> includes tax expense of US$ 1.3 million (2006: US$ 2.7 million, 2005: US$ 2.4 million) related<br />
to profits from discontinued operations (see note 29) and tax expense of US$ 9.0 million related to gains on disposals of discontinued operations (2006: nil,<br />
2005: nil).<br />
The composition of, and movements in, the net deferred tax liability based on the temporary differences arising between the fiscal and reporting<br />
balance sheets of the consolidated companies, is given below:<br />
December 31,<br />
<strong>2007</strong> 2006 2005<br />
Deferred tax assets:<br />
Tax-loss carry forwards 33,382 48,610 67,123<br />
Property, plant and equipment 21,565 18,205 24,477<br />
Provisions 25,689 15,707 11,320<br />
Financial investments – 2,770 14,530<br />
Other 6,198 10,108 30,750<br />
Less: non-recognized deferred tax assets (34,510) (65,250) (113,124)<br />
Deferred tax assets 52,324 30,150 35,076<br />
Deferred tax liabilities:<br />
Property, plant and equipment (435,436) (456,466) (390,914)<br />
Provisions 82,524 65,859 52,153<br />
Tax-loss carry forwards 15,991 – –<br />
Other (37,715) (12,469) (17,978)<br />
Deferred tax liabilities (374,636) (403,076) (356,739)<br />
The movement in the net deferred tax liability is as follows:<br />
Year ended December 31,<br />
<strong>2007</strong> 2006 2005<br />
Opening balance (372,926) (321,663) (339,616)<br />
Recognized in income statement 86,385 (13,386) 92,977<br />
Business combinations 3,461 (10,421) (95,447)<br />
Business de-combinations 8,491 – 913<br />
Reclassified to assets held for sale (24,913) – –<br />
Foreign exchange difference (22,810) (27,456) 19,510<br />
Closing balance (322,312) (372,926) (321,663)<br />
As at December 31, <strong>2007</strong> the Group had not recognized cumulative tax-loss carry forwards of US$ 104.7 million that expire as follows: in 2008:<br />
US$ 44.4 million; and US$ 60.3 million have no expiry date.<br />
Temporary differences, related to investments in subsidiaries where the Group is able to control the timing of the reversal and it is probable that the<br />
temporary difference will not reverse in the foreseeable future, amounted to US$ 1,905.7 million at December 31, <strong>2007</strong> (December 31, 2006:<br />
US$ US$ 1,088.5 million; December 31, 2005, US$ 733.9 million respectively).<br />
<strong>Severstal</strong> <strong>Annual</strong> <strong>Report</strong> <strong>2007</strong> 85
Financial statements<br />
OAO <strong>Severstal</strong> and subsidiaries<br />
Notes to the consolidated financial statements<br />
for the year ended December 31, <strong>2007</strong><br />
(Amounts expressed in thousands of US dollars, except as otherwise stated)<br />
10. Cash and cash equivalents<br />
December 31,<br />
<strong>2007</strong> 2006 2005<br />
Petty cash 607 254 429<br />
Cash at bank 1,181,536 427,944 389,807<br />
Escrow accounts 82 6,994 18,918<br />
Short-term deposits with maturity of less than 3 months 364,656 893,829 687,166<br />
Investments in quoted monetary instruments – 62,327 88,320<br />
Cash balances of consolidated bank:<br />
Cash – 1,171 823<br />
Nostro accounts at the Central Bank of Russia – 110,036 39,781<br />
Nostro accounts at other banks – 6,637 16,997<br />
Placements with banks – 191,830 85,646<br />
1,546,881 1,701,022 1,327,887<br />
As described in note 28 to these consolidated financial statements, as at December 31, 2006 and December 31, 2005 the Group had a subsidiary OAO<br />
Metallurgical commercial bank (“Metcombank”). Nostro accounts of Metcombank at the Central Bank of Russia and at other banks and interbank loans<br />
given by Metcombank with an original maturity of three months or less were included in cash and equivalents as at December 31, 2006 and 2005<br />
respectively.<br />
11. Short-term bank deposits<br />
Short-term bank deposits totaled US$ 666.0 million at December 31, <strong>2007</strong> (December 31, 2006: US$ 1,147.3 million, December 31, 2005:<br />
US$ 674.5 million) and comprised of deposits with an original maturity of more than three months but remaining period to maturity of less than<br />
one year. The majority of such deposits have an original maturity of less than 6 months, and such deposits are used by the Group to earn investment<br />
income, while preserving a high liquidity position. Substantially all such deposits can be withdrawn, in case of necessity, prior to the maturity date with<br />
no loss in principal but reduced interest income.<br />
12. Short-term financial investments<br />
December 31,<br />
<strong>2007</strong> 2006 2005<br />
Held-for-trading securities:<br />
Promissory notes and bonds of third parties 26,834 128,375 72,429<br />
Promissory notes of related parties 7,457 5,198 4,772<br />
Quoted equity securities 56,003 19,143 1,079<br />
Other securities 56,270 – –<br />
Loans:<br />
Loans to related parties 82,205 75,699 81,133<br />
Loans to third parties 38,046 11,912 24,408<br />
Loans to bank customers:<br />
Third parties – 54,991 71,232<br />
Related parties – 29,166 15,739<br />
Loan loss provisions – (2,758) (3,008)<br />
Available-for-sale securities 818 116 67<br />
267,633 321,842 267,851<br />
Loans given to related parties were provided at interest rates ranging from nil to 15% per annum, and were given to finance working capital and investments.<br />
86 <strong>Severstal</strong> <strong>Annual</strong> <strong>Report</strong> <strong>2007</strong>
OAO <strong>Severstal</strong> and subsidiaries<br />
Notes to the consolidated financial statements<br />
for the year ended December 31, <strong>2007</strong><br />
(Amounts expressed in thousands of US dollars, except as otherwise stated)<br />
13. Trade accounts receivable<br />
December 31,<br />
<strong>2007</strong> 2006 2005<br />
Customers 1,701,268 1,351,529 1,217,836<br />
Allowance for doubtful accounts (26,650) (26,944) (43,643)<br />
1,674,618 1,324,585 1,174,193<br />
14. Related party balances<br />
December 31,<br />
<strong>2007</strong> 2006 2005<br />
Joint ventures’ balances<br />
Trade accounts payable 16,353 12,675 5,929<br />
Other related party balances<br />
Cash and cash equivalents at related party banks 239,909 542 33,046<br />
Deposits with related party banks 18,985 – –<br />
Amounts receivable from other related parties:<br />
Trade accounts receivable 43,770 80,296 172,164<br />
Advances paid 90,961 34,299 18,158<br />
Other receivables 27,988 13,108 18,581<br />
Short-term loans 82,205 75,699 81,133<br />
Short-term promissory notes 7,457 5,198 4,772<br />
Short-term loans to bank customers – 29,166 15,739<br />
Long-term loans 37,147 76,528 43,003<br />
Long-term loans to bank customers – 7,078 –<br />
Held-to-maturity securities and deposits 79,129 56,237 1,988<br />
368,657 377,609 355,538<br />
Amounts payable to other related parties:<br />
Trade accounts payable 36,886 73,528 114,448<br />
Advances received 3,843 732 2,026<br />
Payable for Lucchini acquisition – – 216,483<br />
Other accounts payable 1,833 14,182 119,430<br />
Bank demand deposits – 58,719 16,302<br />
Bank term deposits – 15,904 17,339<br />
42,562 163,065 486,028<br />
Debt financing includes the following balances with other related parties:<br />
Short-term debt financing 36,866 4,893 27,059<br />
Long-term debt financing 1,536 7,500 74<br />
38,402 12,393 27,133<br />
<strong>Severstal</strong> <strong>Annual</strong> <strong>Report</strong> <strong>2007</strong> 87
Financial statements<br />
OAO <strong>Severstal</strong> and subsidiaries<br />
Notes to the consolidated financial statements<br />
for the year ended December 31, <strong>2007</strong><br />
(Amounts expressed in thousands of US dollars, except as otherwise stated)<br />
15. Related party transactions<br />
Year ended December 31,<br />
<strong>2007</strong> 2006 2005<br />
Sales and income received from other related parties:<br />
Sales 701,868 725,714 665,589<br />
Interest income 24,185 31,567 12,984<br />
726,053 757,281 678,573<br />
Purchases from related parties:<br />
Purchases from associates:<br />
Non-capital expenditures 1,810 1,878 7,956<br />
Purchases from joint ventures:<br />
Non-capital expenditures 218,912 139,752 77,464<br />
Purchases from other related parties:<br />
Non-capital expenditures 666,137 1,012,740 647,643<br />
Capital expenditures 8,572 130,769 57,413<br />
674,709 1,143,509 705,056<br />
16. Inventories<br />
December 31,<br />
<strong>2007</strong> 2006 2005<br />
Raw materials and supplies 1,346,320 1,239,119 899,758<br />
Work-in-progress 459,051 389,660 319,992<br />
Finished goods 732,099 593,593 505,778<br />
2,537,470 2,222,372 1,725,528<br />
Of the above amounts US$ 162.2 million (December 31, 2006: US$ 146.9 million, December 31, 2005: US$ 193.6 million) are stated at net realizable value.<br />
During the year ended December 31, <strong>2007</strong>, the Group recognized a US$ 24.9 million release and a US$ 25.5 million accrual of inventory obsolescence<br />
provision (December 31, 2006: US$ 32.2 million and US$ 8.2 million respectively; December 31, 2005: US$ 20.8 million and US$ 1.0 million respectively).<br />
17. Other current assets<br />
December 31,<br />
<strong>2007</strong> 2006 2005<br />
Advances paid and prepayments 232,998 185,767 144,892<br />
Other taxes and social security prepaid 16,359 19,578 12,809<br />
Reserves at Central Bank of Russia – 12,325 4,938<br />
Other assets 72,005 41,538 19,046<br />
321,362 259,208 181,685<br />
88 <strong>Severstal</strong> <strong>Annual</strong> <strong>Report</strong> <strong>2007</strong>
OAO <strong>Severstal</strong> and subsidiaries<br />
Notes to the consolidated financial statements<br />
for the year ended December 31, <strong>2007</strong><br />
(Amounts expressed in thousands of US dollars, except as otherwise stated)<br />
18. Intangible assets<br />
Other<br />
Mineral<br />
intangible<br />
Goodwill licences Software assets Total<br />
Cost:<br />
December 31, 2004 1,439 – 4,871 4,975 11,285<br />
Additions – 29,732 2,590 – 32,322<br />
Business combinations – – 22,407 2,036 24,443<br />
Disposal – – (271) – (271)<br />
Foreign exchange difference (1) (512) (1,599) (684) (2,796)<br />
December 31, 2005 1,438 29,220 27,998 6,327 64,983<br />
Additions – 4,717 1,473 2,618 8,808<br />
Disposals – – – (337) (337)<br />
Foreign exchange difference 2 2,948 3,033 689 6,672<br />
December 31, 2006 1,440 36,885 32,504 9,297 80,126<br />
Additions – 11,884 12,546 5,625 30,055<br />
Business combinations 505,501 164 – 58,140 563,805<br />
Disposals – – (6,161) (966) (7,127)<br />
Reclassified to assets held for sale – (34,254) – – (34,254)<br />
Business de-combinations – – (6,224) (4,728) (10,952)<br />
Foreign exchange difference 4,336 2,729 2,701 3,157 12,923<br />
December 31, <strong>2007</strong> 511,277 17,408 35,366 70,525 634,576<br />
Amortization and impairment:<br />
December 31, 2004 21 – – 3,975 3,996<br />
Amortization expense – – 4,979 – 4,979<br />
Disposals – – (264) – (264)<br />
Foreign exchange difference (1) – (157) (93) (251)<br />
December 31, 2005 20 – 4,558 3,882 8,460<br />
Amortization expense – 1,708 5,045 2,240 8,993<br />
Disposals – – – (249) (249)<br />
Foreign exchange difference 2 55 823 376 1,256<br />
December 31, 2006 22 1,763 10,426 6,249 18,460<br />
Amortization expense – 2,070 3,229 3,308 8,607<br />
Disposals – – (6,161) (396) (6,557)<br />
Reclassified to assets held for sale – (3,602) – – (3,602)<br />
Business combinations – 29 – 12,338 12,367<br />
Business de-combinations – – (3,924) (3,923) (7,847)<br />
Foreign exchange difference 2 214 844 827 1,887<br />
December 31, <strong>2007</strong> 24 474 4,414 18,403 23,315<br />
Net book values:<br />
December 31, 2005 1,418 29,220 23,440 2,445 56,523<br />
December 31, 2006 1,418 35,122 22,078 3,048 61,666<br />
December 31, <strong>2007</strong> 511,253 16,934 30,952 52,122 611,261<br />
<strong>Severstal</strong> <strong>Annual</strong> <strong>Report</strong> <strong>2007</strong> 89
Financial statements<br />
OAO <strong>Severstal</strong> and subsidiaries<br />
Notes to the consolidated financial statements<br />
for the year ended December 31, <strong>2007</strong><br />
(Amounts expressed in thousands of US dollars, except as otherwise stated)<br />
19. Property, plant and equipment<br />
The movements in property, plant and equipment are as follows:<br />
Community<br />
Other<br />
and<br />
Land and Plant and productive infrastructure Constructionbuildings<br />
machinery assets assets in-progress Total assets<br />
Cost:<br />
December 31, 2004 1,041,866 2,725,924 186,909 40,743 753,664 4,749,106<br />
Reclassifications (6,288) 6,908 215 (835) – –<br />
Additions:<br />
External – – – – 1,216,875 1,216,875<br />
Interest capitalised – – – – 13,128 13,128<br />
Business combinations 417,874 1,067,527 3,051 – 50,337 1,538,789<br />
Disposals (5,087) (66,679) (10,294) (1,243) (12,972) (96,275)<br />
Business de-combinations (5,542) (5,720) (24) – (258) (11,544)<br />
Transfer to other assets – – – – (12,060) (12,060)<br />
Transfers 109,826 595,373 59,452 22,622 (787,273) –<br />
Foreign exchange difference (73,628) (195,505) (8,031) (1,759) (33,840) (312,763)<br />
December 31, 2005 1,479,021 4,127,828 231,278 59,528 1,187,601 7,085,256<br />
Reclassifications (3,170) 6,769 (4,676) 1,077 – –<br />
Additions:<br />
External – – – – 1,243,514 1,243,514<br />
Interest capitalised – – – – 10,129 10,129<br />
Business combinations 81,452 11,203 917 687 1,728 95,987<br />
Disposals (8,789) (199,593) (20,782) (765) (22,244) (252,173)<br />
Business de-combinations – – – (394) – (394)<br />
Transfer to other assets – – – – (11,907) (11,907)<br />
Transfers 401,347 1,259,628 35,821 15,809 (1,712,605) –<br />
Foreign exchange difference 164,215 415,750 22,769 6,063 90,446 699,243<br />
December 31, 2006 2,114,076 5,621,585 265,327 82,005 786,662 8,869,655<br />
Reclassifications 9,978 (26,117) 6,669 9,470 – –<br />
Additions:<br />
External – – – – 1,594,681 1,594,681<br />
Interest capitalised – – – – 4,101 4,101<br />
Business combinations 77,829 108,055 2,501 631 9,563 198,579<br />
Disposals (11,318) (187,234) (11,885) (14,613) (6,256) (231,306)<br />
Business de-combinations (53,885) (154,917) (4,262) (2,277) (4,981) (220,322)<br />
Reclassified to assets held for sale (182,171) (166,972) (13,863) (152) (56,508) (419,666)<br />
Transfer to other assets – (7,793) – – (23,729) (31,522)<br />
Transfers 183,703 1,126,899 74,378 26,683 (1,411,663) –<br />
Foreign exchange difference 167,214 452,205 24,806 7,583 60,669 712,477<br />
December 31, <strong>2007</strong> 2,305,426 6,765,711 343,671 109,330 952,539 10,476,677<br />
90 <strong>Severstal</strong> <strong>Annual</strong> <strong>Report</strong> <strong>2007</strong>
OAO <strong>Severstal</strong> and subsidiaries<br />
Notes to the consolidated financial statements<br />
for the year ended December 31, <strong>2007</strong><br />
(Amounts expressed in thousands of US dollars, except as otherwise stated)<br />
Community<br />
Other<br />
and<br />
Land and Plant and productive infrastructure Constructionbuildings<br />
machinery assets assets in-progress Total assets<br />
Depreciation and impairment:<br />
December 31, 2004 180,364 887,179 62,523 21,592 113,889 1,265,547<br />
Reclassifications (3,187) 5,315 (834) (1,294) – –<br />
Depreciation expense 72,601 385,036 32,678 1,303 – 491,618<br />
Disposals (1,591) (37,181) (5,680) (1,188) (2,962) (48,602)<br />
Business de-combinations (625) (2,011) (10) – – (2,646)<br />
Transfers 402 6,080 659 17,071 (24,212) –<br />
Impairment of assets 8,662 80,367 2,489 5,046 14,820 111,384<br />
Foreign exchange difference (7,660) (36,387) (2,757) (1,133) (3,676) (51,613)<br />
December 31, 2005 248,966 1,288,398 89,068 41,397 97,859 1,765,688<br />
Reclassifications (3,640) 5,515 (1,678) (197) – –<br />
Depreciation expense 112,891 448,901 29,490 3,465 – 594,747<br />
Business combinations 1,634 91 277 3 – 2,005<br />
Disposals (3,718) (169,249) (14,274) (561) (11,056) (198,858)<br />
Business de-combinations – – – (374) – (374)<br />
Transfers 7,952 2,165 3 5,003 (15,123) –<br />
Impairment of assets 10,454 33,169 1,824 2,605 9,684 57,736<br />
Foreign exchange difference 27,274 131,173 8,846 4,189 6,844 178,326<br />
December 31, 2006 401,813 1,740,163 113,556 55,530 88,208 2,399,270<br />
Reclassifications 1,583 (4,650) 565 2,502 – –<br />
Depreciation expense 139,192 614,696 33,861 6,339 – 794,088<br />
Business combinations 23,541 26,970 1,051 17 – 51,579<br />
Disposals (2,714) (148,664) (9,227) (1,309) (1,186) (163,100)<br />
Business de-combinations (6,806) (51,376) (1,312) (1,869) (69) (61,432)<br />
Reclassified to assets held for sale (22,223) (63,321) (5,190) (17) (6,043) (96,794)<br />
Transfers 3,215 304 58 4,956 (8,533) –<br />
Impairment of assets 2,112 15,226 (36) 2,441 9,366 29,109<br />
Foreign exchange difference 40,491 167,022 11,027 4,751 7,855 231,146<br />
December 31, <strong>2007</strong> 580,204 2,296,370 144,353 73,341 89,598 3,183,866<br />
Net book values:<br />
December 31, 2005 1,230,055 2,839,430 142,210 18,131 1,089,742 5,319,568<br />
December 31, 2006 1,712,263 3,881,422 151,771 26,475 698,454 6,470,385<br />
December 31, <strong>2007</strong> 1,725,222 4,469,341 199,318 35,989 862,941 7,292,811<br />
Other productive assets include transmission equipment, transportation equipment and tools.<br />
20. Investment in associates and joint ventures<br />
The Group’s investment in associated and joint ventures companies is described in the tables below. Group structure and certain additional information on<br />
investments in associated and joint ventures companies, including ownership percentages, is given in note 28.<br />
December 31,<br />
<strong>2007</strong> 2006 2005<br />
Associates<br />
<strong>Severstal</strong> US Holdings LLC 386,105 132,076 59,415<br />
Air Liquide <strong>Severstal</strong> 7,537 7,026 3,214<br />
TA Cord – 844 2,108<br />
Others 1,276 2,811 2,927<br />
Joint ventures<br />
Double Eagle Steel Coating Company 22,936 28,859 26,409<br />
Spartan Steel Coating LLC 53,978 63,818 56,374<br />
Mountain State Carbon LLC 117,260 119,472 60,205<br />
589,092 354,906 210,652<br />
<strong>Severstal</strong> <strong>Annual</strong> <strong>Report</strong> <strong>2007</strong> 91
Financial statements<br />
OAO <strong>Severstal</strong> and subsidiaries<br />
Notes to the consolidated financial statements<br />
for the year ended December 31, <strong>2007</strong><br />
(Amounts expressed in thousands of US dollars, except as otherwise stated)<br />
The following is summarized financial information in respect of associates and joint ventures:<br />
December 31,<br />
<strong>2007</strong> 2006 2005<br />
Assets 1,797,458 1,269,330 515,409<br />
Liabilities 965,270 615,767 85,206<br />
Equity 832,188 653,563 430,203<br />
Year ended December 31,<br />
<strong>2007</strong> 2006 2005<br />
Revenues 440,272 373,765 178,655<br />
Net income/(loss) (105,326) 3,262 (2,964)<br />
<strong>Severstal</strong> US Holdings LLC, was created by <strong>Severstal</strong> and its related parties as a holding company for the SeverCorr project – construction of a mini mill in the<br />
United States of America. By December 31, <strong>2007</strong>, <strong>Severstal</strong> have contributed to the project US$ 461.6 million and provided a US dollar denominated loan<br />
to SeverCorr LLC in the amount of US$ 60.0 million. The loan is repayable in 2008 and bears interest at 15% per annum. By December 31, <strong>2007</strong>, related<br />
parties of <strong>Severstal</strong> have contributed to the project US$ 81.8 million. Having completed those contributions, <strong>Severstal</strong> and its related parties have fully<br />
fulfilled their financing obligations for this project.<br />
By December 31, 2006, the Group, through its subsidiary <strong>Severstal</strong> North America Inc, had contributed US$ 120.0 million to the Mountain State Carbon<br />
LLC, a joint venture with Wheeling-Pittsburgh Steel Corporation (“Wheeling-Pittsburgh”). Wheeling-Pittsburgh had contributed to the joint venture all of<br />
its coking assets in Follansbee, USA, valued at US$ 86.9 million, and US$ 3.1 million in cash. This cash and US$ 30.0 million of additional contributions<br />
from Wheeling-Pittsburgh over the next three years to 2009 will be used to rehabilitate all of the coke batteries of the joint venture and provide the Group’s<br />
US integrated steel operations a reliable and competitive supply of metallurgical coke. Each partner has a 50% share in Mountain State Carbon LLC from<br />
April 2006.<br />
21. Long-term financial investments<br />
December 31,<br />
<strong>2007</strong> 2006 2005<br />
Loans:<br />
Loans to related parties 37,147 76,528 43,003<br />
Loans to third parties 10,305 30,556 31,936<br />
Loans to bank customers:<br />
Related parties – 7,078 –<br />
Third parties – 19,226 –<br />
Available-for-sale securities 26,285 10,315 12,614<br />
Held-to-maturity securities and deposits 79,129 56,237 1,988<br />
152,866 199,940 89,541<br />
22. Bank customer accounts<br />
December 31,<br />
<strong>2007</strong> 2006 2005<br />
Demand deposits – 22,103 30,502<br />
Term deposits – 9,040 68,365<br />
– 31,143 98,867<br />
92 <strong>Severstal</strong> <strong>Annual</strong> <strong>Report</strong> <strong>2007</strong>
OAO <strong>Severstal</strong> and subsidiaries<br />
Notes to the consolidated financial statements<br />
for the year ended December 31, <strong>2007</strong><br />
(Amounts expressed in thousands of US dollars, except as otherwise stated)<br />
23. Debt finance<br />
December 31,<br />
<strong>2007</strong> 2006 2005<br />
Citibank CLN – Eurobonds 2009 325,000 325,000 325,000<br />
Citibank CLN – Eurobonds 2014 375,000 375,000 375,000<br />
Other issued bonds – 113,934 327,446<br />
Bank financing 2,357,588 1,901,046 1,628,709<br />
Factoring of receivables 201,909 224,049 191,732<br />
Other financing 51,046 29,679 60,674<br />
Accrued interest 40,355 54,748 39,720<br />
Unamortized balance of transaction costs (23,996) (17,857) (20,462)<br />
3,326,902 3,005,599 2,927,819<br />
Total debt is denominated in the following currencies:<br />
US Dollars 1,501,465 1,210,753 1,287,620<br />
Roubles 391,196 345,728 338,894<br />
Euro 1,432,490 1,449,118 1,301,305<br />
Other currencies 1,751 – –<br />
3,326,902 3,005,599 2,927,819<br />
Total debt is contractually repayable after the balance sheet date as follows:<br />
Less than one year 972,079 957,564 996,125<br />
Between one and five years 1,659,450 1,488,594 1,496,325<br />
After more than five years 695,373 559,441 435,369<br />
3,326,902 3,005,599 2,927,819<br />
Debt finance rose from banks and unused long term credit lines are secured by charges over:<br />
– US$ 210.4 million (December 31, 2006: US$ 221.3 million; December 31, 2005: US$ 129.4 million) net book value of plant and equipment;<br />
– US$ 515.7 million (December 31, 2006: US$ 1,015.6 million; December 31, 2005: US$ 1,296.2 million) of current assets and revenues from export<br />
contracts; and,<br />
– US$ 243.4 million (December 31, 2006: US$ 365.9 million; December 31, 2005: US$ 97.1 million) of financial assets.<br />
A part of the Group’s debt financing is subject to certain covenants. The Group complied with all debt covenants, including equity ratios, during the years<br />
ended December 31, <strong>2007</strong>, 2006 and 2005.<br />
At the balance sheet date the Group had US$ 983.7 million (December 31, 2006: US$ 422.1 million; December 31, 2005: US$ 319.9 million) of unused<br />
long term credit lines available to it.<br />
24. Other current liabilities<br />
December 31,<br />
<strong>2007</strong> 2006 2005<br />
Amounts payable to employees 246,448 186,431 149,757<br />
Advances received 214,405 230,696 156,494<br />
Provisions (Note 26) 43,974 12,011 17,736<br />
Accrued expenses 24,123 41,396 19,525<br />
Lease liabilities 9,926 2,579 1,964<br />
Other liabilities 61,704 33,735 33,742<br />
600,580 506,848 379,218<br />
<strong>Severstal</strong> <strong>Annual</strong> <strong>Report</strong> <strong>2007</strong> 93
Financial statements<br />
OAO <strong>Severstal</strong> and subsidiaries<br />
Notes to the consolidated financial statements<br />
for the year ended December 31, <strong>2007</strong><br />
(Amounts expressed in thousands of US dollars, except as otherwise stated)<br />
25. Retirement benefit liability<br />
The Group provides for its employees the following retirement benefits, which are actuarially calculated as defined benefit obligation: lump sums payable to<br />
employees on retirement, monthly pensions, jubilee benefits, invalidity and death lump sums, burial expenses compensations and other benefits.<br />
The following assumptions have been used to calculate the retirement benefit liability:<br />
December 31,<br />
<strong>2007</strong> 2006 2005<br />
Discount rates:<br />
Russia 6.47% 6.46% 6.85%<br />
USA 5.25% 5.75% 5.50%<br />
UK 3.10% 4.90% n/a<br />
Italy and France 5.10 to 5.45% 4.60% 4.0 to 5.0%<br />
Future rates of benefit increase:<br />
Russia 5.8 to 6.2% 6.20% 6.20%<br />
USA 0.00% 0.00% 0.00%<br />
UK 3.40% 2.80% n/a<br />
Italy and France 2.0 to 3.0% 3.00% 3.0 to 3.5%<br />
Rates shown for USA are the post-retirement healthcare trend rates. Due to a new labor contract at <strong>Severstal</strong> North America the following healthcare trend<br />
rates apply to the hourly plan:<br />
<strong>2007</strong>: 9%<br />
2008: 9%<br />
2009: 8%<br />
2010: 0%<br />
Hourly plan liability that is incurred to these rates is US$ 35.2 million.<br />
Present value of the defined benefit obligation with the deduction of fair value of the plan assets is recognized as retirement benefit liability at the<br />
balance sheet.<br />
December 31,<br />
<strong>2007</strong> 2006 2005 2004 2003<br />
Present value of the defined benefit obligation 495,713 549,009 387,657 208,325 61,152<br />
Fair value of the plan assets (108,315) (106,055) (49,171) (50,302) (29,127)<br />
Retirement benefit liability 387,398 442,954 338,486 158,023 32,025<br />
The components of the retirement benefit liabilities are as follows:<br />
December 31,<br />
<strong>2007</strong> 2006 2005<br />
Retirees 172,244 140,658 103,915<br />
Other participants:<br />
Vested 126,890 203,334 133,443<br />
Non-vested 196,579 205,017 150,299<br />
Total 495,713 549,009 387,657<br />
94 <strong>Severstal</strong> <strong>Annual</strong> <strong>Report</strong> <strong>2007</strong>
OAO <strong>Severstal</strong> and subsidiaries<br />
Notes to the consolidated financial statements<br />
for the year ended December 31, <strong>2007</strong><br />
(Amounts expressed in thousands of US dollars, except as otherwise stated)<br />
The movements in the defined benefit obligation are as follows:<br />
Year ended December 31,<br />
<strong>2007</strong> 2006 2005<br />
Opening balance 549,009 387,657 208,325<br />
Business combinations/(de-combinations) (33,612) 39,328 149,110<br />
Reclassified to assets held for sale (9,260) – –<br />
Benefits paid (55,238) (33,547) (36,241)<br />
Interest cost 27,589 24,962 19,144<br />
Service cost 18,640 18,767 12,890<br />
Actuarial (gain)/loss (37,497) 68,573 56,139<br />
Foreign exchange loss/(gain) 36,082 43,269 (21,710)<br />
Closing balance 495,713 549,009 387,657<br />
The movements in the plan assets are as follows:<br />
Year ended December 31,<br />
<strong>2007</strong> 2006 2005<br />
Opening balance 106,055 49,171 50,302<br />
Business combinations/(de-combinations) (10,122) 28,566 –<br />
Contributions made during the year 11,534 13,424 16,641<br />
Benefits paid (14,852) (12,356) (18,787)<br />
Return on assets 10,921 16,382 9,084<br />
Actuarial gain/(loss) (441) 915 (6,241)<br />
Foreign exchange gain/(loss) 5,220 9,953 (1,828)<br />
Closing balance 108,315 106,055 49,171<br />
Defined benefit obligation analysis is as follows:<br />
Year ended December 31,<br />
<strong>2007</strong> 2006 2005<br />
Wholly unfunded 258,926 284,485 238,098<br />
Partly funded 236,787 264,524 149,559<br />
Total 495,713 549,009 387,657<br />
Plan assets analysis is as follows:<br />
December 31,<br />
<strong>2007</strong> 2006 2005<br />
Equity instruments 44,448 44,450 20,625<br />
Government bonds 28,548 28,850 20,009<br />
Corporate bonds 14,964 14,178 –<br />
Deposits 3,037 1,980 3,132<br />
Cash 1,170 1,417 511<br />
Other investments 16,148 15,180 4,894<br />
Total 108,315 106,055 49,171<br />
The Group’s best estimate of contributions expected to be paid to the plan during the year 2008 is US$ 8.5 million. Expected rate of return on plan assets<br />
was 17.0% for Russia and 4.95% for United Kingdom during <strong>2007</strong>. Actual rate of return on plan assets was 16.1% for Russia and 4.95% for United<br />
Kingdom during <strong>2007</strong>.<br />
The retirement benefit expenses recognized in the income statement are contained in the caption: ‘General and administrative expenses’, except for<br />
the interest cost, which is recognized in the caption ‘Interest expense’.<br />
<strong>Severstal</strong> <strong>Annual</strong> <strong>Report</strong> <strong>2007</strong> 95
Financial statements<br />
OAO <strong>Severstal</strong> and subsidiaries<br />
Notes to the consolidated financial statements<br />
for the year ended December 31, <strong>2007</strong><br />
(Amounts expressed in thousands of US dollars, except as otherwise stated)<br />
26. Other non-current liabilities<br />
December 31,<br />
<strong>2007</strong> 2006 2005<br />
Decommissioning liability 108,762 128,209 102,885<br />
Restructured tax liabilities 24,978 67,731 97,368<br />
Provisions 66,859 67,139 50,610<br />
Lease liabilities 14,610 13,742 9,498<br />
Other 11,179 9,269 20,714<br />
226,388 286,090 281,075<br />
Decommissioning liability<br />
The Group has environmental liabilities related to restoration of soil and other related works, which are due upon the closures of its coal mines. These<br />
liabilities have been estimated using existing technology, at current prices, and discounted using a real discount rate of 2%. A substantial part of the<br />
decommissioning costs is expected to be incurred between 2020 and 2040.<br />
Restructured tax liabilities<br />
OAO Vorkutaugol and OAO Mine Vorgashorskaya had significant amounts of taxes in arrears, when they were acquired by the Group’s Majority Shareholder<br />
in June 2003.<br />
In November 2005, these subsidiaries signed restructuring agreements with the tax authorities. In accordance with these agreements, the principal<br />
amounts of taxes, and fines thereon and 15% of tax interest are payable by instalments over four years. If those payments are made on schedule, the<br />
remaining 85% of tax interest liability at the date of restructuring will be forgiven. The Group’s management is confident that all payments will be in<br />
accordance with the agreed schedules, and accordingly recognized a US$ 200.9 million gain on tax restructuring in the income statement for the year<br />
ended December 31, 2005. This gain is comprised of US$ 186.8 million of tax interest, which will be forgiven, and has been derecognized from liabilities,<br />
and US$ 14.1 million of discounting of the remaining liabilities using the interest rate of 9.86%. During 2005, tax authorities accrued an additional<br />
US$ 26.7 million of tax interest on tax liabilities being restructured. These amounts were recognized as an expense in the income statement for the year<br />
ended December 31, 2005. During 2006, the Group was able to include part of this tax interest into restructuring, recognizing a gain of US$ 14.7 million<br />
in the income statement for the year ended December 31, 2006. Restructured tax liabilities are subject to interest rate of 5% per annum, which is included<br />
in the caption “Interest expense” since the moment of restructuring.<br />
Accordingly, net gain on restructuring of tax liabilities is shown in the income statement as following:<br />
Year ended December 31,<br />
<strong>2007</strong> 2006 2005<br />
Tax interest accrued prior to restructuring – – (26,675)<br />
Gain on restructuring of tax liabilities – 14,669 200,853<br />
Net gain on restructuring of tax liabilities – 14,669 174,178<br />
Current portion of restructured tax liabilities is included in the caption ‘Other taxes and social security payable’. The total amount of the restructured taxes<br />
is presented in the table below:<br />
December 31,<br />
<strong>2007</strong> 2006 2005<br />
Payable within one year 20,960 43,553 26,059<br />
Payable after one year 24,978 67,731 97,368<br />
45,938 111,284 123,427<br />
Provisions<br />
The current portion of provisions is included in the caption ‘Other current liabilities’. The total amount of the provisions is presented in the table below:<br />
December 31,<br />
<strong>2007</strong> 2006 2005<br />
Social security claims 30,259 28,689 23,020<br />
Other employee related 16,075 13,578 12,984<br />
Legal claims 27,423 21,917 17,004<br />
Restructuring 8,284 5,569 –<br />
Environmental claim 24,416 6,052 9,657<br />
Other 4,376 3,345 5,681<br />
110,833 79,150 68,346<br />
96 <strong>Severstal</strong> <strong>Annual</strong> <strong>Report</strong> <strong>2007</strong>
OAO <strong>Severstal</strong> and subsidiaries<br />
Notes to the consolidated financial statements<br />
for the year ended December 31, <strong>2007</strong><br />
(Amounts expressed in thousands of US dollars, except as otherwise stated)<br />
December 31,<br />
<strong>2007</strong> 2006 2005<br />
Payable within one year 43,974 12,011 17,736<br />
Payable after one year 66,859 67,139 50,610<br />
110,833 79,150 68,346<br />
These provisions represent management’s best estimate of the potential losses arising in these cases. The actual outcome of those cases is currently<br />
uncertain, and might differ from the recorded provisions.<br />
27. Share capital<br />
The Parent Company’s share capital consists of ordinary shares with a nominal value of RUR 0.01 each. Authorized share capital of <strong>Severstal</strong> at<br />
December 31, 2005 comprised 551,854,800 shares and was fully issued and paid on that date. At December 31, <strong>2007</strong> and 2006, <strong>Severstal</strong> had<br />
1,007,701,355 issued and fully paid shares.<br />
The nominal amount of initial share capital was converted into US dollars using exchange rates during the Soviet period, when the Government<br />
contributed the original capital funds to the enterprise. These capital funds were converted into ordinary shares on September 24, 1993 and sold by the<br />
Government at privatization auctions.<br />
Consequently, the total value of issued share capital presented in these consolidated financial statements comprises:<br />
Number of<br />
shares, thsd.<br />
Share capital at December 31, 2005 917,268 3,311,254<br />
Share capital at December 31, 2006 1,007,701 3,311,288<br />
Share capital at December 31, <strong>2007</strong> 1,007,701 3,311,288<br />
All shares carry equal voting and distribution rights.<br />
Capital management<br />
The Group’s policy is to maintain a strong capital base so as to maintain investor, creditor and market confidence and to sustain future development of the<br />
business. This policy includes compliance with certain externally imposed minimum capital requirements. The Group’s management constantly monitors<br />
profitability and leverage ratios and compliance with the minimum capital requirements. The Group uses the return on assets ratio which is defined as profit<br />
from operations divided by total assets (averaged over the measurement period) and the leverage ratio calculated as net debt, comprising of long-term and<br />
short-term indebtedness less cash, cash equivalents and short-term bank deposits, divided by shareholder’s equity. The level of dividends is also monitored<br />
by the Board of Directors of the Group.<br />
There were no changes in the Group’s approach to capital management during the year.<br />
Dividends<br />
The maximum dividend payable is restricted to the total accumulated retained earnings of the Parent Company determined according to Russian law.<br />
As at the balance sheet date, reserves available for distribution, were US$ 5,894.9 million (December 31, 2006: US$ 4,667.6 million; December 31, 2005:<br />
US$ 3,308.6 million).<br />
On June 15, <strong>2007</strong> the Meeting of Shareholders approved annual dividend of 5.0 rubles (US$ 0.2 at June 15, <strong>2007</strong> exchange rate) per share and per GDR<br />
in respect of 2006.<br />
On June 29, <strong>2007</strong> the Meeting of Shareholders approved a dividend of 2.6 rubles (US$ 0.1 at June 29, <strong>2007</strong> exchange rate) per share and per GDR for<br />
the first quarter of <strong>2007</strong> with the record date of May 18, <strong>2007</strong>.<br />
On September 28, <strong>2007</strong> the Meeting of Shareholders approved a dividend of 10.0 rubles (US$ 0.4 at September 28, <strong>2007</strong> exchange rate) per share and<br />
per GDR for the first half of <strong>2007</strong>.<br />
On December 20, <strong>2007</strong> the Meeting of Shareholders approved a dividend of 2.5 rubles (US$ 0.1 at December 20, <strong>2007</strong> exchange rate) per share and<br />
per GDR in respect of the third quarter of <strong>2007</strong>.<br />
US$’000<br />
<strong>Severstal</strong> <strong>Annual</strong> <strong>Report</strong> <strong>2007</strong> 97
Financial statements<br />
OAO <strong>Severstal</strong> and subsidiaries<br />
Notes to the consolidated financial statements<br />
for the year ended December 31, <strong>2007</strong><br />
(Amounts expressed in thousands of US dollars, except as otherwise stated)<br />
28. Subsidiaries, associates and joint ventures<br />
The following is a list of the Group’s significant subsidiaries, associates and joint ventures and the effective ownership holdings therein:<br />
December 31,<br />
Company <strong>2007</strong> 2006 2005 Location Activity<br />
Russian Steel segment:<br />
Subsidiaries:<br />
ZAO Severgal 100.0% 75.0% 75.0% Russia Hot dip galvanizing<br />
ZAO <strong>Severstal</strong> SMZ-Kolpino 100.0% n/a n/a Russia Steel constructions<br />
ZAO <strong>Severstal</strong> TPZ-Sheksna 100.0% n/a n/a Russia Steel constructions<br />
ZAO <strong>Severstal</strong> Steel Solutions 100.0% n/a n/a Russia Steel constructions<br />
OOO SSM-Tyazhmash 100.0% 100.0% 100.0% Russia Repairs&construction<br />
OAO Domnaremont 82.7% 82.1% 56.4% Russia Repairs&construction<br />
ZAO Firma Stoik 100.0% 100.0% 100.0% Russia Repairs&construction<br />
OAO Metallurgremont 79.8% 79.8% 79.3% Russia Repairs&construction<br />
OOO Energoremont 100.0% 100.0% 100.0% Russia Repairs&construction<br />
OOO Electroremont 93.3% 93.3% 93.3% Russia Repairs&construction<br />
Victory Industries, Inc 100.0% 100.0% n/a USA Repairs&construction<br />
OOO Uralmash MO n/a 100.0% 100.0% Russia Engineering<br />
OOO AviaCompany <strong>Severstal</strong> 100.0% 100.0% 100.0% Russia Air transport<br />
<strong>Severstal</strong> Export GmbH 100.0% 100.0% 100.0% Switzerland* Steel sales<br />
AS <strong>Severstal</strong>lat 50.5% 50.5% 50.5% Latvia* Steel sales<br />
Latvijas Metals 50.5% 50.5% 50.5% Latvia* Steel sales<br />
ZAO SeverStalBel 80.6% n/a n/a Belarus* Steel sales<br />
<strong>Severstal</strong>-Ukraine LLC. 51.0% n/a n/a Ukraine* Steel sales<br />
Armaturu Servisa Centrs SIA 25.2% 25.2% 25.2% Latvia* Steel service center<br />
ZAO Neva-Metall Trans 100.0% n/a n/a Russia Shipping operations<br />
ZAO Neva-Metall 100.0% n/a n/a Russia Shipping operations<br />
Upcroft Limited 100.0% 100.0% 100.0% Cyprus* Holding company***<br />
Varndell Limited 100.0% 100.0% 100.0% Cyprus* Holding company***<br />
Associates:<br />
<strong>Severstal</strong> US Holdings LLC** 85.0% 63.3% 60.0% USA* Holding company<br />
<strong>Severstal</strong> North America segment:<br />
Subsidiaries:<br />
<strong>Severstal</strong> North America Inc 100.0% 100.0% 93.0% USA Iron & steel mill<br />
Associates:<br />
Delaco Processing LLC 49.0% 49.0% 45.6% USA Steel slitting<br />
Joint ventures:<br />
Spartan Steel Coating LLC 48.0% 48.0% 44.6% USA Hot dip galvanizing<br />
Double Eagle Steel Coating company 50.0% 50.0% 46.5% USA Electro-galvanizing<br />
Mountain State Carbon LLC 50.0% 50.0% 31.0% USA Coking coal<br />
*Russian Steel segment contains Russian production entities, foreign trading companies, which are selling products primarily produced in Russia, and other foreign companies,<br />
which either provide services to Russian production entities or are managed from Russia.<br />
**20.1% of ordinary shares at December 31, <strong>2007</strong> (December 31, 2006: 20.2%; December 31, 2005: 19.9%).<br />
***Upcroft is holding 29.0% of Lucchini SpA and Varndell is holding 50.8% of Lucchini SpA.<br />
98 <strong>Severstal</strong> <strong>Annual</strong> <strong>Report</strong> <strong>2007</strong>
OAO <strong>Severstal</strong> and subsidiaries<br />
Notes to the consolidated financial statements<br />
for the year ended December 31, <strong>2007</strong><br />
(Amounts expressed in thousands of US dollars, except as otherwise stated)<br />
December 31,<br />
Company <strong>2007</strong> 2006 2005 Location Activity<br />
Lucchini segment:<br />
Subsidiaries:<br />
Lucchini SpA 79.8% 70.8% 70.8% France Holding company<br />
Ascometal SAS 79.8% 70.8% 70.8% France Steel manufacturing<br />
Ascometal GmbH 79.8% 70.8% 70.8% Germany Sales<br />
Ascoforge Safe SAS n/a 70.8% 70.8% France Forgings<br />
Bari Fonderie Meridionali SpA 79.8% 70.8% 70.8% Italy Forgings<br />
Bi-Mec Srl 79.8% 70.8% 70.8% Italy Maintenance<br />
GSI Lucchini SpA 55.3% 49.1% 49.1% Italy Steel spheres<br />
Nitruvid SAS n/a 70.8% 70.8% France Steel finishing<br />
Lucchini Asia Pacific Pte Ltd 79.8% 70.8% 70.8% Singapore Sales<br />
Lucchini Holland BV 79.8% 70.8% 70.8% Netherlands Investment holding<br />
Lucchini HPS GmbH n/a 23.5% 46.0% Germany Sales<br />
Lucchini Iberia SI 79.8% 70.8% 70.8% Spain Sales<br />
Lucchini Poland Spzoo n/a 70.8% 70.8% Poland Machining<br />
Lucchini Servizi Srl 79.8% 70.8% 70.8% Italy Dormant<br />
Lucchini Sidermeccanica SpA n/a 70.8% 70.8% Italy Casting and machining<br />
Lucchini Siderprodukte AG 51.9% 46.0% 46.0% Switzerland Sales<br />
Lucchini Sweden AB n/a 70.8% 70.8% Sweden Machining<br />
Lucchini UK Ltd n/a 70.8% 70.8% UK Machining<br />
Lucchini USA Inc 79.8% 70.8% 70.8% USA Sales<br />
Servola SpA 79.8% 70.8% 70.8% Italy Asset holding<br />
Sideris Steel SAS 79.8% 70.8% 70.8% France Investment holding<br />
Simmofos Sarl 79.8% 70.8% 70.8% France Asset holding<br />
Sipro HPS AG n/a n/a 46.0% Switzerland Sales<br />
Vertek Srl 79.8% 70.8% 70.8% Italy Steel finishing<br />
Siderco SpA 79.8% n/a n/a Italy Slag processor<br />
Associates:<br />
ESPRA SAS 27.9% 24.8% 24.8% France Steel scrap<br />
Logistica Servola Srl 39.9% 35.4% 35.4% Italy Dormant<br />
Setrans Srl n/a 21.2% 21.2% Italy Logistics and storage<br />
Tecnologie Ambientali Pulite Srl 19.9% 17.6% 17.6% Italy Environmental services<br />
GICA SA 19.9% n/a n/a Switzerland Carbon dioxide trading<br />
Companies classified as held for sale:<br />
Relco Spzoo 79.8% 70.8% 70.8% Poland Land holding<br />
Coimpex Spzoo 31.9% 28.3% 28.3% Poland Land holding<br />
Metalware segment:<br />
Subsidiaries:<br />
OAO <strong>Severstal</strong>-Metiz 97.0% 97.0% 100.0% Russia Steel machining<br />
OAO Dneprometiz 58.2% 58.2% nil% Ukraine Steel machining<br />
Carrington Wire Ltd 97.0% 97.0% nil% UK Steel machining<br />
OAO Cherepovets Steel Rolling Mill n/a n/a 88.8% Russia Steel machining<br />
OAO Orlovsky Steel Rolling Mill n/a n/a 87.2% Russia Steel machining<br />
OOO Volgometiz n/a 100.0% 100.0% Russia Steel machining<br />
OOO Policher n/a 87.3% 80.0% Russia Polymer coatings<br />
OOO UniFence 97.0% n/a n/a Russia Steel machining<br />
OOO ChSPZ MKR (UniSpring) 97.0% 48.5% 44.4% Russia Mattress springs<br />
<strong>Severstal</strong> <strong>Annual</strong> <strong>Report</strong> <strong>2007</strong> 99
Financial statements<br />
OAO <strong>Severstal</strong> and subsidiaries<br />
Notes to the consolidated financial statements<br />
for the year ended December 31, <strong>2007</strong><br />
(Amounts expressed in thousands of US dollars, except as otherwise stated)<br />
December 31,<br />
Company <strong>2007</strong> 2006 2005 Location Activity<br />
Mining segment:<br />
Subsidiaries:<br />
OAO Karelsky Okatysh 94.8% 90.8% 90.8% Russia Iron ore pellets<br />
OAO Olkon 92.7% 91.8% 91.6% Russia Iron ore concentrate<br />
OAO Vorkutaugol 93.1% 89.2% 88.1% Russia Coking coal concentrate<br />
OAO Mine Vorgashorskaya 75.0% 73.6% 70.2% Russia Coking coal concentrate<br />
OAO Mine Pervomaiskaya 99.4% 99.1% 99.1% Russia Coking coal concentrate<br />
OAO Mine Berezovskaya 97.5% 96.3% 96.0% Russia Coking coal concentrate<br />
OAO SShEMK 75.6% 75.6% 75.6% Russia Engineering<br />
OAO Severokuzbasskoe PTU 87.3% 87.3% 87.3% Russia Transportation<br />
OAO Anzhero-Sudzhenskoe PTU 94.4% 94.4% 94.4% Russia Transportation<br />
ZAO Vtorchermet 84.8% n/a n/a Russia Processing scrap<br />
ZAO Rospromresursy 100.0% n/a n/a Russia Processing scrap<br />
OAO Murmanskvtormet 75.1% n/a n/a Russia Processing scrap<br />
OAO Arhangelskii vtormet 75.0% n/a n/a Russia Processing scrap<br />
OOO Nerengri-Metallik 100.0% n/a n/a Russia Gold mining<br />
ZAO Rudnik Aprelkovo 100.0% n/a n/a Russia Gold mining<br />
Celtic Resources Holdings Plc 86.3% n/a n/a Ireland Gold mining<br />
OOO SPB-Giproshakht 100.0% n/a n/a Russia Engineering<br />
OAO Pechorugol n/a 99.3% 99.3% Russia Holding company<br />
OOO Olkon-Invest n/a 100.0% 100.0% Russia Holding company<br />
OOO Terra n/a 100.0% 100.0% Russia Holding company<br />
OOO Holding Gornaya Company 100.0% 100.0% 100.0% Russia Holding company<br />
ZAO Impulse-Consult n/a 100.0% 100.0% Russia Holding company<br />
OOO Investment Company Kuzbassugol n/a 100.0% 100.0% Russia Holding company<br />
Financing segment:<br />
Subsidiaries:<br />
OAO Metallurgical Commercial Bank n/a 72.9% 72.6% Russia Banking<br />
IPM segment:<br />
Subsidiaries:<br />
ZAO Izhora Pipe Mill 100.0% 100.0% 100.0% Russia Wide pipes<br />
In addition, at the balance sheet date, a further 34 (December 31, 2006: 26; December 31, 2005: 26) subsidiaries and associates, which are not material<br />
to the Group, either individually or in aggregate, have been included in these consolidated financial statements.<br />
Information on carrying amounts, acquisitions and disposals of associated companies is disclosed in Note 20 of these consolidated financial<br />
statements.<br />
During <strong>2007</strong>, <strong>Severstal</strong> completed acquisitions of controlling stakes in a number of companies previously controlled by <strong>Severstal</strong>’s Majority Shareholder.<br />
These consolidated financial statements take account of such acquisitions as if they had occurred at the beginning of the earliest comparative period<br />
presented or, if later, at the date on which control was obtained by the common controlling shareholder. These acquisition transactions are described in the<br />
following paragraphs.<br />
Acquisitions of Mining companies from Majority Shareholder during <strong>2007</strong><br />
In July <strong>2007</strong>, the Group acquired a 100% stake in OOO Petrovtormet and OOO <strong>Severstal</strong>skrap-Komi, for a total consideration of US$ 0.02 million and<br />
US$ 0.2 million, respectively, and a 75.01% and a 75.1% stake in OAO Arhangelskii vtormet and in OAO Murmanskvtormet, for a total consideration of<br />
US$ 2.2 million and US$ 2.9 million, respectively. OAO Arhangelskii vtormet, OAO Murmanskvtormet, OOO Petrovtormet and OOO <strong>Severstal</strong>skrap-Komi<br />
were acquired from the controlling shareholder and comparatives were restated in accordance with the Group’s accounting policy.<br />
The acquirees’ profit since the acquisition dates included in the Group’s profit for the period, as well as the revenue and profit of the acquired entities<br />
from the beginning of the period to the dates of acquisition, individually and in the aggregate, are insignificant to the Group’s revenue and profit for<br />
the period.<br />
Acquisitions of subsidiaries from third and related parties during <strong>2007</strong><br />
In January <strong>2007</strong>, the Group completed the acquisition of 84.8% of the share capital of ZAO Vtorchermet and its wholly-owned subsidiaries and certain<br />
related companies for a total consideration of US$ 45.4 million. ZAO Vtorchermet is a scrap processing and wholesale company, and the majority of its<br />
operations is located in Saint Petersburg. The acquisition was conducted to secure a reliable source of scrap for the Russian steel mill in case of future<br />
changes in the Russian scrap market.<br />
In March <strong>2007</strong>, the Group purchased 100% of the share capital of Siderco SpA from the Lucchini family for € 1.35 million (US$ 1.78 million at the<br />
transaction date exchange rate). Management determined that the fair value of the net identifiable assets and liabilities acquired was substantially the<br />
same as the book value.<br />
100 <strong>Severstal</strong> <strong>Annual</strong> <strong>Report</strong> <strong>2007</strong>
OAO <strong>Severstal</strong> and subsidiaries<br />
Notes to the consolidated financial statements<br />
for the year ended December 31, <strong>2007</strong><br />
(Amounts expressed in thousands of US dollars, except as otherwise stated)<br />
In May <strong>2007</strong>, the Group completed the acquisition of 100% of a stevedore company, ZAO Neva-Metall, for US$ 98.7 million and 100% of the shipping<br />
agency ZAO Neva-Metall Trans for US$ 1.3 million from a related party. The majority of their operations are located in Saint Petersburg. The acquisition was<br />
conducted to secure a self-supporting export logistic chain. Management has not yet completed the estimation of fair values of the acquired assets and<br />
liabilities and, accordingly, does not currently possess all necessary information to disclose the effect of this acquisition on the Group’s financial position or<br />
results of operations. Final purchase price allocation is expected to be completed during the first quarter of the year 2008.<br />
In July <strong>2007</strong>, the Group acquired a 100% stake in each of the companies OOO Georesurs, OOO <strong>Severstal</strong>-Vtormet, and OOO SPB-Giproshakht for a total<br />
consideration of US$ 2.1 million, US$ 24.9 million, and US$ 6.3 million, respectively.<br />
In October <strong>2007</strong>, the Group acquired a 100% stake in OOO Nerengri-Metallik and a 100% stake in ZAO Mine Aprelkovo for a total consideration of<br />
US$ 105 million and US$ 153 million, respectively. OOO Nerengri-Metallik mines gold from the Tabornoye deposit in the Sakha-Yakutiya Republic, ZAO Mine<br />
Aprelkovo mines from the Pogromnoye gold deposit in the Chita Region. Both deposits are operated as open-pit mines with gold extracted utilizing heap<br />
leaching technology. Management has not yet completed the estimation of fair values of the acquired assets and liabilities and, accordingly, does not<br />
currently possess all necessary information to disclose the effect of this acquisition on the Group’s financial position or results of operations. Final purchase<br />
price allocation is expected to be completed within one year starting from the date of acquisition.<br />
The acquirees’ profit since the acquisition dates included in the Group’s profit for the period, as well as the revenue and profit of the acquired entities<br />
from the beginning of the period to the dates of acquisition, individually and in the aggregate, are insignificant to the Group’s revenue and profit for the<br />
period.<br />
During August – December <strong>2007</strong>, the Group acquired an 86.3% stake in Celtic Resources Holdings Plc. for a total consideration of US$ 264.6 million.<br />
Management has not yet completed the estimation of fair values of the acquired assets and liabilities and, accordingly, does not currently possess all<br />
necessary information to disclose the effect of this acquisition on the Group’s financial position or results of operations. Final purchase price allocation<br />
is expected to be completed within one year starting from the date of acquisition.<br />
The acquirees’ profit since the acquisition dates included in the Group’s profit for the period, is insignificant to the Group’s profit for the period.<br />
The acquirees’ revenue and profit from the beginning of the period to the dates of acquisition comprised US$ 62 million and US$ 7 million respectively.<br />
A summary of assets and liabilities acquired from third and related parties but excluding acquisitions from the Majority Shareholder during <strong>2007</strong>,<br />
2006 and 2005 is presented below:<br />
<strong>2007</strong> 2006 2005<br />
Cash and cash equivalents 25,665 5,875 657<br />
Trade accounts receivable 14,462 26,463 1,311<br />
Inventories 46,902 18,841 4,906<br />
Deferred tax assets 3,461 – –<br />
Other current assets 88,106 7,601 792<br />
Property, plant and equipment 147,000 93,982 4,036<br />
Intangible assets 45,937 – –<br />
Assets held for sale 14,644 – 16,365<br />
Trade accounts payable (14,007) (33,557) (199)<br />
Other taxes and social security payable (8,641) (70) (144)<br />
Deferred tax liabilities – (10,421) –<br />
Retirement benefit liability – (10,762) –<br />
Debt finance (63,223) (8,623) (841)<br />
Other liabilities (64,156) (6,387) (151)<br />
Net identifiable assets and liabilities acquired 236,150 82,942 26,732<br />
Minority interest (25,329) (17,792) –<br />
<strong>Severstal</strong>’s share of net identifiable assets and liabilities acquired 210,821 65,150 26,732<br />
Consideration paid:<br />
Consideration in cash (669,759) (63,500) (4,880)<br />
Consideration in financial assets (33,321) – (17,022)<br />
Positive goodwill on acquisition of subsidiaries (505,501) – –<br />
Negative goodwill on acquisition of subsidiaries 12,223 1,650 4,830<br />
Negative goodwill on minority buy-out – 2,563 2,800<br />
Net change in cash and cash equivalents (644,094) (57,625) (4,223)<br />
Acquisitions of minority interest<br />
In March <strong>2007</strong>, the Group acquired a 2.01%, a 0.04%, and a 0.05% stake in OAO Karelsky Okatysh, OAO Olkon, and in OAO Vorkutaugol for a total<br />
consideration of US$ 35.4 million, US$ 0.1 million, and US$ 0.4 million, respectively.<br />
In May <strong>2007</strong>, the Group acquired an additional 9% stake in Lucchini SpA from a Lucchini family company for a total consideration of € 85.2 million<br />
(US$ 114.8 million at the transaction date exchange rate). After the acquisition, the Group’s share in the capital of Lucchini SpA is 79.8%.<br />
In May <strong>2007</strong>, the Group acquired a 25.01% stake in ZAO Severgal for a total consideration of US$ 20 million. After the acquisition, the Group’s share<br />
in the capital of ZAO Severgal is 100%.<br />
In June <strong>2007</strong>, the Group acquired a 1.94%, a 0.62%, a 3.56%, a 1.23%, and a 1.02% stake in OAO Karelsky Okatysh, OAO Olkon, OAO Vorkutaugol,<br />
OAO Mine Vorgashorskaya, and in OAO Mine Berezovskaya for a total consideration of US$ 23.5 million, US$ 1.9 million, US$ 29.3 million, US$ 0.6 million,<br />
and US$ 0.7 million, respectively.<br />
<strong>Severstal</strong> <strong>Annual</strong> <strong>Report</strong> <strong>2007</strong> 101
Financial statements<br />
OAO <strong>Severstal</strong> and subsidiaries<br />
Notes to the consolidated financial statements<br />
for the year ended December 31, <strong>2007</strong><br />
(Amounts expressed in thousands of US dollars, except as otherwise stated)<br />
Disposals of subsidiaries during <strong>2007</strong><br />
In June <strong>2007</strong>, the Group sold its 100% (effective ownership was 79.8%) of Lucchini Sidermeccanica SpA and its wholly owned subsidiaries (Lucchini UK<br />
Ltd, Lucchini Sweden AB and Lucchini Poland Spzoo) to members of the founding Lucchini family for a total consideration of € 127.8 million<br />
(US$ 172.5 million at the transaction date exchange rate). To support this transaction an independent fairness opinion of the transaction was obtained<br />
from a properly qualified Italian bank.<br />
In July <strong>2007</strong>, the Group sold 100% (effective ownership was 79.8%) of Nitruvid SAS to an independent third party for a total consideration of<br />
€ 6.5 million (US$ 8.9 million at the transaction date exchange rate).<br />
In October <strong>2007</strong>, the Group sold its 100% (effective ownership was 79.8%) participation in Ascoforge Safe SAS to an independent third party for a<br />
total consideration of one Euro (US$ 1.3 at the transaction date exchange rate).<br />
In November <strong>2007</strong>, the Group sold its 73.1% of OAO Metallurgical Commercial Bank to a company controlled by <strong>Severstal</strong>’s Majority Shareholder for<br />
a total consideration of US$ 43.0 million.<br />
In December <strong>2007</strong>, the Group sold 100% of OOO URALMASH-Metallurgicheskoe Oborudovanie to an independent third party for a total consideration<br />
of US$ 14.9 million.<br />
As part of the realization of the disposal plan identified in 2003, in August, 2005 the Group sold interest in Huta LW Spzoo and its subsidiaries to Arcelor.<br />
The proceeds comprised an immediate cash payment and a deferred consideration of € 61.42 million (US$ 72.95 million at December 31, 2005 exchange<br />
rate) that was received by the Group in August, <strong>2007</strong>.<br />
A summary of assets and liabilities disposed during <strong>2007</strong>, 2006 and 2005 is presented below:<br />
<strong>2007</strong> 2006 2005<br />
Cash and cash equivalents (235,220) – –<br />
Trade accounts receivable (151,658) – –<br />
Inventories (108,238) (476) –<br />
Financial investments (237,408) – –<br />
Other assets (30,537) (531) –<br />
Property, plant and equipment (158,890) (20) (8,898)<br />
Intangible assets (3,105) – –<br />
Deferred tax assets (759) – –<br />
Assets held for sale – – (217,908)<br />
Trade accounts payable 205,171 – –<br />
Bank customer accounts 345,753 – –<br />
Income tax payable 9,375 – –<br />
Other taxes and social security payable 13,369 57 –<br />
Deferred tax liabilities 9,250 – 913<br />
Retirement benefit liability 23,490 – –<br />
Debt finance 66,108 – –<br />
Liabilities held for sale – – 138,809<br />
Other liabilities 30,743 74 3,190<br />
Net identifiable assets (222,556) (896) (83,894)<br />
Minority interest 16,315 154 8,928<br />
Sub-total (206,241) (742) (74,966)<br />
Consideration in cash 239,308 1,588 13,701<br />
Deferred consideration – – 72,952<br />
Adjustment to fair value of deferred consideration – – (21,446)<br />
Selling costs (1,560) – –<br />
Net gain/(loss) on disposal 31,507 846 (9,759)<br />
Deferred consideration received 83,842 – –<br />
Group’s cash and cash equivalents in Metcombank 149,608 – –<br />
Net change in cash and cash equivalents 235,978 1,588 13,701<br />
102 <strong>Severstal</strong> <strong>Annual</strong> <strong>Report</strong> <strong>2007</strong>
OAO <strong>Severstal</strong> and subsidiaries<br />
Notes to the consolidated financial statements<br />
for the year ended December 31, <strong>2007</strong><br />
(Amounts expressed in thousands of US dollars, except as otherwise stated)<br />
29. Discontinued operations and assets held for sale<br />
The Group’s discontinued operations consist of OAO Metallurgical Commercial Bank (presented the Group’s Financing segment) which was disposed of in<br />
November <strong>2007</strong>, and Lucchini companies which are classified as held for sale as at December 31, <strong>2007</strong>, December 31, 2006 and December 31, 2005. The<br />
post-tax loss on the disposal of OAO Metallurgical Commercial Bank amounted to US$ 10.2 million.<br />
The results of discontinued operations and net cash flows were as follows:<br />
Year ended December 31,<br />
<strong>2007</strong> 2006 2005<br />
Revenue 831 8,675 74,506<br />
Expenses (2,914) (3,365) (81,537)<br />
Other income/expenses 3,821 30,212 10,011<br />
Profit before income tax 1,738 35,522 2,980<br />
Income tax expense (1,305) (2,673) (2,378)<br />
Profit for the year 433 32,849 602<br />
Net cash (used in)/generated from operating activities (64,446) 148,650 (112,737)<br />
Net cash (used in)/generated from financing activities – 17,779 (974)<br />
The Group’s assets held for sale balances are mostly represented by Kuzbass coal mines, a group of subsidiaries, which the Group intends to dispose of<br />
in the first half of 2008, and Lucchini and Metalware segment’s companies.<br />
The major classes of assets and liabilities of the disposal group measured at the lower of carrying amount and fair value less costs to sell at<br />
December 31, <strong>2007</strong>, 2006 and 2005 were as follows:<br />
December 31,<br />
<strong>2007</strong> 2006 2005<br />
Current assets:<br />
Cash and cash equivalents 6,199 5,986 89<br />
Short-term financial investments 18,550 – –<br />
Trade accounts receivable 2,365 100 80<br />
Amounts receivable from related parties 2,732 – –<br />
Inventories 9,182 – –<br />
VAT recoverable 1,808 – –<br />
Income tax recoverable 422 3 4<br />
Other current assets 5,160 – –<br />
Total current assets 46,418 6,089 173<br />
Non-current assets:<br />
Long-term financial investments 2,540 514 –<br />
Investment in associates 1 1,395 –<br />
Property, plant and equipment 332,632 19,375 14,438<br />
Intangible assets 30,710 50 –<br />
Deferred tax assets 24,913 11 –<br />
Other non-current assets 23,982 86,082 51,506<br />
Total non-current assets 414,778 107,427 65,944<br />
Total assets 461,196 113,516 66,117<br />
Current liabilities:<br />
Trade accounts payable 7,938 – –<br />
Other taxes and social security payable 3,862 – –<br />
Other current liabilities 6,980 – –<br />
Total current liabilities 18,780 – –<br />
Non-current liabilities:<br />
Retirement benefit liability 9,260 – –<br />
Other non-current liabilities 63,710 1,792 172<br />
Total non-current liabilities 72,970 1,792 172<br />
Total liabilities 91,750 1,792 172<br />
<strong>Severstal</strong> <strong>Annual</strong> <strong>Report</strong> <strong>2007</strong> 103
Financial statements<br />
OAO <strong>Severstal</strong> and subsidiaries<br />
Notes to the consolidated financial statements<br />
for the year ended December 31, <strong>2007</strong><br />
(Amounts expressed in thousands of US dollars, except as otherwise stated)<br />
30. Subsequent events<br />
In January 2008, an explosion occurred on one of <strong>Severstal</strong> North America’s (“SNA”) furnaces, blast furnace “B”. As a result of the accident SNA has stopped<br />
production at this facility. SNA is carrying out an internal investigation and estimation of losses. Blast furnace “B” is the smaller of SNA’s two furnaces and is<br />
used to produce pig iron for subsequent conversion into steel. “B” furnace’s daily production was 1,800 tons. SNA’s primary blast furnace “C”, a newly rebuilt<br />
facility, was not affected by the accident. At the date of these consolidated financial statements it is not possible to quantify any potential loss.<br />
In January 2008, a fire occurred at blast furnace No 5 of <strong>Severstal</strong>’s steel plant in Cherepovets. A preliminary investigation showed that the fire might<br />
had been the result of dispersal and subsequent ignition of the furnace’s roofing material caused by opening of the third Cowper stove in the upper part of<br />
the furnace. On February 2, 2008 blast furnace No 5 resumed operations and restored its normal production capacity. At the date of these consolidated<br />
financial statements it is not possible to quantify any potential loss.<br />
In January 2008, the Group acquired assets of a Polish steel-pipe producer Technologia Buczek, which was declared bankrupt, for the total consideration<br />
of PLN 54.1 million (US$ 21.8 million at the transaction date exchange rate). As a part of the above assets <strong>Severstal</strong> purchased a 100% stake in the freight<br />
company SAMKOL and a 50.72% stake in the tube manufacturing company Buczek Automotive. These assets were bought by the Group’s Latvian unit,<br />
<strong>Severstal</strong>latt, which plans to develop production and distribution of steel products in Poland.<br />
In January 2008, the supplier of electricity with whom SNA had a long-term purchase contract decided to terminate the contract and pay a lump sum<br />
penalty to compensate SNA for the differential between the contract price and the price of electricity SNA will have to pay another supplier for the duration<br />
of the original contract. This penalty payment amounted to US$ 177 million which was paid in February 2008.<br />
In January 2008, the Group acquired a 100% stake in Baracom Limited from its Majority Shareholder for US$ 84.4 million. Baracom owns 79.9% of the<br />
voting stock of the holding structure, which controls 74.2% of SeverCorr. Accordingly, starting from January 2008 SeverCorr will be included in the Group’s<br />
consolidated financial statements.<br />
In January 2008, the Group acquired the remaining 13.7% stake in Celtic Resources Holdings Plc for US$ 44 million.<br />
The acquirees’ profit since the acquisition dates is insignificant to the Group’s profit for the period.<br />
In March 2008, the Board of Directors recommended the final dividend for <strong>2007</strong> of RUR 4.00 (US$ 0.17) per share and GDR.<br />
104 <strong>Severstal</strong> <strong>Annual</strong> <strong>Report</strong> <strong>2007</strong>
OAO <strong>Severstal</strong> and subsidiaries<br />
Notes to the consolidated financial statements<br />
for the year ended December 31, <strong>2007</strong><br />
(Amounts expressed in thousands of US dollars, except as otherwise stated)<br />
31. Segment information<br />
Segmental income statements for the year ended December 31, <strong>2007</strong>:<br />
Russian <strong>Severstal</strong> Inter<br />
Mining Steel Lucchini North Metalware Financing segment<br />
segment segment segment America IPM segment segment transactions Consolidated<br />
Sales<br />
Sales – external 1,029,407 6,690,697 3,624,913 1,691,818 550,715 955,493 – – 14,543,043<br />
Sales – to related parties 1,167,458 1,278,328 131,595 53 – 56,216 – (1,931,782) 701,868<br />
2,196,865 7,969,025 3,756,508 1,691,871 550,715 1,011,709 – (1,931,782) 15,244,911<br />
Cost of sales (1,497,487) (4,837,325) (3,194,377) (1,664,065) (379,824) (871,799) – 1,903,306 (10,541,571)<br />
Gross profit 699,378 3,131,700 562,131 27,806 170,891 139,910 – (28,476) 4,703,340<br />
General and<br />
administrative expenses (149,755) (279,485) (188,016) (30,626) (9,509) (37,030) – 3,211 (691,210)<br />
Distribution expenses (180,788) (542,904) (117,998) – (29,075) (44,341) – 5,596 (909,510)<br />
Indirect taxes and contributions (64,964) (46,763) (32,188) – (4,440) (5,259) – – (153,614)<br />
Share of associates’ (losses)/profits – (95,637) (548) 5,338 – 1,450 – – (89,397)<br />
Net income from securities<br />
operations 33 21,164 10,827 – – 22 – (6,482) 25,564<br />
(Loss)/gain on disposal of<br />
property, plant and equipment (12,219) (31,799) (508) (3,485) (53) 12,283 – 501 (35,280)<br />
Net other operating<br />
(expenses)/income (9,912) 8,815 (17,343) 2,556 (692) 8,857 – 199 (7,520)<br />
Profit from operations 281,773 2,165,091 216,357 1,589 127,122 75,892 – (25,451) 2,842,373<br />
Impairment of property,<br />
plant and equipment (3,058) (5,451) (15,895) – – (4,705) – – (29,109)<br />
Negative goodwill, net 11,599 – 507 – – 117 – – 12,223<br />
Net other non-operating<br />
(expenses)/income (20,608) (39,178) 24,374 – (18) (2,828) – (20,318) (58,576)<br />
Profit before financing<br />
and taxation 269,706 2,120,462 225,343 1,589 127,104 68,476 – (45,769) 2,766,911<br />
Interest income 10,996 182,619 21,978 855 45 823 – (44,379) 172,937<br />
Interest expense (70,339) (124,870) (72,793) (12,418) (27,601) (7,649) – 27,377 (288,293)<br />
Foreign exchange difference (3,447) 10,544 (535) – (2,850) (1,096) – 284 2,900<br />
Profit before income tax 206,916 2,188,755 173,993 (9,974) 96,698 60,554 – (62,487) 2,654,455<br />
Income tax (expense)/benefit (45,684) (540,509) (64,808) 9,247 (20,080) (22,312) – 2,877 (681,269)<br />
Profit from continuing<br />
operations 161,232 1,648,246 109,185 (727) 76,618 38,242 – (59,610) 1,973,186<br />
Profit/(loss) from<br />
discontinued operations – – (15,660) – – – 16,093 – 433<br />
Profit for the year 161,232 1,648,246 93,525 (727) 76,618 38,242 16,093 (59,610) 1,973,619<br />
Additional information:<br />
Depreciation expense 203,409 332,536 196,569 14,492 23,370 23,712 – – 794,088<br />
Capital expenditures 394,047 494,780 199,267 483,342 23,335 29,965 – – 1,624,736<br />
Intersegment sales<br />
(incl. in sales to related parties) 1,142,654 647,880 131,595 – – 9,653 – (1,931,782) –<br />
<strong>Severstal</strong> <strong>Annual</strong> <strong>Report</strong> <strong>2007</strong> 105
Financial statements<br />
OAO <strong>Severstal</strong> and subsidiaries<br />
Notes to the consolidated financial statements<br />
for the year ended December 31, <strong>2007</strong><br />
(Amounts expressed in thousands of US dollars, except as otherwise stated)<br />
Segmental income statements for the year ended December 31, 2006:<br />
Russian <strong>Severstal</strong> Inter<br />
Mining Steel Lucchini North Metalware Financing segment<br />
segment segment segment America IPM segment segment transactions Consolidated<br />
Sales<br />
Sales – external 539,886 5,352,801 3,182,119 1,868,426 – 780,086 – – 11,723,318<br />
Sales – to related parties 951,105 964,694 175,347 – – 58,837 – (1,424,269) 725,714<br />
1,490,991 6,317,495 3,357,466 1,868,426 – 838,923 – (1,424,269) 12,449,032<br />
Cost of sales (965,799) (3,804,762) (2,807,210) (1,711,899) (24) (736,568) – 1,425,035 (8,601,227)<br />
Gross profit 525,192 2,512,733 550,256 156,527 (24) 102,355 – 766 3,847,805<br />
General and<br />
administrative expenses (137,299) (264,884) (191,282) (27,561) (2,879) (31,082) – – (654,987)<br />
Distribution expenses (96,165) (456,340) (101,243) – – (43,560) – – (697,308)<br />
Indirect taxes and contributions (48,369) (52,742) (37,190) – (826) (2,982) – – (142,109)<br />
Share of associates’ (losses)/profits – (2,644) 202 2,971 – (1,722) – – (1,193)<br />
Net income/(loss) from<br />
securities operations 7,087 20,605 3,713 – (80) 314 – (3,376) 28,263<br />
(Loss)/gain on disposal of<br />
property, plant and equipment (11,642) (24,147) (3,412) 469 (407) (153) – – (39,292)<br />
Net other operating<br />
(expenses)/income (1,079) (12,518) (13,141) 1,827 2,440 5 – (4,643) (27,109)<br />
Profit from operations 237,725 1,720,063 207,903 134,233 (1,776) 23,175 – (7,253) 2,314,070<br />
Impairment of property,<br />
plant and equipment (16,372) (8,222) (9,778) – – (23,364) – – (57,736)<br />
Net gain on restructuring<br />
of tax liabilities 14,669 – – – – – – – 14,669<br />
Negative goodwill/<br />
(goodwill impairment), net 224 (187) – – – 1,650 – 2,526 4,213<br />
Net other non-operating expenses (11,408) (40,867) – – – (1,261) – – (53,536)<br />
Profit before financing<br />
and taxation 224,838 1,670,787 198,125 134,233 (1,776) 200 – (4,727) 2,221,680<br />
Interest income 11,090 99,440 11,589 4,485 67 898 – (25,167) 102,402<br />
Interest expense (48,706) (137,554) (58,778) (13,747) – (7,306) – 21,114 (244,977)<br />
Foreign exchange difference (3,197) 37,553 1,638 – (1,445) (1,225) – – 33,324<br />
Profit before income tax 184,025 1,670,226 152,574 124,971 (3,154) (7,433) – (8,780) 2,112,429<br />
Income tax (expense)/benefit (82,101) (459,753) (53,790) (41,355) 87 1,440 – 174 (635,298)<br />
Profit from continuing<br />
operations 101,924 1,210,473 98,784 83,616 (3,067) (5,993) – (8,606) 1,477,131<br />
Profit from discontinued operations – – 22,212 – – – 6,565 4,072 32,849<br />
Profit for the year 101,924 1,210,473 120,996 83,616 (3,067) (5,993) 6,565 (4,534) 1,509,980<br />
Additional information:<br />
Depreciation expense 190,495 252,028 117,911 8,327 724 25,262 – – 594,747<br />
Capital expenditures 350,863 554,357 126,687 82,778 127,413 10,144 60 20 1,252,322<br />
Intersegment sales<br />
(incl. in sales to related parties) 853,045 392,710 169,371 – – 9,143 – (1,424,269) –<br />
106 <strong>Severstal</strong> <strong>Annual</strong> <strong>Report</strong> <strong>2007</strong>
OAO <strong>Severstal</strong> and subsidiaries<br />
Notes to the consolidated financial statements<br />
for the year ended December 31, <strong>2007</strong><br />
(Amounts expressed in thousands of US dollars, except as otherwise stated)<br />
Segmental income statements for the year ended December 31, 2005:<br />
Russian <strong>Severstal</strong> Inter<br />
Mining Steel Lucchini North Metalware Financing segment<br />
segment segment segment America IPM segment segment transactions Consolidated<br />
Sales<br />
Sales – external 420,314 5,174,637 1,805,903 1,822,573 – 562,630 – – 9,786,057<br />
Sales – to related parties 971,229 789,677 41,630 – – 56,200 – (1,193,147) 665,589<br />
1,391,543 5,964,314 1,847,533 1,822,573 – 618,830 – (1,193,147) 10,451,646<br />
Cost of sales (745,429) (3,405,374) (1,569,239) (1,716,332) (2,251) (556,963) – 1,164,450 (6,831,138)<br />
Gross profit 646,114 2,558,940 278,294 106,241 (2,251) 61,867 – (28,697) 3,620,508<br />
General and<br />
administrative expenses (105,158) (225,159) (125,434) (29,539) (2,490) (36,882) – – (524,662)<br />
Distribution expenses (55,935) (509,943) (63,958) – – (27,848) – – (657,684)<br />
Indirect taxes and contributions (41,968) (26,380) (23,492) – (59) (3,444) – – (95,343)<br />
Share of associates’ (losses)/profits – (4,969) 77 2,749 – (2,047) – – (4,190)<br />
Net income/(loss) from<br />
securities operations 3,728 20,841 1,761 505 (4) 470 – (2,858) 24,443<br />
(Loss)/gain on disposal of<br />
property, plant and equipment (3,931) (29,668) (1,169) (184) 57 (1,885) – – (36,780)<br />
Net other operating<br />
(expenses)/income (4,966) (3,868) (12,868) 1,981 462 (273) – (812) (20,344)<br />
Profit from operations 437,884 1,779,794 53,211 81,753 (4,285) (10,042) – (32,367) 2,305,948<br />
Impairment of property,<br />
plant and equipment, net (10,624) (91,139) (8,552) – (155) (914) – – (111,384)<br />
Net gain on restructuring<br />
of tax liabilities 174,178 – – – – – – – 174,178<br />
Negative goodwill, net – 4,830 – – – – – 2,800 7,630<br />
Net other non-operating expenses (8,378) (30,428) – – (16) (4,142) – (9,789) (52,753)<br />
Profit before financing<br />
and taxation 593,060 1,663,057 44,659 81,753 (4,456) (15,098) – (39,356) 2,323,619<br />
Interest income 2,848 62,959 6,524 718 127 1,601 – (9,643) 65,134<br />
Interest expense (25,146) (127,274) (41,787) (13,242) (5) (1,514) – 5,911 (203,057)<br />
Foreign exchange difference (1,385) (64,457) 7,404 – (881) 111 – (1,023) (60,231)<br />
Profit before income tax 569,377 1,534,285 16,800 69,229 (5,215) (14,900) – (44,111) 2,125,465<br />
Income tax (expense)/benefit (117,377) (372,111) 9,166 (27,088) 306 (2,819) – 9,016 (500,907)<br />
Profit from continuing<br />
operations 452,000 1,162,174 25,966 42,141 (4,909) (17,719) – (35,095) 1,624,558<br />
Profit/(loss) from<br />
discontinued operations – – (10,784) – – – 6,842 4,544 602<br />
Profit for the year 452,000 1,162,174 15,182 42,141 (4,909) (17,719) 6,842 (30,551) 1,625,160<br />
Additional information:<br />
Depreciation expense 156,048 233,939 74,659 7,159 263 19,550 – – 491,618<br />
Capital expenditures 349,788 705,131 62,946 13,059 100,541 37,248 33 (19,549) 1,249,197<br />
Intersegment sales<br />
(incl. in sales to related parties) 805,523 338,440 35,961 – – 13,223 – (1,193,147) –<br />
<strong>Severstal</strong> <strong>Annual</strong> <strong>Report</strong> <strong>2007</strong> 107
Financial statements<br />
OAO <strong>Severstal</strong> and subsidiaries<br />
Notes to the consolidated financial statements<br />
for the year ended December 31, <strong>2007</strong><br />
(Amounts expressed in thousands of US dollars, except as otherwise stated)<br />
Segmental balance sheets as at December 31, <strong>2007</strong>:<br />
Russian <strong>Severstal</strong> Inter<br />
Mining Steel Lucchini North Metalware Financing segment<br />
segment segment segment America IPM segment segment balances Consolidated<br />
Assets<br />
Current assets:<br />
Cash and cash equivalents 143,372 846,727 507,714 – 2,195 46,873 – – 1,546,881<br />
Short-term bank deposits – 665,977 – – – – – – 665,977<br />
Short-term financial investments 25,385 878,286 23,127 – – 435 – (659,600) 267,633<br />
Trade accounts receivable 76,727 339,708 813,534 108,102 280,862 55,685 – – 1,674,618<br />
Amounts receivable from<br />
related parties 50,350 214,889 2,836 2,831 101 2,671 – (110,959) 162,719<br />
Inventories 157,397 1,162,096 694,939 457,735 51,477 102,821 – (88,995) 2,537,470<br />
VAT recoverable 65,097 150,191 32,384 – 5,565 30,508 – – 283,745<br />
Income tax recoverable 16,292 34,447 12,245 12,504 – 505 – – 75,993<br />
Assets held for sale 436,541 448 17,718 – – 6,489 – – 461,196<br />
Other current assets 82,645 148,375 35,169 18,793 17,389 18,991 – – 321,362<br />
Total current assets 1,053,806 4,441,144 2,139,666 599,965 357,589 264,978 – (859,554) 7,997,594<br />
Non-current assets:<br />
Long-term financial investments 7,344 1,938,219 21,656 – – 738 – (1,815,091) 152,866<br />
Investment in associates<br />
and joint ventures – 393,635 1,278 194,179 – – – – 589,092<br />
Property, plant and equipment 1,347,398 3,360,437 1,495,614 611,378 307,577 178,562 – (8,155) 7,292,811<br />
Intangible assets 480,108 104,463 19,045 5,865 272 1,508 – – 611,261<br />
Assets held for sale – – – – – – – – –<br />
Deferred tax assets 11,611 2,770 37,943 – – – – – 52,324<br />
Amounts receivable from<br />
related parties – – – – – – – – –<br />
Other non-current assets 1,008 4,225 2,948 100 5 13,188 – – 21,474<br />
Total non-current assets 1,847,469 5,803,749 1,578,484 811,522 307,854 193,996 – (1,823,246) 8,719,828<br />
Total assets 2,901,275 10,244,893 3,718,150 1,411,487 665,443 458,974 – (2,682,800) 16,717,422<br />
Liabilities and<br />
shareholders’ equity<br />
Current liabilities:<br />
Trade accounts payable 57,082 204,713 610,982 185,830 7,250 25,027 – – 1,090,884<br />
Bank customer accounts – – – – – – – – –<br />
Amounts payable to related parties 4,219 90,263 5,766 18,395 31,884 14,302 – (105,914) 58,915<br />
Short-term debt finance 709,051 327,157 328,391 15,671 70,455 34,198 – (512,844) 972,079<br />
Income taxes payable 8,790 9,437 15,065 – 2,301 5,788 – – 41,381<br />
Other taxes and social<br />
security payable 61,915 41,733 87,071 1,662 3,333 4,710 – – 200,424<br />
Dividends payable – 107,485 – – – – – – 107,485<br />
Liabilities related to assets<br />
held for sale 91,599 – 151 – – – – – 91,750<br />
Other current liabilities 87,446 323,674 130,020 20,175 3,000 35,636 – 629 600,580<br />
Total current liabilities 1,020,102 1,104,462 1,177,446 241,733 118,223 119,661 – (618,129) 3,163,498<br />
Non-current liabilities:<br />
Long-term debt finance 391,878 945,176 650,105 308,937 414,344 6,213 – (361,830) 2,354,823<br />
Deferred tax liabilities 53,849 189,251 85,194 60,843 158 4,386 – (19,045) 374,636<br />
Retirement benefit liability 71,821 118,701 138,504 48,601 – 9,771 – – 387,398<br />
Liabilities related to assets<br />
held for sale – – – – – – – – –<br />
Other non-current liabilities 140,135 1,674 79,471 5,108 – – – – 226,388<br />
Total non-current liabilities 657,683 1,254,802 953,274 423,489 414,502 20,370 – (380,875) 3,343,245<br />
Equity 1,223,490 7,885,629 1,587,430 746,265 132,718 318,943 – (1,683,796) 10,210,679<br />
Total equity and liabilities 2,901,275 10,244,893 3,718,150 1,411,487 665,443 458,974 – (2,682,800) 16,717,422<br />
108 <strong>Severstal</strong> <strong>Annual</strong> <strong>Report</strong> <strong>2007</strong>
OAO <strong>Severstal</strong> and subsidiaries<br />
Notes to the consolidated financial statements<br />
for the year ended December 31, <strong>2007</strong><br />
(Amounts expressed in thousands of US dollars, except as otherwise stated)<br />
Segmental balance sheets as at December 31, 2006:<br />
Russian <strong>Severstal</strong> Inter<br />
Mining Steel Lucchini North Metalware Financing segment<br />
segment segment segment America IPM segment segment balances Consolidated<br />
Assets<br />
Current assets:<br />
Cash and cash equivalents 87,930 1,231,164 225,854 – 11,799 9,584 309,674 (174,983) 1,701,022<br />
Short-term bank deposits 7 1,292,345 – – 1,019 41,092 – (187,193) 1,147,270<br />
Short-term financial investments 77,839 260,631 6,587 – 3,798 1,598 191,358 (219,969) 321,842<br />
Trade accounts receivable 37,294 252,193 843,737 128,768 16 62,577 – – 1,324,585<br />
Amounts receivable from<br />
related parties 62,117 133,764 9,601 1,184 4 7,009 – (85,976) 127,703<br />
Inventories 125,019 895,066 695,041 427,502 45,732 102,320 – (68,308) 2,222,372<br />
VAT recoverable 46,458 187,872 49,476 – 25,150 30,436 – – 339,392<br />
Income tax recoverable 1,835 9,010 8,404 16,361 – 294 – – 35,904<br />
Other current assets 51,505 126,811 29,320 17,070 5,273 16,091 13,138 – 259,208<br />
Total current assets 490,004 4,388,856 1,868,020 590,885 92,791 271,001 514,170 (736,429) 7,479,298<br />
Non-current assets:<br />
Long-term financial investments 2,682 1,471,353 31,934 – – 42,183 25,705 (1,373,917) 199,940<br />
Investment in associates<br />
and joint ventures – 139,231 2,656 212,154 – 865 – – 354,906<br />
Property, plant and equipment 1,289,236 3,048,161 1,519,357 149,721 292,420 177,808 475 (6,793) 6,470,385<br />
Intangible assets 35,747 7,086 17,408 – – 1,418 7 – 61,666<br />
Assets held for sale – – 113,516 – – – – – 113,516<br />
Deferred tax assets 224 – 29,926 – – – – – 30,150<br />
Amounts receivable from<br />
related parties – – – – – – – – –<br />
Other non-current assets 1,185 – 2,659 – – – – – 3,844<br />
Total non-current assets 1,329,074 4,665,831 1,717,456 361,875 292,420 222,274 26,187 (1,380,710) 7,234,407<br />
Total assets 1,819,078 9,054,687 3,585,476 952,760 385,211 493,275 540,357 (2,117,139) 14,713,705<br />
Liabilities and<br />
shareholders’ equity<br />
Current liabilities:<br />
Trade accounts payable 61,275 209,341 620,668 116,681 7,113 23,823 – – 1,038,901<br />
Bank customer accounts – – – – – – 396,176 (365,033) 31,143<br />
Amounts payable to<br />
related parties 19,217 72,894 36,651 17,303 15,937 21,460 74,623 (82,345) 175,740<br />
Short-term debt finance 103,122 441,665 414,480 10,024 1,737 18,999 17,755 (50,218) 957,564<br />
Income taxes payable 6,532 28,880 8,921 – – 15 – – 44,348<br />
Other taxes and social<br />
security payable 70,016 38,035 85,952 2,357 471 3,127 5 – 199,963<br />
Dividends payable – 23,243 – – – – – – 23,243<br />
Other current liabilities 54,526 244,409 108,472 21,672 42,263 35,320 186 – 506,848<br />
Total current liabilities 314,688 1,058,467 1,275,144 168,037 67,521 102,744 488,745 (497,596) 2,977,750<br />
Non-current liabilities:<br />
Long-term debt finance 242,470 1,041,131 605,827 138,404 267,099 55,423 23 (302,342) 2,048,035<br />
Deferred tax liabilities 59,792 188,886 89,662 74,805 – 7,308 1,152 (18,529) 403,076<br />
Retirement benefit liability 73,056 133,854 167,855 43,574 – 24,615 – – 442,954<br />
Liabilities related to assets<br />
held for sale – – 1,792 – – – – – 1,792<br />
Other non-current liabilities 199,693 218 81,872 4,307 – – – – 286,090<br />
Total non-current liabilities 575,011 1,364,089 947,008 261,090 267,099 87,346 1,175 (320,871) 3,181,947<br />
Equity 929,379 6,632,131 1,363,324 523,633 50,591 303,185 50,437 (1,298,672) 8,554,008<br />
Total equity and liabilities 1,819,078 9,054,687 3,585,476 952,760 385,211 493,275 540,357 (2,117,139) 14,713,705<br />
<strong>Severstal</strong> <strong>Annual</strong> <strong>Report</strong> <strong>2007</strong> 109
Financial statements<br />
OAO <strong>Severstal</strong> and subsidiaries<br />
Notes to the consolidated financial statements<br />
for the year ended December 31, <strong>2007</strong><br />
(Amounts expressed in thousands of US dollars, except as otherwise stated)<br />
Segmental balance sheets as at December 31, 2005:<br />
Russian <strong>Severstal</strong> Inter<br />
Mining Steel Lucchini North Metalware Financing segment<br />
segment segment segment America IPM segment segment balances Consolidated<br />
Assets<br />
Current assets:<br />
Cash and cash equivalents 67,773 779,419 384,624 – 5,257 3,921 143,246 (56,353) 1,327,887<br />
Short-term bank deposits 1,071 718,705 – – – 18,274 – (63,538) 674,512<br />
Short-term financial investments 25,922 262,996 7,935 – 76 15,619 143,999 (188,696) 267,851<br />
Trade accounts receivable 29,772 274,020 676,208 166,541 – 27,652 – – 1,174,193<br />
Amounts receivable from<br />
related parties 129,562 205,092 15,035 970 – 9,411 – (186,262) 173,808<br />
Inventories 105,672 578,093 633,068 401,146 983 59,457 – (52,891) 1,725,528<br />
VAT recoverable 40,698 296,206 50,540 – 21,056 33,797 – – 442,297<br />
Income tax recoverable 15,903 757 11,097 – – 914 – – 28,671<br />
Other current assets 24,113 85,268 22,824 22,964 13,289 8,041 5,186 – 181,685<br />
Total current assets 440,486 3,200,556 1,801,331 591,621 40,661 177,086 292,431 (547,740) 5,996,432<br />
Non-current assets:<br />
Long-term financial investments 3,855 1,310,784 31,645 – – 7,601 – (1,264,344) 89,541<br />
Investment in associates<br />
and joint ventures – 63,209 2,335 142,988 – 2,120 – – 210,652<br />
Property, plant and equipment 1,080,768 2,543,161 1,376,460 75,304 131,750 111,734 391 – 5,319,568<br />
Intangible assets 29,537 5,731 19,787 – – 1,418 50 – 56,523<br />
Assets held for sale – – 66,117 – – – – – 66,117<br />
Deferred tax assets – – 35,076 – – – – – 35,076<br />
Amounts receivable from<br />
related parties 22,026 – 13,069 – – – – – 35,095<br />
Other non-current assets 523 – 2,582 – – – – – 3,105<br />
Total non-current assets 1,136,709 3,922,885 1,547,071 218,292 131,750 122,873 441 (1,264,344) 5,815,677<br />
Total assets 1,577,195 7,123,441 3,348,402 809,913 172,411 299,959 292,872 (1,812,084) 11,812,109<br />
Liabilities and<br />
shareholders’ equity<br />
Current liabilities:<br />
Trade accounts payable 34,916 176,328 496,110 129,040 21,650 7,354 – 1,231 866,629<br />
Bank customer accounts – – – – – – 218,673 (119,806) 98,867<br />
Amounts payable to<br />
related parties 143,820 390,240 21,504 14,149 8 10,610 33,725 (122,099) 491,957<br />
Short-term debt finance 87,024 243,765 646,803 143,818 943 20,560 – (146,788) 996,125<br />
Income taxes payable 938 30,075 40,701 14,183 – 104 – – 86,001<br />
Other taxes and social<br />
security payable 110,296 23,014 106,584 1,681 40 16,063 – – 257,678<br />
Dividends payable – 12,275 – – – – – – 12,275<br />
Other current liabilities 50,621 163,148 132,371 22,169 222 10,587 100 – 379,218<br />
Total current liabilities 427,615 1,038,845 1,444,073 325,040 22,863 65,278 252,498 (387,462) 3,188,750<br />
Non-current liabilities:<br />
Long-term debt finance 60,442 1,369,878 490,391 – 100,289 4,483 – (93,789) 1,931,694<br />
Deferred tax liabilities 56,822 155,177 91,107 59,598 82 8,462 466 (14,975) 356,739<br />
Retirement benefit liability 64,181 79,034 135,029 38,888 – 21,354 – – 338,486<br />
Liabilities related to assets<br />
held for sale – – 172 – – – – – 172<br />
Other non-current liabilities 201,489 75 73,059 6,452 – – – – 281,075<br />
Total non-current liabilities 382,934 1,604,164 789,758 104,938 100,371 34,299 466 (108,764) 2,908,166<br />
Equity 766,646 4,480,432 1,114,571 379,935 49,177 200,382 39,908 (1,315,858) 5,715,193<br />
Total equity and liabilities 1,577,195 7,123,441 3,348,402 809,913 172,411 299,959 292,872 (1,812,084) 11,812,109<br />
110 <strong>Severstal</strong> <strong>Annual</strong> <strong>Report</strong> <strong>2007</strong>
OAO <strong>Severstal</strong> and subsidiaries<br />
Notes to the consolidated financial statements<br />
for the year ended December 31, <strong>2007</strong><br />
(Amounts expressed in thousands of US dollars, except as otherwise stated)<br />
32. Commitments and contingencies<br />
a. For litigation, tax and other liabilities<br />
The taxation system and regulatory environment of the Russian Federation are relatively new and characterized by numerous taxes and frequently<br />
changing legislation, which is often unclear, contradictory and subject to varying interpretations between the differing regulatory authorities and<br />
jurisdictions, who are empowered to impose significant fines, penalties and interest charges. Events during the recent years suggest that the regulatory<br />
authorities within the Russian Federation are adopting a more assertive stance regarding the interpretation and enforcement of legislation. This situation<br />
creates substantial tax and regulatory risks. Management believes that it has complied in all material respects with all relevant legislation.<br />
At the balance sheet date, the Russian tax authorities had made claims for taxes, fines and penalties in the amount of approximately US$ 32 million,<br />
mostly related to mineral extraction tax and water usage tax by certain of the Group’s entities in the Mining segment. Management does not agree with<br />
the tax authorities’ claims and believes that the Group has complied with existing legislation in all material respects. Management is unable to assess the<br />
ultimate outcome of the claims and the outflow of financial sources to settle such claims, if any. Management believes that it has made adequate<br />
provisions for other possible tax claims.<br />
On July 26, <strong>2007</strong> Lucchini SpA received notice by the Tuscan regional fiscal authorities for storing waste from the steel making process in the Piombino<br />
steel making facilities. In the notice the authorities specified the potential amount of penalties of €52.5 million (US$ 76.9 million at December 31, <strong>2007</strong><br />
exchange rate). Management has cooperated fully with the authorities and presented the mitigating submissions which should substantially reduce the<br />
initial amounts indicated by the authorities. Consequently, these financial statements contain provisions for this issue in accordance with management<br />
assessments performed.<br />
b. Long-term purchase and sales contracts<br />
In the normal course of business group companies enter into long term purchase contracts for raw materials, and long term sales contracts. These contracts<br />
allow for periodic adjustments in prices dependent on prevailing market conditions.<br />
c. Capital commitments<br />
At the balance sheet date the Group had contractual capital commitments of US$ 411.7 million (December 31, 2006: US$ 291.1 million; December 31,<br />
2005: US$ 435.4 million).<br />
d. Insurance<br />
The Group has insured its property and equipment to compensate for expenses arising from accidents. In addition, the Group has insurance for business<br />
interruption on a basis of reimbursement of certain fixed costs. The Group has also insured third-party liability in respect of property or environmental<br />
damage. However, the Group does not have a full insurance coverage.<br />
e. Guarantees<br />
At the balance sheet date the Group had US$ 143.2 million (December 31, 2006: US$ 22.2 million; December 31, 2005: US$ 23.8 million) of guarantees<br />
issued.<br />
33. Financial instruments<br />
The Group’s risk management policies are established to identify and analyze the risks faced by the Group, to set appropriate risk limits and controls, and<br />
to monitor risks and adherence to limits. Risk management policies and systems are reviewed regularly to reflect changes in market conditions and the<br />
Group’s activities.<br />
The Group’s Audit Committee oversees how management monitors compliance with the Group’s risk management policies and procedures and<br />
reviews the adequacy of the risk management framework in relation to the risks faced by the Group.<br />
Exposure to credit, liquidity, interest rate and currency risk arises in the normal course of the Group’s business. The Russian Steel, Metalware, IPM and<br />
Mining segments of the Group have not used derivative financial instruments to reduce exposure to fluctuations in foreign exchange rates and interest<br />
rates. The use of <strong>Severstal</strong> North America and Lucchini segments of derivatives to hedge their interest rates, commodity inputs and foreign exchange rate<br />
exposures were not material to these consolidated financial statements. As at December 31, <strong>2007</strong>, 2006 and 2005, the Financing segment had no<br />
outstanding derivatives.<br />
Management believes that the fair value of its financial assets and liabilities approximates their carrying amounts except for the following long-term<br />
fixed rate borrowings:<br />
December 31, <strong>2007</strong><br />
Market value Book value Difference<br />
Citibank CLN – Eurobonds 2009 330,513 325,000 5,513<br />
Citibank CLN – Eurobonds 2014 398,781 375,000 23,781<br />
729,294 700,000 29,294<br />
December 31, 2006<br />
Market value Book value Difference<br />
Citibank CLN – Eurobonds 2009 337,857 325,000 12,857<br />
Citibank CLN – Eurobonds 2014 407,616 375,000 32,616<br />
745,473 700,000 45,473<br />
<strong>Severstal</strong> <strong>Annual</strong> <strong>Report</strong> <strong>2007</strong> 111
Financial statements<br />
OAO <strong>Severstal</strong> and subsidiaries<br />
Notes to the consolidated financial statements<br />
for the year ended December 31, <strong>2007</strong><br />
(Amounts expressed in thousands of US dollars, except as otherwise stated)<br />
December 31, 2005<br />
Market value Book value Difference<br />
Citibank CLN – Eurobonds 2009 336,830 325,000 11,830<br />
Citibank CLN – Eurobonds 2014 407,438 375,000 32,438<br />
Other bonds 225,552 223,216 2,336<br />
969,820 923,216 46,604<br />
The above amounts exclude accrued interest.<br />
The market value of the Group’s Eurobonds was determined based on London Stock Exchange quotations.<br />
Credit risk<br />
The maximum exposure to credit risk is represented by the carrying amount of each financial asset in the balance sheet and guarantees (see Note 32e).<br />
The Group has developed policies and procedures for the management of credit exposures, including the establishment of credit committees that actively<br />
monitors credit risk.<br />
The maximum exposure to credit risk for trade receivables including trade receivables from related parties at the reporting date was:<br />
December 31,<br />
<strong>2007</strong> 2006 2005<br />
Available-for-sale financial assets 27,103 10,431 12,681<br />
Held-to-maturity securities and deposits 745,106 1,203,507 676,500<br />
Held-for-trading securities 146,564 152,716 78,280<br />
Loans and receivables 2,099,792 1,833,516 1,697,950<br />
Cash and cash equivalents 1,546,881 1,701,022 1,327,887<br />
4,565,446 4,901,192 3,793,298<br />
The maximum exposure to credit risk for trade receivables including trade receivables from related parties at the reporting date by geographic region was:<br />
December 31,<br />
<strong>2007</strong> 2006 2005<br />
Russian Federation 502,174 249,086 318,725<br />
Europe 981,440 921,789 742,949<br />
North America 128,198 162,896 207,926<br />
The Middle East 38,397 23,241 21,498<br />
South-East Asia 13,214 4,293 7,049<br />
Central and South America 1,604 6,678 4,744<br />
China and Central Asia 19,018 19,084 11,800<br />
Africa 34,343 17,814 31,666<br />
1,718,388 1,404,881 1,346,357<br />
The maximum exposure to credit risk for trade receivables including trade receivables from related parties at the reporting date by type of customer was:<br />
December 31,<br />
<strong>2007</strong> 2006 2005<br />
Wholesale customers 270,298 284,553 354,950<br />
Retail customers 88 4,463 3,312<br />
End-user customers 1,298,692 954,812 835,824<br />
Producers 106,512 137,602 104,957<br />
Other customers 42,798 23,451 47,314<br />
1,718,388 1,404,881 1,346,357<br />
112 <strong>Severstal</strong> <strong>Annual</strong> <strong>Report</strong> <strong>2007</strong>
OAO <strong>Severstal</strong> and subsidiaries<br />
Notes to the consolidated financial statements<br />
for the year ended December 31, <strong>2007</strong><br />
(Amounts expressed in thousands of US dollars, except as otherwise stated)<br />
Impairment losses<br />
The aging of trade receivables including trade receivables from related parties at the reporting date was:<br />
December 31,<br />
<strong>2007</strong> 2006 2005<br />
Gross Impairment Gross Impairment Gross Impairment<br />
Not past due 1,065,731 (2,512) 891,505 (2,667) 842,773 (698)<br />
Past due 0-30 days 502,650 (3,061) 365,751 (6,957) 289,436 (4,213)<br />
Past due 31-90 days 125,033 (3,245) 132,621 (4,736) 135,059 (3,664)<br />
Past due 91-180 days 27,335 (20,348) 21,745 (8,053) 61,979 (23,652)<br />
Past due 180-365 days 11,947 (397) 12,513 (605) 12,708 (2,207)<br />
More than one year 21,575 (6,320) 7,690 (3,926) 48,045 (9,209)<br />
1,754,271 (35,883) 1,431,825 (26,944) 1,390,000 (43,643)<br />
The impairment allowance at December 31, <strong>2007</strong> includes recognized impairment allowance in respect of trade receivables from related parties for the<br />
total amount of US$ 9.2 million (2006: nil; 2005: nil).<br />
The movement in allowance for impairment in respect of trade receivables including trade receivables from related parties during the year was<br />
as follows:<br />
Year ended December 31,<br />
<strong>2007</strong> 2006 2005<br />
Balance at 1 January (26,944) (43,643) (60,448)<br />
Impairment loss recognised (9,716) (9,027) (5,039)<br />
Impairment loss reversed – 27,268 20,840<br />
Impairment loss – other movements 777 (1,542) 1,004<br />
Balance at 31 December (35,883) (26,944) (43,643)<br />
The allowance account in respect of trade receivables including trade receivables from related parties is used to record impairment losses unless the<br />
Group is satisfied that no recovery of the amount owing is possible; at that point the amount is considered irrecoverable and is written off against the<br />
financial asset directly.<br />
No impairment allowance was recognised by the Group in respect of other financial assets.<br />
At the balance sheet date there was a significant concentration of credit risk in respect of trade accounts receivable from related parties, originated<br />
loans to related parties and deposits in related parties.<br />
Trade receivables from related parties<br />
The Group’s most significant customer, a related party ZAO TD <strong>Severstal</strong>-invest, accounts for US$ 30.1 million of trade receivables carrying amount<br />
at December 31, <strong>2007</strong> (US$ 55.1 million and US$ 55.3 million at December 31, 2006 and December 31, 2005 respectively).<br />
Originated short-term loans to related parties<br />
The Group’s most significant related party in <strong>2007</strong>, SeverCorr LLC, accounted for US$ 60 million of the short-term loans receivable carrying amount<br />
at December 31, <strong>2007</strong>.<br />
The Group’s most significant related parties in 2006, OOO Impuls-Consult and ZAO TD <strong>Severstal</strong>-invest, accounted for US$ 46 million and<br />
US$ 7.8 million of the short-term loans receivable carrying amount at December 31, 2006 respectively.<br />
The Group’s most significant related parties in 2005, OOO Monolit, OAO Promstroybank and ZAO TD <strong>Severstal</strong>-invest, accounted for US$ 46.5 million,<br />
US$ 7.7 million and US$ 6 million of the short-term loans receivable carrying amount at December 31, 2005.<br />
Originated long-term loans to related parties<br />
The Group’s most significant related parties in <strong>2007</strong>, OAO Metcombank and ZAO TD <strong>Severstal</strong>-invest, accounted for US$ 13 million and US$ 19.7 million<br />
of the long-term loans receivable carrying amount at December 31, <strong>2007</strong> respectively.<br />
The Group’s most significant related party in 2006, SeverCorr LLC, accounted for US$ 60 million of the long-term loans receivable carrying amount<br />
at December 31, 2006.<br />
The Group’s most significant related party in 2005, Baracom Limited, accounted for US$ 38 million of the long-term loans receivable carrying amount<br />
at December 31, 2005.<br />
Long-term deposits in related parties<br />
The Group’s most significant related party in <strong>2007</strong>, NPF Stalfond, accounted for US$ 62.4 million of the long-term deposits carrying amount at<br />
December 31, <strong>2007</strong> (US$ 50.1 million at December 31, 2006).<br />
<strong>Severstal</strong> <strong>Annual</strong> <strong>Report</strong> <strong>2007</strong> 113
Financial statements<br />
OAO <strong>Severstal</strong> and subsidiaries<br />
Notes to the consolidated financial statements<br />
for the year ended December 31, <strong>2007</strong><br />
(Amounts expressed in thousands of US dollars, except as otherwise stated)<br />
Liquidity risk<br />
The Group manages liquidity risk with the objective of ensuring that funds will be available at all times to honor all cash flow obligations as they become<br />
due by preparing an annual budgets, by continuously monitoring forecast and actual cash flows and matching the maturity profiles of financial assets<br />
and liabilities.<br />
The following are the contractual maturities of financial liabilities, excluding estimated interest payments and excluding the impact of netting<br />
agreements:<br />
December 31, <strong>2007</strong><br />
Carrying Contractual less than More than<br />
amount* cash flows* 1 year 1-2 years 2-5 years 5 years<br />
Non-derivative financial liabilities<br />
Debt finance 3,286,547 (3,286,547) (936,440) (683,314) (971,420) (695,373)<br />
Finance lease liabilities 24,536 (24,536) (9,926) (8,860) (4,042) (1,708)<br />
Trade and other payables 1,837,796 (1,837,796) (1,801,639) (36,157) – –<br />
5,148,879 (5,148,879) (2,748,005) (728,331) (975,462) (697,081)<br />
December 31, 2006<br />
Carrying Contractual less than More than<br />
amount* cash flows* 1 year 1-2 years 2-5 years 5 years<br />
Non-derivative financial liabilities<br />
Debt finance 2,950,851 (2,950,851) (902,816) (273,713) (1,214,881) (559,441)<br />
Finance lease liabilities 16,321 (16,321) (2,579) (3,406) (8,602) (1,734)<br />
Trade and other payables 1,790,478 (1,790,478) (1,713,478) (55,207) (21,793) –<br />
Bank customer accounts 31,143 (31,143) (31,143) – – –<br />
4,788,793 (4,788,793) (2,650,016) (332,326) (1,245,276) (561,175)<br />
December 31, 2005<br />
Carrying Contractual less than More than<br />
amount* cash flows* 1 year 1-2 years 2-5 years 5 years<br />
Non-derivative financial liabilities<br />
Debt finance 2,888,099 (2,888,099) (956,405) (187,681) (1,308,644) (435,369)<br />
Finance lease liabilities 11,462 (11,462) (1,964) (2,923) (6,575) –<br />
Trade and other payables 2,026,193 (2,026,193) (1,908,111) (85,227) (32,855) –<br />
Bank customer accounts 98,867 (98,867) (98,867) – – –<br />
5,024,621 (5,024,621) (2,965,347) (275,831) (1,348,074) (435,369)<br />
*The above amounts exclude accrued interest.<br />
Currency risk<br />
The Group incurs currency risk when an entity enters into transactions and balances not denominated in its functional currency. The Group has assets and<br />
liabilities denominated in several foreign currencies. Foreign currency risk arises when the actual or forecasted assets in a foreign currency are either greater<br />
or less than the liabilities in that currency.<br />
The Group’s exposure to foreign currency risk was as follows based on notional amounts:<br />
December 31, <strong>2007</strong><br />
Euro USD GBP CHF CAD Other<br />
Available-for-sale financial assets – 530 – – – –<br />
Held-to-maturity securities and deposits 373,225 120,686 – – – –<br />
Held-for-trading securities – 210 – – – –<br />
Loans and receivables 108,018 210,627 14,265 1,326 5,192 14<br />
Cash and cash equivalents 185,692 348,020 115 734 2,045 2,680<br />
Debt finance (453,993) (1,318,029) – – – –<br />
Finance lease liabilities (1,396) (7,080) – – – –<br />
Trade and other payables (17,879) (97,717) (13,001) (4,249) (5,829) (346)<br />
Net exposure 193,667 (742,753) 1,379 (2,189) 1,408 2,348<br />
114 <strong>Severstal</strong> <strong>Annual</strong> <strong>Report</strong> <strong>2007</strong>
OAO <strong>Severstal</strong> and subsidiaries<br />
Notes to the consolidated financial statements<br />
for the year ended December 31, <strong>2007</strong><br />
(Amounts expressed in thousands of US dollars, except as otherwise stated)<br />
December 31, 2006<br />
Euro USD GBP CHF CAD Other<br />
Available-for-sale financial assets – 70 – – – –<br />
Held-to-maturity securities and deposits 351,448 198,205 – – – –<br />
Held-for-trading securities – – – – – –<br />
Loans and receivables 61,593 151,404 37,689 1,051 14,156 –<br />
Cash and cash equivalents 158,841 432,877 983 356 2,815 2,894<br />
Debt finance (428,811) (1,200,729) – – – –<br />
Finance lease liabilities (685) (3,161) – – – –<br />
Trade and other payables (28,126) (124,671) (17,994) (2,937) (1,891) (943)<br />
Net exposure 114,260 (546,005) 20,678 (1,530) 15,080 1,951<br />
December 31, 2005<br />
Euro USD GBP CHF CAD Other<br />
Available-for-sale financial assets – 67 – – – –<br />
Held-to-maturity securities and deposits – 477,901 – – – –<br />
Held-for-trading securities – – – – – –<br />
Loans and receivables 109,888 105,135 8,927 547 8,791 –<br />
Cash and cash equivalents 181,883 356,228 429 231 5,151 2,589<br />
Debt finance (164,111) (1,279,302) – – – –<br />
Finance lease liabilities – – – – – –<br />
Trade and other payables (223,441) (91,234) (1,405) (56,052) (1,096) (311)<br />
Net exposure (95,781) (431,205) 7,951 (55,274) 12,846 2,278<br />
Sensitivity analysis<br />
A 10 percent strengthening of the following currencies against the functional currency at December 31, <strong>2007</strong> would have increased (decreased) profit or<br />
loss and equity by the amounts shown below. This analysis assumes that all other variables, in particular interest rates, remain constant and no translation<br />
difference into the presentation currency is included. The analysis is performed on the same basis for 2006 and 2005.<br />
Year ended December 31,<br />
<strong>2007</strong> 2006 2005<br />
Net profit or loss<br />
Euro 14,331 8,561 4,145<br />
USD (56,012) (40,785) (34,021)<br />
GBP (22) 1,415 533<br />
CHF (166) (116) (4,201)<br />
CAD 94 1,010 861<br />
Other 178 148 173<br />
A 10 percent weakening of the following currencies against the functional currency at December 31, <strong>2007</strong> would have had the equal but opposite effect on<br />
the above currencies to the amounts shown above, on the basis that all other variables remain constant.<br />
Interest rate risk<br />
Interest rates on the Group’s debt finance are either fixed or variable, at a fixed spread over LIBOR or Euribor for the duration of each contract. Changes<br />
in interest rates impact primarily loans and borrowings by changing either their fair value (fixed rate debt) or their future cash flows (variable rate debt).<br />
Management does not have a formal policy of determining how much of the Group’s exposure should be to fixed or variable rates. However, at the time<br />
of raising new loans or borrowings management uses its judgment to decide whether it believes that a fixed or variable rate would be more favorable to the<br />
Group over the expected period until maturity.<br />
<strong>Severstal</strong> <strong>Annual</strong> <strong>Report</strong> <strong>2007</strong> 115
Financial statements<br />
OAO <strong>Severstal</strong> and subsidiaries<br />
Notes to the consolidated financial statements<br />
for the year ended December 31, <strong>2007</strong><br />
(Amounts expressed in thousands of US dollars, except as otherwise stated)<br />
At the reporting date the interest rate profile of the Group’s interest-bearing financial instruments was:<br />
December 31,<br />
<strong>2007</strong> 2006 2005<br />
Fixed rate instruments<br />
Financial assets 4,130,846 4,518,134 3,411,984<br />
Financial liabilities (3,273,207) (3,337,636) (3,594,992)<br />
857,639 1,180,498 (183,008)<br />
Variable rate instruments<br />
Financial assets 434,600 383,058 381,314<br />
Financial liabilities (1,916,027) (1,505,905) (1,469,349)<br />
(1,481,427) (1,122,847) (1,088,035)<br />
Fair value sensitivity analysis for fixed rate instruments<br />
The Group does not account for any fixed rate financial assets and liabilities at fair value through profit or loss, and the Group does not designate derivatives<br />
(interest rate swaps) as hedging instruments under a fair value hedge accounting model. Therefore a change in interest rates at the reporting date would<br />
not affect profit or loss.<br />
Cash flow sensitivity analysis for variable rate instruments<br />
A change of 100 basis points in interest rates at the reporting date would have increased (decreased) equity and profit or loss by the amounts shown<br />
below. This analysis assumes that all other variables, in particular foreign currency rates, remain constant. The analysis is performed on the same basis<br />
for 2006 and 2005.<br />
Net profit or loss<br />
100 bp increase 100 bp decrease<br />
December 31, <strong>2007</strong><br />
Variable rate instruments<br />
Financial assets 2 ,912 (2,912)<br />
Financial liabilities (13,459) 13,459<br />
Cash flow sensitivity (net) (10,547) 10,547<br />
December 31, 2006<br />
Variable rate instruments<br />
Financial assets 2,745 (2,745)<br />
Financial liabilities (10,545) 10,545<br />
Cash flow sensitivity (net) (7,800) 7,800<br />
December 31, 2005<br />
Variable rate instruments<br />
Financial assets 2,647 (2,647)<br />
Financial liabilities (10,377) 10,377<br />
Cash flow sensitivity (net) (7,730) 7,730<br />
116 <strong>Severstal</strong> <strong>Annual</strong> <strong>Report</strong> <strong>2007</strong>
Shareholder information<br />
and financial calendar<br />
Contacts<br />
<strong>Severstal</strong><br />
Legal address: 30 Mira St. Cherepovets<br />
Vologda Region, 162600, Russia<br />
Postal address: 2/3 K. Tsetkin Street<br />
Moscow, 127299, Russia<br />
Tel/Fax: +7 (495) 540 7766/67<br />
www.severstal.com<br />
Corporate Secretary<br />
Oleg Tsvetkov<br />
Tel: +7 (8202) 53 1248<br />
Fax: +7 (8202) 53 2159<br />
E-mail: otsvetkov@severstal.ru<br />
Press service<br />
Head of Press Service<br />
Olga Antonova<br />
Tel/Fax: +7 (495) 540 7766/67<br />
E-mail: antonova@severstal.ru<br />
Investor relations<br />
Head of Investor Relations<br />
Dmitry Druzhinin<br />
Tel: +7 (495) 540 7766<br />
Fax: +7 (495) 150 8800<br />
E-mail: druzhinin@severstal.ru<br />
Auditor<br />
KPMG Limited<br />
Legal address:<br />
1 Le Marchant Street, St. Peter Port<br />
Guernsey GY1 4HP, Channel Islands<br />
Moscow representative office:<br />
18, Krasnopresnenskaya Naberezhnaya,<br />
Block C, floor 31, Moscow, 123317, Russia<br />
Tel: +7 (495) 937 4477<br />
Fax: +7 (495) 937 4499<br />
Registrator<br />
Partner<br />
Address: 22, Pobedy Ave., Cherepovets<br />
162606, Vologda Region, Russia<br />
Tel: +7 (8202) 53 6021<br />
Fax: +7 (8202) 55 3335<br />
Licence no.: 10-000-1-00287<br />
Date of issue: 04.04.2003 r.<br />
Expiry date: no expiry date<br />
Issued by: FSFM of Russia<br />
2008 IR calendar<br />
Date<br />
Event<br />
17 March 2008 Full year <strong>2007</strong> IFRS financial statements<br />
21 May 2008 Q1 2008 IFRS financial statements<br />
27 June 2008 <strong>2007</strong> Shareholders’ <strong>Annual</strong> General Meeting<br />
3 September 2008 H1 2008 IFRS financial statements<br />
19 November 2008 Q3 2008 IFRS financial statements<br />
March 2009<br />
Full year 2008 IFRS financial statements<br />
Designed by Pauffley<br />
Printed in the UK by MPG Impressions.<br />
`<br />
Both the printer and the paper mill are accredited<br />
with the ISO 14001 standard for environmental<br />
management and are Forest Stewardship<br />
Council (FSC) chain-of-custody certified.<br />
<strong>Severstal</strong> <strong>Annual</strong> <strong>Report</strong> <strong>2007</strong> 117
www.severstal.com