Exotic magneto-optical effects in solids - Department of Physics
Exotic magneto-optical effects in solids - Department of Physics
Exotic magneto-optical effects in solids - Department of Physics

You also want an ePaper? Increase the reach of your titles
YUMPU automatically turns print PDFs into web optimized ePapers that Google loves.
Ph.D. thesis<br />
<strong>Exotic</strong> <strong>magneto</strong>-<strong>optical</strong> <strong>effects</strong><br />
<strong>in</strong> <strong>solids</strong><br />
Sándor Bordács<br />
Supervisor: Dr. István Kézsmárki<br />
<strong>Department</strong> <strong>of</strong> <strong>Physics</strong><br />
Budapest University <strong>of</strong> Technology and Economics<br />
BUTE<br />
(2011)
Contents<br />
1 Introduction 3<br />
2 Fundamentals <strong>of</strong> light-matter <strong>in</strong>teraction 6<br />
2.1 Electromagnetic plane-waves . . . . . . . . . . . . . . . . . . . 6<br />
2.2 Symmetry and <strong>magneto</strong>-<strong>optical</strong> <strong>effects</strong> . . . . . . . . . . . . . 8<br />
2.2.1 Magneto-<strong>optical</strong> activity . . . . . . . . . . . . . . . . . 8<br />
2.2.2 Natural <strong>optical</strong> activity . . . . . . . . . . . . . . . . . . 11<br />
2.2.3 Directional dichroism . . . . . . . . . . . . . . . . . . . 11<br />
2.3 Optical property tensors . . . . . . . . . . . . . . . . . . . . . 13<br />
3 Experimental techniques and methods 23<br />
3.1 Optical spectroscopy at visible and <strong>in</strong>frared energies . . . . . . 23<br />
3.1.1 Experimentally detected response functions . . . . . . 23<br />
3.1.2 Dispersive and Fourier transform spectrometers . . . . 25<br />
3.1.3 Measurement <strong>of</strong> reflectivity . . . . . . . . . . . . . . . 28<br />
3.2 Broadband <strong>magneto</strong>-<strong>optical</strong> Kerr spectroscopy . . . . . . . . . 29<br />
3.3 Terahertz time-doma<strong>in</strong> spectroscopy . . . . . . . . . . . . . . . 35<br />
4 Experimental determ<strong>in</strong>ation <strong>of</strong> the sp<strong>in</strong>-polarized electronic<br />
band structure <strong>in</strong> magnetic metals 44<br />
4.1 Anomalous Hall effect . . . . . . . . . . . . . . . . . . . . . . 45<br />
4.2 Optical and <strong>magneto</strong>-<strong>optical</strong> study <strong>of</strong> the nearly half-metallic<br />
CuCr 2 Se 4 . . . . . . . . . . . . . . . . . . . . . . . . . . . . . 47<br />
4.2.1 It<strong>in</strong>erant electron magnetism <strong>in</strong> CuCr 2 Se 4 . . . . . . . 47<br />
4.2.2 Results <strong>of</strong> the <strong>optical</strong> and <strong>magneto</strong>-<strong>optical</strong> studies on<br />
CuCr 2 Se 4 . . . . . . . . . . . . . . . . . . . . . . . . . 50<br />
4.3 Sp<strong>in</strong> chirality-<strong>in</strong>duced <strong>magneto</strong>-<strong>optical</strong> activity <strong>in</strong> electronand<br />
hole-doped Nd 2 Mo 2 O 7 . . . . . . . . . . . . . . . . . . . . 57<br />
4.3.1 Anomalous Hall effect <strong>in</strong> the non-coll<strong>in</strong>ear ferromagnet<br />
Nd 2 Mo 2 O 7 . . . . . . . . . . . . . . . . . . . . . . . . . 57<br />
1
4.3.2 Optical and <strong>magneto</strong>-<strong>optical</strong> spectroscopy on<br />
Nd 2 (Mo,Nb) 2 O 7 and (Nd,Ca) 2 Mo 2 O 7 . . . . . . . . . . 59<br />
5 Magnetic-order-<strong>in</strong>duced crystal symmetry lower<strong>in</strong>g resolved<br />
by <strong>optical</strong> phonons 68<br />
5.1 Crystal structure and ordered phases <strong>of</strong> ACr 2 O 4 sp<strong>in</strong>els . . . . 69<br />
5.2 Symmetry analysis <strong>of</strong> lattice vibrations <strong>in</strong> crystals with sp<strong>in</strong>el<br />
structure . . . . . . . . . . . . . . . . . . . . . . . . . . . . . . 73<br />
5.3 Sp<strong>in</strong>-lattice <strong>in</strong>teraction <strong>in</strong> frustrated magnets . . . . . . . . . . 76<br />
5.4 Infrared active phonon modes <strong>in</strong> ACr 2 O 4 chromium sp<strong>in</strong>els . . 79<br />
6 Optical <strong>magneto</strong>electric effect <strong>of</strong> sp<strong>in</strong> waves <strong>in</strong> the multiferroic<br />
Ba 2 CoGe 2 O 7 94<br />
6.1 Crystal structure and magnetic order<strong>in</strong>g <strong>in</strong> Ba 2 CoGe 2 O 7 . . . 94<br />
6.2 Giant directional dichroism <strong>of</strong> terahertz light <strong>in</strong> Ba 2 CoGe 2 O 7 . 99<br />
6.3 Optical activity and <strong>magneto</strong>-chiral dichroism <strong>of</strong> sp<strong>in</strong> waves<br />
<strong>in</strong> Ba 2 CoGe 2 O 7 . . . . . . . . . . . . . . . . . . . . . . . . . . 106<br />
7 Summary 113<br />
8 List <strong>of</strong> Publications 115<br />
8.1 Publications related to the thesis po<strong>in</strong>ts . . . . . . . . . . . . . 115<br />
8.2 Further publications . . . . . . . . . . . . . . . . . . . . . . . 116<br />
A Appendix for the chapter ”Magnetic-order-<strong>in</strong>duced crystal<br />
symmetry lower<strong>in</strong>g resolved by <strong>optical</strong> phonons” 118<br />
2
Chapter 1<br />
Introduction<br />
In 1845 Michael Faraday discovered that the polarization <strong>of</strong> a l<strong>in</strong>early polarized<br />
light beam is rotated upon propagat<strong>in</strong>g through a media which is<br />
placed <strong>in</strong> a magnetic field parallel to the propagation direction [1, 2]. This<br />
experiment was among the first ones that <strong>in</strong>dicated the <strong>in</strong>timate relationship<br />
between magnetic field and light. Moreover, it <strong>in</strong>itiated a research for materials<br />
show<strong>in</strong>g <strong>optical</strong> cross <strong>effects</strong>, mak<strong>in</strong>g the manipulation <strong>of</strong> the polarization<br />
or <strong>in</strong>tensity <strong>of</strong> light possible via external fields. Nowadays, crystals show<strong>in</strong>g<br />
large <strong>magneto</strong>-<strong>optical</strong> <strong>effects</strong> are widely used <strong>in</strong> <strong>optical</strong> isolators (Faraday<br />
rotators, <strong>optical</strong> circulators), mode-conversion waveguides and <strong>optical</strong> data<br />
storage [3].<br />
In addition, the Faraday effect, and its counterpart <strong>in</strong> reflection, the<br />
<strong>magneto</strong>-<strong>optical</strong> Kerr effect (MOKE), are widely used to detect the magnetization<br />
<strong>of</strong> materials [4, 3]. MOKE <strong>of</strong>fers a unique tool for the determ<strong>in</strong>ation <strong>of</strong><br />
the surface magnetization <strong>of</strong> th<strong>in</strong> films with even higher sensitivity than superconduct<strong>in</strong>g<br />
quantum <strong>in</strong>terferometer devices (SQUID). The comb<strong>in</strong>ation<br />
<strong>of</strong> microscopy and <strong>magneto</strong>-<strong>optical</strong> effect allowed the observation <strong>of</strong> magnetic<br />
doma<strong>in</strong> walls <strong>in</strong> ferromagnets and vortices <strong>in</strong> superconductors [5, 6].<br />
Thanks to the <strong>optical</strong> detection, the dynamics <strong>of</strong> the magnetization can be<br />
followed <strong>in</strong> time doma<strong>in</strong> with picosecond resolution, open<strong>in</strong>g a way toward<br />
<strong>optical</strong>ly excited magnetic resonance, or the real-time <strong>in</strong>vestigation <strong>of</strong> sp<strong>in</strong><br />
diffusion <strong>in</strong> semiconductors [7, 8]. Beside the real space observation <strong>of</strong> the<br />
magnetization, broadband <strong>magneto</strong>-<strong>optical</strong> spectroscopy gives fundamental<br />
<strong>in</strong>formation about the sp<strong>in</strong> polarized band structure <strong>in</strong> magnetic <strong>solids</strong> [9].<br />
In the last decades, the existence <strong>of</strong> several new <strong>magneto</strong>-<strong>optical</strong> <strong>effects</strong><br />
were confirmed experimentally <strong>in</strong> magnetic materials with low spatial symmetry<br />
[10, 11, 12]. An <strong>in</strong>terest<strong>in</strong>g family <strong>of</strong> these new <strong>effects</strong> is the directional<br />
dichroism, where the absorption <strong>of</strong> the light beam is different for the<br />
counterpropagat<strong>in</strong>g rays irrespective to their polarization state. Directional<br />
3
dichroism can arise <strong>in</strong> two different situations; <strong>in</strong> a chiral media exposed to<br />
a magnetic field and <strong>in</strong> crystals that is both paramagnetic and paraelectric<br />
placed <strong>in</strong> crossed electric and magnetic fields. Though these new <strong>magneto</strong><strong>optical</strong><br />
<strong>effects</strong> would be <strong>in</strong>terest<strong>in</strong>g from technological po<strong>in</strong>t <strong>of</strong> view, their<br />
small magnitude <strong>in</strong> usual materials do not make them attractive for real<br />
applications.<br />
The goal <strong>of</strong> my PhD work is to <strong>in</strong>vestigate materials show<strong>in</strong>g <strong>in</strong>terest<strong>in</strong>g<br />
<strong>magneto</strong>-<strong>optical</strong> <strong>effects</strong> and the tailor<strong>in</strong>g <strong>of</strong> novel compounds with unique<br />
properties for <strong>optical</strong> applications and <strong>in</strong>formation technology. The study <strong>of</strong><br />
such compounds over an extended range <strong>of</strong> magnetic field and temperature<br />
<strong>of</strong>ten provides fundamental <strong>in</strong>formation about the complex magnetic states<br />
and gives a clue for the well-controlled syntesis <strong>of</strong> new systems.<br />
I have exam<strong>in</strong>ed the <strong>magneto</strong>-<strong>optical</strong> <strong>effects</strong> for various types <strong>of</strong> excitations<br />
rang<strong>in</strong>g from <strong>in</strong>ter- and <strong>in</strong>traband transitions <strong>of</strong> electrons, through<br />
<strong>optical</strong> phonons <strong>in</strong> magnetic <strong>in</strong>sulators to sp<strong>in</strong> waves <strong>in</strong> a multiferroic material.<br />
Follow<strong>in</strong>g a brief <strong>in</strong>troduction about the light-matter <strong>in</strong>teraction and<br />
the experimental methods, the chapters <strong>in</strong> this thesis discuss the excitations<br />
<strong>of</strong> different degrees <strong>of</strong> freedom <strong>in</strong> magnetic crystals as <strong>in</strong>troduced above.<br />
4
References<br />
[1] M. Faraday, Philos. Trans. Roy. Soc. London 1, 136 (1846).<br />
[2] L. Landau and E. Lifhsitz, Course <strong>of</strong> theoretical physics: Electrodynamics<br />
<strong>of</strong> cont<strong>in</strong>uous media, 8. (Pergamon Press, Oxford, 1984).<br />
[3] S. Sugano and N. Kojima, Magneto-optics, Spr<strong>in</strong>ger series <strong>in</strong> solid-state<br />
sciences (Spr<strong>in</strong>ger, Berl<strong>in</strong>, 2000).<br />
[4] J. Kerr, Philos. Mag. 3, 321 (1877).<br />
[5] M. Yamanouchi, D. Chiba, F. Matsukura, and H. Ohno, Nature 428,<br />
539 (2004).<br />
[6] M. Terao, Y. Tokunaga, M. Tokunaga, and T. Tamegai, Physica C:<br />
Superconductivity 426-431, 94 (2005).<br />
[7] S. A. Crooker, D. G. Rickel, A. V. Balatsky, and D. L. Smith, Nature<br />
431, 49 (2004).<br />
[8] S. A. Crooker, M. Furis, X. Lou, C. Adelmann, D. L. Smith, C. J.<br />
Palmstrm, and P. A. Crowell, Science 309, 2191 (2005).<br />
[9] V. Antonov, B. Harmon, and A. Yaresko, Electronic structure and<br />
<strong>magneto</strong>-<strong>optical</strong> properties <strong>of</strong> <strong>solids</strong> (Kluwer Academic Publishers, Amsterdam,<br />
2004).<br />
[10] B. B. Krichevtsov, V. V. Pavlov, R. V. Pisarev, and V. N. Gridnev,<br />
Journal <strong>of</strong> <strong>Physics</strong>: Condensed Matter 5, 8233 (1993).<br />
[11] G. L. J. A. Rikken and E. Raupach, Nature 390, 493 (1997).<br />
[12] G. L. J. A. Rikken, C. Strohm, and P. Wyder, Phys. Rev. Lett. 89,<br />
133005 (2002).<br />
5
Chapter 2<br />
Fundamentals <strong>of</strong> light-matter<br />
<strong>in</strong>teraction<br />
Optical spectroscopy probes the properties <strong>of</strong> matter via its <strong>in</strong>teraction with<br />
light over a broad region <strong>of</strong> wavelength. The fundamentals <strong>of</strong> the <strong>in</strong>teraction<br />
between light and matter are summarized <strong>in</strong> this chapter to support the<br />
<strong>in</strong>terpretation <strong>of</strong> the forthcom<strong>in</strong>g experimental results. After the def<strong>in</strong>ition<br />
<strong>of</strong> the <strong>optical</strong> observables, various <strong>magneto</strong>-<strong>optical</strong> phenomena are <strong>in</strong>troduced<br />
on the basis <strong>of</strong> symmetry considerations. F<strong>in</strong>ally, a microscopic description<br />
<strong>of</strong> the <strong>optical</strong> excitations is given <strong>in</strong> the framework <strong>of</strong> the l<strong>in</strong>ear response<br />
theory.<br />
2.1 Electromagnetic plane-waves<br />
The wave equations derived from the Maxwell equations <strong>in</strong> vacuum (far<br />
from the charges and currents generat<strong>in</strong>g the radiation) have monochromatic<br />
plane-wave solutions with a purely transversal character:<br />
△E(r, t) = 1 ∂<br />
E(r, t),<br />
c 2 ∂t<br />
E(r, t) = E o e i(qr−ωt) , (2.1)<br />
where c is the speed <strong>of</strong> light <strong>in</strong> vacuum and E o is the complex polarization<br />
vector [1]. The q wave vector and the E o electric polarization vector completely<br />
describe the electromagnetic radiation, s<strong>in</strong>ce the Maxwell equations<br />
couple the magnetic component, B o , to the electric field accord<strong>in</strong>g to<br />
B(r, t) = B o e i(qr−ωt) ,<br />
ωB o = q × E o . (2.2)<br />
6
The dispersion relation, ω=c|q|, and the transversality give three constra<strong>in</strong>s,<br />
thus, two real parameters determ<strong>in</strong>e the propagation direction and four real<br />
parameters belong to E o for a plane-wave with given ω. Physically the four<br />
parameters mean the <strong>in</strong>tensity, |E o | 2 the global phase <strong>of</strong> the wave, the azimuth,<br />
θ, and the ellipticity, η. In the experiments the change <strong>in</strong> these<br />
quantities upon the transmission <strong>of</strong> the light beam through the medium or<br />
upon its reflection back from the surface <strong>of</strong> the material is detected. The<br />
light scatter<strong>in</strong>g and the depolarization <strong>effects</strong> are not relevant, hence they<br />
are neglected <strong>in</strong> the follow<strong>in</strong>g studies.<br />
Let’s focus on the polarization state <strong>of</strong> light and fix the propagation <strong>of</strong><br />
the wave along the z-axis:<br />
⎛<br />
E(r, t) = ⎝<br />
E xo<br />
E yo<br />
0<br />
⎞<br />
⎠ e i(qz−ωt) . (2.3)<br />
In the most general case, the tip <strong>of</strong> the electric field vector traces out an<br />
ellipse <strong>in</strong> time at a fixed position <strong>in</strong> space.<br />
E y<br />
<br />
<br />
E x<br />
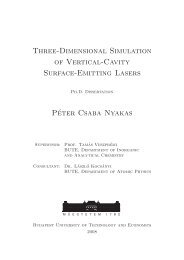
Figure 2.1: The polarization ellipse is described by the azimuth, θ and the<br />
ellipticity, η. In the figure the propagation direction is perpendicular to the<br />
plane <strong>of</strong> the paper. The azimuth is the angle between the major axis <strong>of</strong> the<br />
polarization ellipse and the x-axis, while the tangent <strong>of</strong> the ellipticity is the<br />
ratio <strong>of</strong> the m<strong>in</strong>or and major axes <strong>of</strong> the polarization ellipse [2].<br />
The <strong>in</strong>cident beam is <strong>of</strong>ten prepared to be <strong>in</strong> l<strong>in</strong>early polarized state, e.g.<br />
polarized along the x-axis. After the beam is reflected back from the surface<br />
<strong>of</strong> the sample or is transmitted trough the medium, generally the polarization<br />
state becomes elliptical (see Fig. 2.1). The polarization rotation, θ is the<br />
angle between the major axis <strong>of</strong> the polarization ellipse and the polarization<br />
direction <strong>of</strong> the <strong>in</strong>cident beam, while tangent <strong>of</strong> the ellipticity, tan(η), is<br />
the ratio <strong>of</strong> the m<strong>in</strong>or and major axes <strong>of</strong> the polarization ellipse [2]. The<br />
polarization rotation and ellipticity are related to the electric field, E o by the<br />
7
follow<strong>in</strong>g formula [2]:<br />
tan θ + i tan η<br />
1 − i tan θ tan η = −E yo<br />
E xo<br />
. (2.4)<br />
2.2 Symmetry and <strong>magneto</strong>-<strong>optical</strong> <strong>effects</strong><br />
In this section symmetry arguments are used to classify the possible <strong>magneto</strong>-<strong>optical</strong><br />
<strong>effects</strong> for low-<strong>in</strong>tensity light beams, i.e. when the light-matter<br />
<strong>in</strong>teraction can be treated as a small perturbation. In order to <strong>in</strong>vestigate<br />
polarization dependent phenomena, let us imag<strong>in</strong>e that our crystal is exposed<br />
either to right or to left handed photons, which corresponds to the two helicity<br />
eigenstates <strong>of</strong> light. In the def<strong>in</strong>ition <strong>of</strong> the circularly polarized states, we<br />
follow the convention that the rotation <strong>of</strong> the electric field is determ<strong>in</strong>ed by<br />
an observer fac<strong>in</strong>g opposite to the propagation direction (see Fig. 2.2). If<br />
the refractive <strong>in</strong>dex and the absorption coefficient are different for the two<br />
circularly polarized states <strong>of</strong> light, their phase and amplitude will be changed<br />
<strong>in</strong> a different manner upon the propagation. These anisotropies are denoted<br />
as circular birefr<strong>in</strong>gence and circular dichroism (CD), respectively [2, 3].<br />
As long as the parity violat<strong>in</strong>g weak <strong>in</strong>teraction can be neglected, the<br />
<strong>in</strong>teract<strong>in</strong>g system <strong>of</strong> the light and the crystall<strong>in</strong>e matter is <strong>in</strong>variant under<br />
time-reversal and space <strong>in</strong>version symmetry. Therefore, the results <strong>of</strong> the<br />
time reversed or the space <strong>in</strong>verted experiments have to be the same [2].<br />
When the propagation <strong>of</strong> a right handed beam is considered toward the<br />
direction q, then <strong>in</strong> the time reversed experiment the wave vector will change<br />
sign to -q and the helicity rema<strong>in</strong>s the same. S<strong>in</strong>ce <strong>in</strong> the space <strong>in</strong>verted<br />
experiment both the propagation direction and the helicity changes sign,<br />
the light will become left handed and will propagate backwards with the<br />
wave vector -q (Fig. 2.2). Therefore, the symmetries connect the four states<br />
correspond<strong>in</strong>g to the two circular polarizations, propagat<strong>in</strong>g along ±q. Note<br />
that these symmetry operations have to be applied to the matter as well <strong>in</strong><br />
order to get the whole experiment reversed <strong>in</strong> time or <strong>in</strong>verted <strong>in</strong> space.<br />
2.2.1 Magneto-<strong>optical</strong> activity<br />
When the experiments <strong>in</strong>troduced above are performed on a material with<br />
cubic, m3m symmetry, the <strong>optical</strong> properties are found to be the same for<br />
right and left handed light irrespective to the propagation direction as both<br />
the <strong>in</strong>version and the time-reversal operation leave the crystal <strong>in</strong> the same<br />
state. The cubic symmetry also excludes the possibility <strong>of</strong> any l<strong>in</strong>ear birefr<strong>in</strong>gence<br />
or dichroism.<br />
8
L<br />
i<br />
R<br />
R<br />
T<br />
i<br />
L<br />
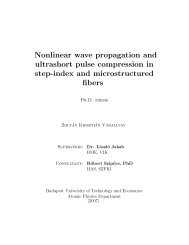
Figure 2.2: The <strong>in</strong>version symmetry (i) reverses the propagation direction<br />
<strong>of</strong> the beam and <strong>in</strong>terchanges the right (R) and left (L) circularly polarized<br />
states. The time-reversal symmetry (T) only changes the sign <strong>of</strong> the wave<br />
vector from q to -q.<br />
B<br />
i<br />
T<br />
B<br />
B<br />
i<br />
B<br />
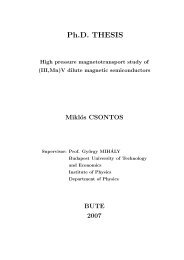
Figure 2.3: A circularly polarized light beam propagates <strong>in</strong> a cubic crystal<br />
which is exposed to an external magnetic field, B. The time-reversal symmetry<br />
requires that the <strong>optical</strong> properties for the counterpropagat<strong>in</strong>g beam with<br />
the same helicity should be the same <strong>in</strong> the reversed magnetic field. Therefore,<br />
for a certa<strong>in</strong> field direction the <strong>optical</strong> properties will be different for the<br />
two counterpropagat<strong>in</strong>g beams with the same circular polarization.<br />
However, if this crystal is placed <strong>in</strong> a static magnetic field, B, or shows<br />
a spontaneous magnetization, M, the direction <strong>of</strong> the magnetic field and the<br />
magnetic moments <strong>in</strong> the crystal are reversed <strong>in</strong> the time-reversed experiment<br />
(see Fig. 2.3). Therefore, the equivalence <strong>of</strong> the counterpropagat<strong>in</strong>g beams<br />
with the same helicity does not hold any more and their <strong>optical</strong> properties<br />
can be different. Consequently, the real part <strong>of</strong> the refractive <strong>in</strong>dex and absorption<br />
coefficient for the two circularly polarized states propagat<strong>in</strong>g to the<br />
same direction can be different which results <strong>in</strong> a magnetic circular birefr<strong>in</strong>gence<br />
and magnetic circular dichroism (MCD). The sign <strong>of</strong> the birefr<strong>in</strong>gence<br />
and the MCD is reversed for the counterpropagat<strong>in</strong>g light beam. The l<strong>in</strong>early<br />
9
polarized state, which is the equal superposition <strong>of</strong> the two circular modes,<br />
is not an eigenstate anymore. More precisely, its propagation can not be<br />
described by a s<strong>in</strong>gle a refractive <strong>in</strong>dex. Hence, the l<strong>in</strong>ear polarization generally<br />
becomes elliptical with the major axis rotated away from the <strong>in</strong>cident<br />
polarization direction due to the different change <strong>in</strong> phase and amplitude<br />
for the two circular polarizations as shown <strong>in</strong> Fig. 2.4. In transmission this<br />
phenomenon is called Faraday effect or MCD, while <strong>in</strong> reflection geometry<br />
the term <strong>magneto</strong>-<strong>optical</strong> Kerr effect is used [3]. F<strong>in</strong>ally, we note that the<br />
refractive <strong>in</strong>dex will be the same when both the propagation direction and<br />
the circularity are reversed as the <strong>in</strong>version symmetry is kept <strong>in</strong>tact.<br />
~k R<br />
-k L<br />
L<br />
L R L R<br />
<br />
R<br />
Incident light<br />
with l<strong>in</strong>ear polarization<br />
Circular birefr<strong>in</strong>gence,<br />
polarization rotation<br />
Circular dichroism,<br />
ellipticity<br />
Figure 2.4: The <strong>in</strong>cident light beam with l<strong>in</strong>ear polarization is the equal superposition<br />
<strong>of</strong> the two circularly polarized states. The difference <strong>in</strong> the real<br />
part <strong>of</strong> the refractive <strong>in</strong>dex for the two circular polarizations, called circular<br />
birefr<strong>in</strong>gence results <strong>in</strong> a phase difference for the two states upon transmission<br />
or reflection. Therefore, the polarization <strong>of</strong> the <strong>in</strong>cident beam is rotated.<br />
On the other hand, the absorption difference for the two helicities, termed as<br />
circular dichroism (CD) causes the ellipticity.<br />
The non-reciprocity <strong>of</strong> the Faraday effect is used to avoid back reflection to<br />
the source <strong>in</strong> <strong>optical</strong> communication or <strong>in</strong> radar technology [3]. The radiation<br />
com<strong>in</strong>g from the source is polarized l<strong>in</strong>early and passes through a transparent<br />
material placed <strong>in</strong> a magnetic field. This arrangement is called an <strong>optical</strong><br />
isolator. With an appropriate strength <strong>of</strong> the field the isolator rotates the<br />
polarization by 45 ◦ . The light reflected back from any part <strong>of</strong> the <strong>optical</strong> path<br />
passes through the isolator aga<strong>in</strong> and it experiences another 45 ◦ polarization<br />
rotation. Hence, it is filtered out by the polarizer.<br />
10
2.2.2 Natural <strong>optical</strong> activity<br />
Circular anisotropy can also arise <strong>in</strong> the absence <strong>of</strong> the <strong>in</strong>version symmetry<br />
even <strong>in</strong> a nonmagnetic crystal, which phenomenon is termed as natural <strong>optical</strong><br />
activity (see Fig. 2.5). Similarly to the magnetic case, this effect causes<br />
the rotation <strong>of</strong> the l<strong>in</strong>ear polarization <strong>in</strong> a transparent medium, while <strong>in</strong> an<br />
absorb<strong>in</strong>g material the so-called natural circular dichroism (NCD) can be<br />
observed. Unlike the magnetic circular anisotropy, natural <strong>optical</strong> activity<br />
is <strong>in</strong>sensitive to the propagation direction due to the presence <strong>of</strong> the timereversal<br />
<strong>in</strong>variance <strong>of</strong> the material. In general, natural <strong>optical</strong> activity arises<br />
<strong>in</strong> chiral materials which do not have any rotary-reflection symmetry, n, <strong>in</strong><br />
their po<strong>in</strong>t group [2].<br />
L<br />
i<br />
T<br />
R<br />
R<br />
i<br />
L<br />
Figure 2.5: Chiral crystals exist both <strong>in</strong> purely left- and right-handed forms<br />
due to the lack <strong>of</strong> rotary reflection symmetry. These crystals exhibit natural<br />
<strong>optical</strong> activity, s<strong>in</strong>ce the <strong>in</strong>version symmetry <strong>in</strong>terchanges the two forms<br />
<strong>of</strong> the crystal and reverses the helicity <strong>of</strong> the prob<strong>in</strong>g light beam as well.<br />
Consequently, <strong>in</strong> a material with given handedness the two circularly polarized<br />
states <strong>of</strong> light behave differently for the same propagation direction.<br />
Basis molecules <strong>of</strong> liv<strong>in</strong>g organisms are <strong>of</strong>ten chiral, such as sugars, prote<strong>in</strong>s<br />
or DNA, and only their right- or left-handed form occur <strong>in</strong> nature. The<br />
study <strong>of</strong> natural <strong>optical</strong> activity over a broad spectral range gives valuable<br />
<strong>in</strong>formation about the structure <strong>of</strong> these molecules. Moreover, when a crystall<strong>in</strong>e<br />
sample is not available, the measurement <strong>of</strong> NCD is a unique method<br />
(beside NMR) for such structural studies. Therefore, ma<strong>in</strong>ly motivated by<br />
life sciences, NCD spectroscopy from the <strong>in</strong>frared up to the x-ray photon<br />
energy region has been developed [2, 4, 5].<br />
2.2.3 Directional dichroism<br />
Materials with low spatial symmetry can show additional <strong>magneto</strong>-<strong>optical</strong><br />
<strong>effects</strong> [2, 6]. Follow<strong>in</strong>g our previous example, let us consider that the po<strong>in</strong>t<br />
11
group <strong>of</strong> an orig<strong>in</strong>ally cubic crystal reduces to 432 from m3m, i.e. each rotaryreflection<br />
symmetry is lost, and the material becomes chiral. When such a<br />
crystal is placed <strong>in</strong> a static magnetic field, the <strong>optical</strong> properties will be different<br />
for each <strong>of</strong> the four basic polarization states, namely for the two circularly<br />
polarized states with the two opposite propagation directions. Therefore,<br />
<strong>optical</strong> properties may depend on the sign <strong>of</strong> the wave vector even for unpolarized<br />
light. This phenomenon is termed as <strong>magneto</strong>-chiral effect. In 1997,<br />
Rikken et al. were the first observers <strong>of</strong> the <strong>magneto</strong>-chiral effect report<strong>in</strong>g<br />
about the <strong>in</strong>tensity difference <strong>of</strong> counterpropagat<strong>in</strong>g lum<strong>in</strong>escent light beams<br />
emitted from a rare-earth complex placed <strong>in</strong> magnetic field [7]. Similarly, the<br />
absorption difference for unpolarized light propagat<strong>in</strong>g parallel or antiparallel<br />
to the magnetization <strong>of</strong> the media, the so-called <strong>magneto</strong>-chiral dichroism<br />
(MChD), has also been observed found for visible light <strong>in</strong> chiral molecular<br />
magnets [8]. However, to date MChD is recognized to be a weak effect [9].<br />
For the general classification <strong>of</strong> the directional anisotropies for an unpolarized<br />
light beam, the symmetries connect<strong>in</strong>g the counterpropagat<strong>in</strong>g states<br />
should be elim<strong>in</strong>ated systematically from the symmetry group <strong>of</strong> the crystal.<br />
As we have already seen, the presence <strong>of</strong> time-reversal ensures that the<br />
radiation propagates along q and -q <strong>in</strong> an identical manner irrespective <strong>of</strong><br />
the polarization. Therefore, directional anisotropy requires the presence <strong>of</strong> a<br />
property odd <strong>in</strong> time-reversal, such as the magnetization M. Now, let us f<strong>in</strong>d<br />
the largest symmetry group support<strong>in</strong>g directional anisotropies, when the<br />
magnetization po<strong>in</strong>ts along a high-symmetry axis, e.g. the z-axis. Among<br />
the pure rotations only the n-fold axis parallel to the magnetization, n z , is<br />
allowed. Two fold rotations with perpendicular axis with respect to the magnetization,<br />
2 ⊥ , are allowed only if the rotation is followed by a time-reversal<br />
operation, 2 ′ ⊥ . In our notation prime means that the given symmetry element<br />
is comb<strong>in</strong>ed with the time-reversal operation. S<strong>in</strong>ce the magnetization<br />
def<strong>in</strong>es a unique axis, no further rotational symmetries can be found. The<br />
direct product <strong>of</strong> the group generated by the rotations listed above and the<br />
<strong>in</strong>version symmetry (neither broken by the magnetization which is an axial<br />
vector) gives the largest symmetry group n/mm ′ m ′ . The <strong>in</strong>version symmetry<br />
transforms the polar vector q to -q, <strong>in</strong>hibit<strong>in</strong>g any form <strong>of</strong> directional dichroism,<br />
thus, only the non-centrosymmetric subgroups are further <strong>in</strong>vestigated.<br />
Without the loss <strong>of</strong> generality, the propagation direction is specified to lie<br />
along a high symmetry direction, either parallel to M (q||M||z) or perpendicular<br />
to M (q||x⊥M). When the propagation direction is parallel to the<br />
magnetization, <strong>in</strong> order to have a directional anisotropy, all <strong>of</strong> the mirror<br />
plane and rotary reflection symmetries need to vanish and the crystal must<br />
have the n2 ′ 2 ′ chiral po<strong>in</strong>t group or its any subgroup. The effect emerg<strong>in</strong>g<br />
under these conditions is noth<strong>in</strong>g but the <strong>magneto</strong>-chiral effect <strong>in</strong>troduced<br />
12
above, where the refractive <strong>in</strong>dex and the absorption coefficient depend on<br />
the scalar product q·M [10, 11, 2].<br />
In the other case, when the wave vector is perpendicular to the magnetization,<br />
the order <strong>of</strong> the n-fold axis po<strong>in</strong>t<strong>in</strong>g parallel to the magnetization<br />
must be odd, otherwise, the symmetry group would conta<strong>in</strong> 2 z , which reverses<br />
the propagation direction. Therefore, the correspond<strong>in</strong>g rotation axis<br />
could be only on or three folded <strong>in</strong> crystall<strong>in</strong>e <strong>solids</strong>. When n z =1 only m z<br />
is possible among the correspond<strong>in</strong>g rotary reflections and one 2 ′ ⊥ axis can<br />
exist with<strong>in</strong> the plane perpendicular to M. Therefore, for n z =1 the largest<br />
symmetry group which allows directional anisotropy is m ′ x2 ′ ym z . This group<br />
is not chiral but polar, thus, it supports the onset <strong>of</strong> ferroelectricity with<br />
polarization, P, po<strong>in</strong>t<strong>in</strong>g along the y axis. The directional anisotropy under<br />
these circumstances is also termed <strong>in</strong> the literature as <strong>magneto</strong>electric directional<br />
anisotropy or <strong>optical</strong> <strong>magneto</strong>electric effect (OME) [12, 13]. Recently,<br />
such <strong>magneto</strong>electric directional anisotropy has been observed <strong>in</strong> isotropic,<br />
paramagnetic materials placed <strong>in</strong> crossed magnetic and electric field [12].<br />
Multiferroics, which are materials simultaneously show<strong>in</strong>g spontaneous electric<br />
polarization and magnetization, can be ideal hosts for a large <strong>optical</strong><br />
<strong>magneto</strong>electric effect. However, only weak <strong>effects</strong> have been reported so far<br />
for the broad spectral region vary<strong>in</strong>g from the near <strong>in</strong>frared to the x-rays<br />
[13, 14, 15]. In the case <strong>of</strong> the <strong>optical</strong> <strong>magneto</strong>electric effect the propagation<br />
direction is perpendicular both to the magnetization (q⊥M) and the spontaneous<br />
polarization (q⊥P). In the theory <strong>of</strong> multiferroic materials the toroidal<br />
moment, T, is <strong>in</strong>troduced as T=P×M, which is useful for the convenient expression<br />
<strong>of</strong> the <strong>magneto</strong>electric directional anisotropy via q·T [13, 14, 15].<br />
F<strong>in</strong>ally, we discuss the n z =3 case, which allows 3 z and three 2 ′ ⊥ axis with<strong>in</strong><br />
the plane perpendicular to M. These symmetry operations generate the po<strong>in</strong>t<br />
group m ′ x2 ′ 6 z , which is neither chiral nor polar. Accord<strong>in</strong>g to our knowledge<br />
directional dichroism has not been studied <strong>in</strong> this geometry so far.<br />
For a deeper understand<strong>in</strong>g <strong>of</strong> the <strong>optical</strong> response <strong>in</strong> <strong>solids</strong> with arbitrary<br />
crystal symmetry, one can go beyond such pictorial symmetry analysis and<br />
<strong>in</strong>vestigate the tensors describ<strong>in</strong>g the <strong>optical</strong> properties by us<strong>in</strong>g Neumann’s<br />
pr<strong>in</strong>ciple.<br />
2.3 Optical property tensors<br />
In this thesis, l<strong>in</strong>ear <strong>optical</strong> <strong>effects</strong> are considered, which means that the<br />
<strong>in</strong>tensity <strong>of</strong> the light beam prob<strong>in</strong>g the properties <strong>of</strong> the matter is small.<br />
Therefore, the microscopic approach can be formulated <strong>in</strong> the framework<br />
<strong>of</strong> l<strong>in</strong>ear response theory and the elements <strong>of</strong> the <strong>optical</strong> property tensors<br />
13
can be calculated us<strong>in</strong>g Kubo’s formula. Although quasi-particle excitations<br />
<strong>of</strong> various degrees <strong>of</strong> freedom can be described by this formalism, <strong>in</strong>clud<strong>in</strong>g<br />
phonons and magnons, for the sake <strong>of</strong> simplicity the ma<strong>in</strong> aspects <strong>of</strong> the<br />
theory will be <strong>in</strong>troduced for electronic excitations.<br />
The sp<strong>in</strong>-orbit coupl<strong>in</strong>g plays an important role <strong>in</strong> <strong>magneto</strong>-<strong>optical</strong> <strong>effects</strong>,<br />
s<strong>in</strong>ce it affects the motion <strong>of</strong> the electrons proportional to their sp<strong>in</strong><br />
magnetization. To describe such <strong>effects</strong>, relativistic corrections have to be<br />
<strong>in</strong>cluded up to the order <strong>of</strong> 1/c 2 <strong>in</strong> the Hamilton operator <strong>of</strong> the electronic<br />
system, H o . The term describ<strong>in</strong>g the light-matter <strong>in</strong>teraction, H <strong>in</strong>t , is treated<br />
as perturbation <strong>in</strong> the Hamiltonian:<br />
H = H o + H <strong>in</strong>t , (2.5)<br />
where H o determ<strong>in</strong>es the energy eigenvalues, E n and the correspond<strong>in</strong>g eigenstates<br />
|n⟩ <strong>in</strong> the absence <strong>of</strong> the radiation. The <strong>in</strong>teraction term has the follow<strong>in</strong>g<br />
form for a s<strong>in</strong>gle electron, when the relativistic <strong>effects</strong> are taken <strong>in</strong>to<br />
account [16]:<br />
H <strong>in</strong>t = − e<br />
2m (pA + Ap) + e2 A 2<br />
2m<br />
−<br />
−<br />
+ eϕ −<br />
e<br />
2m σB<br />
e<br />
8m 2 c 2 σ[2En × (−eA) + E × p − p × E + 2E × (−eA)]<br />
e2 ∇ · E, (2.6)<br />
8m 2 c2 where the vector potential, A, the scalar potential, ϕ, the electric field, E,<br />
and the magnetic field, B, conta<strong>in</strong> contributions from the radiation field only,<br />
while E n is the lattice periodic electric field <strong>of</strong> the core atoms. The last three<br />
terms, the sp<strong>in</strong> Zeeman term, the sp<strong>in</strong>-orbit <strong>in</strong>teraction and the Darw<strong>in</strong> term,<br />
respectively, are the corrections from the Dirac equation.<br />
The spatial variation <strong>of</strong> the radiation is negligible on the scale <strong>of</strong> the<br />
electronic states and the lattice periodicity <strong>in</strong> crystals <strong>in</strong> most cases relevant<br />
to optics. This condition justifies the long wavelength approximation which<br />
is natural for localized electrons <strong>in</strong> <strong>in</strong>sulators. Moreover, it is valid <strong>in</strong> most <strong>of</strong><br />
the metals s<strong>in</strong>ce the mean free path is shorter than the sk<strong>in</strong> depth at <strong>optical</strong><br />
frequencies [17]. Therefore, the spatial dependence <strong>of</strong> the electromagnetic<br />
field can be Taylor expanded [2]:<br />
E α (r) = E α + ∂ β E α r β ,<br />
B α (r) = B α + ∂ β B α r β . (2.7)<br />
The follow<strong>in</strong>g gauge choice <strong>in</strong>troduced by Barron and Gray gives the 2.7<br />
14
expansion for E(r) and B(r):<br />
ϕ(r) = ϕ o − E α r α − 1 2 ∂ βE α r α r β + . . .<br />
A α (r) = 1 2 ε αβγB β r γ + 1 3 ε αγδ∂ β B γ r β r δ + . . . (2.8)<br />
After the substitution <strong>of</strong> the formula 2.8 for the potentials <strong>in</strong>to 2.6, the<br />
<strong>in</strong>teraction Hamilton becomes:<br />
where<br />
H <strong>in</strong>t = −µ α E α − m α B α − 1 3 Θ αβ∂ α E β −<br />
e<br />
4m 2 c ε αβγE 2 α p β σ γ<br />
−<br />
e2 <br />
8m 2 c B αε 2 αβγ r β ε γδκ σ δ Eκ, n (2.9)<br />
µ α = er α , m α = e<br />
2m (L α + 2S α ), Θ αβ = e 2 (3r αr β − r 2 δ αβ )<br />
are the usual electric dipole (E1) magnetic dipole (M1) and electric quadrupole<br />
(E2) operators. In the <strong>in</strong>teraction Hamiltonian 2.9 only the first order terms<br />
<strong>in</strong> the external field are kept and the spatial variation <strong>of</strong> the electromagnetic<br />
field is neglected <strong>in</strong> the relativistic terms. S<strong>in</strong>ce the charges generat<strong>in</strong>g<br />
the electromagnetic radiation are far from the location <strong>of</strong> the light-matter<br />
<strong>in</strong>teraction, the Darw<strong>in</strong> term vanishes.<br />
The Eq. 2.9 is referred to as the dynamic multipole <strong>in</strong>teraction Hamiltonian<br />
[2] as it is a temporal extension <strong>of</strong> the multipole expansion widely used<br />
for static fields. The physical mean<strong>in</strong>g <strong>of</strong> the relativistic correction proportional<br />
to the electric field is that the electric field is transformed to a magnetic<br />
field via Lorentz transformation for a fast-mov<strong>in</strong>g sp<strong>in</strong>n<strong>in</strong>g particle [1], while<br />
the magnetic field dependent correction describes the change <strong>in</strong> the orbital<br />
magnetic moment due to the relativistic correction <strong>in</strong> the velocity operator.<br />
The response <strong>of</strong> the different oscillat<strong>in</strong>g multipole moments to the electromagnetic<br />
radiation is described by the <strong>optical</strong> property tensors. If an<br />
external perturbation is coupled to operator B accord<strong>in</strong>g to H <strong>in</strong>t =Bf ω e −iωt<br />
then the change <strong>in</strong> the expectation value <strong>of</strong> the operator A is given by<br />
⟨δA(ω)⟩=K AB (ω)f ω [18]. Accord<strong>in</strong>g to Kubo, the K AB (ω) l<strong>in</strong>ear response<br />
function has the follow<strong>in</strong>g form [18]:<br />
K AB (ω) =<br />
∫ ∞<br />
0<br />
i<br />
⟨[A(t), B(0)]⟩ oe iωt dt, (2.10)<br />
where ⟨. . .⟩ o means thermal and quantum mechanical average over the unperturbed<br />
equilibrium states.<br />
15
Over the <strong>in</strong>frared-ultraviolet spectrum <strong>of</strong> the electromagnetic radiation,<br />
the lead<strong>in</strong>g term <strong>in</strong> the light-matter <strong>in</strong>teraction is usually captured by the<br />
charge susceptibility, χ ee<br />
αβ ≡χ αβ which describes the electric polarization <strong>in</strong>duced<br />
<strong>in</strong> the material by the electric field <strong>of</strong> light:<br />
P α = ε o χ αβ E β , (2.11)<br />
where ε o is the vacuum dielectric constant. Alternatively the dielectric function,<br />
ε αβ , is <strong>of</strong>ten used, which relates the electric field to the electric field<br />
displacement, D α :<br />
D α = ε o ε αβ E β ,<br />
ε αβ = δ αβ + χ αβ , (2.12)<br />
where δ αβ is the Kronecker delta.<br />
The charge susceptibility can be calculated from Kubo’s formula [18]:<br />
χ αβ = − 1<br />
V ε o<br />
∑<br />
n,m,i,j<br />
e − E n<br />
k B T<br />
− e − E m<br />
k B T<br />
Z<br />
1<br />
⟨n|µ α (i)|m⟩⟨m|µ β (j)|n⟩<br />
ω − ω nm + iγ ,<br />
(2.13)<br />
where µ α (i) is the dipole moment operator <strong>of</strong> the i-th electron, k B is the<br />
Boltzmann constant, T is the temperature and ω nm =E n -E m . The 2.13<br />
expression <strong>of</strong> χ αβ conta<strong>in</strong>s only the E1-E1 processes, i.e. when the electric<br />
polarization is <strong>in</strong>duced by an electric dipole transition.<br />
Time-reversal symmetry gives the follow<strong>in</strong>g constra<strong>in</strong>t between the elements<br />
<strong>of</strong> a general response function K AB :<br />
K AB (ω, B) = ε A ε B K BA (ω, −B), (2.14)<br />
where ε A (ε B ) is equal to ±1 depend<strong>in</strong>g on whether operator A (B) represents<br />
a quantity odd or even <strong>in</strong> time-reversal [18]. It is convenient to divide the<br />
matrix elements to a real and an imag<strong>in</strong>ary part:<br />
K AB ′ 1<br />
∝ Re{⟨n|A|m⟩⟨m|B|n⟩}<br />
ω − ω nm + iγ ,<br />
K AB ′′ 1<br />
∝ Im{⟨n|A|m⟩⟨m|B|n⟩}<br />
ω − ω nm + iγ , (2.15)<br />
s<strong>in</strong>ce they are symmetric and antisymmetric comb<strong>in</strong>ations <strong>of</strong> operator A and<br />
B <strong>in</strong> respect to their exchange:<br />
K ′ AB(ω, B) = ε A ε B K ′ AB(ω, −B),<br />
K ′′ AB(ω, B) = −ε A ε B K ′′ AB(ω, −B). (2.16)<br />
16
The electric dipole operator is a quantity even <strong>in</strong> time-reversal, i.e. ε µ =1,<br />
therefore, accord<strong>in</strong>g to Eq. 2.14 the charge susceptibility χ αβ is a symmetric<br />
tensor <strong>in</strong> the absence <strong>of</strong> magnetic field or magnetization. This implies<br />
that <strong>in</strong> crystals with low spatial symmetry, χ αβ has three dist<strong>in</strong>ct complex<br />
eigenvalues. Due to the different refractive <strong>in</strong>dices for the pr<strong>in</strong>cipal axes,<br />
the propagation <strong>of</strong> light depends on the orientation <strong>of</strong> its l<strong>in</strong>ear polarization,<br />
thus, these materials will show l<strong>in</strong>ear birefr<strong>in</strong>gence and dichroism [19]. In the<br />
cubic case a s<strong>in</strong>gle complex refractive <strong>in</strong>dex determ<strong>in</strong>es the <strong>optical</strong> properties.<br />
However, antisymmetric <strong>of</strong>f-diagonal components <strong>of</strong> the χ αβ tensor appears<br />
even <strong>in</strong> cubic crystals <strong>in</strong> the presence <strong>of</strong> an external magnetic field<br />
or spontaneous magnetization. The charge susceptibility tensor has the follow<strong>in</strong>g<br />
form <strong>in</strong> cubic systems when the magnetization, M, is parallel to the<br />
z-axis:<br />
⎡<br />
⎤<br />
χ xx χ xy 0<br />
χ αβ = ⎣ −χ xy χ xx 0 ⎦ . (2.17)<br />
0 0 χ zz<br />
The diagonal elements are even function <strong>of</strong> the magnetization, while the<br />
<strong>of</strong>f-diagonal components are odd <strong>in</strong> M. The susceptibility tensor <strong>in</strong> the<br />
expression 2.17 has three eigenvalues: χ zz and χ ± =χ xx ± iχ xy . The latter<br />
two determ<strong>in</strong>e the refractive <strong>in</strong>dex for the left- and right-handed photons<br />
propagat<strong>in</strong>g along the direction <strong>of</strong> the magnetization.<br />
In case <strong>of</strong> the <strong>magneto</strong>-<strong>optical</strong> Kerr effect, when l<strong>in</strong>early polarized light<br />
with normal <strong>in</strong>cidence is reflected back from the surface <strong>of</strong> the magnetic<br />
media with magnetization parallel to the propagation direction, polarization<br />
rotation and ellipticity are generated proportional to the <strong>of</strong>f-diagonal element<br />
χ xy :<br />
θ Kerr + iη Kerr ≈<br />
−χ xy<br />
√ , (2.18)<br />
χ xx εxx<br />
for small Kerr-rotation, θ Kerr and Kerr-ellipticity, η Kerr [3].<br />
Besides the charge susceptibility and the dielectric function, the <strong>optical</strong><br />
conductivity connect<strong>in</strong>g the electric field and the charge current is <strong>of</strong>ten used<br />
<strong>in</strong> the literature as<br />
j α = σ αβ E β , (2.19)<br />
where j α is the current density [1, 17]. When only the electric dipole excitations<br />
are considered, the charge susceptibility is related to the <strong>optical</strong><br />
conductivity accord<strong>in</strong>g to<br />
χ αβ = iσ αβ<br />
ωε o<br />
. (2.20)<br />
For a non-<strong>in</strong>teract<strong>in</strong>g electron system <strong>in</strong> a cubic crystal, the diagonal and<br />
17
the <strong>of</strong>f-diagonal <strong>optical</strong> conductivity have the follow<strong>in</strong>g form:<br />
Re{σ xx } =<br />
e2 π ∑<br />
2m 2 V <br />
k,n,m<br />
[f(ϵ n (k)) − f(ϵ m (k))]<br />
ω nm<br />
× [|⟨n, k|p + |m, k⟩| 2 + |⟨n, k|p − |m, k⟩| 2 ]δ(ω − ω nm ),<br />
Im{σ xy } =<br />
e2 π ∑ [f(ϵ n (k)) − f(ϵ m (k))]<br />
4m 2 V <br />
ω nm<br />
k,n,m<br />
× [|⟨n, k|p + |m, k⟩| 2 − |⟨n, k|p − |m, k⟩| 2 ]δ(ω − ω nm ), (2.21)<br />
where ϵ n (k) is the s<strong>in</strong>gle particle energy <strong>of</strong> the electron <strong>in</strong> the |n, k⟩ state,<br />
f(ϵ n (k)) is the Fermi function and p ± =p x ±ip y is the momentum operator <strong>in</strong><br />
circular basis [20]. Note that the crystal momentum, k is conserved <strong>in</strong> <strong>optical</strong><br />
excitations due to the small momentum transfer, i.e. the long wavelength <strong>of</strong><br />
the radiation. Accord<strong>in</strong>g to Eq. 2.21, the real part <strong>of</strong> the diagonal <strong>optical</strong><br />
conductivity describes the absorption <strong>of</strong> light for left and right circularly<br />
polarized photons <strong>in</strong> average. The measurement <strong>of</strong> the diagonal conductivity<br />
gives fundamental <strong>in</strong>formation about the band structure. If the frequency<br />
dependence <strong>of</strong> the matrix elements are neglected, σ xx is proportional to the<br />
jo<strong>in</strong>t density <strong>of</strong> states, ρ j (ω) :<br />
ρ j (ω) = ∑ ∑ ∑<br />
δ(ω − (ϵ n (k) − ϵ m (k))), (2.22)<br />
k n∈occ m∈unocc<br />
where the sum ∑ n∈occ<br />
goes through the occupied states, while ∑ m∈unocc<br />
counts the unoccupied states. On the other hand, the imag<strong>in</strong>ary part <strong>of</strong> the<br />
<strong>of</strong>f-diagonal conductivity is the difference <strong>of</strong> the two absorption spectra for<br />
the left and right circularly polarized light. In a magnetic system the circular<br />
dichroism, Im{σ xy }, measures the orbital magnetization as p ± acts on the<br />
orbital part <strong>of</strong> the wave function, keep<strong>in</strong>g the sp<strong>in</strong> part <strong>of</strong> the wave function<br />
<strong>in</strong>tact, as long as sp<strong>in</strong>-orbit <strong>in</strong>teraction is neglected. More rigorously, Kunes<br />
and Openeer proved that the imag<strong>in</strong>ary part <strong>of</strong> the <strong>of</strong>f-diagonal conductivity<br />
satisfies the follow<strong>in</strong>g sum rule [21]:<br />
∫ ∞<br />
0<br />
Im{σ xy }(ω)dω = − πe2<br />
2mV ⟨(R × P) z⟩, (2.23)<br />
where (R×P) z is the z component <strong>of</strong> the total orbital angular momentum.<br />
However, <strong>in</strong> ferromagnets the sp<strong>in</strong> magnetization partially polarizes the orbitals<br />
through the sp<strong>in</strong>-orbit coupl<strong>in</strong>g, which gives the possibility to <strong>in</strong>vestigate<br />
the sp<strong>in</strong> dependent density <strong>of</strong> states by measur<strong>in</strong>g the <strong>of</strong>f-diagonal<br />
conductivity spectrum.<br />
18
S =S + -<br />
Figure 2.6: The two basic l<strong>in</strong>e shapes <strong>in</strong> <strong>magneto</strong>-<strong>optical</strong> spectroscopy. In this<br />
demonstration a completely sp<strong>in</strong> polarized s<strong>in</strong>glet ground state is assumed.<br />
The diamagnetic l<strong>in</strong>e shape occurs if the sp<strong>in</strong>-orbit splitt<strong>in</strong>g <strong>of</strong> the f<strong>in</strong>al states<br />
is smaller than the life time. While paramagnetic l<strong>in</strong>e shape is observed, when<br />
the transitions are well separated or if only the matrix elements differ for the<br />
two circular polarization. [22]<br />
In <strong>magneto</strong>-<strong>optical</strong> spectroscopy two types <strong>of</strong> l<strong>in</strong>e shapes are dist<strong>in</strong>guished<br />
<strong>in</strong> the <strong>of</strong>f-diagonal conductivity, as presented <strong>in</strong> Fig. 2.6 [23, 22]. The socalled<br />
diamagnetic transition is characteristic for sp<strong>in</strong> and orbitally allowed<br />
transitions such as charge transfer transitions [23, 22, 3]. In this case the<br />
<strong>magneto</strong>-<strong>optical</strong> signal is caused by the splitt<strong>in</strong>g <strong>of</strong> a transition due to sp<strong>in</strong>orbit<br />
coupl<strong>in</strong>g (see Fig. 2.6). If the transition occurs <strong>in</strong> a broad cont<strong>in</strong>uum or<br />
the <strong>in</strong>verse lifetime <strong>of</strong> the transition is larger then the sp<strong>in</strong>-orbit splitt<strong>in</strong>g, the<br />
difference <strong>of</strong> the absorption for the left and the right handed photons, i.e. the<br />
imag<strong>in</strong>ary part <strong>of</strong> the <strong>of</strong>f-diagonal conductivity has a derivative l<strong>in</strong>e shape.<br />
On the other hand, if the excitation energy is the same for the two circularly<br />
polarized photons, but the correspond<strong>in</strong>g matrix elements are different or<br />
the lifetime is long, the imag<strong>in</strong>ary part <strong>of</strong> the <strong>of</strong>f-diagonal conductivity has a<br />
peak structure at the excitation energy. The latter is termed as paramagnetic<br />
l<strong>in</strong>e shape, which is mostly observed <strong>in</strong> case <strong>of</strong> sp<strong>in</strong> or orbitally forbidden<br />
transitions [23, 22, 3].<br />
When further multipole moments describ<strong>in</strong>g light-matter <strong>in</strong>teraction are<br />
relevant <strong>in</strong> the 2.9 Hamiltonian, new response functions appear <strong>in</strong> the expression<br />
<strong>of</strong> the electric polarization:<br />
P α = ε o (χ ee<br />
αβE β + A αβγ ∂ β E γ ) +<br />
√<br />
εo<br />
µ o<br />
χ em<br />
αβ µ o H β . (2.24)<br />
The <strong>magneto</strong>electric tensor, χ em<br />
αβ , is responsible for the magnetic field <strong>in</strong>duced<br />
electric polarization and the A αβγ tensor describes the electric polarization<br />
19
<strong>in</strong>duced by the quadrupolar electric component <strong>of</strong> the radiation. These new<br />
response functions correspond to the E1-M1 and the E1-E2 excitations, respectively:<br />
χ em<br />
αβ = − 1 √<br />
µo<br />
V ε o<br />
A em<br />
αβγ = − 1<br />
V ε o<br />
∑<br />
n,m,i,j<br />
∑<br />
n,m,i,j<br />
e − E n<br />
k B T<br />
e − E n<br />
k B T<br />
− e − E m<br />
k B T<br />
Z<br />
− e − E m<br />
k B T<br />
Z<br />
1<br />
⟨n|µ α (i)|m⟩⟨m|m β (j)|n⟩<br />
ω − ω nm + iγ ,<br />
1<br />
⟨n|µ α (i)|m⟩⟨m|Θ βγ (j)|n⟩<br />
ω − ω nm + iγ .<br />
(2.25)<br />
The matrix elements vanish unless the transition is both electric dipole and<br />
magnetic dipole allowed or both electric dipole and electric quadrupole allowed.<br />
These conditions are satisfied only <strong>in</strong> the simultaneous lack <strong>of</strong> <strong>in</strong>version<br />
and mirror symmetries. The <strong>optical</strong> activity <strong>of</strong> <strong>solids</strong> is caused by<br />
the magnetic field even components <strong>of</strong> the χ em<br />
αβ and the A αβγ tensors, while<br />
<strong>magneto</strong>-chiral effect and the <strong>magneto</strong>electric directional anisotropy are related<br />
to the magnetic field odd components [2]. For short wavelengths, the<br />
contributions from the quadrupole process are usually neglected, but the<br />
A αβγ tensor is important <strong>in</strong> the discussion <strong>of</strong> x-ray spectra [14].<br />
The multipole expansion gives rise to new terms <strong>in</strong> the <strong>in</strong>duced magnetization<br />
as well:<br />
√<br />
M α = χ mm εo<br />
αβ H β + χ me<br />
αβ E β , (2.26)<br />
µ o<br />
where the χ mm<br />
αβ is the usual magnetic susceptibility, while χme αβ describes the<br />
electric field <strong>in</strong>duced magnetization. The two <strong>magneto</strong>electric tensors, χ em<br />
αβ<br />
and χ me<br />
αβ are not <strong>in</strong>dependent, but they fulfil the follow<strong>in</strong>g relations accord<strong>in</strong>g<br />
to Kubo’s formula:<br />
χ me<br />
αβ = [χ me<br />
αβ ] ′ + i[χ me<br />
αβ ] ′′ ,<br />
χ em<br />
αβ = [χ me<br />
βα] ′ − i[χ me<br />
βα] ′′ . (2.27)<br />
The response functions [χ me<br />
αβ ]′ and [χ me<br />
αβ ]′′ correspond to the real and the<br />
imag<strong>in</strong>ary part <strong>of</strong> the matrix element, respectively, similarly to Eqs. 2.15.<br />
20
References<br />
[1] J. Jackson, Classical electrodynamics (Wiley, New York, 1999).<br />
[2] L. Barron, Molecular light scatter<strong>in</strong>g and <strong>optical</strong> activity (Cambridge<br />
University Press, Cambridge, 2004).<br />
[3] S. Sugano and N. Kojima, Magneto-optics, Spr<strong>in</strong>ger series <strong>in</strong> solid-state<br />
sciences (Spr<strong>in</strong>ger, Berl<strong>in</strong>, 2000).<br />
[4] P. J. Stephens, F. J. Devl<strong>in</strong>, and J.-J. Pan, Chirality 20, 643 (2008).<br />
[5] L. Alagna, T. Prosperi, S. Turch<strong>in</strong>i, J. Goulon, A. Rogalev, C. Goulon-<br />
G<strong>in</strong>et, C. R. Natoli, R. D. Peacock, and B. Stewart, Phys. Rev. Lett.<br />
80, 4799 (1998).<br />
[6] N. B. Baranova, Y. V. Bogdanov, and B. Y. Zeldovich, Opt. Commun.<br />
22, 243 (1977).<br />
[7] G. L. J. A. Rikken and E. Raupach, Nature 390, 493 (1997).<br />
[8] C. Tra<strong>in</strong>, R. Gheorghe, V. Krstic, L.-M. Chamoreau, N. S. Ovanesyan,<br />
G. L. J. A. Rikken, M. Gruselle, and M. Verdaguer, Nat. Mater. 7, 729<br />
(2008).<br />
[9] L. D. Barron, Nat Mater 7, 691 (2008).<br />
[10] N. B. Baranova and B. Y. Zeldovich, Molec. Phys. 38, 1085 (1979).<br />
[11] L. D. Barron and J. Vrbancich, Molec. Phys. 51, 715 (1984).<br />
[12] G. L. J. A. Rikken, C. Strohm, and P. Wyder, Phys. Rev. Lett. 89,<br />
133005 (2002).<br />
[13] J. H. Jung, M. Matsubara, T. Arima, J. P. He, Y. Kaneko, and<br />
Y. Tokura, Phys. Rev. Lett. 93, 037403 (2004).<br />
[14] M. Kubota, T. Arima, Y. Kaneko, J. P. He, X. Z. Yu, and Y. Tokura,<br />
Phys. Rev. Lett. 92, 137401 (2004).<br />
[15] T. Arima, Journal <strong>of</strong> <strong>Physics</strong>-Condensed Matter 20 (2008).<br />
[16] J. D. Bjorken and S. D. Drell, Relativistic Quantum Mechanics<br />
(McGraw-Hill, New York, 1964).<br />
21
[17] M. Dressel and G. Grüner, Electrodynamics <strong>of</strong> <strong>solids</strong>: <strong>optical</strong> properties<br />
<strong>of</strong> electrons <strong>in</strong> matter (Cambridge University Press, Cambridge, 2002).<br />
[18] M. Toda, R. Kubo, N. Saitō, and N. Hashitsume, Statistical <strong>Physics</strong>:<br />
Nonequilibrium statistical mechanics, Spr<strong>in</strong>ger series <strong>in</strong> solid-state sciences<br />
(Spr<strong>in</strong>ger-Verlag, Berl<strong>in</strong>, 1985).<br />
[19] L. Landau and E. Lifhsitz, Course <strong>of</strong> theoretical physics: Electrodynamics<br />
<strong>of</strong> cont<strong>in</strong>uous media, 8. (Pergamon Press, Oxford, 1984).<br />
[20] V. Antonov, B. Harmon, and A. Yaresko, Electronic structure and<br />
<strong>magneto</strong>-<strong>optical</strong> properties <strong>of</strong> <strong>solids</strong> (Kluwer Academic Publishers, Amsterdam,<br />
2004).<br />
[21] J. Kuneš and P. M. Oppeneer, Phys. Rev. B 61, 15774 (2000).<br />
[22] S. Wittekoek, T. J. A. Popma, J. M. Robertson, and P. F. Bongers,<br />
Phys. Rev. B 12, 2777 (1975).<br />
[23] F. J. Kahn, P. S. Pershan, and J. P. Remeika, Phys. Rev. 186, 891<br />
(1969).<br />
22
Chapter 3<br />
Experimental techniques and<br />
methods<br />
Nowadays, a rich variety <strong>of</strong> techniques <strong>in</strong> <strong>optical</strong> spectroscopy is available<br />
over a broad photon energy range [1, 2]. In this chapter, I briefly <strong>in</strong>troduce<br />
the methods used <strong>in</strong> our experiments. First, conventional setups for<br />
visible-ultraviolet and for <strong>in</strong>frared spectroscopy are described. Then, a highsensitivity<br />
polarization modulation technique adapted for these spectrometers<br />
is discussed. F<strong>in</strong>ally, a phase sensitive technique work<strong>in</strong>g <strong>in</strong> the longwavelength<br />
terahertz region is <strong>in</strong>troduced, which was developed ow<strong>in</strong>g to the<br />
recent advances <strong>in</strong> the field <strong>of</strong> femtosecond LASERs.<br />
3.1 Optical spectroscopy at visible and <strong>in</strong>frared<br />
energies<br />
3.1.1 Experimentally detected response functions<br />
Due to the experimental difficulties with the phase-sensitive detection <strong>of</strong><br />
electromagnetic radiation, only the light <strong>in</strong>tensity (the reflectivity and the<br />
power transmission) is most commonly measured. In the presence <strong>of</strong> a strong<br />
absorption, the reflectivity can be detected, while the <strong>in</strong>vestigation <strong>of</strong> weak<br />
resonances is more convenient <strong>in</strong> transmission. Accord<strong>in</strong>g to Fresnel, the normal<br />
<strong>in</strong>cidence reflectivity, R, <strong>of</strong> an <strong>in</strong>terface between vacuum and an isotropic<br />
media or a cubic crystal has the follow<strong>in</strong>g form:<br />
√ µ R =<br />
− 1<br />
∣ ∣∣∣∣<br />
2<br />
ε<br />
√<br />
∣ µ + 1 . (3.1)<br />
ε<br />
23
This is valid when the polarization is ma<strong>in</strong>ta<strong>in</strong>ed upon the reflection, i.e. the<br />
crystal is neither chiral nor magnetic [2, 3]. The formula 3.1 expresses that<br />
the orig<strong>in</strong> <strong>of</strong> the reflectivity is the impedance mismatch between vacuum and<br />
the solid as Z= √ µ<br />
is the surface impedance <strong>of</strong> the matter relative to vacuum<br />
ε<br />
[2]. The power transmission, T, for a slab from the same cubic crystal, is<br />
T = (1 − R) 2 e −αd , (3.2)<br />
where α is the absorption coefficient and d is the thickness <strong>of</strong> the slab. In<br />
the expression 3.2 the effect <strong>of</strong> multiple reflections are neglected.<br />
In the follow<strong>in</strong>gs, we focus on the reflectivity, s<strong>in</strong>ce our experiments were<br />
performed ma<strong>in</strong>ly <strong>in</strong> reflection geometry. Above the energy <strong>of</strong> the sp<strong>in</strong> excitations<br />
the magnetic permeability is approximately µ=1, thus, the reflectivity<br />
is solely characterized by the dielectric function. However, the normal <strong>in</strong>cidence<br />
reflectivity at a given wavelength does not fully determ<strong>in</strong>e the complex<br />
dielectric function, ε. To avoid this uncerta<strong>in</strong>ty, Kramers-Kronig transformation<br />
is used to calculate the phase shift <strong>of</strong> the electromagnetic radiation,<br />
upon reflection:<br />
ϕ(ω) = − ω π<br />
∫ ∞<br />
0<br />
ln[R(ω ′ )] − ln[R(ω)]<br />
ω ′2 − ω 2 dω ′ . (3.3)<br />
S<strong>in</strong>ce the reflectivity cannot be obta<strong>in</strong>ed over the entire spectral range <strong>in</strong><br />
a real experiment, beyond the spectral region <strong>of</strong> the measurement it has<br />
to be extrapolated towards zero and <strong>in</strong>f<strong>in</strong>ite frequencies [1, 2]. After us<strong>in</strong>g<br />
the Kramers-Kronig transformation <strong>in</strong> order to calculate the phase spectrum<br />
correspond<strong>in</strong>g to the measured reflectivity, the complex dielectric function<br />
can be determ<strong>in</strong>ed from Eq. 3.1.<br />
Resonance-like excitations can be approximated with the l<strong>in</strong>eshape <strong>of</strong> a<br />
damped oscillator, where the different transitions are well separated and the<br />
<strong>in</strong>verse lifetime, γ, is small compared to the resonance frequency, ω o . This<br />
assumption is <strong>of</strong>ten valid, for example <strong>in</strong> the case <strong>of</strong> electronic excitations<br />
<strong>of</strong> a s<strong>in</strong>gle atom and vibrational transitions <strong>of</strong> molecules and <strong>solids</strong>. In the<br />
Lorentz oscillator model the dielectric function has the follow<strong>in</strong>g form:<br />
ε(ω) = ε ∞ +<br />
S<br />
ω 2 o − ω 2 − iωγ , (3.4)<br />
where S is the oscillator strength which is proportional to the matrix element<br />
<strong>of</strong> the correspond<strong>in</strong>g excitation [2], and ε ∞ is the background dielectric<br />
constant due to excitations at higher energies. The dielectric function and<br />
the correspond<strong>in</strong>g reflectivity is plotted <strong>in</strong> Fig. 3.1. The imag<strong>in</strong>ary part <strong>of</strong><br />
the dielectric function has a peak at the resonance frequency, ω o , while the<br />
24
Reflectivity<br />
Dielectric function<br />
1.0<br />
0.8<br />
0.6<br />
0.4<br />
0.2<br />
0.0<br />
300<br />
200<br />
100<br />
0<br />
-100<br />
o<br />
pl<br />
o<br />
=200 cm-1<br />
=4 <strong>in</strong>f<br />
=10 cm -1<br />
S=(800 cm -1 ) 2<br />
pl2 ~ o 2 +S/ <strong>in</strong>f<br />
-1 0123<br />
-2<br />
300 400 500 600 700 800 900<br />
Re( )<br />
Im( )<br />
0 100 200 300 400 500 600 700 800 900 1000<br />
Frequency (cm -1 )<br />
Figure 3.1: The reflectivity (a) and the dielectric function (b) for a damped<br />
resonance (Lorentz oscillator) at frequency ω o . The <strong>in</strong>set <strong>of</strong> the (b) panel<br />
shows the zero cross<strong>in</strong>g <strong>in</strong> the real part <strong>of</strong> the dielectric function def<strong>in</strong><strong>in</strong>g the<br />
plasma frequency, Ω pl .<br />
real part has a dispersive l<strong>in</strong>eshape. The reflectivity has a more complicated<br />
structure. Far from the excitation it is a smooth function be<strong>in</strong>g almost constant.<br />
Around ω o the reflectivity steeply <strong>in</strong>creases, then the sample becomes<br />
highly reflect<strong>in</strong>g between the resonance frequency and the so-called plasma<br />
frequency, Ω pl . The plasma frequency is def<strong>in</strong>ed by the zero cross<strong>in</strong>g <strong>of</strong> the<br />
real part <strong>of</strong> the dielectric function, Ω 2 pl ≈ ω 2 o+S/ε ∞ . Above this frequency<br />
the sample becomes transparent aga<strong>in</strong>.<br />
3.1.2 Dispersive and Fourier transform spectrometers<br />
The photon energy dependence <strong>of</strong> the <strong>optical</strong> response functions, such as<br />
reflectivity and transmission, can be determ<strong>in</strong>ed by various types <strong>of</strong> <strong>optical</strong><br />
spectrometers. The most straightforward way to perform such an experiment<br />
is based on the spectral decomposition <strong>of</strong> the light beam and the<br />
measurement <strong>of</strong> the <strong>optical</strong> quantities at ”each” wavelength [1, 2]. This can<br />
be realized by dispersive elements, like a prism or a diffraction grat<strong>in</strong>g, the<br />
latter <strong>of</strong> which is used <strong>in</strong> modern spectrometers (see Fig. 3.2). In a grat<strong>in</strong>g<br />
spectrometer the slit selects a section from ”the ra<strong>in</strong>bow” produced by the<br />
25
dispersive grat<strong>in</strong>g element. For an <strong>in</strong>f<strong>in</strong>itely large grat<strong>in</strong>g the spectral resolution,<br />
δω, becomes f<strong>in</strong>er with decreas<strong>in</strong>g the width <strong>of</strong> the slit. Therefore,<br />
an optimal balance needs to be found between the outgo<strong>in</strong>g light <strong>in</strong>tensity<br />
and the resolution. In reality, the highest resolution is also limited by the<br />
width <strong>of</strong> the diffraction peak ow<strong>in</strong>g to the f<strong>in</strong>ite size <strong>of</strong> the grat<strong>in</strong>g. Grat<strong>in</strong>g<br />
spectrometers are used <strong>in</strong> a wide energy region from ultraviolet (UV) and<br />
visible (VIS) to near <strong>in</strong>frared (NIR), where high <strong>in</strong>tensity light sources are<br />
available.<br />
Grat<strong>in</strong>g<br />
Source<br />
Reflected light<br />
Diffracted light<br />
Slit<br />
Figure 3.2: Schematic picture <strong>of</strong> a grat<strong>in</strong>g spectrometer.<br />
However, deeper <strong>in</strong> the <strong>in</strong>frared region the black body radiation light<br />
sources are not bright enough, thus, the operation <strong>of</strong> the so-called Fourier<br />
transform <strong>in</strong>frared (FT-IR) spectrometers cover<strong>in</strong>g this region is based on<br />
different pr<strong>in</strong>ciples [1, 2]. The major idea is the application <strong>of</strong> the Wiener-<br />
Kh<strong>in</strong>tch<strong>in</strong> theorem, which states that the spectral function, S(ω), is the<br />
Fourier transform <strong>of</strong> the autocorrelation function:<br />
∫<br />
S(ω) = ⟨E ∗ (t)E(t + τ)⟩e iωτ dτ. (3.5)<br />
The autocorrelation function is measured by a Michelson <strong>in</strong>terferometer,<br />
which splits the light com<strong>in</strong>g from the source by a beamsplitter and the<br />
time difference, τ, between the two parts <strong>of</strong> the beam is varied by a mov<strong>in</strong>g<br />
mirror (see Fig. 3.3). The <strong>in</strong>tensity on the detector as a function <strong>of</strong> the position<br />
<strong>of</strong> the mov<strong>in</strong>g mirror is the autocorrelation function, which is termed<br />
as the <strong>in</strong>terferogram <strong>in</strong> the literature.<br />
Now, let us follow the light propagation and the signal process<strong>in</strong>g <strong>in</strong><br />
details. The light beam from the source with a spectrum <strong>of</strong> E ω passes through<br />
a Michelson <strong>in</strong>terferometer and reaches the detector where the amplitude <strong>of</strong><br />
the electric field is:<br />
∫<br />
E D =<br />
( E ω<br />
2 + E ω ω<br />
2 ei c 2x −iωt dω<br />
)e<br />
2π , (3.6)<br />
26
Stand<strong>in</strong>g mirror<br />
BS<br />
x<br />
Mov<strong>in</strong>g mirror<br />
Source<br />
Figure 3.3: A Michelson <strong>in</strong>terferometer is used for measur<strong>in</strong>g the autocorrelation<br />
function <strong>of</strong> the light beam <strong>in</strong> Fourier transform <strong>in</strong>frared spectrometers.<br />
BS - beamsplitter<br />
where x is the position <strong>of</strong> the mov<strong>in</strong>g mirror. In the previous expression we<br />
assumed that the beamsplitter divides the <strong>in</strong>tensity equally. The detector<br />
can not follow the high frequency oscillation <strong>of</strong> the light, hence, it measures<br />
the time averaged <strong>in</strong>tensity:<br />
I D = 1 √<br />
εo<br />
⟨E<br />
2 µ<br />
DE ∗ D ⟩. (3.7)<br />
o<br />
Accord<strong>in</strong>g to Eq. 3.6 and 3.7, the <strong>in</strong>terferogram has the follow<strong>in</strong>g functional<br />
form:<br />
I D (x) ≃ 1 √ ∫<br />
εo 1<br />
|E ω | 2 cos( ω 2 µ o 2<br />
c 2x)dω 2π , (3.8)<br />
where a constant term (giv<strong>in</strong>g rise to a peak at zero energy after the Fourier<br />
transformation) is neglected. F<strong>in</strong>ally, the spectrum is calculated from the<br />
measured <strong>in</strong>terferogram, I D (x), by an <strong>in</strong>verse Fourier transformation.<br />
Ideally, the resolution <strong>of</strong> an FT-IR spectrometer is determ<strong>in</strong>ed by the<br />
maximum path difference, L, between the two arms <strong>of</strong> the <strong>in</strong>terferometer. If<br />
the source is monochromatic, i.e.<br />
E(t) = E o cos(ω o t), (3.9)<br />
then the spectrum consists <strong>of</strong> two delta functions at ω=±ω o . However, the<br />
spatial cut-<strong>of</strong>f at L <strong>in</strong> the <strong>in</strong>verse Fourier transformation results <strong>in</strong> a s<strong>in</strong>(x)/x-<br />
27
like spectrum:<br />
√<br />
εo<br />
I D (K) = 1 ∫ L/2 ∫<br />
1 1<br />
2 µ o −L/2 2 4 (δ(ω − ω o) + δ(ω + ω o )) cos( ω dω<br />
2x)eiKx<br />
c 2π dx =<br />
= 1 √ (<br />
εo L s<strong>in</strong>[(2ωo − Kc) L ] 2c<br />
+ s<strong>in</strong>[(2ω o + Kc) L ]<br />
)<br />
2c<br />
. (3.10)<br />
2 µ o 32π (2ω o − Kc) L (2ω<br />
2c<br />
o + Kc) L 2c<br />
The full width at half maximum (FWHM), which determ<strong>in</strong>es the resolution,<br />
is <strong>in</strong>versely proportional to the maximal displacement <strong>of</strong> the mirror accord<strong>in</strong>g<br />
to<br />
δω ≈ 3.79 c L . (3.11)<br />
The zero cross<strong>in</strong>gs caused by the s<strong>in</strong>(x)/x function can be elim<strong>in</strong>ated us<strong>in</strong>g<br />
smooth w<strong>in</strong>dow functions for the cut-<strong>of</strong>f. Such an apodization process<br />
somewhat modifies the numerical prefactor <strong>in</strong> Eq. 3.11 as well.<br />
The highest energy <strong>in</strong> the spectrum is limited by the sampl<strong>in</strong>g <strong>in</strong>terval <strong>of</strong><br />
the <strong>in</strong>terferogram as it is measured only at discrete positions. The position<br />
<strong>of</strong> the mov<strong>in</strong>g mirror is determ<strong>in</strong>ed by the <strong>in</strong>terference pattern <strong>of</strong> a He-Ne<br />
LASER <strong>in</strong> the same <strong>in</strong>terferometer, which triggers the sampl<strong>in</strong>g, result<strong>in</strong>g <strong>in</strong><br />
a few hundred nanometer spatial resolution, ∆ ∼100-300 nm. Therefore, the<br />
highest <strong>optical</strong> frequency measurable by the spectrometer is ω max ∼ c ∆ .<br />
Compared to grat<strong>in</strong>g spectrometers, FT-IR spectrometers have the advantage<br />
that the whole light <strong>in</strong>tensity contributes to the experiment at the<br />
same time. Therefore, this method is advantageous <strong>in</strong> the middle and far <strong>in</strong>frared<br />
(MIR & FIR, respectively) region, where the brightness <strong>of</strong> the sources<br />
is small.<br />
3.1.3 Measurement <strong>of</strong> reflectivity<br />
In our experiments, rang<strong>in</strong>g from the far <strong>in</strong>frared up to the ultraviolet region<br />
normal <strong>in</strong>cidence reflectivity spectra were measured and determ<strong>in</strong>ed as the<br />
<strong>in</strong>tensity ratio for the light reflected by the sample, I sm , and a reference<br />
mirror, I ref (the latter <strong>of</strong> which has a reflectivity close to unity):<br />
R(ω) = I sm(ω)<br />
I ref (ω) . (3.12)<br />
As a reference, highly conduct<strong>in</strong>g metallic mirrors are used, like gold, silver<br />
and alum<strong>in</strong>ium [1]. The nobel materials have the advantage that the surface<br />
<strong>of</strong> the evaporated mirror is stable for a long time at air atmosphere and is<br />
not corroded.<br />
28
When the roughness <strong>of</strong> the sample surface is comparable to the wavelength<br />
<strong>of</strong> the prob<strong>in</strong>g light, undesirable scatter<strong>in</strong>g <strong>of</strong> the light occurs. This<br />
artificially suppresses the normal <strong>in</strong>cidence reflectivity. Usually, f<strong>in</strong>e powders<br />
<strong>of</strong> diamond or sapphire are used to polish the sample surface and improve its<br />
quality. As a start<strong>in</strong>g po<strong>in</strong>t, particles with the average diameter <strong>of</strong> d∼3 µm<br />
are used and when the surface roughness decreases polish<strong>in</strong>g is cont<strong>in</strong>ued<br />
with f<strong>in</strong>er powders. Eventually, a roughness <strong>of</strong> ∼100 nm can be achieved by<br />
this technique.<br />
3.2 Broadband <strong>magneto</strong>-<strong>optical</strong> Kerr spectroscopy<br />
Besides the measurement <strong>of</strong> the reflectivity or the absorption coefficient,<br />
changes <strong>in</strong> the polarization state <strong>of</strong> the light carry additional <strong>in</strong>formation<br />
about the system provided it has <strong>optical</strong> anisotropy, such as <strong>magneto</strong>-<strong>optical</strong><br />
activity. In the case <strong>of</strong> magnetic materials, the non-vanish<strong>in</strong>g <strong>of</strong>f-diagonal<br />
elements <strong>of</strong> the <strong>optical</strong> conductivity tensor can be obta<strong>in</strong>ed from the measurement<br />
<strong>of</strong> the Kerr-rotation, θ Kerr , and ellipticity, η Kerr , as described <strong>in</strong><br />
Chapter 2 [4].<br />
In our experiments these Kerr-parameters were measured by a polarization<br />
modulation technique [5, 6], which enables the detection <strong>of</strong> the polarization<br />
rotation with an accuracy <strong>of</strong> 10 −3 degree. Such high sensitivity can be<br />
achieved by the application <strong>of</strong> a photoelastic modulator (PEM). The heart<br />
<strong>of</strong> the PEM is an isotropic, transparent material, which becomes birefr<strong>in</strong>gent<br />
due to the uniaxial stress applied by a piezoelectric crystal. This setup<br />
modulates the polarization state at a high frequency (f=50 kHz). S<strong>in</strong>ce the<br />
velocity <strong>of</strong> the light becomes different for the polarization parallel and perpendicular<br />
to the direction <strong>of</strong> the stress, a phase shift oscillat<strong>in</strong>g <strong>in</strong> time,<br />
δ(t)=δ o s<strong>in</strong>(2πft), appears between the two l<strong>in</strong>early polarized states. If the<br />
<strong>in</strong>cident light beam is polarized at 45 ◦ with respect to the direction <strong>of</strong> the<br />
stress and the amplitude <strong>of</strong> the retardation is set to δ o =π/2, the polarization<br />
state <strong>of</strong> the transmitted light alternates between right handed, l<strong>in</strong>ear and left<br />
handed circular polarization (see Fig. 3.4).<br />
Schematic picture <strong>of</strong> the experimental setup is shown <strong>in</strong> Fig. 3.5. The<br />
phase <strong>of</strong> the horizontal component <strong>of</strong> the electric field is modulated by the<br />
PEM. If a sample with f<strong>in</strong>ite Kerr rotation but with zero ellipticity is <strong>in</strong>serted<br />
<strong>in</strong>to the light path, the polarization is rotated and after the sample the<br />
vertical field component becomes partially phase modulated. Therefore, the<br />
detector beh<strong>in</strong>d the vertical analyzer picks up a time dependent signal. The<br />
29
Figure 3.4: (a) Modulation <strong>of</strong> the polarization after pass<strong>in</strong>g trough the photoelastic<br />
modulator (PEM). Initially the light is polarized at 45 ◦ with respect<br />
to the direction <strong>of</strong> the stress aroused <strong>in</strong> the modulator. As the phase difference<br />
between the parallel and the perpendicular component <strong>of</strong> the polarization<br />
changes, the polarization state <strong>of</strong> the beam alternates between l<strong>in</strong>ear, elliptical<br />
and fully circular polarization. Beh<strong>in</strong>d an analyzer parallel or perpendicular<br />
to the stress direction – without any circularly dichrois or birefr<strong>in</strong>gent elements<br />
<strong>in</strong> the light path – the <strong>in</strong>tensity rema<strong>in</strong>s constant. (b)-(c) If the sample<br />
only rotates the polarization <strong>of</strong> the light, it <strong>in</strong>duces a signal with double frequency<br />
(2f) on the detector, whereas a first harmonic signal (1f) is generated<br />
if circular dichroism is present [5].<br />
frequency <strong>of</strong> this signal is twice the modulation frequency, s<strong>in</strong>ce the <strong>in</strong>tensity<br />
<strong>of</strong> the two circularly polarized states is <strong>in</strong>sensitive to the polarization rotation<br />
(see Fig. 3.4). In contrast, if the ellipticity is not zero, the absorption <strong>of</strong> the<br />
circularly polarized states is different, thus, ellipticity corresponds to the<br />
fundamental harmonic (f=50 kHz) <strong>of</strong> the <strong>in</strong>tensity.<br />
The evolution <strong>of</strong> the polarization state along the <strong>optical</strong> path can be<br />
followed more rigorously as shown <strong>in</strong> Fig. 3.5 accord<strong>in</strong>g to which the propagation<br />
<strong>of</strong> the electric field vector to the analyzer positioned to an angle ϕ –<br />
30
Source<br />
A<br />
0 o P<br />
45 o<br />
PEM<br />
Sample<br />
Figure 3.5: Schematic picture <strong>of</strong> the polarization modulation setup used for<br />
the high-sensitivity detection <strong>of</strong> the complex Kerr angles. P - polarizer, PEM<br />
- photoelastic modulator, A - analyzer<br />
that is the magnitude <strong>of</strong> the detected field – can be calculated as [5]:<br />
E D = [ cos ϕ s<strong>in</strong> ϕ ] [ ] [ ] [ ] [ ] [ ]<br />
1 1 1 r+ 0 1 1 −i 1 0 E√2 1 √2 √2<br />
i −i 0 r − 1 i 0 e iδ(t) .<br />
1<br />
(3.13)<br />
The light beam is polarized at the angle <strong>of</strong> 45 ◦ after pass<strong>in</strong>g trough the first<br />
polarizer. Then, a time dependent phase shift, δ(t), is generated by the PEM<br />
between the two l<strong>in</strong>early polarized components <strong>of</strong> light (parallel and perpendicular<br />
to the direction <strong>of</strong> the stress). If the sample shows circular dichroism<br />
and birefr<strong>in</strong>gence, the reflection matrix is diagonal <strong>in</strong> the basis <strong>of</strong> the circular<br />
polarizations and r ± =|r ± |e iϕ ±<br />
are the complex reflection amplitudes for the<br />
two circularly polarized states. F<strong>in</strong>ally, the light beam passes trough an analyzer<br />
set to the angle ϕ then it reaches the detector. The <strong>in</strong>tensity measured<br />
by the detector is<br />
I D = 1 2<br />
√<br />
εo<br />
εE 2 R<br />
µ o 4<br />
{1 + 2η Kerr s<strong>in</strong> δ(t) + s<strong>in</strong>(2θ Kerr + 2ϕ) cos δ(t)}, (3.14)<br />
where R= 1 2 (|r|2 ++|r| 2 −) is the average reflectivity. If the <strong>magneto</strong>-<strong>optical</strong> Kerr<br />
effect is small, the Kerr rotation and ellipticity are related to the complex<br />
reflection amplitude for circularly polarized light by the follow<strong>in</strong>g formula<br />
[5]:<br />
θ Kerr + iη Kerr ≈ − ϕ + − ϕ −<br />
2<br />
+ i 1 |r + | 2 − |r − | 2<br />
2 |r + | 2 + |r − | . (3.15)<br />
2<br />
The s<strong>in</strong>usoidal modulation <strong>of</strong> the phase shift <strong>in</strong> the argument <strong>of</strong> the trigonometric<br />
functions can be expanded <strong>in</strong> terms <strong>of</strong> the Bessel functions accord<strong>in</strong>g<br />
to<br />
s<strong>in</strong>(δ o s<strong>in</strong>2πft) = 2J 1 (δ o )s<strong>in</strong>2πft + . . . ,<br />
cos(δ o s<strong>in</strong>2πft) = J o (δ o ) + 2J 2 (δ o )s<strong>in</strong>4πft + . . . (3.16)<br />
31
The Kerr parameters can be expressed as functions <strong>of</strong> the dc component,<br />
the first harmonic and the second harmonic <strong>in</strong> the <strong>in</strong>tensity, I o , I f and I 2f ,<br />
respectively:<br />
I f<br />
J 1 (δ o )∆R/R<br />
= A<br />
I o 1 + J o (δ o )s<strong>in</strong>(2θ Kerr + 2ϕ) ≈ 4AJ 1(δ o )η Kerr ,<br />
I 2f<br />
= B 2J 2(δ o )s<strong>in</strong>(2θ Kerr + 2ϕ)<br />
I o 1 + J o (δ o )s<strong>in</strong>(2θ Kerr + 2ϕ) ≈ 4BJ 2(δ o )[θ Kerr + ϕ], (3.17)<br />
where A and B coefficients describe the sensitivity <strong>of</strong> the pre-amplifiers, and<br />
the Lock-<strong>in</strong> amplifiers. S<strong>in</strong>ce the Kerr angles are usually small, the expressions<br />
<strong>in</strong> Eq. 3.17 are well approximated by the l<strong>in</strong>ear terms.<br />
A calibration procedure is performed <strong>in</strong> order to determ<strong>in</strong>e the 4AJ 1 (δ o ),<br />
4BJ 2 (δ o ) coefficients connect<strong>in</strong>g the measured <strong>in</strong>tensity ratios and the Kerr<br />
angles <strong>in</strong> Eq. 3.17. The calibration <strong>of</strong> the Kerr rotation is straightforward,<br />
s<strong>in</strong>ce the rotation <strong>of</strong> the analyzer plays the same role as the Kerr rotation <strong>of</strong><br />
the sample. Therefore, if the analyzer is rotated by a small angle, ±ϕ o , the<br />
correspond<strong>in</strong>g coefficient can be determ<strong>in</strong>ed from the measurement <strong>of</strong> the<br />
second harmonic signal as follows:<br />
([I 2f /I o ] +ϕo − [I 2f /I o ] −ϕo )/2ϕ o = 4BJ 2 (δ o ). (3.18)<br />
For the calibration <strong>of</strong> the Kerr ellipticity a λ/4 plate has to be <strong>in</strong>serted<br />
between the PEM and the analyzer [6]. This <strong>in</strong>troduces an additional π/2<br />
(time <strong>in</strong>dependent) term <strong>in</strong> the retardation and the <strong>in</strong>tensity measured by<br />
the detector changes to:<br />
I D = 1 2<br />
√<br />
εo<br />
εE 2 R<br />
µ o 4<br />
{1 − 2η Kerr cos δ(t) + s<strong>in</strong>(2θ Kerr + 2ϕ) s<strong>in</strong> δ(t)}. (3.19)<br />
Now the angle <strong>of</strong> the analyzer, ϕ, is <strong>in</strong> the argument <strong>of</strong> a s<strong>in</strong>e function,<br />
therefore, the first harmonic signal can also be calibrated by the rotation <strong>of</strong><br />
the analyzer:<br />
([I f /I o ] +ϕo − [I f /I o ] −ϕo )/2ϕ o = 4AJ 1 (δ o ). (3.20)<br />
The light path may conta<strong>in</strong> birefr<strong>in</strong>gent elements, which also cause an ellipticity<br />
and rotation <strong>of</strong> the polarization. However, only the <strong>magneto</strong>-<strong>optical</strong><br />
Kerr angles change sign when the external magnetic field (and the magnetization<br />
<strong>of</strong> the sample) is reversed. Therefore, after measur<strong>in</strong>g the complex<br />
Kerr rotation <strong>in</strong> positive and negative fields the antisymmetric part <strong>of</strong> the<br />
signal is taken.<br />
In the NIR, VIS and UV region the method described above can be simply<br />
implemented, s<strong>in</strong>ce the <strong>magneto</strong>-<strong>optical</strong> response is measured at one time at<br />
32
one wavelength selected by the grat<strong>in</strong>g spectrometer. The retardation <strong>of</strong> the<br />
PEM is kept constant by a control unit as the wavelength <strong>of</strong> the light beam<br />
varies.<br />
In order to adapt polarization modulation spectroscopy to an FT-IR spectrometer,<br />
three different <strong>in</strong>terferograms – I o , I f and I 2f correspond<strong>in</strong>g to the<br />
dc term, the first and the second harmonic – need to be collected simultaneously.<br />
After perform<strong>in</strong>g the numerical Fourier transformation on the three<br />
signals, Kerr parameters can be calculated as discussed above. S<strong>in</strong>ce <strong>in</strong> FT-<br />
IR spectroscopy the spectral <strong>in</strong>formation is collected <strong>in</strong> a parallel manner,<br />
the retardation <strong>of</strong> the PEM cannot be optimized for each wavelength. Instead<br />
the retardation is set to a specific wavelength, which provides optimal<br />
sensitivity for the entire energy region. Furthermore, the lower efficiency <strong>of</strong><br />
the polarizers <strong>in</strong> this energy range results <strong>in</strong> a worse signal-to-noise ratio.<br />
Figure 3.6: The electronic block diagram <strong>of</strong> the the FT-IR MOKE setup and<br />
the characteristic time scales <strong>of</strong> the <strong>in</strong>struments.<br />
As another source <strong>of</strong> technical difficulties, the different time scales <strong>in</strong> the<br />
experimental method have to be compromised. The fastest element is the<br />
detector and its I-V converter, whose high frequency cut-<strong>of</strong>f is set to pass the<br />
2f component, but elim<strong>in</strong>ate the higher frequency components <strong>of</strong> the electrical<br />
signal. The <strong>in</strong>tegration time <strong>of</strong> the Lock-<strong>in</strong> amplifiers, detect<strong>in</strong>g the I f and<br />
I 2f components, needs to be set as high as possible to decrease the bandwidth<br />
<strong>of</strong> the noise. On the other hand, the mov<strong>in</strong>g mirror <strong>of</strong> the <strong>in</strong>terferometer has<br />
f<strong>in</strong>ite speed and the sampl<strong>in</strong>g frequency gives a constra<strong>in</strong>t to the <strong>in</strong>tegration<br />
time <strong>of</strong> the Lock-<strong>in</strong> amplifiers. The scheme <strong>of</strong> the experiment together with<br />
the appropriate time scales are presented <strong>in</strong> Fig. 3.6. Besides the filter<strong>in</strong>g by<br />
lock-<strong>in</strong> amplifiers the noise <strong>in</strong> the I f , I 2f <strong>in</strong>terferograms can be reduced by<br />
averag<strong>in</strong>g several scans.<br />
33
34<br />
Figure 3.7: The picture <strong>of</strong> the broadband <strong>magneto</strong>-<strong>optical</strong> spectrometer. The light path <strong>of</strong> the grat<strong>in</strong>g and the FT-IR<br />
spectrometer is marked by green and yellow l<strong>in</strong>es respectively, while the common part is <strong>in</strong>dicated by red.
We have constructed a broadband <strong>magneto</strong>-<strong>optical</strong> spectrometer operat<strong>in</strong>g<br />
<strong>in</strong> the E=0.08-4 eV region. The top view <strong>of</strong> the setup is shown <strong>in</strong> Fig. 3.7,<br />
where a grat<strong>in</strong>g and an FT-IR spectrometer share a common light path.<br />
In case <strong>of</strong> low-temperature experiments the samples are placed <strong>in</strong>to an<br />
<strong>optical</strong> cryostat and cooled down by a cont<strong>in</strong>uous flow <strong>of</strong> liquid helium. The<br />
light is coupled <strong>in</strong>to the sample chamber through a transparent w<strong>in</strong>dow.<br />
Magnetic fields <strong>of</strong> the order <strong>of</strong> 0.2-0.4 T are generated by NdFeB permanent<br />
magnets. In order to avoid the Faraday rotation from the w<strong>in</strong>dow due to<br />
stray magnetic fields, the Kerr rotation <strong>of</strong> the sample was measured with<br />
and without the <strong>optical</strong> w<strong>in</strong>dow at room temperature.<br />
3.3 Terahertz time-doma<strong>in</strong> spectroscopy<br />
Optical spectroscopy <strong>in</strong> the terahertz (THz) frequency region, which is located<br />
between the far <strong>in</strong>frared and the microwave range (ν=100 GHz-10 THz)<br />
shows rapid development due to the recent improvements <strong>in</strong> photonics and<br />
electronics [7]. The frequency ν=1 THz corresponds to the time period <strong>of</strong><br />
1/ν=1 ps and the wavelength <strong>of</strong> λ=300 µm. Promis<strong>in</strong>g applications <strong>of</strong> terahertz<br />
radiation have been reported over a wide area rang<strong>in</strong>g from telecommunication<br />
to <strong>optical</strong> sens<strong>in</strong>g and imag<strong>in</strong>g [7]. This rapidly grow<strong>in</strong>g field led to<br />
the development <strong>of</strong> terahertz time-doma<strong>in</strong> spectroscopy (THz-TDS) [7, 8, 9].<br />
Besides the spectroscopy <strong>of</strong> organic materials, like DNA, prote<strong>in</strong>s or drugs,<br />
THz-TDS is advantageous <strong>in</strong> the <strong>in</strong>vestigation <strong>of</strong> low-energy excitations <strong>of</strong><br />
<strong>solids</strong>, e.g. charge fluctuations <strong>of</strong> superconductors, ferroelectric s<strong>of</strong>t modes<br />
and sp<strong>in</strong> excitations <strong>in</strong> anisotropic magnets [2, 8].<br />
The terahertz time-doma<strong>in</strong> spectrometer used <strong>in</strong> our experiments is shown<br />
<strong>in</strong> Fig. 3.8. This spectrometer is constructed by Dr. N. Kida at the University<br />
<strong>of</strong> Tokyo [10]. The ultra short pulse, τ≈100 fs, <strong>of</strong> a Ti:sapphire LASER<br />
operat<strong>in</strong>g at λ≈800 nm is used to generate terahertz radiation <strong>in</strong> the follow<strong>in</strong>g<br />
way. The light <strong>of</strong> the LASER is focused on the ∼30 µm thick slit <strong>of</strong> a<br />
dipole antenna evaporated on a GaAs substrate, which was grown at low<br />
temperature (LT-GaAs). The charge carriers, <strong>in</strong>stantaneously excited by the<br />
<strong>in</strong>tense electric field <strong>of</strong> the light, propagate due to the voltage applied between<br />
the electrodes <strong>of</strong> the antenna. S<strong>in</strong>ce the carrier lifetime is small (
WG Polarizer<br />
Off-axis<br />
Paraboloidal Mirror<br />
Superconduct<strong>in</strong>g<br />
Magnet<br />
Magnetic Field<br />
Sample<br />
LT-GaAs<br />
Antenna<br />
Lens<br />
LT-GaAs<br />
Antenna<br />
Time Delay<br />
Chopper<br />
Mode-locked<br />
Ti:sapphire Laser<br />
BS<br />
Ref. 2 kHz<br />
Lock-<strong>in</strong> Amp.<br />
Figure 3.8: Terahertz time-doma<strong>in</strong> spectrometer [10]. The <strong>in</strong>tense light <strong>of</strong><br />
a femtosecond Ti:sapphire LASER is split <strong>in</strong>to two by a beamsplitter (BS).<br />
One <strong>of</strong> the beams is focused on the slit <strong>of</strong> a biased photoconductive antenna<br />
evaporated on a low-temperature-grown GaAs substrate, which emits the THz<br />
radiation. The polarization <strong>of</strong> the THz light is set by a free-stand<strong>in</strong>g wire grid<br />
(WG) polarizer. After the radiation is transmitted through the sample and a<br />
second WG polarizer, it is focused on the receiver photoconductive antenna.<br />
The receiver is active only <strong>in</strong> those short periods when exposed to the LASER<br />
pulse and a current signal is generated <strong>in</strong> proportion to the electric field <strong>of</strong><br />
the THz radiation.<br />
<strong>of</strong> the carrier concentration, n:<br />
E T Hz ∝ ∂j<br />
∂t ∝ ∂n<br />
∂t . (3.21)<br />
In spite <strong>of</strong> the fast recomb<strong>in</strong>ation <strong>of</strong> the photo<strong>in</strong>duced carriers, the mobility<br />
is high whith the correspond<strong>in</strong>g scatter<strong>in</strong>g time <strong>of</strong> τ scat ≈10 µs [8]. The<br />
simulation <strong>of</strong> Duvillaret et. al demonstrate the time dependence <strong>of</strong> the current<br />
density and the electric field <strong>of</strong> the generated THz radiation <strong>in</strong> the far field <strong>in</strong><br />
a common geometry (see Fig. 3.9) [11]. Please note, that the narrow peak <strong>in</strong><br />
the excitation pulse generates a step-like <strong>in</strong>crease <strong>of</strong> the carrier concentration,<br />
s<strong>in</strong>ce the recomb<strong>in</strong>ation lifetime is usually much longer than the time scale<br />
<strong>of</strong> the excitation.<br />
For the detection <strong>of</strong> the THz radiation the light <strong>of</strong> the Ti:sapphire LASER<br />
is split by a beamsplitter (see the beamsplitter (BS) <strong>in</strong> Fig. 3.8). As a receiver<br />
36
Figure 3.9: The time evolution <strong>of</strong> the photocurrent generated by the <strong>in</strong>tense<br />
light <strong>of</strong> a femtosecond LASER <strong>in</strong> a biased photoconductive antenna. The<br />
= 30 = 500 = 80<br />
electric field <strong>of</strong> the THz light follows the time derivative <strong>of</strong> the current [11].<br />
a fast <strong>optical</strong> element is used, triggered by a short pulse. S<strong>in</strong>ce the same<br />
pulse triggers the emission <strong>of</strong> the THz radiation, the time evolution <strong>of</strong> the<br />
THz light can be followed by chang<strong>in</strong>g the time delay between the emitter<br />
and the receiver. These techniques are allow the direct measurement <strong>of</strong> the<br />
electric field <strong>of</strong> the light <strong>in</strong> contrast to the usual spectroscopic method, which<br />
is only able to detect its <strong>in</strong>tensity.<br />
In our setup, shown <strong>in</strong> Fig. 3.8, the THz signal is detected by an antenna,<br />
similar to the one used as the emitter. The receiver antenna is exposed to<br />
the light from the same Ti:sapphire LASER follow<strong>in</strong>g a beam splitter and a<br />
translation stage used for time delay. On the receiver side, the photo<strong>in</strong>duced<br />
carriers are accelerated by the electric field <strong>of</strong> the THz radiation and the generated<br />
current is measured [8, 9]. As known from the l<strong>in</strong>ear response theory,<br />
the current density is the convolution <strong>of</strong> the conductivity, which is proportional<br />
to the concentration <strong>of</strong> the photo<strong>in</strong>duced carriers, and the electric field<br />
<strong>of</strong> the THz pulse:<br />
∫<br />
∫<br />
j(t) = σ(t − t ′ )E T Hz (t ′ )dt ′ ∝ n(t − t ′ )E T Hz (t ′ )dt ′ . (3.22)<br />
The function n(t-t ′ ) has a peak structure, similar to the time dependence <strong>of</strong><br />
the charge carrier concentration on the emitter side (see Fig. 3.9). The width<br />
<strong>of</strong> the peak is determ<strong>in</strong>ed by the carrier life time, τ, which causes a broaden<strong>in</strong>g<br />
<strong>in</strong> the time doma<strong>in</strong> and <strong>in</strong>troduces a high energy cut-<strong>of</strong>f ν max ∼1/τ <strong>in</strong><br />
the frequency doma<strong>in</strong>. A typical THz-TDS with photo-conductive antennas<br />
can reach ν max ≈2-3 THz. The time evolution <strong>of</strong> the THz signal is resolved<br />
by chang<strong>in</strong>g the time delay (t-t ′ ) between the LASER beams used for the<br />
37
generation and the detection. The frequency dependence <strong>of</strong> the amplitude<br />
is determ<strong>in</strong>ed by numerical Fourier transformation. Similarly to the FT-IR<br />
spectroscopy, the frequency resolution is def<strong>in</strong>ed by the maximal time delay<br />
and the sampl<strong>in</strong>g with f<strong>in</strong>ite steps <strong>of</strong> the time delay limits the highest<br />
measurable frequency. In our experiments, the largest time retardation was<br />
T≈10 ps correspond<strong>in</strong>g to a resolution <strong>of</strong> δν ≈0.1 THz. The time delay was<br />
changed with ∆t=0.08 ps steps lead<strong>in</strong>g to a ∼10 THz <strong>in</strong>strumental high frequency<br />
cut-<strong>of</strong>f, which far exceeds the highest frequency <strong>of</strong> the emitted THz<br />
radiation. The great advantage <strong>of</strong> THz-TDS is that the electric field <strong>of</strong> the<br />
light is detected <strong>in</strong>stead <strong>of</strong> its <strong>in</strong>tensity. Therefore, a phase sensitive detection<br />
<strong>of</strong> the radiation is possible and there is no need for Kramers-Kronig<br />
transformation to obta<strong>in</strong> the complex <strong>optical</strong> response [7, 9].<br />
Due to the design <strong>of</strong> the photoconductive antenna both the generation<br />
and the detection <strong>of</strong> the THz radiation is strongly polarization dependent.<br />
The free-stand<strong>in</strong>g wire grid polarizers after the emitter and before the receiver<br />
further ensure the direction <strong>of</strong> the l<strong>in</strong>ear polarization.<br />
Alternatively, crystals with <strong>optical</strong> nonl<strong>in</strong>earities can be used to generate<br />
and to detect THz radiation as well [8, 9]. Both methods were used to measure<br />
the <strong>magneto</strong>-chiral spectra and the polarization rotation <strong>of</strong> Ba 2 Co 2 GeO 7 ,<br />
discussed at the end <strong>of</strong> chapter 6. This <strong>optical</strong> setup, developed by Dr. R.<br />
Shimano, is similar to that presented <strong>in</strong> Fig. 3.8 apart from the emitter and<br />
the receiver [12]. As a nonl<strong>in</strong>ear element, 1 mm thick ZnTe crystals were<br />
used. The z<strong>in</strong>c-blend structure <strong>of</strong> ZnTe allows second order nonl<strong>in</strong>ear <strong>effects</strong>,<br />
s<strong>in</strong>ce the po<strong>in</strong>t group 43m lacks <strong>in</strong>version symmetry.<br />
THz radiation is excited by difference frequency generation or <strong>optical</strong> rectification,<br />
which means the follow<strong>in</strong>g process. The emission spectrum <strong>of</strong> the<br />
femtosecond LASER, which conta<strong>in</strong>s the frequencies ν 1 and ν 2 , is a ∆ν=1/τ<br />
broad quasi-cont<strong>in</strong>uum around ν o ≈375 THz. This <strong>in</strong>tense LASER light <strong>in</strong>duces<br />
electric polarization at ν=ν 1 -ν 2 frequency due to the nonl<strong>in</strong>earity <strong>of</strong> the<br />
ZnTe crystal described by the second-order nonl<strong>in</strong>ear susceptibility χ (2) [8]:<br />
P (ν) = ε o χ (2) (ν = ν 1 − ν 2 )E ∗ (ν 1 )E(ν 2 ). (3.23)<br />
If the pulse duration <strong>of</strong> the LASER is much longer than the oscillation period<br />
correspond<strong>in</strong>g to ν o and the dispersion <strong>in</strong> the nonl<strong>in</strong>ear medium is negligible,<br />
the envelope function <strong>of</strong> the LASER pulse determ<strong>in</strong>es the time evolution <strong>of</strong><br />
the THz radiation. In this process the bandwidth <strong>of</strong> the terahertz light is<br />
determ<strong>in</strong>ed by the width <strong>of</strong> the LASER pulse, ν max ∼1/τ. Therefore, THz<br />
time doma<strong>in</strong> spectrometers us<strong>in</strong>g nonl<strong>in</strong>ear media can cover wider energy<br />
range than those operat<strong>in</strong>g with photoconductive antennas, although the<br />
efficiency <strong>of</strong> the emission is higher for the latter [8].<br />
38
Thz radiation<br />
LASER<br />
/4<br />
WP<br />
Balanced<br />
Photodiode<br />
ZnTe<br />
Figure 3.10: Electro-<strong>optical</strong> sampl<strong>in</strong>g <strong>of</strong> the THz radiation based on the application<br />
<strong>of</strong> a non-l<strong>in</strong>ear ZnTe crystal. The polarization <strong>of</strong> the THz and the<br />
LASER light are parallel. The electric field <strong>of</strong> the THz radiation <strong>in</strong>duces l<strong>in</strong>ear<br />
birefr<strong>in</strong>gence <strong>in</strong> ZnTe between the axes at the angle <strong>of</strong> ±45 ◦ with respect<br />
to the <strong>in</strong>cident light polariaztion. The change <strong>in</strong> the polarization state <strong>of</strong> the<br />
LASER is detected by a balanced photodiode bridge. λ/4 - phase plate, WP<br />
- Wollaston prism<br />
The ZnTe crystal can also be used to detect the THz radiation by electro<strong>optical</strong><br />
sampl<strong>in</strong>g [8, 9]. The scheme <strong>of</strong> the detection is sketched <strong>in</strong> Fig. 3.10.<br />
The THz radiation is focused on the (110) surface <strong>of</strong> a ZnTe crystal. Simultaneously,<br />
the Ti:sapphire LASER, whose <strong>in</strong>tensity is set low <strong>in</strong> this case,<br />
probes the <strong>optical</strong> anisotropy <strong>of</strong> the crystal. Both the THz and the LASER<br />
beams are polarized along the [110] direction. The <strong>in</strong>tense THz light <strong>in</strong>duces<br />
birefr<strong>in</strong>gence proportional to the electric field <strong>of</strong> the E T Hz radiation <strong>in</strong> the<br />
z<strong>in</strong>c-blende type ZnTe through the non-l<strong>in</strong>ear susceptibility:<br />
⎡<br />
⎤<br />
ε xx χ (2) E T Hz 0<br />
ε(E T Hz ) = ⎣ χ (2) E T Hz ε xx 0 ⎦ . (3.24)<br />
0 0 ε xx<br />
In this expression the coord<strong>in</strong>ate axes are aligned along the [110], [001] and<br />
[110] axes <strong>of</strong> the crystal, respectively. The polarization <strong>of</strong> the light is ma<strong>in</strong>ta<strong>in</strong>ed<br />
when it po<strong>in</strong>ts towards the [1/ √ 2,-1/ √ 2,1] or the [1/ √ 2,-1/ √ 2,-1]<br />
direction, be<strong>in</strong>g the eigenvectors <strong>of</strong> the dielectric tensor, ε(E T Hz ). These<br />
directions lie with<strong>in</strong> the (110) surface and they are at an angle <strong>of</strong> 45 ◦ <strong>in</strong><br />
respect to [110] and [001]. The correspond<strong>in</strong>g refractive <strong>in</strong>dices can be calculated<br />
from the eigenvalues:<br />
n ± = √ ε xx ± χ (2) E T Hz ≈ √ (<br />
)<br />
ε xx 1 ± χ(2) E T Hz<br />
. (3.25)<br />
2ε xx<br />
The polarization <strong>of</strong> the LASER beam becomes elliptical:<br />
[<br />
] [<br />
1<br />
1<br />
E LASER =<br />
e −i ω χ (2) E T Hz<br />
≈<br />
d<br />
c εxx 1 − i ω c<br />
39<br />
χ (2) E T Hz<br />
ε xx<br />
d<br />
]<br />
, (3.26)
due to the different light velocities <strong>in</strong> the basis <strong>of</strong> the eigenvectors. The ellipticity<br />
<strong>of</strong> the LASER light is converted to polarization rotation by a λ/4<br />
plate. F<strong>in</strong>ally, a Wollaston prism splits the beam <strong>in</strong>to two parts correspond<strong>in</strong>g<br />
to the polarization components and their <strong>in</strong>tensity difference is detected<br />
by a balanced photodiode bridge. The signal appear<strong>in</strong>g on the detector is<br />
proportional to the electric field <strong>of</strong> the terahertz radiation similarly to the<br />
case <strong>of</strong> the photoconductive antenna.<br />
The electro-<strong>optical</strong> sampl<strong>in</strong>g enables the determ<strong>in</strong>ation <strong>of</strong> the complex<br />
transmission matrix, t ij [12]. In order to measure the <strong>of</strong>f-diagonal transmission<br />
coefficient, the polarizer before the receiver is rotated by 90 ◦ , while the<br />
polarizer after the emitter is kept <strong>in</strong>tact. The simultaneous measurement<br />
<strong>of</strong> the parallel and the perpendicular transmission coefficients, t xx and t xy ,<br />
with respect to the polarization <strong>of</strong> the <strong>in</strong>cident THz radiation enables the<br />
simultaneous determ<strong>in</strong>ation <strong>of</strong> the polarization rotation and the ellipticity:<br />
tan θ + i tan η<br />
1 − i tan θ tan η = t xy<br />
t xx<br />
. (3.27)<br />
Y. Ikebe and R. Shimano have demonstrated that as small as 0.5 mrad rotation<br />
can be measured by this method [12].<br />
We have performed THz-TDS <strong>in</strong> transmission geometry. The scheme <strong>of</strong><br />
the data acquisition and evaluation is shown <strong>in</strong> Fig. 3.11. In our experiments<br />
a hole with the diameter <strong>of</strong> d=3 mm on a metallic nontransparent (fully<br />
reflect<strong>in</strong>g) plate was used as a reference. Another hole <strong>of</strong> the same size<br />
drilled on another metal plate was covered by the sample accurately. After<br />
measur<strong>in</strong>g the THz signal <strong>of</strong> the reference as a function <strong>of</strong> the time delay,<br />
E ref∥ (t), the open hole is replaced by the sample and the amplitude <strong>of</strong> the<br />
radiation beh<strong>in</strong>d the sample, E sm∥ (t), was also detected. Numerical Fourier<br />
transformation was performed to calculate the complex spectrum <strong>of</strong> the THz<br />
radiation, E ref∥ (ν) and E sm∥ (ν), respectively. The transmission coefficient<br />
was evaluated as t=E sm∥ /E ref∥ , while the power transmission was calculated<br />
as T=|t| 2 . The complex refractive <strong>in</strong>dex, N=n+ik, was calculated from the<br />
transmission coefficient us<strong>in</strong>g Eq. 3.2. A typical spectra is shown <strong>in</strong> Fig. 3.11.<br />
The sharp dips <strong>in</strong> the power transmission correspond to absorption peaks.<br />
As it is expected from the almost l<strong>in</strong>ear frequency dependence <strong>of</strong> the phase,<br />
the real part <strong>of</strong> the refractive <strong>in</strong>dex is constant except for the vic<strong>in</strong>ity <strong>of</strong><br />
the resonances. The power transmission differs from 1 over the entire range,<br />
which is caused by the reflections from the vacuum-sample <strong>in</strong>terface due to<br />
the high value <strong>of</strong> n≈2.85. To simplify the data evaluation, the reflection<br />
basel<strong>in</strong>e was subtracted from the logarithm <strong>of</strong> the power transmission and<br />
40
Time doma<strong>in</strong><br />
Frequency doma<strong>in</strong><br />
Reference<br />
FFT<br />
Sample<br />
E<br />
sm/Eref<br />
Figure 3.11: Flowchart <strong>of</strong> the data evaluation <strong>in</strong> a terahertz time-doma<strong>in</strong><br />
experiment. As a first step, the electric field <strong>of</strong> the THz radiation is measured<br />
as a function <strong>of</strong> the time delay for the reference hole and the sample<br />
as well. Next, the <strong>in</strong>tensity and the phase spectra are calculated by Fourier<br />
transformation. The complex transmission spectrum is obta<strong>in</strong>ed by the division<br />
<strong>of</strong> the sample spectrum with the reference spectrum. From the complex<br />
transmission other <strong>optical</strong> response functions can be calculated.<br />
the absorption coefficient, α, was calculated as:<br />
α = − 1 (ln T − 2 ln(1 − R)) , (3.28)<br />
d<br />
where d is the thickness <strong>of</strong> the sample and R is the reflectivity <strong>of</strong> the vacuumsample<br />
<strong>in</strong>terface. If the sample rotates the polarization, the <strong>of</strong>f-diagonal<br />
41
transmission coefficient is determ<strong>in</strong>ed as<br />
t xy = E sm⊥<br />
E ref∥<br />
, (3.29)<br />
where E sm⊥ is the spectrum <strong>of</strong> the THz radiation measured between crossed<br />
polarizers. In this case the transmitted power is def<strong>in</strong>ed as T=|t xx | 2 +|t xy | 2 .<br />
42
References<br />
[1] H. Kuzmany, Solid-State Spectroscopy: An Introduction (Spr<strong>in</strong>ger,<br />
Berl<strong>in</strong>, 2009).<br />
[2] M. Dressel and G. Grüner, Electrodynamics <strong>of</strong> <strong>solids</strong>: <strong>optical</strong> properties<br />
<strong>of</strong> electrons <strong>in</strong> matter (Cambridge University Press, Cambridge, 2002).<br />
[3] J. Jackson, Classical electrodynamics (Wiley, New York, 1999).<br />
[4] S. Sugano and N. Kojima, Magneto-optics, Spr<strong>in</strong>ger series <strong>in</strong> solid-state<br />
sciences (Spr<strong>in</strong>ger, Berl<strong>in</strong>, 2000).<br />
[5] K. Sato, Japanese Journal <strong>of</strong> Applied <strong>Physics</strong> 20, 2403 (1981).<br />
[6] K. Sato, H. Hongu, H. Ikekame, Y. Tosaka, M. Watanabe, K. Takanashi,<br />
and H. Fujimori, Japanese Journal <strong>of</strong> Applied <strong>Physics</strong> 32, 989 (1993).<br />
[7] M. Tonouchi, Nature Photonics 1, 97 (2007), ISSN 1749-4885.<br />
[8] K. Sakai, ed., Terahertz Optoelectronics (Spr<strong>in</strong>ger, Berl<strong>in</strong>, 2003).<br />
[9] C. Schmuttenmaer, Chemical Reviews 104, 1759 (2004), ISSN 0009-<br />
2665.<br />
[10] N. Kida, Y. Ikebe, Y. Takahashi, J. P. He, Y. Kaneko, Y. Yamasaki,<br />
R. Shimano, T. Arima, N. Nagaosa, and Y. Tokura, Phys. Rev. B 78,<br />
104414 (2008).<br />
[11] L. Duvillaret, F. Garet, J. Roux, and J. Coutaz, IEEE Journal <strong>of</strong> Seleceted<br />
Topics <strong>in</strong> Quantum Electronics 7, 615 (2001).<br />
[12] Y. Ikebe and R. Shimano, Applied <strong>Physics</strong> Letters 92, 012111 (2008).<br />
43
Chapter 4<br />
Experimental determ<strong>in</strong>ation <strong>of</strong><br />
the sp<strong>in</strong>-polarized electronic<br />
band structure <strong>in</strong> magnetic<br />
metals<br />
Besides the search for novel compounds show<strong>in</strong>g large <strong>magneto</strong>-<strong>optical</strong> effect,<br />
which useful for data storage and telecommunication, the comb<strong>in</strong>ation <strong>of</strong><br />
<strong>optical</strong> and <strong>magneto</strong>-<strong>optical</strong> spectroscopy provides fundamental <strong>in</strong>formation<br />
about the band structure <strong>of</strong> magnetic <strong>solids</strong> [1, 2]. To be more specific,<br />
the simultaneous measurement <strong>of</strong> the diagonal and <strong>of</strong>f-diagonal elements <strong>of</strong><br />
the <strong>optical</strong> conductivity tensor allows the determ<strong>in</strong>ation <strong>of</strong> basic physical<br />
parameters, like crystal field splitt<strong>in</strong>g, Coulomb <strong>in</strong>teraction and sp<strong>in</strong>-orbit<br />
coupl<strong>in</strong>g [1, 2, 3]. Recently, the <strong>magneto</strong>-<strong>optical</strong> spectroscopy and microscopy<br />
have ga<strong>in</strong>ed new potential <strong>in</strong> the tailor<strong>in</strong>g <strong>of</strong> highly sp<strong>in</strong> polarized conductors<br />
and <strong>in</strong> the visualization <strong>of</strong> sp<strong>in</strong> transport motivated by sp<strong>in</strong>tronics [1, 4, 5,<br />
6, 7].<br />
The anomalous Hall effect (AHE), i.e. the Hall effect <strong>in</strong>duced by the<br />
<strong>in</strong>terplay <strong>of</strong> sp<strong>in</strong>-orbit and exchange <strong>in</strong>teraction <strong>in</strong> ferromagnets, and the<br />
<strong>magneto</strong>-<strong>optical</strong> Kerr effect share a common orig<strong>in</strong>. Both <strong>of</strong> them are the<br />
consequence <strong>of</strong> the f<strong>in</strong>ite <strong>of</strong>f-diagonal conductivity, σ xy , <strong>in</strong> the dc limit and<br />
at f<strong>in</strong>ite frequencies, respectively [8, 9]. Although AHE was discovered more<br />
than a century ago, its theoretical description is still a challeng<strong>in</strong>g problem<br />
[10, 8].<br />
In this chapter our <strong>optical</strong> and <strong>magneto</strong>-<strong>optical</strong> results are presented on<br />
the nearly half-metallic CuCr 2 Se 4 and on Nd 2 Mo 2 O 7 with sp<strong>in</strong> chirality. The<br />
measurement <strong>of</strong> the different elements <strong>of</strong> the conductivity tensor over a broad<br />
energy range provides <strong>in</strong>formation about the sp<strong>in</strong>-polarized band structure<br />
44
<strong>of</strong> these compounds, which has been analyzed <strong>in</strong> comparison with theoretical<br />
calculations. F<strong>in</strong>ally, we have also <strong>in</strong>vestigated the low-energy <strong>of</strong>f-diagonal<br />
conductivity <strong>of</strong> the it<strong>in</strong>erant charge carriers <strong>in</strong> order to ga<strong>in</strong> more <strong>in</strong>formation<br />
about the mechanism <strong>of</strong> AHE <strong>in</strong> these systems. In electron and hole<br />
doped Nd 2 Mo 2 O 7 pyrochlore-type molybdates the <strong>magneto</strong>-<strong>optical</strong> spectra<br />
have been compared to the results <strong>of</strong> theoretical model calculations as well.<br />
4.1 Anomalous Hall effect<br />
The lack <strong>of</strong> time-reversal symmetry leads to the Hall effect <strong>in</strong> <strong>solids</strong>, i.e. a<br />
current flow<strong>in</strong>g transversal to the applied electric field. In the presence <strong>of</strong><br />
an external magnetic field, the Hall effect <strong>of</strong> paramagnetic metals orig<strong>in</strong>at<strong>in</strong>g<br />
from the Lorentz force and the Hall resistivity, ρ xy , is <strong>in</strong>versely proportional<br />
to the carrier concentration [11]. In ferromagnets an additional contribution,<br />
the anomalous Hall effect, appears <strong>in</strong> the <strong>of</strong>f-diagonal conductivity [10], which<br />
cannot be described <strong>in</strong> terms <strong>of</strong> the <strong>in</strong>ternal fields <strong>in</strong> ferromagnets [12].<br />
Karplus and Lutt<strong>in</strong>ger came up with the idea that the sp<strong>in</strong>-orbit coupl<strong>in</strong>g,<br />
which has the periodicity <strong>of</strong> the lattice, is responsible for the AHE<br />
[13]. They po<strong>in</strong>ted out the importance <strong>of</strong> the <strong>in</strong>terband matrix elements<br />
<strong>in</strong> the calculation <strong>of</strong> the expectation value <strong>of</strong> the current operator beside<br />
the usual <strong>in</strong>traband term. The anomalous Hall resistivity was found to be<br />
proportional to the square <strong>of</strong> the diagonal resistivity, ρ xy ∝ ρ 2 xx [13]. This<br />
<strong>in</strong>tr<strong>in</strong>sic mechanism <strong>of</strong> the AHE has been recently reformulated <strong>in</strong> terms<br />
<strong>of</strong> the Berry phase, which allows a more general topological explanation <strong>of</strong><br />
the phenomenon [14]. The first pr<strong>in</strong>ciple calculations us<strong>in</strong>g the Berry phase<br />
approach have successfully reproduced the AHE <strong>of</strong> bcc iron [15].<br />
The Berry phase, γ n , is the phase factor ga<strong>in</strong>ed by the |n(X)⟩ electronic<br />
eigenstate <strong>of</strong> the Hamilton operator, H(X), upon the adiabatic evolution <strong>of</strong><br />
a parameter, X, on a closed path C [16]. The Berry phase can be expressed<br />
as:<br />
∮<br />
∫ ∫<br />
γ n = a n (X)dX = b n dS, (4.1)<br />
C<br />
where a n is a fictitious vector potential, the Berry connection, and b n is the<br />
correspond<strong>in</strong>g fictitious magnetic field, the Berry curvature:<br />
a n (X) = −i⟨n(X)|∇ X |n(X)⟩,<br />
b n (X) = Im ∑ m≠n<br />
⟨n(X)|∇ X H(X)|m(X)⟩⟨m(X)|∇ X H(X)|n(X)⟩<br />
(E n (X) − E m (X)) 2 . (4.2)<br />
45
The Berry curvature appears <strong>in</strong> the expression <strong>of</strong> the <strong>of</strong>f-diagonal conductivity<br />
calculated from the Kubo formula [17, 14]:<br />
σ xy = e 2 ∑ n,k<br />
f(ϵ n,k )b nz (k),<br />
b n = ∇ k × a n ,<br />
a n,µ = −i⟨n(k)|∂/∂k µ |n(k)⟩. (4.3)<br />
This result can be <strong>in</strong>terpreted accord<strong>in</strong>g to the semiclassical transport theory,<br />
where the equation <strong>of</strong> motion has the follow<strong>in</strong>g form <strong>in</strong> the presence <strong>of</strong> a f<strong>in</strong>ite<br />
Berry curvature [18, 19]:<br />
ẋ = 1 ∂ϵ n,k<br />
∂k − ˙k × b n,k ,<br />
˙k = −eE − eẋ × B. (4.4)<br />
The electron is accelerated by the external electric field, E, chang<strong>in</strong>g the<br />
k crystal momentum <strong>of</strong> the electron. The motion <strong>of</strong> the electron <strong>in</strong> the k-<br />
space is affected by the Berry curvature act<strong>in</strong>g like an effective magnetic<br />
field <strong>in</strong> the k-space generated by the band structure. The Berry curvature<br />
is enhanced when the gap between two bands is small (see Eq. 4.2). Moreover,<br />
a band cross<strong>in</strong>g po<strong>in</strong>t, which occurs generally at the high symmetry<br />
po<strong>in</strong>ts <strong>of</strong> the Brillou<strong>in</strong> zone, behaves as a δ-s<strong>in</strong>gularity and it has a magnetic<br />
monopole-like contribution to the Berry curvature [20]. Therefore, when the<br />
Fermi energy lies <strong>in</strong> the vic<strong>in</strong>ity <strong>of</strong> a degeneracy <strong>in</strong> the band structure, the<br />
anomalous Hall effect is expected to be very sensitive to the details <strong>of</strong> the<br />
band structure, especially to the exchange-<strong>in</strong>duced splitt<strong>in</strong>g <strong>of</strong> the bands <strong>in</strong><br />
ferromagnets. Correspond<strong>in</strong>gly, the AHE can be a non-monotonous function<br />
<strong>of</strong> the magnetization or the carrier concentration. The sign change and the<br />
unusual temperature dependence <strong>of</strong> the AHE <strong>in</strong> the ferromagnetic phase <strong>of</strong><br />
SrRuO 3 is described as the consequence <strong>of</strong> the Berry curvature enhanced by<br />
such a s<strong>in</strong>gularity <strong>in</strong> the center <strong>of</strong> the Brillou<strong>in</strong> zone, <strong>in</strong> the Γ po<strong>in</strong>t [20].<br />
Accord<strong>in</strong>g to Ohgushi et al. a non-coll<strong>in</strong>ear sp<strong>in</strong> structure can <strong>in</strong>duce<br />
AHE as well [21]. As a simple example for the non-coll<strong>in</strong>ear sp<strong>in</strong> structure,<br />
let us consider localized and canted sp<strong>in</strong>s on a triangle (as shown <strong>in</strong> Fig. 4.1)<br />
and an additional conduction electron [9]. The conduction electron <strong>in</strong>teracts<br />
with the localized sp<strong>in</strong>s via the on-site Hund <strong>in</strong>teraction, which prefers<br />
parallel alignment <strong>of</strong> the sp<strong>in</strong>s. This situation is the start<strong>in</strong>g po<strong>in</strong>t <strong>in</strong> the description<br />
<strong>of</strong> a double-exchange ferromagnet [21]. As the conduction electron<br />
goes around the loop, it experiences a fictitious rotat<strong>in</strong>g magnetic field due<br />
to the <strong>in</strong>teraction with the non-coll<strong>in</strong>ear localized sp<strong>in</strong>s. After complet<strong>in</strong>g a<br />
46
loop, the wave function <strong>of</strong> the electron picks up a Berry phase proportional<br />
to the scalar sp<strong>in</strong> chirality <strong>of</strong> the three neighbor<strong>in</strong>g sp<strong>in</strong>s, S i (i=1-3):<br />
χ 123 = S 1 (S 2 × S 3 ). (4.5)<br />
Figure 4.1: Simple model <strong>of</strong> a chiral ferromagnet. The localized sp<strong>in</strong>s (red<br />
arrows) are canted by the angle <strong>of</strong> θ <strong>in</strong> respect to the axis perpendicular<br />
to the plane (blue arrows). The solid angle expanded by the three sp<strong>in</strong>s is<br />
proportional to their sp<strong>in</strong> chirality [9].<br />
Ohgushi et al. proved that this mechanism generates f<strong>in</strong>ite a Hall effect<br />
on a Kagome lattice, which is a triangular lattice with triangles as basis [21].<br />
The Berry phase aris<strong>in</strong>g from this mechanism leads to a resonant structure<br />
<strong>in</strong> the k-space, which is also responsible for the large AHE <strong>in</strong> Nd 2 Mo 2 O 7 .<br />
Beside the <strong>in</strong>tr<strong>in</strong>sic theory <strong>of</strong> the anomalous Hall effect, several extr<strong>in</strong>sic<br />
mechanisms have been proposed [22]. The potential scatter<strong>in</strong>g <strong>of</strong> an impurity<br />
ion can be sp<strong>in</strong> dependent due to the sp<strong>in</strong>-orbit coupl<strong>in</strong>g on the scatterer and<br />
together with the sp<strong>in</strong> imbalance <strong>in</strong> ferromagnets it may result <strong>in</strong> a f<strong>in</strong>ite<br />
Hall effect. Two types <strong>of</strong> sp<strong>in</strong> dependent scatter<strong>in</strong>g are usually considered:<br />
the skew scatter<strong>in</strong>g and the side jump [22]. In case <strong>of</strong> the skew scatter<strong>in</strong>g,<br />
the path <strong>of</strong> the electron is deflected depend<strong>in</strong>g on the relative orientation<br />
<strong>of</strong> its sp<strong>in</strong> and its wave vector [23], while side jump means the transverse<br />
displacement <strong>of</strong> the trajectories, which has a different sign for the two sp<strong>in</strong><br />
directions [24, 25]. The <strong>of</strong>f-diagonal resistivity scales as ρ xy ∝ ρ xx and ρ xy ∝<br />
ρ 2 xx for the skew scatter<strong>in</strong>g and for the side jump mechanism, respectively.<br />
4.2 Optical and <strong>magneto</strong>-<strong>optical</strong> study <strong>of</strong> the<br />
nearly half-metallic CuCr 2 Se 4<br />
4.2.1 It<strong>in</strong>erant electron magnetism <strong>in</strong> CuCr 2 Se 4<br />
The ferrimagnetic CuCr 2 Se 4 is a metal with a residual resistivity as small<br />
as ρ o ≈10 µΩcm [26, 3]. This compound shows the highest critical tempera-<br />
47
ture T c =430 K among the chromium sp<strong>in</strong>el chalcogenides, and the saturation<br />
value <strong>of</strong> the magnetization reaches M sat =5.5 µ B /f.u. [26, 3]. The cubic sp<strong>in</strong>el<br />
lattice <strong>of</strong> CuCr 2 Se 4 is shown <strong>in</strong> Fig. 5.1 and the details <strong>of</strong> this structure<br />
are discussed <strong>in</strong> the follow<strong>in</strong>g chapter [27]. An important po<strong>in</strong>t concern<strong>in</strong>g<br />
the electronic structure is that the Cu ions occupy sites tetrahedrally<br />
coord<strong>in</strong>ated by selenium, while the Cr ions are located <strong>in</strong> the center <strong>of</strong> Se octahedra.<br />
Although the lattice constant <strong>of</strong> the ferromagnetic semiconductors<br />
CdCr 2 S 4 and CdCr 2 Se 4 differ only by 1-4%, their ferromagnetism is considerably<br />
weakened by the complete fill<strong>in</strong>g <strong>of</strong> the valance band as reflected by<br />
their lower Curie temperatures, T c =85 K and 129 K, respectively [26]. Materials<br />
from the same family show <strong>in</strong>terest<strong>in</strong>g <strong>magneto</strong>-transport phenomena<br />
like the colossal <strong>magneto</strong>resistance <strong>in</strong> Fe 1−x Cu x Cr 2 S 4 [28], and the colossal<br />
<strong>magneto</strong>capacitance <strong>in</strong> CdCr 2 S 4 [29]. Moreover, recent band structure calculations<br />
<strong>in</strong>dicate that CuCr 2 Se 4 is almost half-metallic [30, 31, 32, 33] and<br />
the density <strong>of</strong> states for sp<strong>in</strong> down electrons can be fully suppressed with<br />
cadmium dop<strong>in</strong>g, i.e. a perfect half-metallic situation can be realized [33].<br />
The calculated sp<strong>in</strong> polarized band structure is shown <strong>in</strong> Fig. 4.2 [32]. The<br />
splitt<strong>in</strong>g <strong>of</strong> the d levels <strong>in</strong>to t 2g , e g subspaces for the Cr ions and <strong>in</strong>to e, t 2 for<br />
the Cu cations are due to the local octahedral and tetrahedral crystal fields<br />
from the seleniums, respectively.<br />
The strong ferrimagnetism <strong>in</strong> CuCr 2 Se 4 was first expla<strong>in</strong>ed by Lotger<strong>in</strong>g<br />
and Stapele, assum<strong>in</strong>g a mixed-valence state <strong>of</strong> Cr 3+ and Cr 4+ with the<br />
monovalent Cu + . Thus, this compound was classified as a d-metal with<br />
closed Se 4p shell [34]. In this picture only the chromium sites are magnetic<br />
and the double exchange mechanism between the Cr 3+ and the Cr 4+<br />
ions align their magnetic moment parallel. However, early neutron diffration<br />
studies <strong>in</strong>dicated that each chromium is <strong>in</strong> the Cr 3+ state [27]. Later, Goodenough<br />
proposed the copper ions to be divalent Cu 2+ and as a source <strong>of</strong> the<br />
magnetism the 90 degree superexchange be<strong>in</strong>g responsible for the coupl<strong>in</strong>g<br />
between the Cr 3+ ions through the completely filled Se 4p states [35].<br />
Recent X-ray <strong>magneto</strong>-circular dichroism (XMCD) measurements by Kimura<br />
et al. [36] settled the long stand<strong>in</strong>g issue <strong>of</strong> the valance states <strong>in</strong> CuCr 2 Se 4 .<br />
They have confirmed the Cr 3+ state, however, they have found almost monovalent<br />
copper and a delocalized hole <strong>in</strong> the Se 4p band with a magnetic<br />
moment anti-parallel to the moment <strong>of</strong> the Cr 3+ ions. Based on these experimental<br />
results Saha-Dasgupta et al. [32] have <strong>in</strong>terpreted the ferrimagnetism<br />
<strong>in</strong> terms <strong>of</strong> a k<strong>in</strong>etic energy driven mechanism <strong>in</strong> which the hybridization between<br />
the localized Cr 3+ ions and the delocalized states <strong>in</strong> the Se 4p band<br />
results <strong>in</strong> a hole-mediated exchange. Their density functional calculation<br />
<strong>in</strong>dicates the appearance <strong>of</strong> a hybridization <strong>in</strong>duced hump-like structure at<br />
the Fermi energy only for the up sp<strong>in</strong> states <strong>in</strong> accordance with other band<br />
48
0<br />
0<br />
1<br />
2<br />
3<br />
4<br />
UP<br />
0.5 0.25<br />
Energy (eV)<br />
2<br />
DOS (States/eV)<br />
Cr−e g<br />
Energy (eV)<br />
0<br />
-2<br />
-4<br />
Cr−t 2g<br />
Cu−t 2<br />
Cu−e<br />
S−3p<br />
-6<br />
4<br />
DN<br />
Energy (eV)<br />
2<br />
0<br />
-2<br />
Cr−e g<br />
Cr−t 2g<br />
Cu−t 2<br />
Cu−e<br />
-4<br />
-6<br />
Cu - d<br />
Cr - d<br />
S - p<br />
S−3p<br />
L<br />
Γ<br />
XW L K<br />
Γ<br />
5 10<br />
DOS (States/eV)<br />
Figure 4.2: The calculated sp<strong>in</strong>-polarized band structure <strong>of</strong> CuCr 2 S 4 [32].<br />
Similar results were obta<strong>in</strong>ed for CuCr 2 Se 4 [33].<br />
structure calculations [31, 33] (see Fig. 4.2).<br />
In order to have a deeper understand<strong>in</strong>g <strong>of</strong> the electronic structure <strong>of</strong><br />
CuCr 2 Se 4 and its strong it<strong>in</strong>erant magnetism, we have <strong>in</strong>vestigated the lowenergy<br />
(E=0.1-4 eV) charge excitations over the temperature range <strong>of</strong> T=10-<br />
300 K by determ<strong>in</strong><strong>in</strong>g both the diagonal and the <strong>of</strong>f-diagonal elements <strong>of</strong><br />
the <strong>optical</strong> conductivity tensor. The former <strong>optical</strong> and <strong>magneto</strong>-<strong>optical</strong><br />
studies <strong>of</strong> Brändle et al. focused on the large <strong>magneto</strong>-<strong>optical</strong> Kerr effect <strong>of</strong><br />
CuCr 2 Se 4 , which exceeds θ Kerr ≈1.1 ◦ and η Kerr ≈1.2 ◦ <strong>in</strong> the near <strong>in</strong>frared<br />
photon energy region at room temperature [37, 38], which makes CuCr 2 Se 4 a<br />
promis<strong>in</strong>g candidate for <strong>magneto</strong>-<strong>optical</strong> devices. In the follow<strong>in</strong>g subsection<br />
we analyze the orig<strong>in</strong> <strong>of</strong> the electronic excitations <strong>in</strong> details by the extension<br />
<strong>of</strong> the experiments towards lower energies and low temperatures, the latter<br />
<strong>of</strong> which allows a clearer separation <strong>of</strong> the different spectral structures.<br />
49
4.2.2 Results <strong>of</strong> the <strong>optical</strong> and <strong>magneto</strong>-<strong>optical</strong> studies<br />
on CuCr 2 Se 4<br />
S<strong>in</strong>gle crystals <strong>of</strong> CuCr 2 Se 4 with a typical size <strong>of</strong> 3 × 3 × 0.2 mm 3 were grown<br />
by K. Ohgushi [3]. All the <strong>optical</strong> measurements were carried out with nearly<br />
normal <strong>in</strong>cidence on the as-grown (111) surface. In order to determ<strong>in</strong>e the<br />
diagonal <strong>optical</strong> conductivity, reflectivity spectra were measured over a broad<br />
energy range (E=0.08-26 eV and E=0.08-5 eV at room and low temperature,<br />
respectively) <strong>in</strong> order to facilitate the proper Kramers-Kronig transformation.<br />
We have measured the complex <strong>magneto</strong>-<strong>optical</strong> Kerr angle Φ Kerr = θ Kerr +<br />
iη Kerr between E=0.12-4 eV with the home-designed broadband <strong>magneto</strong><strong>optical</strong><br />
spectrometer <strong>in</strong>troduced <strong>in</strong> Chapter 3. The external magnetic field<br />
<strong>of</strong> B=±0.25 T was applied us<strong>in</strong>g a permanent magnet along the [111] easyaxis<br />
<strong>of</strong> magnetization, which was set parallel to the propagation direction <strong>of</strong><br />
the light as well. In the above arrangement, the conductivity tensor has the<br />
follow<strong>in</strong>g form:<br />
⎡<br />
⎤<br />
σ xx σ xy 0<br />
σ = ⎣ −σ xy σ xx 0 ⎦ . (4.6)<br />
0 0 σ zz<br />
In this notation the x, y, z directions do not correspond to the ma<strong>in</strong> cubic<br />
axes, as z is chosen parallel to the [111] easy-axis.<br />
The temperature dependence <strong>of</strong> the reflectivity and the diagonal <strong>optical</strong><br />
conductivity spectra are shown <strong>in</strong> Fig. 4.3. We identified the different contributions<br />
to the <strong>optical</strong> conductivity as follows. The first charge transfer peak<br />
is centered around E=2.75 eV, which we assign to Se 4p → Cr 3d transitions<br />
<strong>in</strong> agreement with former <strong>optical</strong> and photoemission data on a broad variety<br />
<strong>of</strong> chromium sp<strong>in</strong>el oxides and chalcogenides [3, 39, 40]. This transition<br />
was identified as a Cr <strong>in</strong>tra-atomic 3d 3 →3d 2 4p and 3d 3 →3d 2 4s excitation by<br />
Brändle et al. [38], which seems to be unlikely as the position and the oscillator<br />
strength <strong>of</strong> this transition show a large variation among the different<br />
chromium sp<strong>in</strong>els. Furthermore, the chromium 4p and 4s bands are located<br />
at higher energies <strong>in</strong> these compounds, which also excludes, their assignment<br />
[3]. This transition band has a low-energy shoulder centered at E=1.9 eV,<br />
which is most likely to orig<strong>in</strong>ate from the on-site chromium d-d transition,<br />
s<strong>in</strong>ce this structure is common for chromium sp<strong>in</strong>els <strong>in</strong>sensitive to the replacement<br />
<strong>of</strong> the other cation [3, 39, 40]. This orig<strong>in</strong>ally dipole-forbidden<br />
transition becomes allowed by the hybridization with the ligand, which expla<strong>in</strong>s<br />
the fairly small oscillatory strength. The spectral structures become<br />
dist<strong>in</strong>ct as the temperature decreases. In the low-energy region (E0.1 eV)<br />
metallic conductivity appears. Although it does not closely follow a Drudelike<br />
behaviour – the scatter<strong>in</strong>g rate is estimated to be γ ≈ 0.03 eV at T=10 K<br />
50
– the small residual resistivity ρ o ≈ 10 µΩcm [41, 3] is not typical for bad<br />
metals with strongly correlated d band. Between the low-energy metallic<br />
region and the first charge transfer excitation, a dist<strong>in</strong>ct peak appears at<br />
E=0.5 eV. At low temperatures it becomes clearly dist<strong>in</strong>guishable from the<br />
excitation <strong>of</strong> the it<strong>in</strong>erant carriers. In spite <strong>of</strong> its closeness to the metallic<br />
cont<strong>in</strong>uum it becomes sharp at low temperatures characterized by a width<br />
<strong>of</strong> Γ≈0.5 eV. In the <strong>in</strong>set <strong>of</strong> Fig. 4.3 the maximum <strong>of</strong> the loss-function, (-<br />
Im{1/ε}), signals a plasma frequency <strong>of</strong> Ω pl ≈1 eV, which only <strong>in</strong>creases by<br />
4% as the temperature decreases to T=10 K. This implies only a t<strong>in</strong>y change<br />
<strong>in</strong> the carrier concentration as a function <strong>of</strong> temperature.<br />
Figure 4.3: Upper and lower panel: The reflectivity and the <strong>optical</strong> conductivity<br />
spectra <strong>of</strong> CuCr 2 Se 4 at various temperatures, repectively. Three ma<strong>in</strong><br />
features are <strong>in</strong>dicated by the dashed l<strong>in</strong>es. The first charge transfer excitation<br />
(Se 4p→Cr 3d) appears at E=2.75 eV with a low-energy shoulder at<br />
E=1.9 eV due to the on-site d-d transition <strong>of</strong> the chromium ions. In addition<br />
to the low-energy metallic peak, another strong transition is present <strong>in</strong> the<br />
mid-<strong>in</strong>frared region (at E=0.5 eV) with a characteristic width <strong>of</strong> Γ≈0.5 eV.<br />
In the <strong>in</strong>set the maximum <strong>of</strong> the loss-function, 1/ε, <strong>in</strong>dicates the plasma<br />
frequency at Ω pl ≈1 eV.<br />
The <strong>magneto</strong>-<strong>optical</strong> Kerr spectra are presented <strong>in</strong> Fig. 4.4 at room temperature<br />
and at T=10 K. These results are <strong>in</strong> good agreement with the Kerr<br />
spectra previously reported at room-temperature for E>0.6 eV [37, 38]. The<br />
51
MOKE signal reaches its maximum around E≈1 eV, where the Kerr ellipticity<br />
exhibits a peak, while the Kerr rotation has a dispersive l<strong>in</strong>e shape. The<br />
maximal values are η Kerr =-1.9 ◦ and θ Kerr =-1 ◦ , respectively. Although the<br />
magnetization is almost constant below room temperature [3], the MOKE is<br />
enhanced by 45% down to T=10 K.<br />
Kerr / Kerr (deg)<br />
0.8<br />
0.4<br />
0.0<br />
-0.4<br />
B || <br />
-0.8<br />
B=0.25T<br />
-1.2<br />
T=10K<br />
Kerr T=300K<br />
Kerr<br />
-1.6<br />
T=10K<br />
Kerr T=300K<br />
Kerr<br />
-2.0<br />
0.0 0.5 1.0 1.5 2.0 2.5 3.0 3.5<br />
Energy (eV)<br />
Figure 4.4: The spectra <strong>of</strong> the <strong>magneto</strong>-<strong>optical</strong> Kerr parameters at room<br />
temperature and T=10 K. The Kerr ellipticity shows a peak at E=1 eV due<br />
to the plasma resonance and its maximal value <strong>in</strong>creases up to η Kerr =-1.9 ◦<br />
as the temperature is decreased to T=10 K correspond<strong>in</strong>g to the sharpen<strong>in</strong>g <strong>of</strong><br />
the plasma edge. The Kerr rotation reaches the value θ Kerr =-1 ◦ <strong>in</strong> the same<br />
region.<br />
From the complex Kerr angle, we have calculated the <strong>of</strong>f-diagonal conductivity<br />
accord<strong>in</strong>g to the follow<strong>in</strong>g relation:<br />
Φ Kerr = θ Kerr + iη Kerr ≈ −<br />
σ xy<br />
σ xx<br />
√1 + iσ xx<br />
ε o ω<br />
, (4.7)<br />
where σ xx and σ xy are the elements <strong>of</strong> the complex <strong>optical</strong> conductivity tensor.<br />
The Kerr rotation and ellipticity describe the phase and the <strong>in</strong>tensity<br />
difference, respectively, between left and right circularly polarized light upon<br />
normal-<strong>in</strong>cidence reflection from a magnetic surface (see Eq. 3.15 <strong>in</strong> the previous<br />
Chapter). The correspond<strong>in</strong>g results are presented <strong>in</strong> Fig. 4.5.<br />
In spite <strong>of</strong> the large MOKE around E=1 eV, neither the <strong>of</strong>f-diagonal nor<br />
the diagonal conductivity show any specific <strong>optical</strong> excitation <strong>in</strong> this energy<br />
region. The large enhancement <strong>of</strong> the MOKE signal corresponds to the<br />
plasma resonance at Ω pl ≈1 eV; it is caused by the denom<strong>in</strong>ator tak<strong>in</strong>g<br />
m<strong>in</strong>imum value <strong>of</strong> Eq. 4.7 rather than by an <strong>in</strong>crease <strong>of</strong> the <strong>of</strong>f-diagonal<br />
52
-1 cm<br />
-1 )<br />
Re{ xy<br />
} (<br />
-1 cm<br />
-1 )<br />
Im{ xy<br />
} (<br />
200<br />
150<br />
100<br />
50<br />
0<br />
-50<br />
100<br />
50<br />
0<br />
-50<br />
10K<br />
100K<br />
200K<br />
250K<br />
300K<br />
B || <br />
B=0.25T<br />
-100<br />
0.0 0.5 1.0 1.5 2.0 2.5 3.0 3.5<br />
Energy (eV)<br />
Figure 4.5: The <strong>of</strong>f-diagonal conductivity determ<strong>in</strong>ed from the <strong>magneto</strong><strong>optical</strong><br />
Kerr spectra. The plasma edge resonance observed <strong>in</strong> the Kerr effect<br />
is canceled out, which implies that the Kramers-Kronig transformation was<br />
performed properly. The dashed l<strong>in</strong>es with labels <strong>in</strong>dicate the same transitions<br />
as <strong>in</strong> Fig. 4.3. The transition at E=0.5 eV shows a large <strong>magneto</strong>-<strong>optical</strong> signal,<br />
while the Se 4p→Cr 3d charge transfer excitation has also a considerable<br />
<strong>magneto</strong>-<strong>optical</strong> activity.<br />
conductivity [38, 42]. The almost perfect cancelation <strong>of</strong> this resonance <strong>in</strong><br />
the <strong>of</strong>f-diagonal conductivity <strong>in</strong>dicates the properness <strong>of</strong> the Kramers-Kronig<br />
transformation for the reflectivity. When the <strong>optical</strong> excitations are broad<br />
compared to the magnetically <strong>in</strong>duced splitt<strong>in</strong>g <strong>of</strong> the observed transitions<br />
for the two circular polarizations, the Kerr parameters θ Kerr and η Kerr are<br />
proportional to the derivative <strong>of</strong> the reflectivity:<br />
η Kerr = 1 |r + | 2 − |r − | 2<br />
2 |r + | 2 + |r − | ∝ 1 ∂R(E)<br />
2 R(E) ∂E ,<br />
θ Kerr = 1 2 (ϕ + − ϕ − ) ∝ ∂ϕ(E)<br />
∂E , (4.8)<br />
where r ± =|r ± |e ϕ ±<br />
are the Fresnel coefficients for the right and left circularly<br />
polarized photons and R(E)=(|r + | 2 +|r − | 2 )/2 and ϕ(E) are the reflectivity<br />
and the correspond<strong>in</strong>g phase. The sudden decrease <strong>of</strong> the reflectivity near<br />
53
the plasma edge, which generates the large MOKE signal, becomes steeper as<br />
the life-time <strong>in</strong>creases toward low temperatures. This causes the considerable<br />
temperature dependence <strong>in</strong> the region <strong>of</strong> the plasma resonance [42].<br />
The real part <strong>of</strong> the <strong>of</strong>f-diagonal conductivity (shown <strong>in</strong> Fig. 4.5) is dom<strong>in</strong>ated<br />
by two ma<strong>in</strong> structures, namely a broader hump around E=2.75 eV<br />
and a resonance-like peak centered at E=0.5 eV. As discussed <strong>in</strong> Chapter 1,<br />
the dispersive l<strong>in</strong>e-shape <strong>in</strong> the imag<strong>in</strong>ary part <strong>of</strong> the <strong>of</strong>f-diagonal conductivity<br />
and also the correspond<strong>in</strong>g large values – Im{σ xy }=53 Ω −1 cm −1 and<br />
Im{σ xy }=110 Ω −1 cm −1 at T=10 K, for the higher and the lower energy structures,<br />
respectively – are suggestive <strong>of</strong> parity allowed transitions [2], which is<br />
reasonable for the Se 4p→Cr 3d charge transfer transition at E=2.75 eV.<br />
The magnitude <strong>of</strong> the low-energy part <strong>of</strong> the <strong>of</strong>f-diagonal conductivity enlarged<br />
<strong>in</strong> Fig. 4.6 is very close to that <strong>of</strong> the dc Hall effect obta<strong>in</strong>ed <strong>in</strong> the<br />
same magnetic field [41], except for T=10 K where σ Hall =300 Ω −1 cm −1 . As<br />
the temperature decreases the low-energy tail <strong>of</strong> the real part is considerably<br />
reduced <strong>in</strong> contrast to the temperature <strong>in</strong>dependent behavior <strong>of</strong> the<br />
magnetization. This may <strong>in</strong>dicate that a non-perturbative treatment <strong>of</strong> the<br />
sp<strong>in</strong>-orbit coupl<strong>in</strong>g would be also necessary to describe the low-energy <strong>of</strong>fdiagonal<br />
conductivity as it was formerly proposed for the dc anomalous Hall<br />
effect [41, 43].<br />
To understand the orig<strong>in</strong> <strong>of</strong> the <strong>optical</strong> excitations, the results <strong>of</strong> the<br />
recent band structure calculations [31, 32, 33] are summarized schematically<br />
<strong>in</strong> Fig. 4.7. The chromium d-band is split by the cubic crystal field <strong>in</strong>to a t 2g<br />
and an e g band. The selenium 4p and the copper 3d states are fully mixed.<br />
Furthermore, the hybridization between the selenium 4p and the chromium<br />
t 2g <strong>in</strong>duces a gap just below the Fermi energy <strong>in</strong> the majority sp<strong>in</strong> channel.<br />
As a consequence, states from the Se 4p band are shifted above the Fermi<br />
level (referred to as ”hump <strong>in</strong> the density <strong>of</strong> states” <strong>in</strong> the <strong>in</strong>troduction),<br />
thus, holes appear <strong>in</strong> the majority sp<strong>in</strong> channel. The ma<strong>in</strong> <strong>optical</strong> transitions<br />
observed <strong>in</strong> the experiments are also <strong>in</strong>dicated <strong>in</strong> the figure.<br />
Our <strong>optical</strong> and <strong>magneto</strong>-<strong>optical</strong> study confirms the results <strong>of</strong> the band<br />
structure calculations both <strong>in</strong> the close vic<strong>in</strong>ity <strong>of</strong> the Fermi energy and on<br />
a few-eV-large scale. In agreement with the theoretical results, we expla<strong>in</strong><br />
the transition at E=0.5 eV as excitations through the hybridization-<strong>in</strong>duced<br />
gap. The high oscillator strength is due to the parity difference between the<br />
<strong>in</strong>itial and the f<strong>in</strong>al states. The large <strong>of</strong>f-diagonal conductivity is possibly<br />
ow<strong>in</strong>g to the strong sp<strong>in</strong>-orbit coupl<strong>in</strong>g for the delocalized electrons with a<br />
strong selenium character (E SO ≈0.5 eV) and the highly sp<strong>in</strong> polarized states<br />
<strong>in</strong> the ∼1 eV vic<strong>in</strong>ity <strong>of</strong> the Fermi level [31, 33]. The shift <strong>of</strong> this transition<br />
towards higher energies <strong>in</strong> CuCr 2 Se 3.7 Br 0.3 was reported <strong>in</strong> a former <strong>optical</strong><br />
and <strong>magneto</strong>-<strong>optical</strong> study [38], which is consistent with the present assign-<br />
54
-1 cm<br />
-1 )<br />
50<br />
25<br />
300 K<br />
Re{ xy<br />
} (<br />
-1 cm<br />
-1 )<br />
Im{<br />
xy<br />
} (<br />
0<br />
10 K<br />
-25<br />
25<br />
0<br />
-25 10K<br />
100K<br />
-50 200K<br />
250K B || <br />
-75 300K B=0.25T<br />
-100<br />
0.0 0.1 0.2 0.3 0.4 0.5<br />
Energy (eV)<br />
Figure 4.6: The low-energy part <strong>of</strong> the <strong>of</strong>f-diagonal conductivity. The dc values<br />
are reproduced from Hall resistivity measurement performed <strong>in</strong> the same<br />
magnetic field by Lee et al. [41]. The dc Hall conductivity σ xy ≈300 Ω −1 cm −1<br />
measured at T=10 K is out <strong>of</strong> the scale <strong>of</strong> the graph.<br />
ment <strong>of</strong> the E=0.5 eV peak, s<strong>in</strong>ce brom<strong>in</strong>e substitution <strong>in</strong>creases the Fermi<br />
energy by add<strong>in</strong>g electrons to the system.<br />
The first charge transfer excitations around E=2.75 eV, with a remarkable<br />
oscillator strength and <strong>magneto</strong>-<strong>optical</strong> activity are attributed to Se 4p→Cr<br />
3d transition, while the excitation at E=1.9 eV is assigned to on-site d-d<br />
transitions <strong>of</strong> chromium ions. These are <strong>in</strong> overall agreement with the theoretical<br />
calculations, although the transition energies are somewhat higher<br />
<strong>in</strong> the experiment [31, 32, 33]. The contribution <strong>of</strong> the d-d transition to the<br />
<strong>of</strong>f-diagonal conductivity is small compared to that <strong>of</strong> the charge transfer<br />
transition. Besides the reduced oscillator strength <strong>of</strong> the d-d transition due<br />
to its dipole-forbidden nature, it is likely to be caused by the fairly small<br />
sp<strong>in</strong>-orbit coupl<strong>in</strong>g for chromium (E SO =0.09 eV) [31]. The measurement <strong>of</strong><br />
the <strong>of</strong>f-diagonal conductivity greatly helps to separate the <strong>optical</strong> transition<br />
found around E=0.5 eV, s<strong>in</strong>ce its large <strong>magneto</strong>-<strong>optical</strong> activity dom<strong>in</strong>ates<br />
over the contribution from the metallic charge carriers (damped cyclotron<br />
resonance) contrary to the case <strong>of</strong> the diagonal conductivity.<br />
In conclusion, we have measured the diagonal and <strong>of</strong>f-diagonal <strong>optical</strong><br />
55
Figure 4.7: The schematic representation <strong>of</strong> the density <strong>of</strong> states as determ<strong>in</strong>ed<br />
by density functional calculations [31, 32, 33]. The chromium d-band<br />
is split by the cubic crystal field <strong>in</strong>to a t 2g and an e g band. In the majority<br />
sp<strong>in</strong> channel the hybridization between the Se 4p and Cr 3d splits the selenium<br />
band and <strong>in</strong>duces a gap just below the Fermi energy. Consequently,<br />
one hole appears <strong>in</strong> the upper branch <strong>of</strong> the selenium band for majority sp<strong>in</strong>s.<br />
Complete sp<strong>in</strong> polarization <strong>of</strong> the charge carriers could be achieved by t<strong>in</strong>y<br />
electron dop<strong>in</strong>g [33]; former band structure calculations <strong>in</strong>dicated that x∼10-<br />
20% Br, Cd, Zn, etc. substitution could result <strong>in</strong> a half-metallic state. The<br />
th<strong>in</strong> black arrows <strong>in</strong>dicate the excitations observed both <strong>in</strong> the diagonal and<br />
<strong>of</strong>f-diagonal conductivity spectra <strong>in</strong> the energy region <strong>of</strong> E=0.1-4 eV with the<br />
same labels as used <strong>in</strong> Fig. 4.3 and 4.5. Processes <strong>in</strong> the close vic<strong>in</strong>ity <strong>of</strong> the<br />
Fermi level, responsible for the metallic conduction dom<strong>in</strong>at<strong>in</strong>g the diagonal<br />
<strong>optical</strong> conductivity for E
4.3 Sp<strong>in</strong> chirality-<strong>in</strong>duced <strong>magneto</strong>-<strong>optical</strong> activity<br />
<strong>in</strong> electron- and hole-doped Nd 2 Mo 2 O 7<br />
4.3.1 Anomalous Hall effect <strong>in</strong> the non-coll<strong>in</strong>ear ferromagnet<br />
Nd 2 Mo 2 O 7<br />
The metallic Nd 2 Mo 2 O 7 has a pyrochlore structure. Both magnetic sublattices,<br />
the ones occupied by Nd and the other by Mo, form a pyrochlore lattice,<br />
i.e. a network <strong>of</strong> corner-shar<strong>in</strong>g tetrahedra as shown <strong>in</strong> Fig. 4.8 [44, 45]. The<br />
it<strong>in</strong>erant magnetic moment <strong>of</strong> the Mo ions are coupled ferromagnetically,<br />
which results <strong>in</strong> a long-range order below T c =89 K. The magnetic moments<br />
<strong>of</strong> the rare-earth element, Nd, are coupled ferromagnetically as well, however,<br />
they are subject to a strong easy-axis anisotropy, which po<strong>in</strong>ts towards the<br />
center <strong>of</strong> each tetrahedron. As a consequence, the degenerate ground state<br />
manifold <strong>of</strong> a s<strong>in</strong>gle tetrahedron consists <strong>of</strong> ”two-<strong>in</strong>, two-out” sp<strong>in</strong> states <strong>in</strong><br />
which the four sp<strong>in</strong>s expand a f<strong>in</strong>ite solid angle (see Fig. 4.8). Accord<strong>in</strong>g<br />
to the neutron diffraction data, the magnetic moment <strong>of</strong> the rare-earth ions<br />
<strong>in</strong> Nd 2 Mo 2 O 7 grows rapidly below a cross-over temperature <strong>of</strong> T
[45, 46, 47]. In contrast to the temperature dependence <strong>of</strong> the magnetization,<br />
the anomalous Hall resistivity steeply <strong>in</strong>creases from the Curie temperature<br />
down to T=2 K (see Fig. 4.9) [45, 46]. In the sister compound Gd 2 Mo 2 O 7 ,<br />
where the Gd ion has zero angular moment (L=0), the s<strong>in</strong>gle-ion anisotropy<br />
on the rare earth sites vanishes. The AHE is negligible <strong>in</strong> the ferromagnetic<br />
phase, though both <strong>of</strong> the Gd and the Mo ions have large magnetic moments<br />
[46]. The latter fact <strong>in</strong>dicates the importance <strong>of</strong> the sp<strong>in</strong> chirality, s<strong>in</strong>ce<br />
Gd 2 Mo 2 O 7 has a coll<strong>in</strong>ear sp<strong>in</strong> structure. Moreover, it was po<strong>in</strong>ted out that<br />
<strong>in</strong> Nd 2 Mo 2 O 7 the sign <strong>of</strong> the sp<strong>in</strong> chirality can be reversed by the application<br />
<strong>of</strong> a strong magnetic field along the [111] direction. The result<strong>in</strong>g sign change<br />
<strong>of</strong> the anomalous Hall resistivity is reported to occur <strong>in</strong> B≈8 T, which is a<br />
further evidence for the sp<strong>in</strong> chirality-<strong>in</strong>duced AHE <strong>in</strong> Nd 2 Mo 2 O 7 [46].<br />
M (µ B /RMoO 3.5 )<br />
σ H (Ω -1 cm -1 )<br />
2<br />
1<br />
0<br />
20<br />
10<br />
(a)<br />
R 2 Mo 2 O 7<br />
(b)<br />
R=Gd<br />
R=Nd<br />
H = 0.5 T<br />
Nd 2 Mo 2 O 7<br />
(Is<strong>in</strong>g)<br />
T C<br />
Gd<br />
H = 0.5 T<br />
H || [100]<br />
H || [110]<br />
H || [111]<br />
T C<br />
Nd<br />
0<br />
Gd<br />
( 3) 2 Mo 2 O 7<br />
(Heisenberg)<br />
-10<br />
0 50 100 150<br />
Temperature (K)<br />
Figure 4.9: The temperature dependence <strong>of</strong> the magnetization and the dc<br />
<strong>of</strong>f-diagonal conductivity, σ H , <strong>in</strong> Nd 2 Mo 2 O 7 and Gd 2 Mo 2 O 7 [46]. The Hall<br />
conductivity is displayed for different directions <strong>of</strong> the external field H. The<br />
thick bar <strong>in</strong>dicates the estimated value <strong>of</strong> the Mo sp<strong>in</strong> moment at low temperatures.<br />
The frequency dependence <strong>of</strong> the <strong>of</strong>f-diagonal conductivity, σ xy (ω), can<br />
be <strong>in</strong>vestigated by low-energy <strong>magneto</strong>-<strong>optical</strong> spectroscopy as it is underl<strong>in</strong>ed<br />
above. In Nd 2 Mo 2 O 7 , a large <strong>magneto</strong>-<strong>optical</strong> activity was reported<br />
for the excitation <strong>of</strong> the it<strong>in</strong>erant charge carriers [9]. At the lowest ener-<br />
58
gies, the real part <strong>of</strong> the <strong>of</strong>f-diagonal conductivity is <strong>in</strong> agreement with the<br />
anomalous Hall conductivity determ<strong>in</strong>ed from resistivity measurements. Although<br />
the <strong>optical</strong> and <strong>magneto</strong>-<strong>optical</strong> spectra <strong>of</strong> the Gd 2 Mo 2 O 7 are similar<br />
to those <strong>of</strong> Nd 2 Mo 2 O 7 <strong>in</strong> the region <strong>of</strong> the <strong>in</strong>terband excitations, <strong>in</strong>dicat<strong>in</strong>g<br />
a similar band structure on a large energy scale, <strong>in</strong> the <strong>in</strong>frared region only a<br />
small <strong>magneto</strong>-<strong>optical</strong> signal is found when the Nd is replaced by Gd. This<br />
difference was attributed to the loss <strong>of</strong> the sp<strong>in</strong> chirality.<br />
F<strong>in</strong>ally, we note that the AHE <strong>of</strong> the coll<strong>in</strong>ear it<strong>in</strong>erant ferromagnets and<br />
the sp<strong>in</strong> chirality-<strong>in</strong>duced AHE are only apparently different. In the case <strong>of</strong><br />
the coll<strong>in</strong>ear it<strong>in</strong>erant magnets the AHE is determ<strong>in</strong>ed by the strength <strong>of</strong><br />
sp<strong>in</strong>-orbit coupl<strong>in</strong>g for the it<strong>in</strong>erant charge carriers, while <strong>in</strong> the other case<br />
the Hall conductivity is related to the Berry curvature caused by the sp<strong>in</strong><br />
chirality. However, the large sp<strong>in</strong>-orbit <strong>in</strong>teraction, which is present on the<br />
rare-earth Nd site, is responsible for the s<strong>in</strong>gle-ion anisotropy, thus the sp<strong>in</strong><br />
chirality <strong>in</strong> Nd 2 Mo 2 O 7 . The sp<strong>in</strong>-orbit coupl<strong>in</strong>g <strong>of</strong> the rare-earth ions is delivered<br />
to the it<strong>in</strong>erant charge carriers by the J pd antiferromagnetic coupl<strong>in</strong>g<br />
between the Nd and Mo ions. Therefore, both <strong>effects</strong> are the manifestation<br />
<strong>of</strong> the sp<strong>in</strong>-orbit coupl<strong>in</strong>g.<br />
4.3.2 Optical and <strong>magneto</strong>-<strong>optical</strong> spectroscopy on<br />
Nd 2 (Mo,Nb) 2 O 7 and (Nd,Ca) 2 Mo 2 O 7<br />
Band cross<strong>in</strong>gs or nearly degenerate po<strong>in</strong>ts <strong>in</strong> the band structure act as a<br />
source <strong>of</strong> the Berry curvature and, hence, they can generate a large anomalous<br />
Hall effect as far as the <strong>in</strong>tr<strong>in</strong>sic mechanism <strong>of</strong> the AHE is considered. To<br />
identify such a resonant enhancement <strong>of</strong> the AHE due to the sp<strong>in</strong> chirality<strong>in</strong>duced<br />
gap, we have carried out a <strong>magneto</strong>-<strong>optical</strong> study <strong>of</strong> Nd 2 Mo 2 O 7 upon<br />
chang<strong>in</strong>g the electron concentration by chemical dop<strong>in</strong>g. In order to follow<br />
the systematics, the <strong>of</strong>f-diagonal conductivity spectra, σ xy (ω), <strong>in</strong> the dc limit<br />
ω →0 are also compared to Hall resistivity measurements.<br />
All <strong>of</strong> the samples were s<strong>in</strong>gle crystals grown by Dr. S. Iguchi. The electron<br />
concentration has been <strong>in</strong>creased <strong>in</strong> Nd 2 (Mo 1−x ,Nb x ) 2 O 7 (x=0, 0.03,<br />
0.06, 0.09), while hole dop<strong>in</strong>g has been realized <strong>in</strong> (Nd 1−y ,Ca y ) 2 Mo 2 O 7 (y=0.05).<br />
The resistivity <strong>of</strong> the samples were measured by S. Kumakura, which was<br />
not strongly affected by Ca dop<strong>in</strong>g, whereas it <strong>in</strong>creased steeply with Nb<br />
dop<strong>in</strong>g as shown <strong>in</strong> Fig. 4.10. This difference is caused by the Nb dop<strong>in</strong>g<strong>in</strong>duced<br />
disorder at the Mo sites, which reduces the mean free path <strong>of</strong> the<br />
it<strong>in</strong>erant carriers responsible for the metallic transport [47]. The temperature<br />
and dop<strong>in</strong>g dependence <strong>of</strong> the Hall resistivity were measured <strong>in</strong> a magnetic<br />
field <strong>of</strong> B=0.2 T, applied along the [100] easy-axis (see Fig. 4.10). This field<br />
59
is sufficient to align the magnetic doma<strong>in</strong>s along the [100] direction without<br />
decreas<strong>in</strong>g the tilt<strong>in</strong>g angle <strong>of</strong> the Mo sp<strong>in</strong>s and the correspond<strong>in</strong>g sp<strong>in</strong><br />
chirality [46, 47]. While the Hall conductivity <strong>in</strong>creases with Ca dop<strong>in</strong>g, it<br />
steeply decreases with Nb dop<strong>in</strong>g.<br />
Resistivity [mΩcm]<br />
100<br />
50<br />
10<br />
5<br />
1<br />
0.5<br />
(c)<br />
x = 0.09<br />
x = 0.06<br />
x = 0.03<br />
x = 0<br />
y = 0.05<br />
Nd 2 (Mo 1-x Nb x ) 2 O 7<br />
(Nd 1-y Ca y ) 2 Mo 2 O 7<br />
0.1<br />
0 50 100 150<br />
Temperature [K]<br />
Hall Conductivity [Ω -1 cm -1 ]<br />
40<br />
30<br />
20<br />
(d)<br />
H || [100]<br />
H = 0.2 T<br />
(Nd 1-y Ca y ) 2 Mo 2 O 7<br />
y = 0.05<br />
Nd 2 (Mo 1-x Nb x ) 2 O 7<br />
x = 0<br />
10<br />
x = 0.03<br />
x = 0.09<br />
0<br />
x = 0.06<br />
0 50 100<br />
Temperature [K]<br />
Figure 4.10: The temperature dependence <strong>of</strong> the resistivity and the Hall conductivity<br />
<strong>of</strong> the mother compound Nd 2 Mo 2 O 7 and the electron and the hole<br />
doped, Nd 2 (Mo 1−x ,Nb x ) 2 O 7 and (Nd 1−y ,Ca y ) 2 Mo 2 O 7 , respectively.<br />
The normal <strong>in</strong>cidence reflectivity was measured on the (100) surface over<br />
the energy range <strong>of</strong> E=0.01-5 eV. The reflectivity spectra <strong>of</strong> various compounds<br />
at T=10 K are shown <strong>in</strong> Fig. 4.11 a on a logarithmic photon-energy<br />
scale. Ow<strong>in</strong>g to the it<strong>in</strong>erant electrons, a high-reflectivity band appears<br />
below the plasma edge <strong>of</strong> E∼1 eV. Higher energy (E=4-40 eV) reflectivity<br />
spectra were measured at room temperature by S. Kumakura. The extended<br />
reflectivity data were used to facilitate an accurate Kramers-Kronig transformation<br />
to obta<strong>in</strong> the diagonal <strong>optical</strong> conductivity, σ xx . Its real part is<br />
shown for the Mo 4d <strong>in</strong>traband region (E0.1 eV shows<br />
much less variation with dop<strong>in</strong>g. The m<strong>in</strong>imal <strong>in</strong>fluence <strong>of</strong> disorder <strong>in</strong> this<br />
energy range (E>0.1 eV) enables us to analyze the effect <strong>of</strong> band fill<strong>in</strong>g on<br />
the <strong>magneto</strong>-<strong>optical</strong> response.<br />
The spectra <strong>of</strong> Kerr rotation, θ K , and Kerr ellipticity, η K , were measured<br />
on the (100) surface <strong>of</strong> the crystals with nearly normal <strong>in</strong>cidence. The<br />
60
Reflectivity<br />
Kerr rotation θ K [deg.]<br />
Kerr ellipticity η K [deg.]<br />
1<br />
0.8<br />
0.6<br />
0.4<br />
0.2<br />
0<br />
0.2<br />
0<br />
-0.2<br />
0.2<br />
0<br />
-0.2<br />
(a)<br />
(Nd 1-y Ca y ) 2 Mo 2 O 7<br />
y = 0.05<br />
(b)<br />
(c)<br />
y = 0.05<br />
x = 0<br />
x = 0.03<br />
x = 0.06<br />
x = 0.09<br />
Nd 2 (Mo 1-x Nb x ) 2 O 7<br />
x = 0<br />
x = 0.03<br />
x = 0.06<br />
x = 0.09<br />
(100) || E<br />
T = 10 K<br />
T = 10 K<br />
(100) || E<br />
[100] || H = 0.2 T<br />
y = 0.05<br />
x = 0<br />
x = 0.03<br />
x = 0.06<br />
x = 0.09<br />
0.1 0.2 0.4 1 2<br />
Energy [eV]<br />
σ ' xx (ω ) [1000 Ω -1 cm -1 ]<br />
σ ' xy (ω ) [Ω -1 cm -1 ]<br />
σ " xy (ω ) [Ω -1 cm -1 ]<br />
2.5<br />
2<br />
1.5<br />
1<br />
0.5<br />
0<br />
20<br />
10<br />
0<br />
20<br />
10<br />
0<br />
(d) (Nd 1-y Ca y ) 2 Mo 2 O 7<br />
y = 0.05<br />
Nd 2 (Mo 1-x Nb x ) 2 O 7<br />
x = 0<br />
x = 0.03<br />
x = 0.06<br />
x = 0.09<br />
(e)<br />
y = 0.05<br />
(f) y = 0.05<br />
T = 10 K (100) || E<br />
T = 10 K (100) || E<br />
[100] || H = 0.2 T<br />
x = 0<br />
x = 0.03<br />
x = 0.06<br />
x = 0.09<br />
x = 0<br />
x = 0.03<br />
x = 0.06<br />
x = 0.09<br />
-10<br />
0 0.2 0.4 0.6 0.8<br />
Energy [eV]<br />
Figure 4.11: The reflectivity spectra <strong>of</strong> the doped Nd 2 Mo 2 O 7 compounds and<br />
the correspond<strong>in</strong>g diagonal <strong>optical</strong> conductivity are shown <strong>in</strong> panel (a) and<br />
(d), respectively. From the <strong>magneto</strong>-<strong>optical</strong> Kerr rotation (θ K ) and ellipticity<br />
(η K ), the real (σ xy) ′ and the imag<strong>in</strong>ary (σ xy), ′′ part <strong>of</strong> the <strong>of</strong>f-diagonal <strong>optical</strong><br />
conductivity is calculated (see (b),(c) and (e),(f) panels, respectively).<br />
external magnetic field <strong>of</strong> B=0.2 T was applied parallel to the propagation<br />
direction <strong>of</strong> the light. Fig. 4.11 b and c, show the dop<strong>in</strong>g dependence <strong>of</strong> θ K<br />
and η K spectra at T=10 K, respectively. The prom<strong>in</strong>ent peak <strong>in</strong> θ K around<br />
E≈1.2 eV and the correspond<strong>in</strong>g dispersive l<strong>in</strong>e shape <strong>in</strong> the η K spectra are<br />
present for all <strong>of</strong> the crystals and correspond to the plasma-edge enhancement<br />
<strong>of</strong> the <strong>magneto</strong>-<strong>optical</strong> Kerr effect as discussed above for CuCr 2 Se 4 [42]. The<br />
low-energy signals below E
measurement and the Kramers-Kronig analysis. Both the real, σ xy, ′ and the<br />
imag<strong>in</strong>ary σ xy ′′ parts <strong>of</strong> the <strong>of</strong>f-diagonal conductivity spectra have broad but<br />
prom<strong>in</strong>ent peaks <strong>in</strong> contrast to the flat σ xx spectra. For dop<strong>in</strong>g x≥0.03, the<br />
peak <strong>in</strong> σ xy ′ is even larger than the dc value. The peak <strong>in</strong> the <strong>of</strong>f-diagonal<br />
conductivity spectra shifts systematically to higher and lower energies for<br />
electron (Nb) and hole (Ca) dop<strong>in</strong>g, respectively, and the broaden<strong>in</strong>g <strong>of</strong> the<br />
peak <strong>in</strong>creases for higher peak energies.<br />
(a) E F<br />
20 (d) Nd 2 (Mo 1-x Nb x ) 2 O 7<br />
µ<br />
σ xy (ω)<br />
15 x = 0<br />
T = 10 K<br />
E (100) || E<br />
MIR<br />
10 [100] || H = 0.2 T<br />
2|m|<br />
(Nd 1-y Ca y ) 2 Mo 2 O 7 Nd 2 (Mo 1-x Nb x ) 2 O 7<br />
5<br />
x = 0.06<br />
40 (b) 1.5 0<br />
M<br />
30<br />
Mo<br />
1<br />
20<br />
σ xy (dc)<br />
20 (e)<br />
10<br />
σ ' xy (E MIR ) 0.5 15<br />
x = 0<br />
0<br />
0<br />
10<br />
(c)<br />
5<br />
0.2<br />
0<br />
0.1<br />
x = 0.06<br />
-5<br />
0 0.2 0.4 0.6 0.8 1<br />
-0.05 0 0.05 0.1<br />
Energy [eV]<br />
δ [/Mo]<br />
σ ' xy (ω ) [Ω -1 cm -1 ]<br />
E MIR [eV]<br />
Magnetization [µ B /Mo(Nb) site]<br />
Figure 4.12: (a) The two-band model <strong>of</strong> an anticross<strong>in</strong>g po<strong>in</strong>t where the<br />
degeneracy is lifted by a small perturbation, like sp<strong>in</strong>-orbit coupl<strong>in</strong>g, and here<br />
the sp<strong>in</strong> chirality. (b) Hole (y) and electron (x) dop<strong>in</strong>g (band-fill<strong>in</strong>g change<br />
δ=x-y) dependence <strong>of</strong> the dc anomalous Hall conductivity, the peak magnitude<br />
<strong>of</strong> the real part <strong>of</strong> the <strong>optical</strong> Hall conductivity <strong>in</strong> the mid-<strong>in</strong>frared region, and<br />
the estimated magnetization <strong>of</strong> the Mo sp<strong>in</strong> (M Mo ) at T=10 K. (c) Dop<strong>in</strong>g<br />
dependence <strong>of</strong> the peak position, E MIR , <strong>in</strong> the σ xy spectra. The l<strong>in</strong>e shows the<br />
shift<strong>in</strong>g <strong>of</strong> the peak position correspond<strong>in</strong>g to the slope E MIR /δ ≈1 Mo/eV.<br />
Comparison between the experimental spectra (solid l<strong>in</strong>es) and the two-band<br />
model calculations (broken l<strong>in</strong>es) for (d) the real and (e) the imag<strong>in</strong>ary part<br />
<strong>of</strong> σ xy for x=0 and 0.06.<br />
Fig. 4.12 b compares the dc anomalous Hall conductivity, the peak magnitude<br />
<strong>in</strong> the real part <strong>of</strong> <strong>optical</strong> Hall conductivity <strong>in</strong> the mid-<strong>in</strong>frared region,<br />
and the estimated magnetization <strong>of</strong> Mo sp<strong>in</strong>s (M Mo ) as a function <strong>of</strong><br />
the carrier concentration relative to the clean Nd 2 Mo 2 O 7 , δ=x-y. While the<br />
magnetization does not show a large variation with fill<strong>in</strong>g, σ xy (dc) decreases<br />
steeply with Nb dop<strong>in</strong>g, which is ma<strong>in</strong>ly caused by the <strong>in</strong>crease <strong>in</strong> scatter<strong>in</strong>g<br />
due to disorder on the Mo (Nb) sites as discussed <strong>in</strong> [47]. The low-energy<br />
σ ' xy [Ω -1 cm -1 ]<br />
σ " xy [Ω -1 cm -1 ]<br />
62
part <strong>of</strong> the <strong>of</strong>f-diagonal conductivity decreases l<strong>in</strong>early with Nb dop<strong>in</strong>g. The<br />
fill<strong>in</strong>g dependence <strong>of</strong> the peak position, E MIR , is shown <strong>in</strong> Fig. 4.11 c. The<br />
tendency <strong>in</strong> the shift <strong>of</strong> the resonance suggests that the <strong>in</strong>itial or the f<strong>in</strong>al<br />
state <strong>of</strong> the excitation lies <strong>in</strong> the vic<strong>in</strong>ity <strong>of</strong> the Fermi energy. The slope <strong>of</strong><br />
E MIR (δ) is comparable with that evaluated from the change <strong>in</strong> density <strong>of</strong><br />
states (∼1 Mo/eV) obta<strong>in</strong>ed by a local-density approximation (LDA) bandstructure<br />
calculation [48]. Moreover, the enhancement <strong>of</strong> the AHE <strong>in</strong> the dc<br />
limit upon hole dop<strong>in</strong>g is likely to correspond to the red shift <strong>of</strong> the resonant<br />
peak <strong>in</strong> σ ′ xy. Therefore, a nearly degenerate po<strong>in</strong>t <strong>of</strong> the band structure with<br />
a small gap is responsible both for the dc and the <strong>optical</strong> Hall effect.<br />
To account for the resonant spectral shape <strong>in</strong> the <strong>of</strong>f-diagonal conductivity,<br />
the spectra were fitted by a model previously developed by N. Nagaosa<br />
describ<strong>in</strong>g a band-cross<strong>in</strong>g po<strong>in</strong>t-<strong>in</strong>duced anomalous Hall effect <strong>in</strong> SrRuO 3<br />
[20]. In order to obta<strong>in</strong> an analytical solution, the follow<strong>in</strong>g two-band Hamiltonian<br />
<strong>in</strong> two dimensions is discussed:<br />
H = ∑ k<br />
c † k H(k)c k,<br />
H(k) = h o (k) +<br />
3∑<br />
h i (k)σ i , (4.9)<br />
where σ i are the Pauli matrices, h o =-µ is the energy difference between the<br />
band-cross<strong>in</strong>g po<strong>in</strong>t and the Fermi energy, h x =k x , h y =k y and h z =m is<br />
half <strong>of</strong> the sp<strong>in</strong> chirality-<strong>in</strong>duced gap. The dispersion relation is plotted <strong>in</strong><br />
Fig. 4.12 a. The <strong>of</strong>f-diagonal <strong>optical</strong> conductivity tensor is calculated from<br />
the Kubo formula with the current operator:<br />
j ν = e <br />
∑<br />
k<br />
i=1<br />
c † ∂H(k)<br />
k<br />
c k . (4.10)<br />
∂k ν<br />
The result<strong>in</strong>g <strong>of</strong>f-diagonal conductivity has the follow<strong>in</strong>g form:<br />
( )<br />
σ xy (ω) =<br />
e2 m −ω − i/τ + 2µ<br />
8πha (ω + i/τ) ln , (4.11)<br />
ω + i/τ + 2µ<br />
where 1/τ takes the lifetime broaden<strong>in</strong>g and the variation <strong>of</strong> m upon chang<strong>in</strong>g<br />
k z <strong>in</strong>to account. S<strong>in</strong>ce a 2D model is used, an <strong>in</strong>terlayer distance a is<br />
<strong>in</strong>troduced <strong>in</strong> the formula 4.11, which corresponds to the lattice constant <strong>of</strong><br />
a∼1 nm.<br />
The results <strong>of</strong> the fitt<strong>in</strong>g <strong>of</strong> the experimental spectra with the formula<br />
4.11 are shown by the broken l<strong>in</strong>es <strong>in</strong> Fig. 4.12 d and e. The parameters <strong>of</strong><br />
µ, /τ and m obta<strong>in</strong>ed by the fitt<strong>in</strong>g are 78, 40, and 78 meV for x=0 and 113,<br />
63
80, and 41 meV for x=0.06, respectively. The present simple model calculation<br />
captures the observed features well; the peak energy <strong>in</strong> the imag<strong>in</strong>ary<br />
part positions higher than that <strong>of</strong> the real part and the peak magnitude decreases<br />
with <strong>in</strong>creas<strong>in</strong>g the peak position (∝ m/ω). The difference between<br />
the ω →0 limit and the <strong>of</strong>f-diagonal <strong>optical</strong> conductivity is considered as<br />
the contribution from the experimentally <strong>in</strong>accessible low-energy band structure.<br />
The <strong>in</strong>terband transition peak is expected to locate at E p ≈2µ, and the<br />
peak position shift per δ is 2/D(ϵ F ) <strong>in</strong> the present model, where D(ϵ F ) is the<br />
density <strong>of</strong> states at the Fermi energy. Therefore, our experiments gives the<br />
value <strong>of</strong> D(ϵ F )∼2 Mo/eV; this is to be compared with the results <strong>of</strong> the density<br />
functional calculations D(ϵ F )∼1 Mo/eV [48]. The discrepancy, a factor<br />
<strong>of</strong> 2, is viewed as small, consider<strong>in</strong>g that the LDA tends to underestimate<br />
the density <strong>of</strong> states at the Fermi energy due to <strong>in</strong>sufficient correction for<br />
the electron correlation; this is confirmed by the observed enhancement <strong>of</strong><br />
the electronic specific-heat coefficient as compared with the LDA calculation<br />
[49]. The σ ′ xy(E MIR ) scales with the chirality <strong>in</strong>duced gap 2|m|. The<br />
obta<strong>in</strong>ed m is as large as 80 meV, although the value should be taken as<br />
a semiquantitive one because <strong>of</strong> the crudeness <strong>of</strong> the 2D model. S<strong>in</strong>ce the<br />
dc AHE <strong>in</strong> Nd 2 Mo 2 O 7 is dom<strong>in</strong>ated by the sp<strong>in</strong> chirality rather than the<br />
sp<strong>in</strong>-orbit <strong>in</strong>teraction for Mo 4d electrons, the presently deduced energy gap<br />
at the band-anticross<strong>in</strong>g po<strong>in</strong>t should also stem from the sp<strong>in</strong> chirality.<br />
In conclusion, we have observed a resonant structure <strong>in</strong> the mid-<strong>in</strong>frared<br />
region <strong>of</strong> the <strong>of</strong>f-diagonal <strong>optical</strong> conductivity spectra and its systematic<br />
evolution <strong>in</strong> the band-fill<strong>in</strong>g-controlled Nd 2 Mo 2 O 7 , endowed with sp<strong>in</strong> chirality.<br />
The resonant structure is related to a nearly degenerate po<strong>in</strong>t <strong>of</strong> the<br />
Brillou<strong>in</strong> zone associated with a gap <strong>in</strong>duced by sp<strong>in</strong> chirality. Our result<br />
provides a compell<strong>in</strong>g evidence for the monopole-like resonant structure <strong>in</strong><br />
the k-space as expected from the Berry-phase mechanism <strong>of</strong> the AHE. This<br />
picture should generally apply to the whole class <strong>of</strong> AHE, and the related<br />
resonance <strong>in</strong> the <strong>optical</strong> Hall conductivity is expected to be observable also<br />
<strong>in</strong> it<strong>in</strong>erant ferromagnets with sufficiently large sp<strong>in</strong>-orbit <strong>in</strong>teraction.<br />
64
References<br />
[1] V. Antonov, B. Harmon, and A. Yaresko, Electronic structure and<br />
<strong>magneto</strong>-<strong>optical</strong> properties <strong>of</strong> <strong>solids</strong> (Kluwer Academic Publishers, Amsterdam,<br />
2004).<br />
[2] S. Sugano and N. Kojima, Magneto-optics, Spr<strong>in</strong>ger series <strong>in</strong> solid-state<br />
sciences (Spr<strong>in</strong>ger, Berl<strong>in</strong>, 2000).<br />
[3] K. Ohgushi, Y. Okimoto, T. Ogasawara, S. Miyasaka, and Y. Tokura,<br />
Journal <strong>of</strong> the Physical Society <strong>of</strong> Japan 77, 034713 (2008).<br />
[4] T. Kise, T. Ogasawara, M. Ashida, Y. Tomioka, Y. Tokura, and<br />
M. Kuwata-Gonokami, Phys. Rev. Lett. 85, 1986 (2000).<br />
[5] K. Burch, D. Awschalom, and D. Basov, Journal <strong>of</strong> Magnetism and<br />
Magnetic Materials 320, 3207 (2008).<br />
[6] G. Acbas, M.-H. Kim, M. Cukr, V. Novák, M. A. Scarpulla, O. D.<br />
Dubon, T. Jungwirth, J. S<strong>in</strong>ova, and J. Cerne, Phys. Rev. Lett. 103,<br />
137201 (2009).<br />
[7] S. A. Crooker, M. Furis, X. Lou, C. Adelmann, D. L. Smith, C. J.<br />
Palmstrm, and P. A. Crowell, Science 309, 2191 (2005).<br />
[8] N. Nagaosa, J. S<strong>in</strong>ova, S. Onoda, A. H. MacDonald, and N. P. Ong,<br />
Rev. Mod. Phys. 82, 1539 (2010).<br />
[9] I. Kézsmárki, S. Onoda, Y. Taguchi, T. Ogasawara, M. Matsubara,<br />
S. Iguchi, N. Hanasaki, N. Nagaosa, and Y. Tokura, Phys. Rev. B 72,<br />
094427 (2005).<br />
[10] A. Kundt, Annalen der Physik 285, 257 (1893).<br />
[11] J. Sólyom, A modern szilárdtestfizika alapjai (ELTE Eötvös kiadó, Budapest,<br />
2002-2003).<br />
[12] G. H. Wannier, Phys. Rev. 72, 304 (1947).<br />
[13] R. Karplus and J. M. Lutt<strong>in</strong>ger, Phys. Rev. 95, 1154 (1954).<br />
[14] M. Onoda and N. Nagaosa, Journal <strong>of</strong> the Physical Society <strong>of</strong> Japan 71,<br />
19 (2002).<br />
[15] Y. Yao, L. Kle<strong>in</strong>man, A. H. MacDonald, J. S<strong>in</strong>ova, T. Jungwirth, D.-s.<br />
Wang, E. Wang, and Q. Niu, Phys. Rev. Lett. 92, 037204 (2004).<br />
65
[16] M. V. Berry, Proceed<strong>in</strong>gs <strong>of</strong> the Royal Society <strong>of</strong> London. A. Mathematical<br />
and Physical Sciences 392, 45 (1984).<br />
[17] D. J. Thouless, M. Kohmoto, M. P. Night<strong>in</strong>gale, and M. den Nijs, Phys.<br />
Rev. Lett. 49, 405 (1982).<br />
[18] M.-C. Chang and Q. Niu, Phys. Rev. Lett. 75, 1348 (1995).<br />
[19] G. Sundaram and Q. Niu, Phys. Rev. B 59, 14915 (1999).<br />
[20] Z. Fang, N. Nagaosa, K. S. Takahashi, A. Asamitsu, R. Mathieu, T. Ogasawara,<br />
H. Yamada, M. Kawasaki, Y. Tokura, and K. Terakura, Science<br />
302, 92 (2003).<br />
[21] K. Ohgushi, S. Murakami, and N. Nagaosa, Phys. Rev. B 62, R6065<br />
(2000).<br />
[22] A. Crépieux and P. Bruno, Phys. Rev. B 64, 014416 (2001).<br />
[23] J. Smit, Physica 24, 39 (1958).<br />
[24] L. Berger, Phys. Rev. B 2, 4559 (1970).<br />
[25] L. Berger, Phys. Rev. B 5, 1862 (1972).<br />
[26] Landolt-Börnste<strong>in</strong>, Magnetic and other properties <strong>of</strong> oxides and related<br />
compounds, vol. III/12b (Spr<strong>in</strong>ger, Berl<strong>in</strong>, 1988).<br />
[27] C. Colom<strong>in</strong>as, Phys. Rev. 153, 558 (1967).<br />
[28] A. P. Ramirez, R. J. Cava, and J. Krajewski, Nature 386, 156 (1997).<br />
[29] J. Hemberger, P. Lunkenheimer, R. Fichtl, H.-A. K. von Nidda,<br />
V. Tsurkan, and A. Loidl, Nature 434, 364 (2005).<br />
[30] F. Ogata, T. Hamajima, T. Kambara, and K. I. Gondaira, Journal <strong>of</strong><br />
<strong>Physics</strong> C: Solid State <strong>Physics</strong> 15, 3483 (1982).<br />
[31] V. N. Antonov, V. P. Antropov, B. N. Harmon, A. N. Yaresko, and<br />
A. Y. Perlov, Phys. Rev. B 59, 14552 (1999).<br />
[32] T. Saha-Dasgupta, M. De Raychaudhury, and D. D. Sarma, Phys. Rev.<br />
B 76, 054441 (2007).<br />
[33] Y.-H. A. Wang, A. Gupta, M. Chshiev, and W. H. Butler, Applied<br />
<strong>Physics</strong> Letters 92, 062507 (2008).<br />
66
[34] F. K. Lotger<strong>in</strong>g and R. P. van Stapele, Solid State Communications 5,<br />
143 (1967).<br />
[35] J. B. Goodenough, Journal <strong>of</strong> <strong>Physics</strong> and Chemistry <strong>of</strong> Solids 30, 261<br />
(1969).<br />
[36] A. Kimura, J. Matsuno, J. Okabayashi, A. Fujimori, T. Shishidou,<br />
E. Kulatov, and T. Kanomata, Phys. Rev. B 63, 224420 (2001).<br />
[37] H. Brandle, J. Schoenes, P. Wachter, F. Hulliger, and W. Reim, Applied<br />
<strong>Physics</strong> Letters 56, 2602 (1990).<br />
[38] H. Brandle, J. Schoenes, P. Wachter, F. Hulliger, and W. Reim, Journal<br />
<strong>of</strong> Magnetism and Magnetic Materials 93, 207 (1991).<br />
[39] S. B. Berger and L. Ekstrom, Phys. Rev. Lett. 23, 1499 (1969).<br />
[40] W. J. M<strong>in</strong>iscalco, B. C. McCollum, N. G. St<strong>of</strong>fel, and G. Margaritondo,<br />
Phys. Rev. B 25, 2947 (1982).<br />
[41] W.-L. Lee, S. Watauchi, V. L. Miller, R. J. Cava, and N. P. Ong, Science<br />
303, 1647 (2004).<br />
[42] H. Feil and C. Haas, Phys. Rev. Lett. 58, 65 (1987).<br />
[43] Y. Yao, Y. Liang, D. Xiao, Q. Niu, S.-Q. Shen, X. Dai, and Z. Fang,<br />
Phys. Rev. B 75, 020401 (2007).<br />
[44] N. Ali, M. P. Hill, S. Labroo, and J. E. Greedan, Journal <strong>of</strong> Solid State<br />
Chemistry 83, 178 (1989).<br />
[45] Y. Taguchi, Y. Oohara, H. Yoshizawa, N. Nagaosa, and Y. Tokura,<br />
Science 291, 2573 (2001).<br />
[46] Y. Taguchi, T. Sasaki, S. Awaji, Y. Iwasa, T. Tayama, T. Sakakibara,<br />
S. Iguchi, T. Ito, and Y. Tokura, Phys. Rev. Lett. 90, 257202 (2003).<br />
[47] S. Iguchi, N. Hanasaki, and Y. Tokura, Phys. Rev. Lett. 99, 077202<br />
(2007).<br />
[48] I. V. Solovyev, Phys. Rev. B 67, 174406 (2003).<br />
[49] N. Hanasaki, K. Watanabe, T. Ohtsuka, I. Kézsmárki, S. Iguchi,<br />
S. Miyasaka, and Y. Tokura, Phys. Rev. Lett. 99, 086401 (2007).<br />
67
Chapter 5<br />
Magnetic-order-<strong>in</strong>duced crystal<br />
symmetry lower<strong>in</strong>g resolved by<br />
<strong>optical</strong> phonons<br />
The correlation and entanglement between the charge, sp<strong>in</strong> and lattice degrees<br />
<strong>of</strong> freedom is a the central problem <strong>in</strong> the modern condensed matter<br />
physics. The cross-coupl<strong>in</strong>g between these degrees <strong>of</strong> freedom can lead to<br />
their cooperative order<strong>in</strong>g, like <strong>in</strong> the highlighted family <strong>of</strong> ferroelectrics [1],<br />
materials show<strong>in</strong>g cooperative Jahn-Teller effect [2] or <strong>in</strong> charge/sp<strong>in</strong> density<br />
wave systems [3]. Besides the fundamental <strong>in</strong>terest, the <strong>in</strong>terlock<strong>in</strong>g between<br />
different degrees <strong>of</strong> freedom may open new pathways <strong>in</strong> controll<strong>in</strong>g properties<br />
<strong>of</strong> the material like <strong>in</strong> the well-known case <strong>of</strong> the ferroelectrics, where large<br />
piezoelectricity was discovered [4].<br />
The <strong>in</strong>teraction between the sp<strong>in</strong> and the lattice degrees <strong>of</strong> freedom has<br />
been attract<strong>in</strong>g a lot <strong>of</strong> <strong>in</strong>terest both <strong>in</strong> the context <strong>of</strong> <strong>magneto</strong>elastic <strong>effects</strong><br />
[5] and as a possible mechanism to elim<strong>in</strong>ate the ground state degeneracy<br />
<strong>in</strong> frustrated magnets [6]. Recently, sp<strong>in</strong>-lattice coupl<strong>in</strong>g has been extensively<br />
<strong>in</strong>vestigated both via experimental and theoretical analysis <strong>of</strong> lattice<br />
vibrations <strong>in</strong> frustrated magnets, such as the sp<strong>in</strong>el oxides ZnCr 2 O 4 [7, 8] or<br />
simple transition-metal oxides with rocksalt structure [9]. It turned out that<br />
compet<strong>in</strong>g sp<strong>in</strong>-sp<strong>in</strong> exchange <strong>in</strong>teractions may enhance sp<strong>in</strong>-lattice coupl<strong>in</strong>g.<br />
We extend this study to other members <strong>of</strong> ferrimagnetic chromium sp<strong>in</strong>els,<br />
ACr 2 O 4 , <strong>in</strong> which both the chromium and the A-site cations are magnetic. In<br />
these compounds the frustration is reduced, and complicated magnetic orders<br />
with several magnetic sublattices emerge. We have found that the presence<br />
<strong>of</strong> orbital degrees <strong>of</strong> freedom plays an important role <strong>in</strong> the <strong>magneto</strong>-elastic<br />
<strong>effects</strong> <strong>of</strong> ACr 2 O 4 s.<br />
In the first part <strong>of</strong> this chapter the family <strong>of</strong> the ferrimagnetic ACr 2 O 4<br />
68
chromium sp<strong>in</strong>els is <strong>in</strong>troduced by describ<strong>in</strong>g their lattice structure and their<br />
ordered phases. In the subsequent section the fundamentals <strong>of</strong> the lattice<br />
vibrations and the relation <strong>of</strong> the phonon modes to the symmetry <strong>of</strong> the<br />
crystal are discussed. Then, an overview <strong>of</strong> the literature is given on the<br />
magnetic order <strong>in</strong>duced lattice distortion <strong>in</strong> the frustrated magnet ZnCr 2 O 4 .<br />
F<strong>in</strong>ally, our <strong>in</strong>frared <strong>optical</strong> study on ACr 2 O 4 chromium sp<strong>in</strong>els is presented.<br />
5.1 Crystal structure and ordered phases <strong>of</strong><br />
ACr 2 O 4 sp<strong>in</strong>els<br />
The ACr 2 O 4 chromium sp<strong>in</strong>els have normal cubic sp<strong>in</strong>el structure at high<br />
temperatures belong<strong>in</strong>g to the non-symmorph Fd3m space symmetry group<br />
as shown <strong>in</strong> Fig. 5.1. In this family <strong>of</strong> oxide compounds, octahedrally coord<strong>in</strong>ated<br />
Cr 3+ ions form a network <strong>of</strong> corner shar<strong>in</strong>g tetrahedra, i.e. a pyrochlore<br />
lattice, while the sublattice <strong>of</strong> the tetrahedrally coord<strong>in</strong>ated A 2+ ions has a<br />
diamond structure (see Fig. 5.1).<br />
(a)<br />
(b)<br />
Figure 5.1: (a) The unit cell <strong>of</strong> the cubic sp<strong>in</strong>el lattice [10]. (b) In ACr 2 O 4<br />
chromium sp<strong>in</strong>els, the chromium ions (grey) form a pyrochlore lattice, while<br />
the A-site ions (blue) are located <strong>in</strong> a diamond lattice.<br />
All the chromium-oxide sp<strong>in</strong>els, <strong>in</strong>troduced hereby are <strong>in</strong>sulators. The<br />
nearly cubic crystal field around the chromium cations splits their 3d orbitals<br />
<strong>in</strong>to a t 2g triplet and an e g doublet (see Fig. 5.2). The ground state <strong>of</strong> a s<strong>in</strong>gle<br />
Cr 3+ ion <strong>in</strong> the field <strong>of</strong> the neighbor<strong>in</strong>g oxygen anions is well def<strong>in</strong>ed, it is an<br />
orbital s<strong>in</strong>glet and the sp<strong>in</strong>s <strong>of</strong> the three d-electrons are aligned parallel <strong>in</strong><br />
accordance with Hund’s rule. When the A-site is occupied by a non-magnetic<br />
ion like Zn, Cd, Mg, etc., only the chromium cations have magnetic momentum<br />
correspond<strong>in</strong>g to a S=3/2 sp<strong>in</strong>. Accord<strong>in</strong>g to Goodenough, the direct<br />
Cr-Cr exchange <strong>in</strong>teraction is antiferromagnetic, while the 90 ◦ superexchange<br />
through the anion has a ferromagnetic character [11, 12]. In oxide sp<strong>in</strong>els the<br />
69
antiferromagnetic J Cr−Cr exchange <strong>in</strong>teraction is dom<strong>in</strong>ant. Consequently,<br />
the Curie-Weiss temperature, determ<strong>in</strong>ed from susceptibility measurements,<br />
has a large negative value (Θ CW ≈-400 K) <strong>in</strong> ZnCr 2 O 4 [13]. However, staggered<br />
sp<strong>in</strong> order would lead to unsatisfied bonds s<strong>in</strong>ce the pyrochlore lattice<br />
is not a bipartite one, which leads to a magnetic frustration. The geometry<br />
<strong>of</strong> the lattice results <strong>in</strong> a vast number <strong>of</strong> ground states <strong>in</strong> the classical<br />
limit. This is a direct consequence <strong>of</strong> the degenerate ground state <strong>of</strong> a s<strong>in</strong>gle<br />
tetrahedron, which is the build<strong>in</strong>g block <strong>of</strong> this structure [6, 14]. Below the<br />
Curie-Weiss temperature the sp<strong>in</strong> fluctuations are strongly correlated, but no<br />
long-range order can develop due to the frustrated exchange <strong>in</strong>teraction [15].<br />
In the case <strong>of</strong> frustrated magnets, a secondary <strong>in</strong>teraction frequently removes<br />
the magnetic frustration and selects a unique ground state. In ZnCr 2 O 4 , the<br />
high symmetry <strong>of</strong> the cubic lattice, which is responsible for the frustration,<br />
is removed by a tetragonal lattice distortion at T N =12.5 K as a consequence<br />
<strong>of</strong> the sp<strong>in</strong>-lattice <strong>in</strong>teraction [13].<br />
Another way to release the frustration <strong>of</strong> the pyrochlore sublattice <strong>of</strong> the<br />
Cr 3+ ions is to <strong>in</strong>troduce magnetic ions on the diamond sublattice. The<br />
ACr 2 O 4 sp<strong>in</strong>els with magnetic A-site ions were systematically <strong>in</strong>vestigated<br />
as the 3d levels <strong>of</strong> the A-site cation are filled up. The electron configuration<br />
<strong>of</strong> these cations are shown <strong>in</strong> Fig. 5.2.<br />
CrO 6 Fe 2+ Co 2+ Cu 2+<br />
Cr 3+ AO 4 Mn 2+<br />
Ni 2+<br />
e g<br />
t 2g<br />
t 2<br />
e<br />
Figure 5.2: The d levels <strong>of</strong> the Cr 3+ ion are split <strong>in</strong>to a t 2g triplet and an e g<br />
doublet <strong>in</strong> octahedral coord<strong>in</strong>ation. The ground state <strong>of</strong> the Cr 3+ ion is an<br />
orbital s<strong>in</strong>glet with S=3/2 sp<strong>in</strong>. In the tetrahedral environment <strong>of</strong> the A 2+<br />
ions the order <strong>of</strong> the t 2 triplet and the e doublet are reversed. The groundstate<br />
electron configuration is presented for the A-site ions assum<strong>in</strong>g small<br />
crystal field splitt<strong>in</strong>g compared to the Hund exchange coupl<strong>in</strong>g.<br />
In the tetrahedral crystal field, which has 43m symmetry, the 3d states<br />
are split <strong>in</strong>to a low-ly<strong>in</strong>g e doublet and a high-energy t 2 triplet. The total sp<strong>in</strong><br />
value <strong>of</strong> the A-site cation, S A , decreases by half-<strong>in</strong>teger steps from manganese<br />
with S A =5/2 to copper with S A =1/2. Lyons, Kaplan, Dwight and Menyuk<br />
(LKDM) showed that the control parameter u= 4J Cr−CrS Cr<br />
3J Cr−A S A<br />
determ<strong>in</strong>es the<br />
magnetic ground state <strong>in</strong> these cubic chromite sp<strong>in</strong>els [16]. The u=∞ limit<br />
corresponds to the geometrically frustrated case <strong>of</strong> the ZnCr 2 O 4 , while staggered<br />
Néel order is expected <strong>in</strong> the u
Table 5.1: Transition temperatures <strong>in</strong> various chromium sp<strong>in</strong>els with magnetic<br />
A-site. (T JT corresponds to the Jahn-Teller transition, T C is the ferrimagnetic<br />
transition temperature, below T S a non-coll<strong>in</strong>ear sp<strong>in</strong> structure<br />
develops, and T Lock<strong>in</strong> is the Lock-<strong>in</strong> transition temperature.)<br />
- MnCr 2 O 4 FeCr 2 O 4 CoCr 2 O 4 NiCr 2 O 4 CuCr 2 O 4<br />
T JT - 140 K - 310 K 854 K<br />
T C 51 K 93 K 93 K 74 K 152 K<br />
T S 14 K 35 K 26 K 31 K 152 K<br />
T Lock<strong>in</strong> - - 15 K - -<br />
occurs <strong>in</strong> these sp<strong>in</strong>el compounds at temperatures 51 K
Figure 5.3: The conical sp<strong>in</strong> order develops below T S =26 K <strong>in</strong> CoCr 2 O 4 [17,<br />
18, 19].<br />
degrees <strong>of</strong> freedom as well. In these compounds degeneracy is released by a<br />
cooperative Jahn-Teller distortion. The cubic lattice is distorted to a tetragonal<br />
form with space group I4 1 /amd. The anisotropy <strong>in</strong> the exchange <strong>in</strong>teraction<br />
results <strong>in</strong> a large variety <strong>of</strong> magnetic order<strong>in</strong>gs. FeCr 2 O 4 has a<br />
conical sp<strong>in</strong> order similar to MnCr 2 O 4 and CoCr 2 O 4 [23], while NiCr 2 O 4<br />
and CuCr 2 O 4 exhibit canted antiferromagnetic orders at low temperatures<br />
[24, 25]. The common po<strong>in</strong>t <strong>in</strong> the magnetic ground state for all the <strong>in</strong>vestigated<br />
sp<strong>in</strong>el crystals is the existence <strong>of</strong> two crystallographically <strong>in</strong>equivalent<br />
chromium positions related to the sp<strong>in</strong> pattern, which dist<strong>in</strong>guishes between<br />
the [110] and [110] directions as shown <strong>in</strong> Fig. 5.4. In pr<strong>in</strong>ciple, it means<br />
that via <strong>magneto</strong>elasticity the symmetry <strong>in</strong> each crystal may be lowered to<br />
orthorhombic.<br />
Figure 5.4: In ACr 2 O 4 chromites with magnetic A-site ions (Mn, Fe, Co,<br />
Ni or Cu) – irrespective to the details <strong>of</strong> the sp<strong>in</strong> order – three magnetic<br />
sublattices (A, Cr 1 and Cr 2 ) are present <strong>in</strong> their ferrimagnetic phase.<br />
72
5.2 Symmetry analysis <strong>of</strong> lattice vibrations<br />
<strong>in</strong> crystals with sp<strong>in</strong>el structure<br />
The <strong>in</strong>vestigation <strong>of</strong> lattice dynamics via the determ<strong>in</strong>ation <strong>of</strong> the phonon<br />
frequencies and the selection rules is a sensitive tool to explore the symmetries<br />
<strong>of</strong> the crystal lattice <strong>in</strong> <strong>in</strong>sulat<strong>in</strong>g materials. The pr<strong>in</strong>ciples <strong>of</strong> the symmetry<br />
analysis <strong>of</strong> phonon modes is summarized <strong>in</strong> the present section <strong>in</strong> order to<br />
<strong>in</strong>troduce the effect <strong>of</strong> the symmetry lower<strong>in</strong>g <strong>of</strong> the crystal on the <strong>in</strong>frared<br />
active lattice vibrations.<br />
The spatial symmetries <strong>of</strong> a crystal form a group, the G space group,<br />
which conta<strong>in</strong>s discrete translations <strong>of</strong> the Bravais lattice, T(3), as a normal<br />
subgroup [26]. In the case <strong>of</strong> cubic sp<strong>in</strong>els the space group is the Fd3m, which<br />
belongs to a face-centered cubic lattice (FCC). The symmetry elements <strong>of</strong><br />
the space group are the comb<strong>in</strong>ation <strong>of</strong> t translations and α po<strong>in</strong>t symmetry<br />
elements: {α|t}. In symmorph space groups, every translation is an element<br />
<strong>of</strong> T(3) while it is not the case <strong>in</strong> non-symmorph space groups. The Fd3m is<br />
a non-symmorph space group as it conta<strong>in</strong>s glide planes, where the diagonal<br />
mirror reflection is followed by a translation along τ=[1/4, 1/4, 1/4]. The<br />
G o po<strong>in</strong>t group is def<strong>in</strong>ed as the set <strong>of</strong> the po<strong>in</strong>t symmetries, which is m3m<br />
for cubic sp<strong>in</strong>el crystals.<br />
The elements <strong>of</strong> G commute with the Hamilton operator <strong>of</strong> the lattice<br />
vibrations, H ph . Therefore, they can only mix eigenstates with<strong>in</strong> degenerate<br />
subspaces <strong>of</strong> the Hilbert space [27]:<br />
[H ph , g] = 0 ∀g ∈ G,<br />
H ph ϕ n = E n ϕ n ,<br />
H ph (gϕ n ) = E n (gϕ n ). (5.3)<br />
Apart from an accidental degeneracy, each <strong>of</strong> the degenerate subspaces gives<br />
a basis for an irreducible representation <strong>of</strong> the group, abbreviated as irrep<br />
<strong>in</strong> the follow<strong>in</strong>gs. The dimension <strong>of</strong> the degenerate subspace is equal to<br />
the dimension <strong>of</strong> the irrep and the eigenstates can be labeled by the irreps.<br />
Therefore, fundamental <strong>in</strong>formation can be obta<strong>in</strong>ed from the representation<br />
<strong>of</strong> the space group on atomic displacements without the solution <strong>of</strong> the<br />
eigenvalue problem <strong>of</strong> H ph .<br />
In order to determ<strong>in</strong>e the irreps <strong>of</strong> the lattice vibrations, first we f<strong>in</strong>d<br />
the irreps <strong>of</strong> T(3). The pure translational symmetries, T(3), form a commutative<br />
group, thus all <strong>of</strong> the irreps are one dimensional. They are the<br />
well-known Bloch phase factors: ˆT (R)=e ikR , where ˆT (R) is the operator <strong>of</strong><br />
the translation by a lattice vector R and the correspond<strong>in</strong>g basis vectors are<br />
the Bloch functions, ψ k . The entire space group can be factorized by the<br />
73
normal subgroup, T(3). This factor group is isomorphic to the po<strong>in</strong>t group:<br />
G o<br />
∼ =G/T(3). As a consequence, the {α|t} space group elements, transform<br />
the ψ k Bloch functions to another Bloch state with the wave vector αk [26].<br />
In the center <strong>of</strong> the Brillou<strong>in</strong> zone, k=0, each po<strong>in</strong>t group element leaves the<br />
wave vector <strong>in</strong>variant and the symmetry <strong>of</strong> the Γ po<strong>in</strong>t is the whole po<strong>in</strong>t<br />
group.<br />
The complete determ<strong>in</strong>ation <strong>of</strong> the irreducible representations <strong>of</strong> a space<br />
group is not a simple task <strong>in</strong> general. However, <strong>in</strong>frared spectroscopy probes<br />
lattice vibrations <strong>in</strong> the center <strong>of</strong> the Brillou<strong>in</strong> zone, s<strong>in</strong>ce the typical phonon<br />
energies are <strong>in</strong> the order <strong>of</strong> 100 cm −1 and the momentum <strong>of</strong> the absorbed<br />
photon is negligible compared to the size <strong>of</strong> the Brillou<strong>in</strong> zone, a −1 ∼10 8 cm −1<br />
[28]. This physical consideration simplifies our problem and every irreducible<br />
representation <strong>of</strong> the space group can be written as the product <strong>of</strong> the irreps<br />
<strong>of</strong> G o and the Bloch phase factor which is 1 for the the center <strong>of</strong> the zone<br />
[26]. F<strong>in</strong>ally, we can conclude that the irreps <strong>of</strong> G o completely determ<strong>in</strong>e the<br />
degeneracies <strong>of</strong> the phonon energies and the structure <strong>of</strong> the normal modes.<br />
Now let us focus on the sp<strong>in</strong>el crystals with the space group <strong>of</strong> Fd3m.<br />
For the sake <strong>of</strong> simplicity ion cores are treated classically. In the harmonic<br />
approximation the equation <strong>of</strong> motion for the atoms is given by the eigenvalue<br />
problem <strong>of</strong> the dynamical matrix as follows<br />
H ph = ∑<br />
R n,αν<br />
[p αν (t, R n )] 2<br />
+ ∑<br />
2M ν<br />
ω 2 M ν u αν (ω, R n ) = ∑<br />
R m ,βµ<br />
R n,R m<br />
αν,βµ<br />
1<br />
2 D αν,βµ(R n − R m )u αν (t, R n )u βµ (t, R m ),<br />
D αν,βµ (R n − R m )u βµ (ω, R m ), (5.4)<br />
where u αν (t,R n ) is the α component <strong>of</strong> the displacement <strong>of</strong> the ν atom <strong>in</strong><br />
the unit cell belong<strong>in</strong>g to the R n lattice po<strong>in</strong>t, p αν (t, R n ) is the momentum<br />
at the same po<strong>in</strong>t, and D αν,βµ (R n − R m ) is the dynamical matrix. Accord<strong>in</strong>g<br />
to Bloch’s theorem the solutions <strong>of</strong> the Eqs. 5.4 are plane waves, u ανk (t,R n )<br />
= e ikR n<br />
w αν . The displacement <strong>of</strong> a given basis atom is uniform <strong>in</strong> each<br />
lattice po<strong>in</strong>t and the G/T(3) factor group is represented on the basis functions<br />
w αν for zone-center phonons. The unit cell <strong>of</strong> a cubic sp<strong>in</strong>el conta<strong>in</strong>s<br />
14 ions (see Fig. 5.1.) and each <strong>of</strong> them can move <strong>in</strong> 3 directions, therefore<br />
the atomic displacements give a 42 dimensional basis. S<strong>in</strong>ce the sublattice<br />
positions are transformed to themselves, it is sufficient to treat the sublattices<br />
separately. The problem can be simplified further by not<strong>in</strong>g that the<br />
elements <strong>of</strong> the space group permute different atoms <strong>of</strong> the same sublattice,<br />
while transform<strong>in</strong>g their displacements <strong>in</strong> the same manner. Therefore, the<br />
representation can be given as a tensor product <strong>of</strong> the permutations, D perm<br />
74
Table 5.2: The G/T(3) factor group can be represented on the space <strong>of</strong> atomic<br />
displacements. The characters <strong>of</strong> these representations <strong>in</strong> cubic sp<strong>in</strong>els are<br />
tabulated for each conjugate class.<br />
E 8C 3 6{C 4 |τ} 3C 2 4 6{C 2 |τ} {I|τ} 8{S 6 |τ} 6S 4 3{σ h |τ} 6σ d<br />
D[A(2)] 6 0 0 -2 0 0 0 -2 0 2<br />
D[Cr(4)] 12 0 0 0 -2 -12 0 0 0 2<br />
D[O(8)] 24 0 0 0 0 0 0 0 0 4<br />
and the transformations <strong>of</strong> the local coord<strong>in</strong>ate systems, D α : D perm ⊗D α . The<br />
characters, which are the traces <strong>of</strong> the representation matrices, are shown <strong>in</strong><br />
table 5.2. for each sublattices.<br />
Us<strong>in</strong>g the great orthogonality theorem, the representations can be decomposed<br />
<strong>in</strong>to the sums <strong>of</strong> irreducible representations:<br />
D(A) = T 2g ⊕ T 1u ,<br />
D(Cr) = A 2u ⊕ E u ⊕ 2T 1u ⊕ T 2u ,<br />
D(O) = A 1g ⊕ E g ⊕ T 1g ⊕ 2T 2g ⊕ A 2u ⊕ E u ⊕ 2T 1u ⊕ T 2u . (5.5)<br />
Those phonon modes <strong>in</strong> which the atomic displacements generate electric<br />
polarization are called <strong>in</strong>frared active phonon modes, s<strong>in</strong>ce <strong>in</strong>frared radiation<br />
can excite only these vibrations. The components <strong>of</strong> the polarization<br />
transforms like the x, y and z coord<strong>in</strong>ates, which correspond to the T 1u irrep<br />
<strong>in</strong> cubic sp<strong>in</strong>els (see Fig. 5.5). The T 1u irrep is triply degenerate due<br />
to the equivalence <strong>of</strong> the [100], [010] and [001] directions <strong>in</strong> a cubic crystal.<br />
Although the 5.5 decomposition conta<strong>in</strong>s 5 T 1u irreps, only 4 triply degenerate<br />
<strong>optical</strong> phonon modes are <strong>in</strong>frared active among the 17 lattice vibrations<br />
s<strong>in</strong>ce the acoustic phonon mode correspond<strong>in</strong>g to the translation along the<br />
x, y and z axis also transforms as T 1u .<br />
When the cubic sp<strong>in</strong>el lattice is distorted along the [001] direction, e.g.<br />
due to Jahn-Teller distortion, the number <strong>of</strong> atoms <strong>in</strong> the unit cell do not<br />
change, thus, the same 42 dimensional space describes the phonons <strong>in</strong> the Γ<br />
po<strong>in</strong>t. However, the space group is reduced to the tetragonal I4 1 /amd and<br />
the new po<strong>in</strong>t group is the 4/mmm. Due to the lower<strong>in</strong>g <strong>of</strong> the symmetry<br />
the irreducible representations <strong>of</strong> the cubic lattice may become reducible as<br />
shown <strong>in</strong> Fig. 5.5. Each <strong>in</strong>frared active T 1u mode is split <strong>in</strong>to a doubly<br />
degenerate E u and a non-degenerate A 2u mode, s<strong>in</strong>ce the tetragonal [001]<br />
axis becomes dist<strong>in</strong>ct from the [100] and the [010] directions. (Please note,<br />
that A 2u labels different irreps <strong>in</strong> the po<strong>in</strong>t groups m3m and 4/mmm.) Both<br />
<strong>of</strong> them rema<strong>in</strong> <strong>in</strong>frared active. Furthermore, the silent T 2u phonons become<br />
<strong>in</strong>frared active as they are split <strong>in</strong>to an <strong>in</strong>frared active E u and a silent B 2u<br />
modes. Further distortion <strong>of</strong> the lattice would lead orthorhombic or lower<br />
75
4T 1u (3D)<br />
(x,y,z)<br />
Cubic<br />
4E u (2D) (x,y)<br />
4A 2u (1D) (z)<br />
Tetragonal<br />
4B 1u (1D) (x)<br />
4B 2u (1D) (y)<br />
4A 2u (1D) (z)<br />
Orthorhombic<br />
Figure 5.5: As the symmetry <strong>of</strong> the cubic sp<strong>in</strong>el lattice is lowered to tetragonal<br />
and to orthorhombic the degeneracy <strong>of</strong> the <strong>in</strong>frared active T 1u mode gradually<br />
is lifted.<br />
symmetry. In this case the lattice vibrations become different along the x,<br />
y or z directions and the three-fold degeneracy <strong>of</strong> T 1u modes is completely<br />
lifted.<br />
5.3 Sp<strong>in</strong>-lattice <strong>in</strong>teraction <strong>in</strong> frustrated magnets<br />
The sp<strong>in</strong>-lattice coupl<strong>in</strong>g has been <strong>in</strong>tensively studied <strong>in</strong> ZnCr 2 O 4 , s<strong>in</strong>ce the<br />
magnetic chromium ions form a magnetically frustrated pyrochlore lattice<br />
with antiferromagnetically coupled S=3/2 sp<strong>in</strong>s [13, 6, 7, 8]. In spite <strong>of</strong> the<br />
strong antiferromagnetic coupl<strong>in</strong>g, Θ CW ≈400 K, the magnetic order develops<br />
only below T N =12.5 K [13]. Furthermore, the magnetic order<strong>in</strong>g is accompanied<br />
by a tetragonal lattice distortion. This transition is <strong>of</strong>ten termed as the<br />
sp<strong>in</strong> Jahn-Teller transition for the follow<strong>in</strong>g reasons. The magnetic ground<br />
state <strong>of</strong> the pyrochlore lattice with antiferromagnetic coupl<strong>in</strong>g is a sp<strong>in</strong> liquid<br />
both <strong>in</strong> the classical (S=∞) and <strong>in</strong> the quantum (S=1/2) limit due to the<br />
high symmetry <strong>of</strong> the lattice [29, 30]. In ZnCr 2 O 4 , a structural distortion<br />
lowers the symmetry <strong>of</strong> the sp<strong>in</strong> system through the sp<strong>in</strong>-lattice coupl<strong>in</strong>g,<br />
by which a unique ground state is selected analogously to the loss <strong>of</strong> orbital<br />
degeneracy <strong>in</strong> the Jahn-Teller effect.<br />
The possible orig<strong>in</strong> <strong>of</strong> the sp<strong>in</strong>-lattice coupl<strong>in</strong>g is the spatial dependence<br />
76
<strong>of</strong> the J(r nm ) exchange <strong>in</strong>teraction between sp<strong>in</strong>s on the n and m sites:<br />
J(r nm )S n S m = {J o + ∂J [u α (R n ) − u α (R m )]<br />
∂r α<br />
+ 1 ∂ 2 J<br />
[u α (R n ) − u α (R m )][u β (R n ) − u β (R m )] + . . .}S n S m .<br />
2 ∂r α ∂r β<br />
(5.6)<br />
The terms l<strong>in</strong>ear <strong>in</strong> the atomic displacements shift the equilibrium positions<br />
and may cause symmetry lower<strong>in</strong>g via a static distortion. For a s<strong>in</strong>gle tetrahedron<br />
with 43m symmetry, which is the build<strong>in</strong>g block <strong>of</strong> the pyrochlore<br />
lattice, Tchernyshyov and his coworkers showed that the E type vibrational<br />
mode couples to the ground state manifold through the ∂ α J term [6, 14].<br />
Roughly speak<strong>in</strong>g, this vibration compresses and elongates the tetrahedron<br />
along a pr<strong>in</strong>cipal axis, say [001], and the energy <strong>of</strong> the bonds perpendicular to<br />
[001] will be different from the other four bonds. As the tetragonal distortion<br />
becomes static, a coll<strong>in</strong>ear or a coplanar antiferromagnetic order is selected<br />
depend<strong>in</strong>g on the sign <strong>of</strong> ∂ α J. A coll<strong>in</strong>ear arrangement is shown <strong>in</strong> Fig. 5.6.<br />
b. The authors constructed a Landau theory for the whole pyrochlore lattice<br />
and they found that a plethora <strong>of</strong> ground sates with different coll<strong>in</strong>ear<br />
and coplanar sp<strong>in</strong> structures emerge on the tetragonally distorted lattice.<br />
X-ray and neutron diffraction studies confirmed the tetragonal distortion <strong>in</strong><br />
ZnCr 2 O 4 [13, 31]. However, the recently observed non-coll<strong>in</strong>ear sp<strong>in</strong> structure<br />
is not consistent with either <strong>of</strong> the theoretically proposed models, which<br />
<strong>in</strong>dicates the importance <strong>of</strong> the antisymmetric or further neighbor exchange<br />
<strong>in</strong>teractions [31].<br />
Figure 5.6: (a) The left panel represents one <strong>of</strong> the T 1u normal modes which<br />
modulates the Cr-Cr exchange path. (b) A possible sp<strong>in</strong> Jahn-Teller order<strong>in</strong>g<br />
on a compressed tetrahedron: the four shorter bonds are satisfied, while the<br />
two longer ones are still frustrated [7].<br />
The tetragonal distortion <strong>in</strong> ZnCr 2 O 4 has been observed <strong>in</strong> the anisotropy<br />
<strong>of</strong> the <strong>in</strong>frared active phonon modes as well [7]. Among the four <strong>in</strong>frared ac-<br />
77
tive lattice vibrations the second mode shows large splitt<strong>in</strong>g upon the magnetic<br />
phase transition (see Fig. 5.7.). The exact determ<strong>in</strong>ation <strong>of</strong> the normal<br />
coord<strong>in</strong>ates by first-pr<strong>in</strong>ciple calculations <strong>in</strong>dicated that <strong>in</strong> the phonon mode<br />
around E≈372 cm −1 mostly the modulation <strong>of</strong> the Cr-Cr direct exchange<br />
path is <strong>in</strong>volved as presented <strong>in</strong> Fig. 5.6. a [8].<br />
Figure 5.7: The blue curve is the far <strong>in</strong>frared reflectivity spectrum <strong>of</strong> ZnCr 2 O 4<br />
at T≈10 K, while the black one is the difference <strong>in</strong> the reflectivity recorded at<br />
T≈13.5 K and at T≈10 K (above and below the order<strong>in</strong>g temperature). The<br />
four ma<strong>in</strong> structures <strong>in</strong> the reflectivity correspond to the four <strong>in</strong>frared active<br />
T 1u phonons. The <strong>in</strong>set demonstrates the splitt<strong>in</strong>g <strong>of</strong> the second phonon mode<br />
by compar<strong>in</strong>g the low (blue) and the high temperature (red) reflectivity spectra<br />
[7].<br />
The sp<strong>in</strong>-phonon <strong>in</strong>teraction can be derived from the second order term<br />
<strong>in</strong> the spatial dependence <strong>of</strong> the exchange <strong>in</strong>teraction (see Eq. 5.6) [7, 32].<br />
This gives an additional term to the dynamical matrix<br />
δD α,β (R n − R m ) =<br />
∂ 2 J<br />
∂u α (R n )∂u β (R m ) S nS m , (5.7)<br />
where the sublattice <strong>in</strong>dexes are neglected for the sake <strong>of</strong> simplicity. In the<br />
model system shown <strong>in</strong> Fig. 5.6 b, the anisotropy <strong>of</strong> the phonon frequencies<br />
arise from the <strong>in</strong>equivalence between the <strong>in</strong>plane bonds (1-2 and 3-4) and<br />
the other four bonds. In accordance with this simple model, the analysis <strong>of</strong><br />
<strong>in</strong>frared phonon modes <strong>in</strong> ZnCr 2 O 4 supported the follow<strong>in</strong>g proportionality:<br />
ω x − ω z = γ⟨S 1 S 2 − S 1 S 3 ⟩, (5.8)<br />
78
where the value <strong>of</strong> the γ prefactor is consistent with the static distortion [7].<br />
Beyond the example <strong>in</strong>troduced above, the frustration-<strong>in</strong>duced lattice<br />
distortion and anisotropic lattice vibrational properties appear commonly.<br />
Similar <strong>effects</strong> have been found <strong>in</strong> the sister compounds <strong>of</strong> ZnCr 2 O 4 , <strong>in</strong>clud<strong>in</strong>g<br />
CdCr 2 O 4 , HgCr 2 O 4 , MgCr 2 O 4 [33, 34] and even <strong>in</strong> simple transition metal<br />
oxides with rocksalt structure [35, 9].<br />
5.4 Infrared active phonon modes <strong>in</strong> ACr 2 O 4<br />
chromium sp<strong>in</strong>els<br />
S<strong>in</strong>gle crystals <strong>of</strong> ACr 2 O 4 (A=Mn, Fe, Co, Ni and Cu) were grown by Dr. K.<br />
Ohgushi by a chemical vapor transport method with typical dimensions <strong>of</strong><br />
300-600 µm. The temperature dependence <strong>of</strong> the normal <strong>in</strong>cidence reflectivity<br />
spectra were measured on the (111) surface with a Fourier transform <strong>in</strong>frared<br />
spectrometer (Bruker IFS 66/v) coupled to a microscope (Burker Hyperion)<br />
over the photon energy range <strong>of</strong> ω=100-16000 cm −1 . To facilitate proper<br />
Kramers-Kronig transformation, reflectivity measurements were extended up<br />
to ω=320000 cm −1 at room temperature and up to ω=40000 cm −1 at low<br />
temperatures by K. Ohgushi us<strong>in</strong>g grat<strong>in</strong>g spectrometers.<br />
In the experiments as-grown surfaces <strong>of</strong> the crystals were studied <strong>in</strong> order<br />
to avoid artificial change <strong>of</strong> the phonon spectra caused by a polish<strong>in</strong>g-<strong>in</strong>duced<br />
stra<strong>in</strong>. In case <strong>of</strong> FeCr 2 O 4 and CoCr 2 O 4 , the surface were flat and sh<strong>in</strong>y and<br />
reflectivity was measured with the accuracy <strong>of</strong> ∼1%, while the surface <strong>of</strong><br />
the CuCr 2 O 4 consisted <strong>of</strong> small terraces, which caused ∼2-3% uncerta<strong>in</strong>ty <strong>in</strong><br />
the value <strong>of</strong> the absolute reflectivity. The surface roughness <strong>of</strong> the MnCr 2 O 4<br />
and the NiCr 2 O 4 crystals demanded to use polished samples as well, and the<br />
reflectivity <strong>of</strong> the as-grown samples were normalized to those.<br />
Figure 5.8 compares the reflectivity <strong>of</strong> all the <strong>in</strong>vestigated chromium<br />
sp<strong>in</strong>el oxides <strong>in</strong> their ground state as measured at T=10 K. The detailed<br />
temperature dependence <strong>of</strong> the reflectivity is shown <strong>in</strong> the Appendix. In<br />
Fig. 5.8 a, four dist<strong>in</strong>ct excitations correspond<strong>in</strong>g to the four <strong>in</strong>frared active<br />
fonon modes can be observed <strong>in</strong> the spectra <strong>of</strong> the MnCr 2 O 4 and the<br />
CoCr 2 O 4 even at T=10 K, whereas the reflectivity for the other three compounds<br />
(see Fig. 5.8 b) conta<strong>in</strong>s additional features <strong>in</strong>dicat<strong>in</strong>g the lower<strong>in</strong>g<br />
<strong>of</strong> the cubic symmetry. The high energy part <strong>of</strong> the reflectivity shows that<br />
the O 2p → Cr,A 3d charge transfer excitations, which determ<strong>in</strong>e the gap,<br />
are located between ω=10000-20000 cm −1 .<br />
To analyze these results <strong>in</strong> more details, the <strong>optical</strong> conductivity spectra<br />
were calculated from the reflectivity with Kramers-Kronig transformation<br />
79
Reflectivity<br />
Reflectivity<br />
1.0<br />
0.8<br />
0.6<br />
0.4<br />
0.2<br />
0.0<br />
0.8 CuCr 2<br />
O 4<br />
0.6<br />
FeCr 2<br />
O 4<br />
NiCr 2<br />
O 4<br />
0.4<br />
0.2<br />
(a)<br />
T=10K<br />
(b) T=10K<br />
CoCr 2<br />
O 4<br />
MnCr 2<br />
O 4<br />
0.0<br />
100 200 300 400 500 600 700<br />
Wavenumber (cm -1 )<br />
Figure 5.8: (a) Reflectivity spectra <strong>of</strong> MnCr 2 O 4 and CoCr 2 O 4 at the lowest<br />
temperature, T=10 K. (b) Reflectivity spectra <strong>of</strong> the Jahn-Teller active<br />
compounds, FeCr 2 O 4 , NiCr 2 O 4 and CuCr 2 O 4 at T=10 K.<br />
(see Figs. 5.9, 5.10, 5.13, 5.15 and 5.17). The <strong>optical</strong> conductivity spectrum<br />
has the advantage that usually it can be decomposed as a sum <strong>of</strong> peaks,<br />
while the reflectivity has a far more complicated structure <strong>in</strong> the vic<strong>in</strong>ity <strong>of</strong> an<br />
excitation as shown <strong>in</strong> chapter 3. The detailed temperature dependence <strong>of</strong> the<br />
<strong>optical</strong> conductivity spectra are given <strong>in</strong> the Appendix for each compound.<br />
If the <strong>in</strong>verse lifetime, γ i =1/τ i , is smaller than the frequency <strong>of</strong> the fonon<br />
mode, ω oi , the <strong>optical</strong> conductivity can be well described with a sum <strong>of</strong><br />
Lorentzian peaks:<br />
(<br />
σ = ω ε ∞ − 1 + ∑ )<br />
S i<br />
i<br />
ω 2 i oi − , (5.9)<br />
ω2 − iωγ i<br />
where S i is the oscillator strength, which is proportional to the electric dipole<br />
matrix element <strong>of</strong> the correspond<strong>in</strong>g excitation, and ε ∞ is the background<br />
dielectric constant due to the electron excitations at higher energies [36].<br />
The <strong>optical</strong> conductivity <strong>of</strong> MnCr 2 O 4 and CoCr 2 O 4 are shown <strong>in</strong> Fig. 5.9<br />
and 5.10, respectively, both at 10 K and 300 K. In agreement with the group<br />
theoretical calculation, four phonon modes were observed <strong>in</strong> the cubic paramagnetic<br />
phase at T=300 K. The frequency dependence <strong>of</strong> the <strong>optical</strong> conductivity<br />
was fitted by the expression 5.9 for each temperature and the phonon<br />
80
-1 cm<br />
-1 )<br />
Conductivity (<br />
200 (a)<br />
(b)<br />
300K<br />
300K 3 (300K)=470cm-1<br />
10K<br />
10K<br />
150 (300K)=375cm -1<br />
3 (10K)=471cm-1<br />
100<br />
50<br />
2 (10K)=377cm-1<br />
(300K)=194cm -1<br />
1 (10K)=198cm-1 4 (300K)=599cm-1<br />
4 (10K)=602cm-1<br />
0<br />
180 270 360<br />
Wavenumber (cm -1 )<br />
450 500 550 600<br />
Wavenumber (cm -1 )<br />
2500<br />
2000<br />
1500<br />
1000<br />
500<br />
0<br />
Figure 5.9: The <strong>optical</strong> conductivity <strong>of</strong> MnCr 2 O 4 conta<strong>in</strong>s four <strong>in</strong>frared active<br />
phonon modes at T=300 K and T=10 K as well.<br />
-1 cm<br />
-1 )<br />
Conductivity (<br />
60 (a)<br />
(b)<br />
300K<br />
300K 3 (300K)=485cm-1<br />
10K<br />
10K<br />
3<br />
50<br />
30<br />
(300K)=197cm -1<br />
1 (10K)=197cm-1 4 (300K)=606cm-1<br />
40<br />
(300K)=378cm -1<br />
2 (10K)=382cm-1<br />
20<br />
10<br />
200 300 400<br />
Wavenumber (cm -1 )<br />
4 (10K)=610cm-1<br />
480 560 640<br />
Wavenumber (cm -1 )<br />
1000<br />
900<br />
800<br />
700<br />
600<br />
500<br />
400<br />
300<br />
200<br />
100<br />
0<br />
Figure 5.10: The <strong>optical</strong> conductivity <strong>of</strong> CoCr 2 O 4 conta<strong>in</strong>s four <strong>in</strong>frared active<br />
phonon modes both at T=300 K and T=10 K<br />
resonance frequencies were plotted as a function <strong>of</strong> temperature <strong>in</strong> Fig. 5.11<br />
and 5.12. With the decrease <strong>of</strong> the temperature the phonon lifetime <strong>in</strong>creases<br />
and the frequencies are shifted towards higher energies due to the harden<strong>in</strong>g<br />
<strong>of</strong> the lattice. However, we could not resolve any splitt<strong>in</strong>g (<strong>in</strong>duced by<br />
anisotropy) <strong>in</strong> the lattice dynamics with<strong>in</strong> the resolution <strong>of</strong> our experiment,<br />
∆ω=1 cm −1 . Therefore, we have concluded that MnCr 2 O 4 and CoCr 2 O 4<br />
rema<strong>in</strong>s nearly cubic down to the lowest temperature.<br />
At room temperature FeCr 2 O 4 is cubic and paramagnetic. Similarly to<br />
the compounds discussed above, four phonon modes can be observed <strong>in</strong> its<br />
81
Wavenumber (cm -1 )<br />
603<br />
602<br />
601<br />
600<br />
599<br />
473<br />
472<br />
471<br />
379<br />
378<br />
377<br />
376<br />
375<br />
198<br />
196<br />
194<br />
0 50 100 150 200 250 300<br />
T S<br />
T C<br />
192<br />
0 50 100 150 200 250 300<br />
Temperature (K)<br />
Figure 5.11: Temperature dependence <strong>of</strong> the phonon frequencies <strong>in</strong> MnCr 2 O 4 .<br />
Neither the ferrimagnetic phase transition at T c =51 K nor the appearance <strong>of</strong><br />
the conical sp<strong>in</strong> order at T S =14 K have an observable <strong>in</strong>fluence on the phonon<br />
frequencies.<br />
<strong>optical</strong> conductivity spectra as shown <strong>in</strong> Fig. 5.13. However, the lowest energy<br />
mode is clearly split upon the subsequent Jahn-Teller and ferrimagnetic<br />
phase transitions. Moreover, the highest energy mode seems to be anomalously<br />
broadened as the temperature is decreased.<br />
82
Wavenumber (cm -1 )<br />
610<br />
608<br />
606<br />
488<br />
487<br />
486<br />
485<br />
382<br />
380<br />
378<br />
200<br />
198<br />
196<br />
0 50 100 150 200 250 300<br />
T S<br />
T C<br />
0 50 100 150 200 250 300<br />
Temperature (K)<br />
Figure 5.12: Temperature dependence <strong>of</strong> the phonon frequencies <strong>in</strong> CoCr 2 O 4 .<br />
Neither the ferrimagnetic phase transition at T c =93 K nor the appearance <strong>of</strong><br />
the conical sp<strong>in</strong> order at T S =26 K affect the phonon frequencies.<br />
-1<br />
Conductivity ( cm<br />
-1 )<br />
50<br />
40<br />
30<br />
20<br />
10<br />
(a)<br />
300K<br />
T JT<br />
=150K<br />
150K<br />
T C<br />
=90K<br />
90K<br />
T S<br />
=35K<br />
10K<br />
120 (b)<br />
(c)<br />
100<br />
80<br />
60<br />
40<br />
20<br />
1600<br />
1400<br />
1200<br />
1000<br />
800<br />
600<br />
400<br />
200<br />
0<br />
150 200 250<br />
Wavenumber (cm -1 )<br />
0<br />
250 300 350 400<br />
Wavenumber (cm -1 )<br />
450 500 550 600<br />
Wavenumber (cm -1 )<br />
0<br />
Figure 5.13: The <strong>optical</strong> conductivity <strong>of</strong> FeCr 2 O 4 <strong>in</strong> the region <strong>of</strong> the <strong>in</strong>frared<br />
active phonon modes at several temperatures. The crystal symmetry lower<strong>in</strong>g<br />
is clearly evidenced by the splitt<strong>in</strong>g <strong>of</strong> the lowest energy phonon.<br />
83
For a rigorous analysis, the <strong>optical</strong> conductivity was also fitted by Lorentz<br />
oscillators <strong>in</strong> this case. The temperature dependence <strong>of</strong> the phonon frequencies<br />
can be followed <strong>in</strong> Fig. 5.14. Out <strong>of</strong> the four triply degenerate T 1u modes,<br />
only the first and the fourth modes were split <strong>in</strong> the ferrimagnetic phase,<br />
whose degeneracy were partly already lifted upon the Jahn-Teller transition.<br />
Wavenumber (cm -1 )<br />
598<br />
596<br />
594<br />
592<br />
590<br />
588<br />
586<br />
474<br />
473<br />
374<br />
373<br />
190<br />
180<br />
170<br />
160<br />
150<br />
140<br />
0 50 100 150 200 250 300<br />
T S<br />
T C<br />
T JT<br />
0 50 100 150 200 250 300<br />
Temperature (K)<br />
Figure 5.14: The temperature dependence <strong>of</strong> the phonon frequencies <strong>in</strong><br />
FeCr 2 O 4 . The highest and the lowest energy phonon modes are split upon<br />
the Jahn-Teller and the ferrimagnetic phase transitions at T JT =140 K and<br />
T c =93 K, respectively.<br />
The cubic to tetragonal distortion <strong>in</strong> NiCr 2 O 4 is just above room temperature<br />
at T JT =310 K. Thus, the NiCr 2 O 4 sample was warmed up to T=335 K<br />
to identify the effect <strong>of</strong> Jahn-Teller transition. The <strong>optical</strong> conductivity is<br />
shown at various temperatures <strong>in</strong> Fig. 5.15. At the highest temperature<br />
the presence <strong>of</strong> four <strong>in</strong>frared active phonons <strong>in</strong>dicates the cubic sp<strong>in</strong>el structure.<br />
In the Jahn-Teller phase, beside the strong splitt<strong>in</strong>g <strong>of</strong> the phonon<br />
frequencies around ω 3 ∼470 cm −1 and ω 4 ∼600 cm −1 , a fifth mode appears<br />
at ω ≈540 cm −1 <strong>in</strong> addition to the other vibrations. Therefore, it cannot<br />
be identified with either <strong>of</strong> the cubic T 1u phonons, <strong>in</strong>stead it is one <strong>of</strong> the<br />
84
two T 2u modes silent <strong>in</strong> the cubic phase, which is split <strong>in</strong>to a non-degenerate<br />
silent B 2u and a double degenerate <strong>in</strong>frared active E u mode when the lattice<br />
symmetry is lowered.<br />
-1<br />
Conductivity ( cm<br />
-1 )<br />
40<br />
30<br />
20<br />
10<br />
0<br />
(a)<br />
335K<br />
T JT<br />
=310K<br />
100K<br />
T C<br />
=75K<br />
40K<br />
T S<br />
=31K<br />
10K<br />
200 250 300 350 400<br />
Wavenumber (cm -1 )<br />
(b)<br />
-1 cm<br />
-1 )<br />
Conductivity (<br />
35<br />
30<br />
25<br />
20<br />
15<br />
520 540 560<br />
Wavenumber (cm -1 )<br />
450 500 550 600 650 0 50<br />
Wavenumber (cm -1 )<br />
450<br />
400<br />
350<br />
300<br />
250<br />
200<br />
150<br />
100<br />
Figure 5.15: The <strong>optical</strong> conductivity <strong>of</strong> NiCr 2 O 4 conta<strong>in</strong>s four <strong>in</strong>frared active<br />
phonon modes around T≥300 K, while several new resonances appear at the<br />
lowest temperature, at T=10 K.<br />
The detailed analysis <strong>of</strong> the <strong>optical</strong> conductivity (see Fig. 5.16.) revealed<br />
that both <strong>of</strong> the silent T 2u modes become <strong>in</strong>frared active. The appearance<br />
<strong>of</strong> three peaks around ω 3 ∼470 cm −1 below T≤250 K can be <strong>in</strong>terpreted only<br />
by the onset <strong>of</strong> the other <strong>in</strong>frared forbidden T 2u phonon, which is also split<br />
and becomes partially active. Although at T=300 K the sample is already<br />
<strong>in</strong> the tetragonal phase neither <strong>of</strong> the activated modes was visible. Possibly<br />
their oscillator strengths were too small, s<strong>in</strong>ce they orig<strong>in</strong>ate from the hybridization<br />
with the orig<strong>in</strong>ally <strong>in</strong>frared active phonons. As the temperature<br />
is lowered below the ferrimagnetic transition, the excitation branch around<br />
ω 3 ∼470 cm −1 is split further, which reflects the presence <strong>of</strong> <strong>magneto</strong>-elastic<br />
<strong>effects</strong>. F<strong>in</strong>ally, we note that the frequency <strong>of</strong> the lowest energy phonon<br />
shows a red shift anomalously with decreas<strong>in</strong>g temperature. The s<strong>of</strong>ten<strong>in</strong>g<br />
<strong>of</strong> this phonon mode upon the Jahn-Teller transition was previously reported<br />
by Siratori [37].<br />
85
Wavenumber (cm -1 )<br />
0 50 100 150 200 250 300<br />
604<br />
600<br />
596<br />
552<br />
546<br />
540<br />
492<br />
488<br />
484<br />
480<br />
476<br />
472<br />
468<br />
464<br />
376<br />
372<br />
176<br />
T S<br />
T C<br />
172<br />
0 50 100 150 200 250 300<br />
Temperature (K)<br />
Figure 5.16: The temperature dependence <strong>of</strong> the phonon frequencies <strong>in</strong><br />
NiCr 2 O 4 . Beside the splitt<strong>in</strong>g <strong>of</strong> the fourth (dark green) and the third (red)<br />
phonon modes, two silent modes (green and orange) become <strong>in</strong>frared active<br />
<strong>in</strong> the Jahn-Teller phase. Upon the ferrimagnetic transition at T c =74 K only<br />
the third mode and one <strong>of</strong> the orig<strong>in</strong>ally silent modes are split.<br />
T JT<br />
F<strong>in</strong>ally, the <strong>optical</strong> conductivity <strong>of</strong> CuCr 2 O 4 is displayed <strong>in</strong> Fig. 5.17<br />
at several temperatures below the cubic-to-tetragonal transition. The high<br />
Jahn-Teller temperature, T JT =854 K, <strong>in</strong>hibited the <strong>in</strong>vestigation <strong>of</strong> the cubic<br />
phase <strong>of</strong> CuCr 2 O 4 . The reduction <strong>of</strong> the symmetry can be discerned for<br />
the low-energy phonon modes around ω 1 ∼140 cm −1 and ω 2 ≈370 cm −1 (see<br />
Fig. 5.17 a). At room temperature <strong>in</strong> the paramagnetic tetragonal phase<br />
the double peak structure <strong>of</strong> the resonances reflect that the tetragonal axis is<br />
dist<strong>in</strong>guished by the distortion. The development <strong>of</strong> the canted ferrimagnetic<br />
order lowers the symmetry further and splits the phonon frequencies <strong>in</strong>to<br />
three.<br />
86
-1 cm<br />
-1 )<br />
50<br />
40<br />
30<br />
(a)<br />
300K<br />
150K<br />
T S<br />
=130K<br />
10K<br />
(b)<br />
1000<br />
800<br />
600<br />
Conductivity (<br />
20<br />
10<br />
0<br />
100 200 300 400<br />
Wavenumber (cm -1 )<br />
400<br />
500 550 600 650 0 200<br />
Wavenumber (cm -1 )<br />
Figure 5.17: The <strong>optical</strong> conductivity <strong>of</strong> CuCr 2 O 4 at several temperatures.<br />
The phonon frequencies show partial splitt<strong>in</strong>g already at room temperature<br />
due to the Jahn-Teller distortion.<br />
The map <strong>of</strong> the phonon frequencies as a the function <strong>of</strong> temperature is<br />
shown <strong>in</strong> Fig. 5.18. At room temperature the <strong>optical</strong> conductivity can be<br />
fitted by the sum <strong>of</strong> eight Lorentzian peaks imply<strong>in</strong>g that all <strong>of</strong> the <strong>in</strong>frared<br />
active phonon modes are split <strong>in</strong>to two accord<strong>in</strong>g to T 1u →E u ⊕A 2u as a consequence<br />
<strong>of</strong> the Jahn-Teller distortion. The degeneracy <strong>of</strong> the E u modes is<br />
lifted by the subsequent magnetic phase transition <strong>in</strong> each phonon branch.<br />
87
Wavenumber (cm -1 )<br />
0 50 100 150 200 250 300<br />
605<br />
600<br />
595<br />
567<br />
564<br />
560<br />
555<br />
550<br />
507<br />
504<br />
501<br />
380<br />
370<br />
T S<br />
330<br />
315<br />
300<br />
195<br />
190<br />
185<br />
135<br />
130<br />
125<br />
120<br />
0 50 100 150 200 250 300<br />
Temperature (K)<br />
Figure 5.18: The temperature dependence <strong>of</strong> the phonon frequencies <strong>in</strong><br />
CuCr 2 O 4 . All <strong>of</strong> the phonon frequencies are split at room temperature by<br />
the Jahn-Teller distortion. The appearance <strong>of</strong> the canted antiferromagnetic<br />
structure is accompanied by a further lower<strong>in</strong>g <strong>of</strong> the symmetry. The degeneracy<br />
<strong>of</strong> the lattice vibrations are fully lifted.<br />
We have compared the frequencies <strong>of</strong> the vibrations at room temperature<br />
as a function <strong>of</strong> the atomic mass on the A-site as shown <strong>in</strong> Fig. 5.19. In<br />
the case <strong>of</strong> CuCr 2 O 4 the average <strong>of</strong> the phonon frequencies, (ω Eu +ω A2u )/2<br />
were plotted, s<strong>in</strong>ce the Jahn-Teller distortion at T=854 K results <strong>in</strong> highly<br />
anisotropic vibrations already at room temperature. This comparison obviously<br />
neglects the variation <strong>in</strong> the <strong>in</strong>teratomic forces, which is probably<br />
affected by the change <strong>of</strong> the cation A. The third mode is monotonously<br />
hardened as the mass <strong>of</strong> the A-site cation <strong>in</strong>creases, thus, the correspond<strong>in</strong>g<br />
normal coord<strong>in</strong>ates may conta<strong>in</strong> the motion <strong>of</strong> the A-sites to a large<br />
extent. The highest frequency is almost constant, therefore, this mode may<br />
dom<strong>in</strong>antly <strong>in</strong>volve the vibration <strong>of</strong> the oxygen and chromium ions. The<br />
second mode is aga<strong>in</strong> almost <strong>in</strong>dependent <strong>of</strong> the mass <strong>of</strong> the A-site, except<br />
for A=Cu, where the averaged frequency may not capture the dynamics correctly.<br />
This implies that this mode ma<strong>in</strong>ly conta<strong>in</strong>s the displacements <strong>of</strong> the<br />
88
chromium and oxygen ions as well, which is <strong>in</strong> accordance with first pr<strong>in</strong>ciple<br />
calculations [8]. The first mode does not show any clear tendency. These systematics<br />
can serve as a basis <strong>of</strong> a lattice dynamical calculation <strong>in</strong> the future<br />
<strong>in</strong> order to understand the <strong>magneto</strong>-elasticity <strong>of</strong> this family.<br />
o / Mn<br />
1,04<br />
1,00<br />
1,08<br />
1,04<br />
1,00<br />
1,00<br />
0,96<br />
1,0<br />
0,9<br />
Mn 2+ Fe 2+ Ni 2+ Co 2+<br />
Cu 2+ Zn 2+<br />
1,04<br />
1,00<br />
1,08<br />
1,04<br />
1,00<br />
1,00<br />
0,96<br />
0,8<br />
0,8<br />
54 56 58 60 62 64 66<br />
Atomic mass <strong>of</strong> the ion A 2+ (g/mol)<br />
Figure 5.19: Phonon frequencies <strong>in</strong> MnCr 2 O 4 , FeCr 2 O 4 , CoCr 2 O 4 , NiCr 2 O 4<br />
and CuCr 2 O 4 (normalized by those <strong>in</strong> MnCr 2 O 4 ) are shown as a function <strong>of</strong><br />
the atomic mass <strong>of</strong> the A-site cation at room temperature. The frequency <strong>of</strong><br />
the third (red) mode monotonously <strong>in</strong>creases, hence, its normal coord<strong>in</strong>ate<br />
conta<strong>in</strong>s the motion <strong>of</strong> the A-site cation. The second (blue) and the fourth<br />
(green) modes are less affected, these may only <strong>in</strong>volve the motion <strong>of</strong> the<br />
chromium and oxygen ions.<br />
F<strong>in</strong>ally, we have concluded that only those ACr 2 O 4 chromium sp<strong>in</strong>els<br />
show <strong>magneto</strong>-elastic effect uppon the magnetic phase transition, which also<br />
undergo the Jahn-Teller distortion, i.e. <strong>in</strong> which the A-site cation has an orbital<br />
degree <strong>of</strong> freedom <strong>in</strong> the cubic phase. Additionally, only those <strong>in</strong>frared<br />
active phonon modes were split by the magnetic phase transitions, whose<br />
degeneracy was already lifted by the tetragonal distortion. The complete<br />
lift<strong>in</strong>g <strong>of</strong> the degeneracy implies that the symmtery is reduced at least to orthorhombic<br />
<strong>in</strong> the magnetic phase. In ZnCr 2 O 4 the second phonon mode was<br />
the unique <strong>in</strong>dicator <strong>of</strong> the magnetic phase transition, s<strong>in</strong>ce it modulates the<br />
Cr-Cr direct exchange path, while <strong>in</strong> the case <strong>of</strong> magnetic A-site chromites<br />
this mode was split only <strong>in</strong> CuCr 2 O 4 , where all <strong>of</strong> the T 1u vibrations were sensitive<br />
to the magnetic order<strong>in</strong>g. These f<strong>in</strong>d<strong>in</strong>gs <strong>in</strong>dicate that the anisotropy<br />
<strong>of</strong> the lattice dynamics has a different orig<strong>in</strong> <strong>in</strong> ACr 2 O 4 chromium sp<strong>in</strong>els<br />
as compared to ZnCr 2 O 4 , where the frustration drives the sp<strong>in</strong> Jahn-Teller<br />
89<br />
1,0<br />
0,9
distortion.<br />
Possibly <strong>in</strong> these compounds it is the <strong>in</strong>terplay <strong>of</strong> the sp<strong>in</strong>-orbit coupl<strong>in</strong>g<br />
and the Jahn-Teller effect that is important. This is supported by the remarkable<br />
contrast between CoCr 2 O 4 with nearly isotropic lattice dynamics<br />
and CuCr 2 O 4 <strong>in</strong> which each phonon mode exhibits a pronounced splitt<strong>in</strong>g.<br />
In the former one, the orbital moment <strong>of</strong> Co 2+ ion is quenched and the sp<strong>in</strong>orbit<br />
<strong>in</strong>teraction is weak, s<strong>in</strong>ce it is only able to mix states separated by the<br />
large tetrahedral crystal field, while <strong>in</strong> CuCr 2 O 4 the sp<strong>in</strong>-orbit <strong>in</strong>teraction<br />
is more effective as it competes only with the smaller tetragonal component<br />
<strong>of</strong> the crystal field with<strong>in</strong> the t 2 subspace. Moreover, recently Ohtani et<br />
al. have reported that the crystal symmetry <strong>of</strong> FeCr 2 O 4 is orthorhombic <strong>in</strong><br />
the magnetically ordered phase accord<strong>in</strong>g to their x-ray diffraction study <strong>in</strong><br />
agreement with our f<strong>in</strong>d<strong>in</strong>gs [38]. To expla<strong>in</strong> their results they developed<br />
a s<strong>in</strong>gle-ion model, which <strong>in</strong>cludes the sp<strong>in</strong>-orbit coupl<strong>in</strong>g on the Fe 2+ ion<br />
and the distortion <strong>of</strong> neighbor<strong>in</strong>g oxygen tetrahedra. The mean field <strong>of</strong> the<br />
surround<strong>in</strong>g magnetic moments fixes the direction <strong>of</strong> the sp<strong>in</strong> and via the<br />
sp<strong>in</strong>-orbit <strong>in</strong>teraction it also polarizes the orbitals, which competes with the<br />
Jahn-Teller transition.<br />
90
References<br />
[1] T. Kimura, Annual Review <strong>of</strong> Materials Research 37, 387 (2007).<br />
[2] A. J. Millis, Phys. Rev. B 53, 8434 (1996).<br />
[3] G. Grüner, Density waves <strong>in</strong> <strong>solids</strong>, Frontiers <strong>in</strong> <strong>Physics</strong> (Perseus Pub.,<br />
2000).<br />
[4] D. Damjanovic, Reports on Progress <strong>in</strong> <strong>Physics</strong> 61, 1267 (1998).<br />
[5] S. Lee, A. Pirogov, M. Kang, K.-H. Jang, M. Yonemura, T. Kamiyama,<br />
S. W. Cheong, F. Gozzo, N. Sh<strong>in</strong>, H. Kimura, et al., Nature 451, 805<br />
(2008).<br />
[6] O. Tchernyshyov, R. Moessner, and S. L. Sondhi, Phys. Rev. Lett. 88,<br />
067203 (2002).<br />
[7] A. B. Sushkov, O. Tchernyshyov, W. R. II, S. W. Cheong, and H. D.<br />
Drew, Phys. Rev. Lett. 94, 137202 (2005).<br />
[8] C. J. Fennie and K. M. Rabe, Phys. Rev. Lett. 96, 205505 (2006).<br />
[9] T. Rudolf, C. Kant, F. Mayr, and A. Loidl, Phys. Rev. B 77, 024421<br />
(2008).<br />
[10] H. Murakawa, Y. Onose, K. Ohgushi, S. Ishiwata, and Y. Tokura, Journal<br />
<strong>of</strong> the Physical Society <strong>of</strong> Japan 77, 043709 (2008).<br />
[11] J. B. Goodenough, Phys. Rev. 100, 564 (1955).<br />
[12] J. Kanamori, Journal <strong>of</strong> <strong>Physics</strong> and Chemistry <strong>of</strong> Solids 10, 87 (1959).<br />
[13] S.-H. Lee, C. Broholm, T. H. Kim, W. Ratcliff, and S.-W. Cheong, Phys.<br />
Rev. Lett. 84, 3718 (2000).<br />
[14] O. Tchernyshyov, R. Moessner, and S. L. Sondhi, Phys. Rev. B 66,<br />
064403 (2002).<br />
[15] S. Lee, C. Broholm, W. Ratcliff, G. Gasparovic, Q. Huang, T. Kim, and<br />
S. Cheong, Nature 418, 856 (2002).<br />
[16] D. H. Lyons, T. A. Kaplan, K. Dwight, and N. Menyuk, Phys. Rev.<br />
126, 540 (1962).<br />
91
[17] K. Tomiyasu, J. Fukunaga, and H. Suzuki, Phys. Rev. B 70, 214434<br />
(2004).<br />
[18] T. Tsuda, H. Abe, and A. Hirai, Journal <strong>of</strong> the Physical Society <strong>of</strong> Japan<br />
38, 72 (1975).<br />
[19] S. Funahashi, K. Siratori, and Y. Tomono, Journal <strong>of</strong> the Physical Society<br />
<strong>of</strong> Japan 29, 1179 (1970).<br />
[20] Y. Yamasaki, S. Miyasaka, Y. Kaneko, J.-P. He, T. Arima, and<br />
Y. Tokura, Phys. Rev. Lett. 96, 207204 (2006).<br />
[21] H. Katsura, N. Nagaosa, and A. V. Balatsky, Phys. Rev. Lett. 95,<br />
057205 (2005).<br />
[22] Y. J. Choi, J. Okamoto, D. J. Huang, K. S. Chao, H. J. L<strong>in</strong>, C. T. Chen,<br />
M. van Veenendaal, T. A. Kaplan, and S.-W. Cheong, Phys. Rev. Lett.<br />
102, 067601 (2009).<br />
[23] G. Shirane, D. E. Cox, and S. J. Pickart, Journal <strong>of</strong> Applied <strong>Physics</strong> 35,<br />
954 (1964).<br />
[24] K. Tomiyasu and I. Kagomiya, Journal <strong>of</strong> the Physical Society <strong>of</strong> Japan<br />
73, 2539 (2004).<br />
[25] E. Pr<strong>in</strong>ce, Acta Crystallographica 10, 554 (1957).<br />
[26] T. Inui, Y. Tanabe, and Y. Onodera, Group theory and its applications <strong>in</strong><br />
physics, Spr<strong>in</strong>ger series <strong>in</strong> solid-state sciences (Spr<strong>in</strong>ger-Verlag, Berl<strong>in</strong>,<br />
1996).<br />
[27] M. T<strong>in</strong>kham, Group theory and quantum mechanics (McGraw Hill, New<br />
York, 1964).<br />
[28] J. Sólyom, A modern szilárdtestfizika alapjai (ELTE Eötvös kiadó, Budapest,<br />
2002-2003).<br />
[29] R. Moessner and J. T. Chalker, Phys. Rev. B 58, 12049 (1998).<br />
[30] B. Canals and C. Lacroix, Phys. Rev. Lett. 80, 2933 (1998).<br />
[31] S. Ji, S.-H. Lee, C. Broholm, T. Y. Koo, W. Ratcliff, S.-W. Cheong, and<br />
P. Zschack, Phys. Rev. Lett. 103, 037201 (2009).<br />
92
[32] S. Bhattacharjee, S. Zherlitsyn, O. Chiatti, A. Sytcheva, J. Wosnitza,<br />
R. Moessner, M. Zhitomirsky, P. Lemmens, V. Tsurkan, and A. Loidl,<br />
cond-mat1011.4076.<br />
[33] R. Valdés Aguilar, A. B. Sushkov, Y. J. Choi, S.-W. Cheong, and H. D.<br />
Drew, Phys. Rev. B 77, 092412 (2008).<br />
[34] H. Ueda, H. Mitamura, T. Goto, and Y. Ueda, Phys. Rev. B 73, 094415<br />
(2006).<br />
[35] T. Rudolf, C. Kant, F. Mayr, J. Hemberger, V. Tsurkan, and A. Loidl,<br />
New Journal <strong>of</strong> <strong>Physics</strong> 9 (2007).<br />
[36] M. Dressel and G. Grüner, Electrodynamics <strong>of</strong> <strong>solids</strong>: <strong>optical</strong> properties<br />
<strong>of</strong> electrons <strong>in</strong> matter (Cambridge University Press, Cambridge, 2002).<br />
[37] K. Siratori, Journal <strong>of</strong> the Physical Society <strong>of</strong> Japan 23, 948 (1967).<br />
[38] S. Ohtani, Y. Watanabe, M. Saito, N. Abe, K. Taniguchi, H. Sagayama,<br />
T. Arima, M. Watanabe, and Y. Noda, Journal <strong>of</strong> <strong>Physics</strong>: Condensed<br />
Matter 22, 176003 (2010).<br />
93
Chapter 6<br />
Optical <strong>magneto</strong>electric effect<br />
<strong>of</strong> sp<strong>in</strong> waves <strong>in</strong> the<br />
multiferroic Ba 2 CoGe 2 O 7<br />
Multiferroics are a recently discovered family <strong>of</strong> materials, which simultaneously<br />
exhibit long-range magnetic and ferroelectric order [1, 2, 3]. Possible<br />
future applications <strong>of</strong> multiferroics as a build<strong>in</strong>g block <strong>of</strong> a fundamentally new<br />
<strong>in</strong>formation technology require strong coupl<strong>in</strong>g <strong>of</strong> the two order parameters<br />
<strong>in</strong> order to control magnetization via electric field or ferroelectric polarization<br />
via magnetic field. The entanglement <strong>of</strong> the static magnetization and<br />
the electric polarization <strong>in</strong> multiferroics results <strong>in</strong> the mix<strong>in</strong>g <strong>of</strong> the low-ly<strong>in</strong>g<br />
excitations, namely the electric field-excited sp<strong>in</strong> waves. Thanks to the recent<br />
development <strong>in</strong> the low-energy (THz) spectroscopy and the advances <strong>in</strong><br />
the synthesis <strong>of</strong> multiferroics, this new class <strong>of</strong> excitations also called electromagnons<br />
has been observed <strong>in</strong> several orthorhombic manganites TbMnO 3 ,<br />
GdMnO 3 [4], DyMnO 3 [5], TbMn 2 O 5 , YMn 2 O 5 [6], <strong>in</strong> Y-type hexaferrites<br />
Ba 2 Mg 2 Fe 12 O 22 [7] and <strong>in</strong> BiFeO 3 which shows multiferroic order already at<br />
room temperature [8]. The strong hybridization between the magnetic and<br />
the electric dipole excitations is expected to be manifested <strong>in</strong> several exotic<br />
<strong>magneto</strong>-<strong>optical</strong> <strong>effects</strong>, such as directional anisotropy, as it was discussed <strong>in</strong><br />
chapter 2.<br />
6.1 Crystal structure and magnetic order<strong>in</strong>g<br />
<strong>in</strong> Ba 2 CoGe 2 O 7<br />
We have studied the <strong>optical</strong> properties <strong>of</strong> a recently synthetized multiferroic<br />
oxide, Ba 2 CoGe 2 O 7 , <strong>in</strong> the photon energy region <strong>of</strong> the sp<strong>in</strong> excitations <strong>in</strong>-<br />
94
order to explore possible new <strong>magneto</strong>-<strong>optical</strong> <strong>effects</strong>. We found that a simple<br />
two-sublattice antiferromagnetic structure comb<strong>in</strong>ed with a special symmetry<br />
<strong>of</strong> the underly<strong>in</strong>g lattice opens the way to observe magnetic field <strong>in</strong>duced<br />
chirality, giant <strong>optical</strong> <strong>magneto</strong>electric effect and <strong>magneto</strong>chiral dichroism.<br />
The crystal structure is shown <strong>in</strong> Fig. 6.1 <strong>in</strong> the high-temperature paramagnetic<br />
phase, which belongs to the tetragonal P42 1 m space group [9]. Although<br />
the correspond<strong>in</strong>g po<strong>in</strong>t symmetry group, 42m is non-centrosymmetric,<br />
the presence <strong>of</strong> the 4 rotary-reflection and m mirror symmetry imply that<br />
the crystal is neither polar nor chiral <strong>in</strong> this phase.<br />
P42 1<br />
m<br />
4<br />
2 1<br />
m<br />
[010]<br />
[001]<br />
[010]<br />
Ba<br />
Co<br />
Ge<br />
O<br />
[100]<br />
[001]<br />
[100]<br />
Figure 6.1: The crystal structure <strong>of</strong> Ba 2 CoGe 2 O 7 belongs to the tetragonal<br />
space group P42 1 m [9].<br />
Ba 2 CoGe 2 O 7 is an <strong>in</strong>sulator with blue color due to its charge gap <strong>of</strong><br />
E gap ≈4 eV. The tetrahedrally coord<strong>in</strong>ated Co 2+ ions with S=3/2 sp<strong>in</strong>s are responsible<br />
for the magnetism similarly to the case <strong>of</strong> the sp<strong>in</strong>el oxide CoCr 2 O 4<br />
(see Fig. 5.2). Accord<strong>in</strong>g to preced<strong>in</strong>g studies <strong>of</strong> neutron scatter<strong>in</strong>g [9, 10]<br />
and magnetization [11, 12, 13], below T N =6.7 K the magnetic moments lie<br />
<strong>in</strong> the tetragonal plane and form an antiferromagnetic structure with a t<strong>in</strong>y<br />
cant<strong>in</strong>g along the [110] or the equivalent [110] direction, as shown <strong>in</strong> Fig. 6.2.<br />
The ordered moment is ∼2.7 µ B /Co [9]. The angular dependence <strong>of</strong> the<br />
magnetization measured by H. Murakawa et al. [13] shows that the magnetic<br />
susceptibility along the easy-axis [110] is larger by a factor <strong>of</strong> two compared<br />
to the hard axis [001] up to B∼10 T. Meanwhile, the magnetic anisotropy<br />
with<strong>in</strong> the (001) plane is almost zero, s<strong>in</strong>ce a magnetic field <strong>of</strong> B=1 T is<br />
enough to freely rotate the sp<strong>in</strong>s (see Fig. 6.3), hence Ba 2 CoGe 2 O 7 is an<br />
easy-plane antiferromagnet. The t<strong>in</strong>y ferromagnetic component is caused by<br />
the Dzyalosh<strong>in</strong>skii-Moriya <strong>in</strong>teraction, which is active due to the lack <strong>of</strong> <strong>in</strong>version<br />
symmetry between the nearest neighbor Co 2+ ions. The cant<strong>in</strong>g angle,<br />
estimated from the ratio <strong>of</strong> the remanent magnetization and the expected<br />
95
saturation momentum is rather small, ϕ ≈0.1 ◦ .<br />
a<br />
Polar<br />
b<br />
Chiral<br />
[110]<br />
P<br />
B<br />
P<br />
B<br />
B<br />
B<br />
m (110)<br />
Figure 6.2: a) Below T N =6.7 K, the magnetic moment <strong>of</strong> the Co 2+ ions<br />
(S=3/2) form an antiferromagnetic structure with t<strong>in</strong>y spontaneous cant<strong>in</strong>g<br />
along the [110] or the equivalent [11 0] direction. The s<strong>in</strong>gle doma<strong>in</strong> situation<br />
is obta<strong>in</strong>ed by small fields (B0.1 T) and a ferroelectric polarization appears<br />
along the [001] direction as an even function <strong>of</strong> the magnetic field [13]. For<br />
a 180 ◦ rotation <strong>of</strong> the crystal around the [11 0] axis, the polarization is reversed<br />
<strong>in</strong> the frame <strong>of</strong> the observer, while the magnetization is fixed by the<br />
external field, therefore, the toroidal moment is also reversed. b) Ow<strong>in</strong>g to<br />
the lattice symmetry, the same antiferromagnetic structure <strong>in</strong>duces chirality,<br />
when the external magnetic field po<strong>in</strong>ts along the [100] or [010] axis by reduc<strong>in</strong>g<br />
the po<strong>in</strong>t group to 22’2’ or 2’22’, respectively. Switch<strong>in</strong>g between the<br />
two enantiomers (chiral forms) can be carried out by rotation <strong>of</strong> the external<br />
magnetic field from [100] to [010] direction as it is equivalent to the m (110)<br />
mirror reflection [10, 9].<br />
The magnetic order<strong>in</strong>g at T N =6.7 K is accompanied by a spontaneous<br />
ferroelectric polarization along the [001] direction as shown <strong>in</strong> Fig. 6.3 a and<br />
b [12, 13]. If the s<strong>in</strong>gle doma<strong>in</strong> situation is achieved by a small magnetic<br />
field (|B| 0.1 T) applied along the easy magnetization axes, [110] or [110],<br />
the ferroelectric polarization, P, behaves as an even function <strong>of</strong> the external<br />
magnetic field (see Fig. 6.3 c and d). By rotat<strong>in</strong>g the magnetic field with<strong>in</strong><br />
the (001) plane, a s<strong>in</strong>gle doma<strong>in</strong> structure with zero ferroelectric polarization<br />
can also be realized (see Fig. 6.3 e). Thus, the external magnetic field can<br />
drastically change the ground state <strong>of</strong> the system.<br />
In agreement with the results <strong>of</strong> the polarization measurements, the mm ′ 2 ′<br />
symmetry <strong>of</strong> the magnetically ordered system (deduced on the basis <strong>of</strong> the<br />
crystal structure and neutron scatter<strong>in</strong>g data) allows the presence <strong>of</strong> ferroelectric<br />
polarization along the [001] direction when the magnetization po<strong>in</strong>ts<br />
along the easy-axis, [110] (see Fig. 6.2 a). As a result a state with ferro-<br />
96
toroidic order emerges. On one hand the toroidal moment (T=P×M) can<br />
be reversed by simply revers<strong>in</strong>g the direction <strong>of</strong> the magnetic field, s<strong>in</strong>ce the<br />
ferroelectric polarization, P, is an even function <strong>of</strong> the magnetic field. On<br />
the other hand, P changes sign if the sample is rotated by 180 ◦ around the<br />
[110] axis as shown <strong>in</strong> Fig. 6.3 c and d [13].<br />
In the literature, the results <strong>of</strong> the static magnetization and electric polarization<br />
measurements were <strong>in</strong>terpreted <strong>in</strong> terms <strong>of</strong> a model previously<br />
proposed by T. Arima [14, 13]. This predicts that the hybridization between<br />
the Co 2+ ions and the O 2− ligands depend on the direction <strong>of</strong> the Co 2+ sp<strong>in</strong>s<br />
due to the sp<strong>in</strong>-orbit coupl<strong>in</strong>g. Accord<strong>in</strong>g to this model, the polarization <strong>of</strong><br />
a metal-ligand bond is proportional to P∝(S·e) 2 e, where e is the unit vector<br />
po<strong>in</strong>t<strong>in</strong>g from the metal towards the ligand and S is the sp<strong>in</strong> on the metal site<br />
[14]. If the contributions <strong>of</strong> all the four neighbors sitt<strong>in</strong>g at the corners <strong>of</strong> a<br />
tetrahedron are summed up, the electric polarization will have the follow<strong>in</strong>g<br />
form:<br />
4∑<br />
P ∝ (S · e i ) 2 e i , (6.1)<br />
i=1<br />
where the summation runs over the neighbors. This model captures the dependence<br />
<strong>of</strong> the electric polarization both on the strength and the orientation<br />
<strong>of</strong> the magnetic field <strong>in</strong>clud<strong>in</strong>g the sign reversal <strong>of</strong> P <strong>in</strong> large magnetic fields,<br />
H∥[110] [13].<br />
When M is parallel to [100] (or [010]) the ferroelectric polarization is zero<br />
and the magnetic po<strong>in</strong>t symmetry is 22 ′ 2 ′ as shown <strong>in</strong> the Fig. 6.2 b. The<br />
22 ′ 2 ′ magnetic po<strong>in</strong>t group is not polar, but it is chiral. The possibility <strong>of</strong> the<br />
magnetic field <strong>in</strong>duced chirality <strong>in</strong> the 42m crystal class has been recognized<br />
recently by Arima et al. [15]. The ma<strong>in</strong> idea is sketched <strong>in</strong> the Fig. 6.4.<br />
A regular tetrahedron compressed (or elongated) along the [001] direction<br />
has the 42m symmetry, thus, it represents the symmetry <strong>of</strong> the crystal <strong>in</strong><br />
its paramagnetic state. When a static magnetic field is applied, the lattice<br />
structure can suffer further distortion with different lattice constant parallel<br />
and perpendicular to the field direction due to the sp<strong>in</strong>-lattice coupl<strong>in</strong>g.<br />
Thus, the symmetry is reduced to 222. This is the symmetry group <strong>of</strong> a<br />
markedly chiral object, the double helix as well.<br />
Generally, mirror reflection or <strong>in</strong>version transforms one enantiomer to<br />
the other. In the case <strong>of</strong> Ba 2 CoGe 2 O 7 , it is convenient to study the mirror<br />
reflection to the (110) or the (110) plane, s<strong>in</strong>ce it is a symmetry <strong>of</strong> the<br />
paramagnetic crystal. Such m (110) reflection flips the external magnetic field<br />
(which is an axial vector) from the [100] direction to the [010] direction as<br />
shown <strong>in</strong> Fig. 6.2 b. Therefore, the switch<strong>in</strong>g between the two enantiomers<br />
can be similarly realized by 90 ◦ rotation <strong>of</strong> the external magnetic field with<strong>in</strong><br />
97
a<br />
b<br />
e<br />
Figure 6.3: a)-b) Below T N =6.7 K the spontaneous magnetization po<strong>in</strong>t<strong>in</strong>g<br />
along the easy-axis [110] generates ferroelectric polarization parallel to the<br />
tetragonal axis, [001] (red curves). If the magnetization lies <strong>in</strong> the [001]<br />
hard axis, the polarization is zero with<strong>in</strong> the accuracy <strong>of</strong> the measurement<br />
(black curve). c) The field dependence <strong>of</strong> the magnetization, M||[110], and<br />
the polarization, P||[001], when the magnetic field is applied along the [110]<br />
direction at T=3.4 K. d) When the sample is rotated by 180 ◦ around the [11 0]<br />
axis the polarization is reversed. e) The variation <strong>of</strong> the P||[001] component<br />
<strong>of</strong> the polarization upon the rotation <strong>of</strong> the magnetization with<strong>in</strong> the (001)<br />
plane [13].<br />
the (001) plane.<br />
Beside the static measurements, the sp<strong>in</strong> excitations were studied by<br />
means <strong>of</strong> <strong>in</strong>elastic neutron scatter<strong>in</strong>g by Zheludev et al. [10]. They have<br />
found a quasi-acoustic and an almost dispersionless <strong>optical</strong> magnon mode as<br />
show <strong>in</strong> Fig. 6.5. The energy <strong>of</strong> the <strong>optical</strong> magnon mode is E=2.25 meV at<br />
the Γ po<strong>in</strong>t. The dispersion relations were fitted satisfactorily by an S=1/2<br />
effective Heisenberg-model with anisotropic exchange <strong>in</strong>teraction, J ⊥ /J z ≈2.6.<br />
This model assumes a large easy-plane anisotropy and takes <strong>in</strong>to account only<br />
the lowest energy Kramers doublets <strong>of</strong> the Co 2+ ions.<br />
98
42m<br />
c<br />
a<br />
a<br />
222<br />
c<br />
b<br />
a<br />
a<br />
b<br />
c<br />
m (110)<br />
Figure 6.4: The 42m po<strong>in</strong>t group <strong>of</strong> the Ba 2 CoGe 2 O 7 can be represented by<br />
a s<strong>in</strong>gle tetrahedron compressed along the [001] axis. A possible view <strong>of</strong> the<br />
field-<strong>in</strong>duced chirality is that <strong>magneto</strong>elasticity causes difference <strong>in</strong> the lattice<br />
constant perpendicular and parallel to the ferromagnetic moment, thus the<br />
representative tetrahedron is further distorted to a chiral form with the same<br />
222 symmetry than that <strong>of</strong> a double helix.<br />
Figure 6.5: The sp<strong>in</strong>-wave dispersion relation along high symmetry l<strong>in</strong>es <strong>of</strong><br />
the Brillou<strong>in</strong> zone <strong>in</strong> Ba 2 CoGe 2 O 7 below E
2 THz. High-quality s<strong>in</strong>gle crystal rods were prepared by H. Murakawa [13].<br />
The rods were orientated by Laue x-ray diffraction and cut <strong>in</strong>to slabs with<br />
typical dimensions <strong>of</strong> 4×4×1 mm 3 .<br />
The complex transmission coefficient was measured and the absorption<br />
coefficient <strong>of</strong> the sample was evaluated as already discussed <strong>in</strong> Chapter 3.<br />
In the multiferroic phase two dist<strong>in</strong>ct peaks were observed <strong>in</strong> the absorption<br />
spectra at f∼0.5 THz and f∼1 THz as shown <strong>in</strong> Fig. 6.6. At the lowest temperature<br />
T=3.3 K and <strong>in</strong> zero magnetic field, we have performed a systematic<br />
study with the chang<strong>in</strong>g <strong>of</strong> the light polarization, E ω and H ω , to establish the<br />
selection rules for the different sp<strong>in</strong> wave branches. While the higher-energy<br />
mode can be excited for any polarization configuration, the lower one is silent<br />
if the magnetic component <strong>of</strong> the light is parallel to the tetragonal axis, i.e.<br />
H ω ∥[001]. Moreover, the strength <strong>of</strong> the 0.5 THz mode is <strong>in</strong>dependent <strong>of</strong> the<br />
orientation <strong>of</strong> the light E ω vector imply<strong>in</strong>g that this excitation has a dom<strong>in</strong>antly<br />
magnetic-dipole character. This excitation is identical to the <strong>optical</strong><br />
magnon mode observed <strong>in</strong> the <strong>in</strong>elastic neutron scatter<strong>in</strong>g experiments with<br />
an excitation energy E≈2 meV at the Γ po<strong>in</strong>t [10, 9]. On the other hand, as<br />
it is clear from the ma<strong>in</strong> polarization configurations shown <strong>in</strong> Fig. 6.6, the<br />
<strong>in</strong>tensity <strong>of</strong> the sharp transition at ∼ 1 THz changes if either H ω or E ω is<br />
varied. Beside the magnetic component <strong>of</strong> the radiation, this magnetic resonance<br />
can also be excited by the electric field <strong>of</strong> the light. Such sp<strong>in</strong> wave<br />
excitations, which ga<strong>in</strong> a dual character (both magnetic and electric dipole<br />
allowed) via the <strong>magneto</strong>electric coupl<strong>in</strong>g, are termed as electromagnons <strong>in</strong><br />
the literature [4, 5, 6, 7, 8].<br />
As expected for usual sp<strong>in</strong> waves, with <strong>in</strong>creas<strong>in</strong>g temperature the absorption<br />
<strong>of</strong> the 0.5 THz mode is gradually reduced and disappears above<br />
T N ≈6.7 K together with the underly<strong>in</strong>g antiferromagnetic order (see Fig. 6.6<br />
b). In contrast, the electromagnon at 1 THz survives above T N with an <strong>in</strong>creas<strong>in</strong>g<br />
red-shift and broaden<strong>in</strong>g. Both modes show conspicuous <strong>magneto</strong>chroism;<br />
their <strong>in</strong>tensity is enhanced with the application <strong>of</strong> magnetic field<br />
along the [110] direction and a splitt<strong>in</strong>g with a g-factor ∼2 <strong>in</strong> high fields can<br />
also be followed <strong>in</strong> Fig. 6.6 c.<br />
To ga<strong>in</strong> more <strong>in</strong>formation about the nature <strong>of</strong> the sp<strong>in</strong> excitations, we<br />
have measured the magnetic field dependence <strong>of</strong> the absorption coefficient for<br />
various light polarizations and for different field orientations. Representative<br />
maps <strong>of</strong> the absorption spectra are shown <strong>in</strong> Fig. 6.7 over the magnetic<br />
field range B=0-7 T and the frequency range ν=0.3-1.3 THz at T=3.3 K.<br />
As discussed above, the magnon mode at 0.5 THz is silent if B ω ∥[001],<br />
while the electromagnon is active <strong>in</strong> every configuration. The electromagnon<br />
symmetrically splits <strong>in</strong>to two and the low-energy sp<strong>in</strong> resonance is shifted<br />
towards higher energies when the magnetic field is applied along the hard axis<br />
100
Absorption coefficient, α [cm -1 ]<br />
a b c<br />
T=3.4K<br />
ω ω<br />
90 E || x , H || y<br />
80<br />
70<br />
60<br />
50 ω ω<br />
E || x , H || z<br />
40<br />
30<br />
20 ω ω<br />
E || z , H || x<br />
10<br />
Absorption coefficient, α [cm -1 ]<br />
T=21K ω ω<br />
E || z , H || x<br />
60<br />
T=10.3K<br />
50<br />
T=8.3K > T N<br />
40<br />
T=6.2K < T N<br />
30<br />
20 T=3.4K<br />
10<br />
Absorption coefficient, α [cm -1 ]<br />
140<br />
120<br />
100<br />
80<br />
60<br />
40<br />
20<br />
ω<br />
ω<br />
E || z , H || x<br />
T=3.4K<br />
H=70kOe<br />
H=60kOe<br />
H=50kOe<br />
H=30kOe<br />
H=0<br />
0<br />
0.4 0.6 0.8 1.0 1.2<br />
Frequency [THz]<br />
0<br />
0.4 0.6 0.8 1.0 1.2<br />
Frequency [THz]<br />
0<br />
0.4 0.6 0.8 1.0 1.2<br />
Frequency [THz]<br />
Figure 6.6: Selection rules and characteristics for the magnon modes. The<br />
spectra are shifted relative to each other with the correspond<strong>in</strong>g basel<strong>in</strong>es.<br />
a) Light polarization dependence at T=3.4 K <strong>in</strong> zero field when the [110]<br />
and [11 0] directions are equivalent. The 0.5 THz mode is excited by the H ω<br />
magnetic component <strong>of</strong> light but is <strong>in</strong>sensitive to the change <strong>of</strong> the E ω electric<br />
component. By contrast, the 1 THz mode is clearly affected by the variation<br />
<strong>of</strong> either H ω or E ω . b) Temperature dependence <strong>of</strong> the absorption spectrum.<br />
The conventional magnon disappears above the Néel temperature, while the<br />
electromagnon at 1 THz subsists well above T N with a considerable fraction<br />
<strong>of</strong> its oscillatory strength present even at ∼20 K. c) At T=3.4 K both modes<br />
split <strong>in</strong>to two excitations (the side peaks are <strong>in</strong>dicated by arrows) with a g-<br />
factor ∼2 <strong>in</strong> high fields.<br />
[001] (see panel a and b). On the other hand, magnetic fields po<strong>in</strong>t<strong>in</strong>g along<br />
the easy-axis [110] cause an asymmetrical splitt<strong>in</strong>g <strong>of</strong> the electromagnon<br />
mode. Even the selection rules are different for the two branches. One<br />
<strong>of</strong> them appears if E ω ∥[110], while the other is active <strong>in</strong> the E ω ∥[001]<br />
configuration. The field dependence <strong>of</strong> the 0.5 THz mode for B dc ∥[110] shows<br />
a sudden change at B dc ≈5 T. The observed selection rules and the field<br />
dependence <strong>of</strong> the resonance frequencies form a good basis to construct a<br />
theoretical sp<strong>in</strong> model.<br />
We have tested the <strong>optical</strong> <strong>magneto</strong>electric effect by the measurement <strong>of</strong><br />
the absorption coefficient upon the reversal <strong>of</strong> the toroidal moment <strong>in</strong> the<br />
ferrotoroidic phase <strong>of</strong> the Ba 2 CoGe 2 O 7 , i.e. for M||[110] and P||[001]. The<br />
experiments are sketched <strong>in</strong> Fig. 6.8 a and b. Magnetoelectric directional<br />
101
-1<br />
(cm )<br />
-1<br />
(cm )<br />
a<br />
E ω || [110] B ω || [001] B dc<br />
|| [001]<br />
b<br />
E ω || [001] B ω || [110] B dc<br />
|| [110]<br />
20<br />
1.2<br />
1.2<br />
Frequency (THz)<br />
1<br />
0.8<br />
0.6<br />
Frequency (THz)<br />
1<br />
0.8<br />
0.6<br />
15<br />
10<br />
0.4<br />
0.4<br />
5<br />
c<br />
0 1 2 3 4 5 6 7<br />
Magnetic Field (T)<br />
E ω || [110] B ω || [110] B dc<br />
|| [001]<br />
0 1 2 3 4 5 6 7<br />
Magnetic Field (T)<br />
d<br />
E ω || [001] B ω || [110] B dc<br />
|| [110]<br />
0<br />
20<br />
Frequency (THz)<br />
1.2<br />
1<br />
0.8<br />
0.6<br />
0.4<br />
Frequency (THz)<br />
1.2<br />
1<br />
0.8<br />
0.6<br />
0.4<br />
15<br />
10<br />
5<br />
0 1 2 3 4 5 6 7<br />
Magnetic Field (T)<br />
0 1 2 3 4 5 6 7<br />
Magnetic Field (T)<br />
Figure 6.7: Magnetic field dependence <strong>of</strong> the absorption spectra <strong>in</strong><br />
Ba 2 CoGe 2 O 7 . The light regions <strong>in</strong>dicate large absorptions. a) and b) When<br />
the magnetic field was applied along the hard axis [001], the electromagnon<br />
at 1 THz symmetrically splits <strong>in</strong>to two branches, while the 0.5 THz mode is<br />
hardened. c) and d) On the other hand, the electromagnon splits antisymmetrically,<br />
when the magnetic field po<strong>in</strong>ts along the easy-axis [110]. The<br />
dispersionless branch (see panel c)) is active if E ω ∥[110], while the other<br />
branch is excited <strong>in</strong> the E ω ∥[001] configuration (see panel d)). In the latter<br />
case an additional mode appears near the usual magnon mode at 0.5 THz.<br />
0<br />
dichroism can arise if the wave vector is parallel or antiparallel to the toroidal<br />
moment, T||q||[110].<br />
In the first series <strong>of</strong> measurement, the magnetization was reversed by the<br />
external field, which also switches the toroidal moment, s<strong>in</strong>ce the ferroelectric<br />
polarization is an even function <strong>of</strong> the magnetic field. The difference <strong>in</strong> the<br />
absorption coefficient upon the reversal <strong>of</strong> the magnetic field shows the presence<br />
<strong>of</strong> f<strong>in</strong>ite directional dichroism solely for the electromagnon mode when<br />
the <strong>in</strong>cident light polarization is E ω ||P and H ω ||M as shown <strong>in</strong> Fig. 6.8.<br />
102
Absorption coefficient, α [cm -1 ]<br />
∆α [cm -1 ]<br />
c<br />
120 T=3.4K +P<br />
110<br />
100<br />
_ M +M<br />
90<br />
80<br />
70<br />
60<br />
50<br />
40<br />
30<br />
20<br />
10<br />
0<br />
0.4 0.6 0.8 1.0 1.2<br />
Frequency [THz]<br />
e<br />
30 T=3.4K<br />
H=–10kOe +<br />
+ –20kOe<br />
20 + –30kOe<br />
–40kOe +<br />
10 + –60kOe<br />
+ –70kOe<br />
0<br />
H= +70kOe<br />
H= -70kOe<br />
+40kOe<br />
-40kOe<br />
+1kOe<br />
-1kOe<br />
d<br />
f<br />
T=3.4K<br />
_ M +M<br />
_<br />
P<br />
H=+70kOe<br />
H= -70kOe<br />
+40kOe<br />
-40kOe<br />
+1kOe<br />
-1kOe<br />
0.4 0.6 0.8 1.0 1.2<br />
Frequency [THz]<br />
H=–70kOe +<br />
+P T=10K<br />
7.2K<br />
_<br />
6.5K<br />
M +M 5.8K<br />
_<br />
M<br />
+P<br />
+M<br />
4.9K<br />
3.4K<br />
120<br />
110<br />
100<br />
90<br />
80<br />
70<br />
60<br />
50<br />
40<br />
30<br />
20<br />
10<br />
0<br />
30<br />
20<br />
10<br />
0<br />
Absorption coefficient, α [cm -1 ]<br />
∆α [cm -1 ]<br />
0.4 0.6 0.8 1.0 1.2<br />
Frequency [THz]<br />
0.4 0.6 0.8 1.0 1.2<br />
Frequency [THz]<br />
Figure 6.8: Directional dichroism, i.e. the change <strong>in</strong> the absorption upon the<br />
reversal <strong>of</strong> the light propagation, can be equivalently <strong>in</strong>duced by the switch<strong>in</strong>g<br />
<strong>of</strong> either the static magnetization (M) or the polarization (P) <strong>of</strong> the sample.<br />
a) Due to the resonant absorption, the radiation decays as pass<strong>in</strong>g through<br />
the material. This loss can be controlled both by M (∥ H ω ) and P (∥ E ω ).<br />
b) For example, the reversal <strong>of</strong> P by the 180 ◦ rotation <strong>of</strong> the sample around<br />
the [11 0] axis can reduce the absorption, which is somewhat exaggerated <strong>in</strong><br />
our figure for the sake <strong>of</strong> clarity. c) and d) Only the absorption <strong>of</strong> the<br />
electromagnon at 1 THz has a large component, odd both <strong>in</strong> M and P, thus,<br />
show<strong>in</strong>g directional dichroism, ∆α. e, With <strong>in</strong>creas<strong>in</strong>g magnetic field, ∆α<br />
spectra grow monotonously, f) while it vanishes outside the multiferroic phase<br />
above T N =6.7 K even <strong>in</strong> H=70 kOe.<br />
Please note that the magnetization was perpendicular to the propagation<br />
direction, thus, Faraday-effect is not active. Only the magnetic field-even<br />
Cotton-Mouton effect may appear. The magnetic field and temperature<br />
103
dependence <strong>of</strong> the <strong>magneto</strong>electric directional dichroism spectrum, which<br />
corresponds to the field-odd term <strong>in</strong> the absorption coefficient, is shown <strong>in</strong><br />
Fig. 6.8 e, f. At the lowest temperature the field dependence <strong>of</strong> the directional<br />
dichroism signal follows that <strong>of</strong> the electromagnon mode. On the<br />
other hand, it disappears above T N =6.7 K <strong>in</strong> contrast to the electromagnon<br />
mode, which survives <strong>in</strong> the paramagnetic phase. No effect has been found<br />
for <strong>in</strong>cident light polarization E ω ⊥P with<strong>in</strong> the precision <strong>of</strong> the experiment.<br />
An other way to reverse the toroidal moment is the rotation <strong>of</strong> the crystal<br />
by 180 ◦ around [110], s<strong>in</strong>ce this operation switches the polarization, while<br />
the magnetization rema<strong>in</strong>s fixed by the external field. In this case, the sign<br />
<strong>of</strong> the absorption difference is aga<strong>in</strong> reversed as shown <strong>in</strong> Fig. 6.8 c and<br />
d. Therefore, we found that the absorption difference, i.e. the directional<br />
dichroism signal can be reversed by chang<strong>in</strong>g the sign <strong>of</strong> the toroidal moment,<br />
T=P×M, with either by fix<strong>in</strong>g the direction <strong>of</strong> the polarization and<br />
revers<strong>in</strong>g the magnetization or by revers<strong>in</strong>g the polarization and keep<strong>in</strong>g the<br />
magnetization <strong>in</strong>tact.<br />
Based on these experimental results we concluded that the electromagnon<br />
excitation at f∼1 THz shows an <strong>optical</strong> <strong>magneto</strong>electric effect correspond<strong>in</strong>g<br />
to an exceptionally large relative change <strong>of</strong> the absorption coefficient, ∆α/⟨α⟩<br />
=2(α +M − α −M )/(α +M + α −M )≈0.6 <strong>in</strong> B=±7 T. Please note that the effect<br />
is still large, ∆α/⟨α⟩ ≈0.2, <strong>in</strong> magnetic fields as small as B=0.1 T. The<br />
simultaneous spontaneous electric polarization and magnetization present <strong>in</strong><br />
this multiferroic compound allow a remarkable directional dichroism, which<br />
can be reversed by easily accessible fields.<br />
The propagation <strong>of</strong> the electromagnetic radiation was analyzed by solv<strong>in</strong>g<br />
the Maxwell equations. The coord<strong>in</strong>ate system is chosen as follows: x||[110],<br />
y||[110] and z||[001]. The magnetization <strong>of</strong> the sample is parallel to x, the<br />
ferroelectric polarization po<strong>in</strong>ts toward z and the light propagates along the<br />
y direction. Based on the magnetic symmetry, m x m ′ y2 ′ z, we have determ<strong>in</strong>ed<br />
the non-vanish<strong>in</strong>g matrix elements <strong>of</strong> the tensors describ<strong>in</strong>g the <strong>optical</strong> prop-<br />
104
erties from Neumann’s pr<strong>in</strong>ciple:<br />
⎡<br />
⎤<br />
µ ′ xx 0 0<br />
µ αβ = ⎣ 0 µ ′ yy µ ′′ ⎦<br />
yz ,<br />
0 −µ ′′<br />
yz µ ′ zz<br />
⎡<br />
⎤<br />
ε ′ xx 0 0<br />
ε αβ = ⎣ 0 ε ′ yy ε ′′ ⎦<br />
yz ,<br />
0 −ε ′′<br />
yz ε ′ zz<br />
⎡<br />
⎤<br />
0 χ ′′<br />
χ me<br />
xy χ ′ xz<br />
αβ = ⎣ χ ′′<br />
yx 0 0 ⎦ , (6.2)<br />
χ ′ zx 0 0<br />
where µ αβ and ε αβ are elements <strong>of</strong> the electric permittivity and magnetic<br />
permeability tensors, while χ me<br />
αβ is the <strong>magneto</strong>electric tensor as def<strong>in</strong>ed <strong>in</strong><br />
chapter 2. We obta<strong>in</strong> four <strong>in</strong>dependent solutions for the generalized complex<br />
refractive <strong>in</strong>dex each correspond<strong>in</strong>g to l<strong>in</strong>early polarized eigenstates:<br />
(<br />
)<br />
√ ( ) (<br />
)<br />
N ∥ ± = ± χ ′ xz − χ ′′ ε yz<br />
xy + ε zz + ε2 yz<br />
µ xx + [χ′′ xy] 2<br />
ε yy ε yy ε yy<br />
≈ ±χ ′ xz + √ ε zz µ xx<br />
(<br />
)<br />
N± ⊥ = ± χ ′ zx − χ ′′ µ yz<br />
yx +<br />
µ yy<br />
√ ( ) ( )<br />
ε xx + [χ′′ yx] 2<br />
µ zz + µ2 yz<br />
µ yy µ yy<br />
≈ ±χ ′ zx + √ ε xx µ zz , (6.3)<br />
where N ∥ ± is the refractive <strong>in</strong>dex for ±q y <strong>in</strong> case E ω is parallel to the ferroelectric<br />
polarization and H ω po<strong>in</strong>ts along the magnetization, while N ⊥ ± stands for<br />
the perpendicular polarization (E ω ∥M & H ω ∥P). Then, the non-reciprocal<br />
term <strong>in</strong> the complex refractive <strong>in</strong>dex, whose real/imag<strong>in</strong>ary part corresponds<br />
to the directional birefr<strong>in</strong>gence/dichrosim, is obta<strong>in</strong>ed as ∆N ∥ =N ∥ +-N ∥ −=2χ ′ xz<br />
and ∆N ⊥ =2χ ′ zx. In Ba 2 CoGe 2 O 7 the absorption difference proportional to<br />
the imag<strong>in</strong>ary part <strong>of</strong> ∆N ∥ is remarkably large, while the effect for the perpendicular<br />
polarization, ∆N ⊥ is zero with<strong>in</strong> the accuracy <strong>of</strong> the experiment.<br />
The <strong>in</strong>terpretation <strong>of</strong> the polarization dependence, namely the large difference<br />
between χ ′ xz and χ ′ zx, cannot be expla<strong>in</strong>ed solely on a symmetry basis,<br />
but requires a microscopic theory to be developed. The directional dichroism<br />
<strong>of</strong>fers a unique way to determ<strong>in</strong>e elements <strong>of</strong> the <strong>magneto</strong>electric tensor by<br />
separat<strong>in</strong>g their contribution from those <strong>of</strong> the dielectric function and magnetic<br />
permeability. By us<strong>in</strong>g Eq. 6.3 the follow<strong>in</strong>g formula can be obta<strong>in</strong>ed<br />
for the <strong>magneto</strong>electric tensor:<br />
∆α = 2 ω c Im{∆N ∥ } ≈ 4 ω c Im{χ′ xz}, (6.4)<br />
105
thus, Im{χ ′ xz} ≈0.04 <strong>in</strong> B=7 T, when ∆α ≈30 cm −1 . It can be compared to<br />
the strength <strong>of</strong> the magnetic susceptibility, χ mm<br />
xx :<br />
⟨α⟩ ≈ 2 ω c Im{√ ε zz µ xx } ≈ ω c<br />
√<br />
ε<br />
∞<br />
zz Im{χ mm<br />
xx }, (6.5)<br />
where ε ∞ zz is the background dielectric constant assumed to be 8 from the dc<br />
dielectric measurements [13], which leads to Im{χ mm<br />
xx } ≈0.07 . Therefore, for<br />
the electromagnon mode <strong>in</strong> B=7 T this <strong>magneto</strong>electric tensor element is <strong>of</strong><br />
the same order <strong>of</strong> magnitude as the magnetic susceptibility.<br />
6.3 Optical activity and <strong>magneto</strong>-chiral dichroism<br />
<strong>of</strong> sp<strong>in</strong> waves <strong>in</strong> Ba 2 CoGe 2 O 7<br />
A magnetic field applied along the [100] or the [010] direction <strong>in</strong>duces chirality<br />
as predicted based on the analysis <strong>of</strong> the magnetic symmetry group. When<br />
a chiral material is exposed to light, natural circular dichroism may appear<br />
for the entire spectrum <strong>of</strong> the excitations from <strong>in</strong>frared to x-ray. However,<br />
the handedness <strong>of</strong> the matter has not been directly observed through excitations<br />
<strong>of</strong> the sp<strong>in</strong> degrees <strong>of</strong> freedom so far. In Ba 2 CoGe 2 O 7 the presence<br />
<strong>of</strong> a strong <strong>magneto</strong>electric effect for the electromagnon excitation gives a<br />
h<strong>in</strong>t that the magnetic field-even components <strong>of</strong> the <strong>magneto</strong>electric tensor,<br />
[χ me<br />
αβ ]′′ , potentially giv<strong>in</strong>g rise to natural <strong>optical</strong> activity, are also large and<br />
support considerable natural circular dichroism for the sp<strong>in</strong>-wave excitations.<br />
Rotation <strong>of</strong> the l<strong>in</strong>ear polarization was measured <strong>in</strong> transmission on the<br />
(001) plane, which is isotropic <strong>in</strong> the paramagnetic phase. The absorption<br />
coefficient, the polarization rotation, and the ellipticity spectra are displayed<br />
<strong>in</strong> Fig. 6.9.<br />
When the light propagates along the [001] direction and B ω ||M both<br />
the f∼0.5 THz and the f∼1 THz modes can be excited. In high magnetic<br />
field B dc =7 T the usual magnon mode splits <strong>in</strong>to two bands while the electromagnetic<br />
resonance shows considerable broaden<strong>in</strong>g. The large polarization<br />
rotation θ≈90 ◦ /mm, and the correspond<strong>in</strong>g ellipticity η≈45 ◦ /mm, are<br />
even functions <strong>of</strong> the magnetic field. This excludes contributions from the<br />
Faraday-effect, but it is characteristic to natural <strong>optical</strong> activity (Fig. 6.9<br />
a). The polarization rotation and the ellipticity have different sign for the<br />
magnon and the electromagnon. The peak value <strong>of</strong> the ellipticity at f∼1 THz<br />
<strong>in</strong>dicates that the transmitted light beh<strong>in</strong>d the t≈1 mm tick sample is almost<br />
perfectly circularly polarized. Magnetic field <strong>in</strong>duced l<strong>in</strong>ear birefr<strong>in</strong>gence<br />
could cause ellipticity only if the sample would be misaligned and even<br />
106
B <br />
Figure 6.9: Absorption (α), polarization rotation (θ) and ellipticity (η) spectra<br />
<strong>of</strong> the sp<strong>in</strong>-wave modes for light propagation along the [001] axis. a) The<br />
0.5 THz magnon mode is split <strong>in</strong>to two branches and the 1 THz <strong>magneto</strong>electric<br />
resonance shows considerable broaden<strong>in</strong>g <strong>in</strong> high magnetic fields parallel<br />
to B ω . The large polarization rotation and ellipticity are even functions <strong>of</strong><br />
the magnetic field. Their sign is opposite for the two excitations. b) When<br />
the external magnetic field is rotated from [100] to [010] direction, both the<br />
polarization rotation and ellipticity change sign, while they become zero when<br />
the static magnetic field po<strong>in</strong>ts along the <strong>in</strong>termediate [110] direction and<br />
the mirror-plane symmetry is restored. On this basis, these polarization phenomena<br />
can be clearly identified as sp<strong>in</strong>-mediated <strong>optical</strong> activity <strong>in</strong> a chiral<br />
media.<br />
<strong>in</strong> this case circularly polarized transmitted light would be realized <strong>in</strong> <strong>of</strong>fresonance<br />
condition and polarization rotation would be large right at the<br />
resonance frequency <strong>in</strong> contrast to the present case. Moreover, we found<br />
that the circular birefr<strong>in</strong>gence/dichroism changes sign as the magnetic field<br />
is rotated by 90 ◦ , which is a direct evidence for the magnetic field <strong>in</strong>duced<br />
switch<strong>in</strong>g <strong>of</strong> the chirality (see Fig. 6.9 b). Furthermore, if the external field<br />
po<strong>in</strong>ts towards the <strong>in</strong>termediate direction [110], the chirality vanishes as <strong>in</strong>dicated<br />
by the absence <strong>of</strong> the polarization rotation, clearly apparent <strong>in</strong> Fig. 6.9<br />
b.<br />
107
Magneto-chiral dichroism, the absorption difference for counterpropagat<strong>in</strong>g<br />
unpolarized beams, can appear <strong>in</strong> chiral media when the light propagation<br />
is parallel to an external magnetic field as discussed <strong>in</strong> Chapter 2. The observation<br />
<strong>of</strong> the <strong>magneto</strong>-chiral effect simultaneously requires chirality, which<br />
can be <strong>in</strong>duced by a magnetic field along the [100] (or the [010]) axis <strong>in</strong><br />
Ba 2 CoGe 2 O 7 , and a magnetic field applied parallel to the propagation direction.<br />
Therefore, the <strong>magneto</strong>-chiral effect can be detected <strong>in</strong> transmission<br />
through the (100) plane for q||B||[100].<br />
B <br />
Figure 6.10: Absorption spectra <strong>in</strong> the field-<strong>in</strong>duced chiral phase (B ω ∥[100])<br />
for light propagat<strong>in</strong>g along the [010] axis a) parallel and b) antiparallel to the<br />
external magnetic field. c) The difference <strong>of</strong> the absorption coefficients for<br />
counterpropagat<strong>in</strong>g beams, the so-called <strong>magneto</strong>-chiral dichroism, is huge<br />
and shows a double peak structure for the <strong>magneto</strong>electric resonance. d)<br />
The correspond<strong>in</strong>g two orders <strong>of</strong> magnitude difference between the transmitted<br />
<strong>in</strong>tensities at ∼1 THz for a sample thickness <strong>of</strong> ∼1 mm. e) Both the natural<br />
<strong>optical</strong> rotation (field even component) and the Faraday-effect (field odd term)<br />
is strong for the <strong>magneto</strong>electric resonance while the both are negligible for<br />
the 0.5 THz magnon mode <strong>in</strong> this configuration.<br />
The spectra <strong>of</strong> the absorption coefficient for propagation parallel and antiparallel<br />
to the magnetic field is shown <strong>in</strong> Fig. 6.10 a and b, respectively. In<br />
high magnetic field, B dc 1 T only the ν ∼1 THz resonance can be excited,<br />
which splits <strong>in</strong>to two. For light propagation parallel and antiparallel to the<br />
external field the absorption shows a large difference, ∆α = α +M − α −M ,<br />
108
<strong>in</strong> the region <strong>of</strong> the <strong>magneto</strong>electric resonance. Note that <strong>in</strong> B dc =±6 T the<br />
low-energy branch <strong>of</strong> this mode exhibits <strong>magneto</strong>chiral dichroism as high as<br />
∆α/α ≈0.5, while for the high-energy one the effect is ∆α/α ≈0.2 maximally<br />
as discerned <strong>in</strong> Fig. 6.10 c. The MChD is still ∆α/α ≈0.2 <strong>in</strong> low fields. In<br />
this geometry, besides the natural <strong>optical</strong> rotation, which is the even function<br />
<strong>of</strong> the magnetic field, we found a large polarization rotation, odd <strong>in</strong> B dc , the<br />
so-called Faraday effect for the <strong>magneto</strong>electric resonance (see Fig. 6.10 d<br />
and e). Apart from resonance frequencies, the field-even component <strong>of</strong> the<br />
polarization rotation vanishes, exclud<strong>in</strong>g contributions from l<strong>in</strong>ear birefr<strong>in</strong>gence<br />
and dichroism due to misalignment between the polarization <strong>of</strong> the<br />
<strong>in</strong>cident light and the tetragonal axis.<br />
In conclusion, beside a conventional <strong>optical</strong> magnon excitation, we found<br />
a sp<strong>in</strong> wave excitation, which is sensitive both to the electric and the magnetic<br />
component <strong>of</strong> the light, <strong>in</strong> the antiferromagnetic phase <strong>of</strong> a recently<br />
synthetized multiferroic oxide Ba 2 CoGe 2 O 7 . This electromagnon mode shows<br />
<strong>magneto</strong>electric directional dichroism <strong>in</strong> the order <strong>of</strong> unity due to the strong<br />
mix<strong>in</strong>g <strong>of</strong> the magnetic and the electric dipole transitions. Furthermore,<br />
both <strong>of</strong> these sp<strong>in</strong> excitations show natural <strong>optical</strong> activity, when chirality<br />
is <strong>in</strong>duced by an external magnetic field (applied along the [100] or [010] direction).<br />
In the chiral phase we observed another directional dichroism, the<br />
<strong>magneto</strong>-chiral effect with similar strength.<br />
In CuB 2 O 4 , which has the same 42m po<strong>in</strong>t group like Ba 2 CoGe 2 O 7 , recent<br />
measurements have also revealed a large <strong>optical</strong> <strong>magneto</strong>electric effect<br />
and magnetic field <strong>in</strong>duced natural <strong>optical</strong> activity <strong>in</strong> the near-<strong>in</strong>frared photon<br />
energy region [16, 15, 17]. The <strong>in</strong>terference between the electric and<br />
the magnetic dipole transitions generates large elements <strong>in</strong> the <strong>magneto</strong>electric<br />
tensor which are responsible for these <strong>effects</strong> <strong>in</strong> the region <strong>of</strong> the d-d<br />
excitations <strong>of</strong> Cu 2+ (allowed by the low site symmetry).<br />
Recently, a theoretical calculation based on exact diagonalization has<br />
been performed by S. Miyahara and N. Furukawa <strong>in</strong> order to understand the<br />
sp<strong>in</strong> wave excitations <strong>in</strong> Ba 2 CoGe 2 O 7 [18]. They <strong>in</strong>vestigated a Heisenberg<br />
model with S=3/2 sp<strong>in</strong>s on a square lattice with strong easy-plane anisotropy:<br />
H = ∑ ⟨i,j⟩<br />
JS i S j − D z ij(S x i S y j − Sy i Sx j ) + ∑ i<br />
Λ (S z i ) 2 , (6.6)<br />
where ∑ ⟨i,j⟩ runs for the nearest neighbors, Dz ij is the Dzyalosh<strong>in</strong>skii-Moriya<br />
coupl<strong>in</strong>g and Λ is the s<strong>in</strong>gle-ion anisotropy. The coupl<strong>in</strong>g between the sp<strong>in</strong>s<br />
and the ferroelectric polarization is <strong>in</strong>cluded <strong>in</strong> terms <strong>of</strong> the model proposed<br />
by T. Arima (see Eq. 6.1). Start<strong>in</strong>g from the weak coupl<strong>in</strong>g limit (J≪ Λ),<br />
the energy levels <strong>of</strong> a s<strong>in</strong>gle Co 2+ ion split <strong>in</strong>to the two Kramers doublet:<br />
109
S z =±1/2 and S z =±3/2. Accord<strong>in</strong>g to the theoretical calculations, the transition<br />
between the doublets corresponds to the electromagnon excitation at<br />
1 THz, while the quasi-acoustic magnon mode and the sp<strong>in</strong> wave excitation<br />
at 0.5 THz evolve from the low-ly<strong>in</strong>g doublet. Their results describe quantitatively<br />
the absorption coefficient and the <strong>optical</strong> <strong>magneto</strong>electric effect<br />
observed <strong>in</strong> our experiments.<br />
110
References<br />
[1] T. Kimura, T. Goto, H. Sh<strong>in</strong>tani, K. Ishizaka, T. Arima, and Y. Tokura,<br />
Nature 426, 55 (2003).<br />
[2] N. Hur, S. Park, P. A. Sharma, J. S. Ahn, S. Guha, and S.-W. Cheong,<br />
Nature 429, 392 (2004).<br />
[3] K. F. Wang, J. M. Liu, and Z. F. Ren, Advances <strong>in</strong> <strong>Physics</strong> 58, 321<br />
(2009).<br />
[4] A. Pimenov, A. A. Mukh<strong>in</strong>, V. Y. Ivanov, V. D. Travk<strong>in</strong>, and A. Balbashov,<br />
A. M. Loidl, Nat Phys 2, 92 (2006).<br />
[5] N. Kida, Y. Ikebe, Y. Takahashi, J. P. He, Y. Kaneko, Y. Yamasaki,<br />
R. Shimano, T. Arima, N. Nagaosa, and Y. Tokura, Phys. Rev. B 78,<br />
104414 (2008).<br />
[6] A. B. Sushkov, R. V. Aguilar, S. Park, S.-W. Cheong, and H. D. Drew,<br />
Phys. Rev. Lett. 98, 027202 (2007).<br />
[7] N. Kida, D. Okuyama, S. Ishiwata, Y. Taguchi, R. Shimano, K. Iwasa,<br />
T. Arima, and Y. Tokura, Phys. Rev. B 80, 220406 (2009).<br />
[8] M. Cazayous, Y. Gallais, A. Sacuto, R. de Sousa, D. Lebeugle, and<br />
D. Colson, Phys. Rev. Lett. 101, 037601 (2008).<br />
[9] B. Náfrádi, priv. Com.<br />
[10] A. Zheludev, T. Sato, T. Masuda, K. Uch<strong>in</strong>okura, G. Shirane, and<br />
B. Roessli, Phys. Rev. B 68, 024428 (2003).<br />
[11] T. Sato, T. Masuda, and K. Uch<strong>in</strong>okura, Physica B: Condensed Matter<br />
329-333, 880 (2003).<br />
[12] H. T. Yi, Y. J. Choi, S. Lee, and S.-W. Cheong, Applied <strong>Physics</strong> Letters<br />
92, 212904 (2008).<br />
[13] H. Murakawa, Y. Onose, S. Miyahara, N. Furukawa, and Y. Tokura,<br />
Phys. Rev. Lett. 105, 137202 (2010).<br />
[14] T. Arima, Journal <strong>of</strong> the Physical Society <strong>of</strong> Japan 76, 073702 (2007).<br />
[15] M. Saito, K. Ishikawa, K. Taniguchi, and T. Arima, Phys. Rev. Lett.<br />
101, 117402 (2008).<br />
111
[16] M. Saito, K. Taniguchi, and T. Arima, Journal <strong>of</strong> the Physical Society<br />
<strong>of</strong> Japan 77 (2008).<br />
[17] M. Saito, K. Ishikawa, S. Konno, K. Taniguchi, and T. Arima, Nat<br />
Mater 8, 634 (2009).<br />
[18] S. Miyahara and N. Furukawa, arXiv:1101.3679 (2011).<br />
112
Chapter 7<br />
Summary<br />
The major achievements <strong>of</strong> my Ph.D. work are summarized <strong>in</strong> the follow<strong>in</strong>g<br />
thesis po<strong>in</strong>ts:<br />
1. I have studied the sp<strong>in</strong>-wave excitations <strong>of</strong> the multiferroic oxide<br />
Ba 2 CoGe 2 O 7 over a broad region <strong>of</strong> the temperature-magnetic field<br />
phase diagram by means <strong>of</strong> terahertz time-doma<strong>in</strong> spectroscopy. On<br />
the basis <strong>of</strong> the selection rules determ<strong>in</strong>ed from the polarized absorption<br />
spectra I have concluded, that one <strong>of</strong> the two magnon modes, observed<br />
at sub-terahertz frequencies, can be excited both by the electric and<br />
the magnetic component <strong>of</strong> the light, while the other mode is only sensitive<br />
to the magnetic component <strong>of</strong> the radiation. I have found large<br />
directional dichroism, ∆α/α ∼ 50 %, <strong>in</strong> the former case. I have shown<br />
that the large directional dichroism is the consequence <strong>of</strong> the entanglement<br />
between the electric and the magnetic dipole excitations i.e. the<br />
so-called electromagnon nature. [1]<br />
2. I have <strong>in</strong>vestigated the character <strong>of</strong> the sp<strong>in</strong> excitations <strong>in</strong> Ba 2 CoGe 2 O 7<br />
by measur<strong>in</strong>g the natural <strong>optical</strong> rotation and ellipticity <strong>of</strong> the transmitted<br />
light <strong>in</strong> the terahertz frequency region. I have found that magnetic<br />
fields applied along the [100] or the [010] directions can <strong>in</strong>duce<br />
chirality <strong>in</strong> this material. I have demonstrated that the rotation <strong>of</strong> the<br />
field direction from the [100] to the [010] axis can reverse the chirality<br />
<strong>of</strong> the crystal as expected from symmetry arguments. As a further<br />
consequence <strong>of</strong> the field-<strong>in</strong>duced chiral state <strong>in</strong> this multiferroic material,<br />
I found an exceptionally strong <strong>magneto</strong>chiral effect, as large as<br />
∆α/α ∼ 20 %. [5]<br />
3. I have studied the lower<strong>in</strong>g <strong>of</strong> the symmetry upon the magnetic phase<br />
transitions <strong>in</strong> various ACr 2 O 4 chromium sp<strong>in</strong>el oxides by <strong>in</strong>vestigat<strong>in</strong>g<br />
113
the far-<strong>in</strong>frared reflectivity <strong>of</strong> the <strong>optical</strong> phonon modes. MnCr 2 O 4<br />
and CoCr 2 O 4 rema<strong>in</strong> cubic down to T=10 K with<strong>in</strong> the accuracy <strong>of</strong> the<br />
experiments, while the symmetry <strong>of</strong> FeCr 2 O 4 , NiCr 2 O 4 and CuCr 2 O 4<br />
reduced at least to orthorhombic <strong>in</strong> the magnetically ordered phase. I<br />
have po<strong>in</strong>ted out that the lattice symmetry is lowered <strong>in</strong> the magnetically<br />
ordered phase <strong>of</strong> those compounds <strong>in</strong> which the A-site cations<br />
have orbital degeneracy at high temperatures. [2]<br />
4. I have participated <strong>in</strong> the development <strong>of</strong> a broadband <strong>magneto</strong>-<strong>optical</strong><br />
spectrometer cover<strong>in</strong>g the photon energy range E=0.1-4 eV which allows<br />
the determ<strong>in</strong>ation <strong>of</strong> the <strong>magneto</strong>-<strong>optical</strong> Kerr parameters with<br />
the accuracy <strong>of</strong> θ=±0.005 ◦ . Us<strong>in</strong>g this spectrometer I measured the<br />
<strong>magneto</strong>-<strong>optical</strong> Kerr effect <strong>in</strong> CuCr 2 Se 4 at various temperatures. In<br />
CuCr 2 Se 4 , from the Kerr and the reflectivity spectra I have evaluated<br />
the diagonal and the <strong>of</strong>f-diagonal elements <strong>of</strong> the <strong>optical</strong> conductivity<br />
tensor, which were compared to theoretical band structure calculations.<br />
Based on the agreement between my experimental results and the band<br />
structure calculations, I have proposed that the low-energy excitation,<br />
clearly discerned <strong>in</strong> the <strong>of</strong>f-diagonal conductivity at E≈0.5 eV, corresponds<br />
to a hybridization-<strong>in</strong>duced gap, which is responsible for the<br />
nearly half-metallic band structure and the large <strong>of</strong>f-diagonal conductivity<br />
<strong>of</strong> CuCr 2 Se 4 . [3]<br />
5. In the case <strong>of</strong> the electron and hole doped Nd 2 Mo 2 O 7 compounds, I have<br />
<strong>in</strong>vestigated the orig<strong>in</strong> <strong>of</strong> the anomalous Hall effect by measur<strong>in</strong>g the<br />
<strong>of</strong>f-diagonal conductivity, σ xy , at <strong>optical</strong> frequencies. To reveal the lowenergy<br />
behavior <strong>of</strong> the <strong>magneto</strong>-<strong>optical</strong> spectra <strong>in</strong> doped Nd 2 Mo 2 O 7 ,<br />
I used the same home-designed broadband spectrometer <strong>in</strong>troduced <strong>in</strong><br />
the previous thesis po<strong>in</strong>t. I have found that the magnitude and the<br />
peak position <strong>in</strong> the low-energy part <strong>of</strong> the <strong>of</strong>f-diagonal conductivity<br />
spectra (obta<strong>in</strong>ed from the <strong>magneto</strong>-<strong>optical</strong> spectra) correlate with the<br />
anomalous Hall effect measured <strong>in</strong> the dc limit. I proposed that the<br />
two <strong>effects</strong> have a common orig<strong>in</strong>, namely that a band anticross<strong>in</strong>g<br />
po<strong>in</strong>t determ<strong>in</strong>es the low-energy behavior <strong>of</strong> σ xy (ω). Based on this<br />
assumption, I have reproduced the experimental spectra based on a<br />
two band model <strong>of</strong> a band anticross<strong>in</strong>g po<strong>in</strong>t. [4]<br />
114
Chapter 8<br />
List <strong>of</strong> Publications<br />
8.1 Publications related to the thesis po<strong>in</strong>ts<br />
[1] I. Kézsmárki, N. Kida, H. Murakawa, S. Bordács, Y. Onose, and Y. Tokura<br />
Enhanced Directional Dichroism <strong>of</strong> Terahertz Light <strong>in</strong> Resonance with Magnetic<br />
Excitations <strong>of</strong> the Multiferroic Ba 2 CoGe 2 O 7 Oxide Compound<br />
Physical Review Letters 106, 057403 (2011)<br />
[2] S. Bordács, D. Varjas, I. Kézsmárki, G. Mihály, L. Baldassarre, C. A.<br />
Kuntscher, K. Ohgushi, Y. Tokura<br />
Magnetic-order-<strong>in</strong>duced crystal symmetry lower<strong>in</strong>g <strong>in</strong> ACr 2 O 4 ferrimagnetic<br />
sp<strong>in</strong>els<br />
Physical Review Letters 103, 077205 (2009)<br />
[3] S. Bordács, I. Kézsmárki, K. Ohgushi, and Y. Tokura<br />
Experimental band structure <strong>of</strong> the nearly half-metal CuCr 2 Se 4 : an <strong>optical</strong><br />
and <strong>magneto</strong>-<strong>optical</strong> study<br />
New Journal <strong>of</strong> <strong>Physics</strong> 12, 053039 (2010)<br />
[4] S. Iguchi, S. Kumakura, Y. Onose, S. Bordács, I. Kézsmárki, N. Nagaosa,<br />
and Y. Tokura<br />
Optical Probe for Anomalous Hall Resonance <strong>in</strong> Ferromagnets with Sp<strong>in</strong> Chirality<br />
Physical Review Letters 103, 267206 (2009)<br />
[5] S. Bordács, I. Kézsmárki, N. Kida, H. Murakawa, L. Demkó, Y. Onose,<br />
R. Shimano, S. Miyahara, N. Furukawa, and Y. Tokura<br />
Chirality <strong>of</strong> Matter Shows up via Sp<strong>in</strong> Excitations<br />
115
to be published<br />
8.2 Further publications<br />
[6] I. Kézsmárki, R. Gaál, C. C. Homes, B. Sípos, H. Berger, S. Bordács, G.<br />
Mihály, and L. Forró<br />
High-pressure <strong>in</strong>frared spectroscopy: Tun<strong>in</strong>g <strong>of</strong> the low-energy excitations <strong>in</strong><br />
correlated electron systems<br />
Physical Review B 76, 205114 (2007)<br />
[7] I. Kézsmárki, S. Bordács<br />
An alternative <strong>of</strong> spectroscopic ellipsometry: The double-reference method<br />
Applied Physical Letters 92, 131104 (2008)<br />
[8] G. Mihály, M. Csontos, S. Bordács, I. Kézsmárki, T. Wojtowicz, X. Liu,<br />
B. Jankó, and J. K. Furdyna<br />
Anomalous Hall Effect <strong>in</strong> the (In,Mn)Sb Dilute Magnetic Semiconductor<br />
Physical Review Letters 100, 107201 (2008)<br />
[9] N. Hosaka, H. Yamada, Y. Shimada, J. Fujioka, S. Bordács, I. Kézsmárki,<br />
M. Kawasaki, and Y. Tokura<br />
Magneto-<strong>optical</strong> characterization <strong>of</strong> the ferromagnetic-paramagnetic phase<br />
boundary <strong>in</strong> the composition-spread epitaxial film <strong>of</strong> Sr 1−x Ca x RuO 3<br />
Applied <strong>Physics</strong> Express 1, 113001 (2008)<br />
[10] L. Demkó, I. Kézsmárki, M. Csontos, S. Bordács, and G. Mihály<br />
Improved thermal relaxation method for the simultaneous measurement <strong>of</strong> the<br />
specific heat and thermal conductivity<br />
The European Physical Journal B 74, 27 (2010)<br />
[11] L. Demkó, B. Dóra, T. Vojta, S. Bordács, H. Yamada, M. Kawasaki,<br />
Y. Tokura, and I. Kézsmárki<br />
Disorder promotes ferromagnetism: Round<strong>in</strong>g <strong>of</strong> the quantum phase transition<br />
<strong>in</strong> Sr 1−x Ca x RuO 3<br />
submitted to Nature <strong>Physics</strong><br />
116
Acknowledgements<br />
First <strong>of</strong> all, I would like to express my gratitude to my supervisor, Dr. István<br />
Kezsmárki for acqua<strong>in</strong>t<strong>in</strong>g me with <strong>magneto</strong>-<strong>optical</strong> spectroscopy, and for<br />
help<strong>in</strong>g my scientific work with uncountable discussions and advice. He also<br />
supported my visits to the laboratory <strong>of</strong> Pr<strong>of</strong>. Yosh<strong>in</strong>ori Tokura (<strong>Department</strong><br />
<strong>of</strong> Applied <strong>Physics</strong> at the University <strong>of</strong> Tokyo), which has an outstand<strong>in</strong>g<br />
research potential <strong>in</strong> material sciences and solid state physics. I wish<br />
to express my thanks to Pr<strong>of</strong>. Tokura for <strong>of</strong>fer<strong>in</strong>g me a plethora <strong>of</strong> <strong>in</strong>terest<strong>in</strong>g<br />
and fruitful topics dur<strong>in</strong>g these stays. I am grateful to Pr<strong>of</strong>. György<br />
Mihály for provid<strong>in</strong>g me an <strong>in</strong>spir<strong>in</strong>g environment dur<strong>in</strong>g my Ph.D work. I<br />
also acknowledge Pr<strong>of</strong>. Christ<strong>in</strong>e Kuntscher and Pr<strong>of</strong>. Ryo Shimano for the<br />
opportunity to visit their laboratories. I could not perform my experiments<br />
without the high quality crystals grown by Dr. Kenya Ohgushi, Dr. Hiroshi<br />
Murakawa and Dr. Satoshi Iguchi. I am grateful to Dr. Karlo Penc for the<br />
numerous enlighten<strong>in</strong>g discussions. For the stimulat<strong>in</strong>g atmosphere, I wish<br />
to thank my colleagues, Dr. A. Halbritter, Dr. Sz. Csonka, Dr. M. Csontos,<br />
Dr. L. Demkó, A. Geresdi, P. Makk, A. Butykai, V. Kocsis, Á. Orbán, D.<br />
Szaller and D. Varjas <strong>in</strong> the Solid State <strong>Physics</strong> Laboratory <strong>in</strong> BUTE.<br />
Last but not least, I am very grateful to my parents and my wife, who<br />
supported me dur<strong>in</strong>g the Ph.D. work.<br />
117
Appendix A<br />
Appendix for the chapter<br />
”Magnetic-order-<strong>in</strong>duced<br />
crystal symmetry lower<strong>in</strong>g<br />
resolved by <strong>optical</strong> phonons”<br />
In this Appendix the reflectivity and the <strong>optical</strong> conductivity spectra <strong>of</strong><br />
MnCr 2 O 4 , FeCr 2 O 4 , CoCr 2 O 4 , NiCr 2 O 4 and CuCr 2 O 4 are presented on a<br />
wider photon energy range at various temperatures. Generally, the <strong>optical</strong><br />
phonon modes are present <strong>in</strong> the low-energy part <strong>of</strong> the conductivity spectrum.<br />
At room temperature, the presence <strong>of</strong> four resonances <strong>in</strong>dicate cubic<br />
symmetry. The phonon modes <strong>of</strong> CuCr 2 O 4 are clearly split at room temperature<br />
as well, <strong>in</strong>dicat<strong>in</strong>g the tetragonal symmetry <strong>of</strong> the lattice.<br />
Above ∼25000 cm −1 the O 2p → Cr, A 3d charge transfer excitations<br />
take place. Between the two regions, weak excitations can be found (except<br />
for MnCr 2 O 4 ), whose energy and l<strong>in</strong>e shape show large variation for the<br />
<strong>in</strong>vestigated ACr 2 O 4 sp<strong>in</strong>el oxides. These weak <strong>optical</strong> transitions occur between<br />
the d-orbitals split by the local crystal field <strong>of</strong> the A 2+ ions. Although,<br />
this transition is parity-forbidden <strong>in</strong> the presence <strong>of</strong> <strong>in</strong>version symmetry, the<br />
tetrahedral site symmetry <strong>of</strong> the A 2+ ions makes it weakly allowed.<br />
118
Reflectivity<br />
1.0<br />
0.8<br />
0.6<br />
0.4<br />
300K<br />
250K<br />
200K<br />
150K<br />
100K<br />
80K<br />
70K<br />
60K<br />
50K<br />
40K<br />
30K<br />
20K<br />
10K<br />
0.2<br />
-1 cm<br />
-1 )<br />
Conductivity (<br />
0.0<br />
3500<br />
3000<br />
750<br />
500<br />
250<br />
0<br />
100 1000 10000<br />
Wavenumber (cm -1 )<br />
Figure A.1: Reflectivity and <strong>optical</strong> conductivity spectra <strong>of</strong> MnCr 2 O 4 at various<br />
temperatures. At the low-energy side the <strong>optical</strong> phonon modes cause<br />
sharp resonances, while the O 2p → Cr, Mn 3d charge transfer excitations<br />
are responsible for the large <strong>optical</strong> conductivity above ∼25000 cm −1 .<br />
119
Reflectivity<br />
-1 cm<br />
-1 )<br />
Conductivity (<br />
1.0<br />
0.8<br />
0.6<br />
0.4<br />
0.2<br />
300K<br />
250K<br />
200K<br />
170K<br />
150K<br />
130K<br />
110K<br />
0.0<br />
1500<br />
1250<br />
1000<br />
750<br />
500<br />
250<br />
0<br />
100 1000 10000<br />
Wavenumber (cm -1 )<br />
Figure A.2: Reflectivity and <strong>optical</strong> conductivity spectra <strong>of</strong> FeCr 2 O 4 at various<br />
temperatures. Compared to the <strong>optical</strong> conductivity spectra <strong>of</strong> MnCr 2 O 4 ,<br />
beside the <strong>optical</strong> phonon modes and the O 2p → Cr, Fe 3d charge transfer<br />
transitions, an additional excitation appears around ∼3000 cm −1 . This feature<br />
is due to the transition between the crystal field split d-orbitals <strong>of</strong> the<br />
Fe 2+ . This process is weakly allowed by the lack <strong>of</strong> <strong>in</strong>version symmetry for<br />
the Fe 2+ ions.<br />
90K<br />
70K<br />
50K<br />
30K<br />
20K<br />
10K<br />
120
Reflectivity<br />
-1 cm<br />
-1 )<br />
1.0<br />
0.8<br />
0.6<br />
0.4<br />
0.2<br />
0.0<br />
1000<br />
300 K 70 K<br />
250 K 50 K<br />
200 K 40 K<br />
150 K 30 K<br />
100 K 20 K<br />
90 K 10 K<br />
80 K<br />
Conductivity (<br />
500<br />
0<br />
100 1000 10000<br />
Wavenumber (cm -1 )<br />
Figure A.3: Reflectivity and <strong>optical</strong> conductivity spectra <strong>of</strong> CoCr 2 O 4 at<br />
various temperatures. The spectra can be divided <strong>in</strong>to three parts: below<br />
1000 cm −1 the <strong>optical</strong> phonon excitations are present, at ∼7000 cm −1 and<br />
∼16000 cm −1 the d-d transitions <strong>of</strong> the Co 2+ ions dom<strong>in</strong>ate the spectra, while<br />
the high-energy region is determ<strong>in</strong>ed by the O 2p → Cr, Co 3d charge transfer<br />
transitions.<br />
121
Reflectivity<br />
-1 cm<br />
-1 )<br />
Conductivity (<br />
1.0<br />
0.8<br />
0.6<br />
0.4<br />
0.2<br />
0.0<br />
500<br />
400<br />
300<br />
200<br />
100<br />
0<br />
100 1000 10000<br />
Wavenumber (cm -1 )<br />
350K<br />
335K<br />
320K<br />
300K<br />
250K<br />
200K<br />
150K<br />
100K<br />
Figure A.4: Reflectivity and <strong>optical</strong> conductivity spectra <strong>of</strong> NiCr 2 O 4 at various<br />
temperatures. The <strong>optical</strong> excitations observed <strong>in</strong> the conductivity spectra<br />
are the <strong>optical</strong> phonons, the d-d transitions <strong>of</strong> the Ni 2+ ions around<br />
∼17000 cm −1 and the O 2p → Cr, Ni 3d charge transfer excitations.<br />
80K<br />
70K<br />
60K<br />
50K<br />
40K<br />
30K<br />
20K<br />
10K<br />
122
-1 cm<br />
-1 ) Reflectivity<br />
1.0<br />
0.8<br />
0.6<br />
0.4<br />
0.2<br />
0.0<br />
750<br />
300K<br />
270K<br />
250K<br />
200K<br />
170K<br />
150K<br />
130K<br />
110K<br />
80K<br />
60K<br />
40K<br />
10K<br />
Conductivity (<br />
500<br />
250<br />
0<br />
100 1000 10000<br />
Wavenumber (cm -1 )<br />
Figure A.5: Reflectivity and <strong>optical</strong> conductivity spectra <strong>of</strong> CuCr 2 O 4 at various<br />
temperatures. Already at room temperature more than four <strong>optical</strong><br />
phonon modes can be observed, <strong>in</strong>dicat<strong>in</strong>g that the symmetry is lowered to<br />
tetragonal. The two peaks <strong>of</strong> the d-d excitations are present at ∼4000 cm −1<br />
and ∼8000 cm −1 . The high-energy part <strong>of</strong> the conductivity spectra is dom<strong>in</strong>ated<br />
by the O 2p → Cr, Cu 3d charge transfer excitations.<br />
123